Article

Urban Watercourses in Peril: Implications of Phthalic Acid Esters on Aquatic Ecosystems Caused by Urban Sprawl

1
Department of Civil Engineering, University of Moratuwa, Moratuwa 10400, Sri Lanka
2
Department of Forestry and Environmental Sciences, University of Sri Jayewardenepura, Nugegoda 10250, Sri Lanka
*
Author to whom correspondence should be addressed.
Water 2019, 11(3), 519; https://doi.org/10.3390/w11030519
Submission received: 8 February 2019 / Revised: 5 March 2019 / Accepted: 8 March 2019 / Published: 13 March 2019
(This article belongs to the Section Water Quality and Contamination)

Abstract

:
Urban sprawl worldwide warrants the use of large quantities of industrial and household products containing phthalic acid esters (PAEs) resulting in adverse impacts on the quality of aquatic life in urban watercourses. The presence of six PAEs (dimethyl phthalate (DMP), diethyl phthalate (DEP), di(n-butyl) phthalate (DBP), benzyl butyl phthalate (BBP), bis(2-ethylhexyl) phthalate (DEHP), and di(n-octyl) phthalate (DnOP)) in 22 shallow urban watercourses in Colombo and suburbs of Sri Lanka was investigated. The average concentrations of DEP, DBP, BBP, and DEHP in all watercourses varied between 2.5–265.0, 1.0–32.0, 61–108, and 12–165 µg/L, respectively. DMP and DnOP were below the limits of quantification (DMP-0.5 µg/L, DnOP-1.0 µg/L) for all watercourses. DEHP was the most abundant PAE in many watercourses. The significant factors affecting the ubiquitous presence of PAEs in watercourses are the inherent properties of each PAE, presence of industrial and household products with great potential for the migration of PAEs in the sub-catchments, and quality of the receiving water. The contamination levels of PAEs in most of the watercourses are alarmingly high, as evidenced by higher concentrations of DEHP and DBP than those of Canadian permissible levels for the protection of aquatic life (16 and 19 µg/L). This study was the first effort in Sri Lanka to investigate the presence of PAEs in urban watercourses.

Graphical Abstract

1. Introduction

Phthalic acid esters (PAEs) are reported to be a group of emerging organic contaminants, which are ubiquitously present in aquatic environments worldwide [1]. PAEs are added to plastic and polyvinyl chloride manufacturing industries as a plasticizer to enhance beneficiary attributes of final products such as softness [2], flexibility [3], durability and longevity [4], and workability [5]. Also, PAEs are utilized in the production process of pharmaceuticals, cosmetics, personal-care products [6], insect repellants, household-hardware, including wire coverings [7], cables, tubes, hoses, lubricants, and stationery products (such as inks, paints), toys [8], and pesticides [9]. Annual global production of PAEs, for a multitude of uses in 2013, has been reported to be over five million metric tons [2]. Urban sprawl results in PAEs becoming ubiquitous at varying levels in watercourses of many countries [10]. Among all PAEs, six compounds, namely dimethyl phthalate (DMP), diethyl phthalate (DEP), di(n-butyl) phthalate (DBP), benzyl butyl phthalate (BBP), bis(2-ethylhexyl) phthalate (DEHP), and di(n-octyl) phthalate (DnOP) have been included in the priority pollutant list published in Title 40 of the Code of Federal Regulations Part 423, Appendix A, United States Environmental Protection Agency.
Canadian water quality guidelines specify the levels of DEHP and DBP to be 16 and 19 µg/L, respectively, for the protection of aquatic life [11]. PAEs are not bound to a polymer by covalent bonding resulting in easy detachment, and may subsequently be transported through leaching to the aquatic environment [12]. DEHP and DnOP are weak in biodegradability and hence, subject to bioaccumulation with a likelihood of biomagnification in the aquatic environment [13,14]. Moreover, Sun and co-workers [14] have observed the induced developmental toxicology and dysfunction of developing hearts in Zebrafish embryos by BBP at oral concentrations of 0.6 and 1.2 mg/L. Li and co-workers [15] have reported that for aquatic organisms of Jiulong River in China, DEHP poses a high risk (risk quotient (RQ) > 1) at concentrations exceeding 0.62 µg/L, while DBP warrants a medium risk (0.01 < RQ < 1) with concentrations between 0.03–1.77 µg/L [15].
The principal influencing factors for the retention of PAEs in the water column include pH [16], temperature [17], and salinity [18]. PAEs are hydrolyzed below pH 5 and above pH 7 [16,19] and have high hydrophobicity with increasing salinity resulting in a negative impact on water solubility. Further, the sorption affinity of colloid-laden PAEs declines with increasing concentrations of Na+, K+, Cl, and SO42– of colloids [17]. Other factors of concern, including inherent properties, about the behavior of PAEs in the aquatic environment constitute solubility in water, octanol/water partitioning, air/water partitioning, water/solid partitioning, photodegradation, and biodegradation. Water solubility of PAEs is a measure of a propensity for biodegradation, and it decreases with the increasing carbon number of the alcohol moiety of PAEs [19]. Water solubility of DMP, DEP, DBP, and BBP at 25 °C is 4,000,000, 1,080,000, 11,200, and 2690 µg/L, respectively [20] and for DEHP, DnOP it is 270, 22 µg/L, respectively [21].
The octanol/water partitioning coefficient (Kow) predicts the partitioning behavior of PAEs. PAEs with high hydrophobicity, low solubility, and high molecular weights are persistent in the aquatic phase without partitioning to another liquid phase. Log Kow of DMP, DEP, DBP, BBP, DEHP, and DnOP are reported to be 1.61, 2.38, 4.45, 4.59, 7.50, and 8.06, respectively [19]. Air/water partitioning, which is usually characterized by Henry’s Law constant (H), helps estimate the tendency of PAEs to escape from water to air. The H values of DMP, DEP, DBP, BBP, DEHP, and DnOP are estimated to be 1.22 × 10⁻⁷, 2.66 × 10⁻⁷, 8.83 × 10⁻⁷, 7.61 × 10⁻⁷, 1.71 × 10⁻⁵, and 1.03 × 10⁻⁴ atm-m3/mol, respectively [19]. The higher H values are reported for PAEs with lower solubilities relative to the vapor pressure indicating that they are migrated to air.
The sorption of PAEs to soil/sediments of the watercourses is determined by their water–solid partition coefficient (Koc). The Koc value for DMP is 55 L/kg [22], for DEP, DBP, BBP, and DEHP are 69, 1975, 17,000, and 87,420 L/kg, respectively [23], and for DnOP, 140,800 L/kg [24]. Thus, the partitioning tendency of PAEs increases with the increase in molecular weight where PAEs with high molecular weights show greater affinity for suspended and particulate materials in the water column. Photodegradation of PAEs occurs through absorption of UV irradiance in the range of 290–400 nm with the maximum half-life of PAEs near the surface of the water column being 144 days; thus, the loss of PAEs due to photodegradation in the short-term would be marginal [25]. Biodegradation within the water column by bacterial mediation seems to be another important factor that determines the retention of PAEs in the aquatic phase [19]. DMP, DEP, DBP, BBP, DEHP, and DnOP show different time lapses for complete biodegradation in water at 20–25 °C; for DMP, DEP three days [26], for DBP four days [19], for BBP seven days [26], for DEHP 20 days [19], and for DnOP seven days [27].
In our study, we undertook reporting the presence of PAEs and their levels in urban watercourses of Colombo, Sri Lanka, selecting six PAEs (DMP, DEP, DBP, BBP, DEHP, DnOP) that are ubiquitously present in aquatic environments [14]. Manufacturing industries of polyethylene, paint, plastic, polyvinyl chloride (PVC), polyethylene terephthalate (PET) bottles, children’s toys, packaging industries of pesticides, pharmaceuticals, cosmetics and personal care products, the apparel industry, and distributors of household hardware and stationery products are mainly housed in Colombo and the suburbs of Sri Lanka. PAEs in the aquatic environment may be attributed to haphazard and ad hoc discharges of untreated or partially treated wastewater from the industries mentioned above and indiscriminate dumping of products containing PAEs by households. Furthermore, the introduction of legislation in Sri Lanka in 2017 banning open burning of plastics, and the use of certain types of polythene without establishing environmentally safe disposal techniques, prompted people to engage in the haphazard disposal of used polythene/plastic products in their neighborhood, thus aggravating the ubiquitous presence of PAEs, especially in the aquatic environments. Moreover, the addition of weight percentages of PAEs to plastic products has not yet been regulated in Sri Lanka, and an estimate of PAEs in the aquatic environments has not been figured out. Although there have recently been numerous news reports in the mass-media on PAEs, there has been no comprehensive study undertaken to get an insight into the distribution of PAEs in shallow urban watercourses in Colombo and its suburbs; hence this study. To our knowledge, this is the first study conducted to monitor the concentrations of PAEs in watercourses of Sri Lanka.

2. Materials and Methods

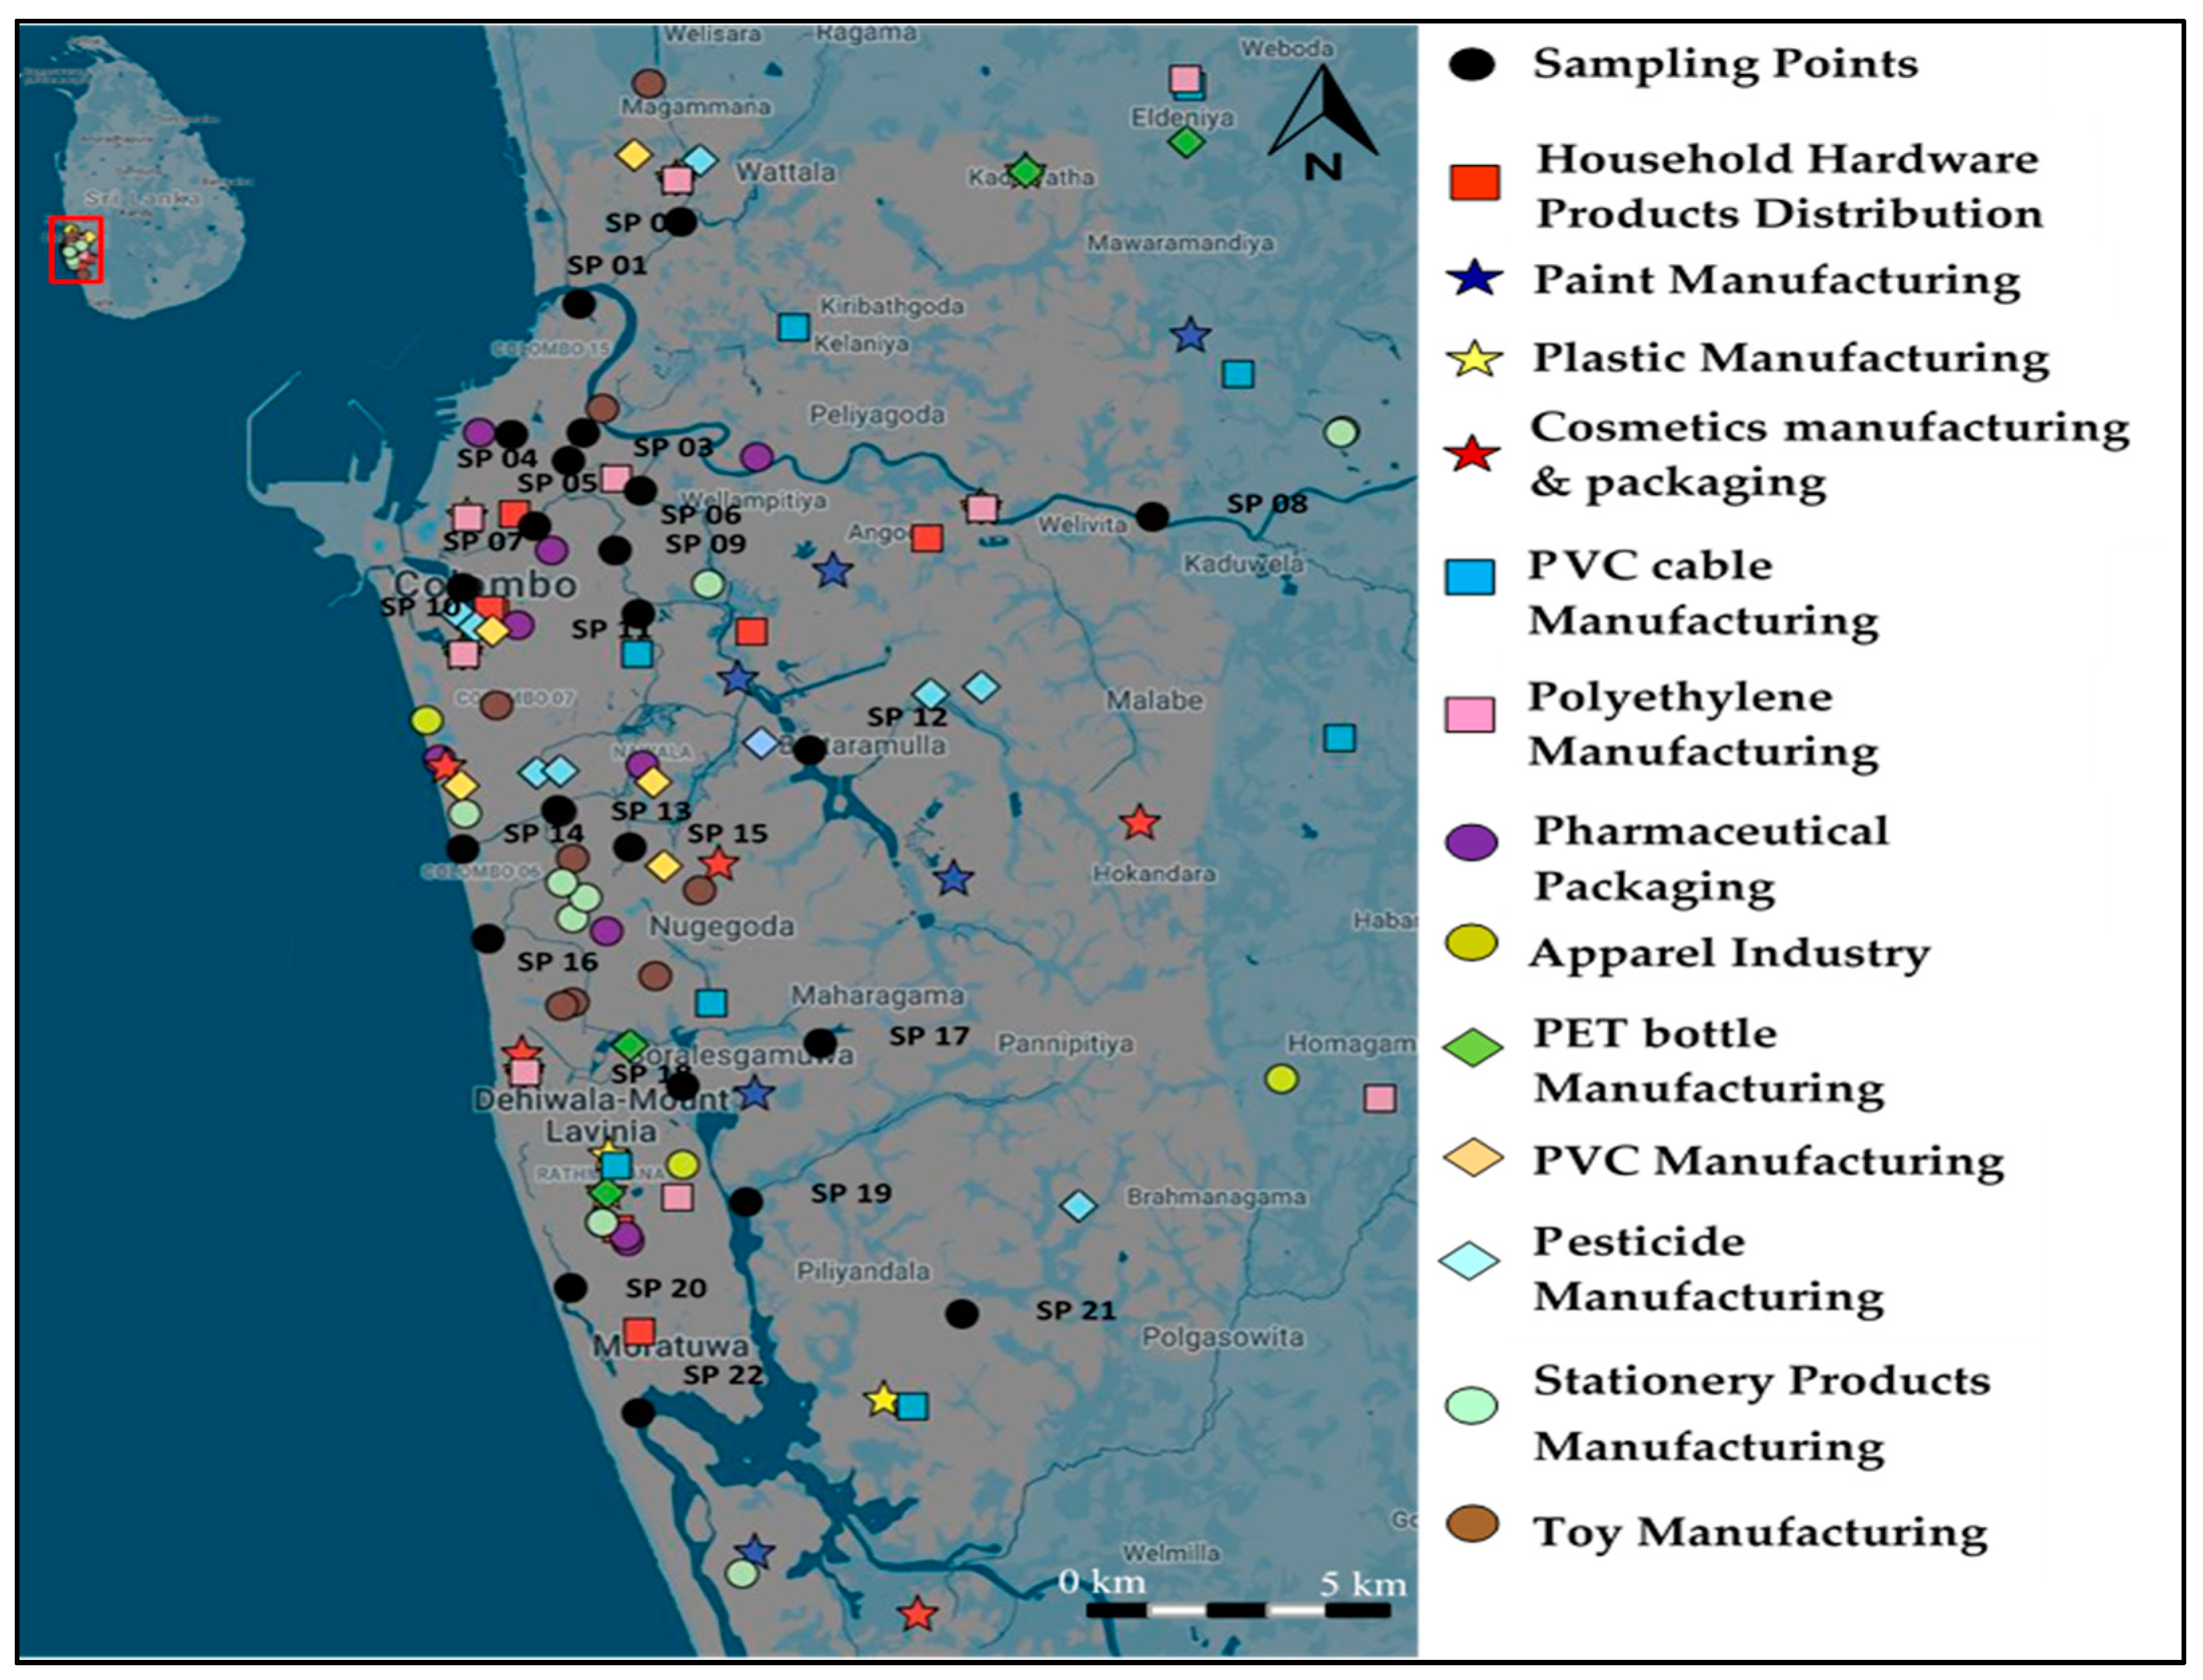
2.1. Study Area and Sampling Locations

The study area consists of part of Colombo and its suburbs, Sri Lanka (Figure 1), which have been developed as a mixed-use development area where both residential and industrial zones co-exist. The study area was chosen because the industrial outputs containing PAEs are clustered in the sub-catchments (Figure 1) and it is also densely populated resulting in increased use of personal care and household products containing PAEs. The study area, therefore, includes urban watercourses that are constantly subjected to indiscriminate dumping of waste and discharge of untreated or partially treated industrial or domestic wastewater that may contain PAEs.
Twenty-two sampling locations (SP 1–SP 22) were selected in different watercourses (Table 1 and Figure 1). Most of these sampling locations were in the lower stretches of the watercourses connected to open sea where the accumulation potential of PAEs was expected to be high. Diurnal and semi-diurnal tidal impacts and spring and neap tides usually slow down the flow of water due to salt wedge development resulting in higher hydraulic retention of PAEs in the selected stretches of watercourses. One sample (SP 1) was selected within a sub-catchment as the control, where no industry having a potential for migration of PAEs was located in close vicinity. The other twenty-one samples (SP 2–SP 22) were selected in different sub-catchments having a multitude of industries with a potential for migration of PAEs. Most of the watercourses that were considered for this study spread in almost flat terrain where water flow was slow or nearly stagnant and were not major rivers where flow rates are high enough to dilute the PAEs.

2.2. Sample Collection

Water samples were collected from slow-flowing or almost stagnant water at each location between 9:00 a.m. to noon at a depth less than 1.0 m in the dry period (November–December 2017) during which the ambient temperature was between 25–32 °C and no precipitation was recorded. At each location, three grab samples were collected by a depth sampler (Model No: 436131, Ruttner, Germany) within three hours to arrest plausible changes due to tidal impact and any other temporal variation. Amber glass bottles (borosilicate, 1 L, pre-heated at 400 °C for four hours) were used to store the grab samples. All samples were transported to the laboratory within two hours and stored below 4 °C until analysis was performed. No plastic containers or accessories were used during in situ sampling, sample pretreatment, extraction, or analysis to ensure no contamination of the samples with PAEs. Glassware was cleaned using chromic acid solution, and rinsed with NaOH solution and deionized water before use.

2.3. In situ Water Quality Measurements

Temperature, pH, and salinity of the water samples were measured in situ by a portable multi-parameter water quality meter (WQC 24, DKK-TOA, Japan). The repeatability of the measurements of pH, temperature, and salinity was ±0.05, 0.25 °C, and ±0.1%, respectively. To avoid hydrolysis of PAEs, the pH of the water samples was adjusted between 5–7 using 1 M H2SO4 or 1 M NaOH [16].

2.4. Gas Chromatography/Mass Spectrometry (GC/MS) Analysis

A standard mixture (2000 µg/mL) of six PAEs (DMP, DEP, DBP, BBP, DEHP, and DnOP) in n-hexane, a surrogate standard (diphenyl phthalate, 99%), and an internal standard (benzyl benzoate in n-hexane, 5000 µg/mL) were purchased from Sigma Aldrich, USA. HPLC-grade solvents (methanol, dichloromethane, n-hexane, and acetone) and anhydrous sodium sulfate (98%) were purchased from Sigma Aldrich, USA. The surrogate standard and the internal standard were diluted to 200 mg/L using methanol and to 500 mg/L using n-hexane, respectively to be used in the analysis. Deionized water (18.2 Ω cm) was prepared using a deionizer (Smart Plus-N, Heal Force, China).
EPA method 8061A was followed for the extraction and quantification of various PAEs in an aqueous matrix. Each sample (1 L volume) was filtered under vacuum to remove colloids using glass fiber filter papers (GF/F, Whatman, 0.7 µm). Glass fiber filters were carefully wrapped in pre-cleaned aluminum foil, and baked at 105 °C for 12 h before use. The filtrate was placed in a 1-L separation funnel in which 50 µL of diluted surrogate standard (200 mg/L) was spiked, and the solution was mixed for five minutes. After that, dichloromethane (100 mL) was added to the mixture containing the sample and surrogate, mixed for another 15 min, and allowed to separate. After 30 min, dichloromethane was separated and passed through a column containing 30 mg of anhydrous sodium sulfate to remove water molecules trapped in dichloromethane. The anhydrous sodium sulfate was baked at 105 °C for 12 h before use. The decanted sample was concentrated in a rotary evaporator (HS-2005 V-N(CE), Hahn Shin, Korea) until the sample reached a volume less than 1 mL and the final volume was adjusted to 1 mL by adding dichloromethane. The 1 mL prepared sample was placed in a GC sampling vial and spiked with 10 µL of the internal standard (500 mg/L) and fed into the GC/MS (Agilent Technologies, California, CA, USA).
A Gas Chromatograph (7890, Agilent Technologies, USA) coupled with a mass selective detector (5977, Agilent Technologies, USA) with a splitless injector was used for the qualitative analysis of PAEs, operating the full scan and quantitative analysis of PAEs with selective ion monitoring (SIM) mode. Calibration curves were prepared for individual PAEs using the standard mixture for quantification of PAEs. A DB-5MS column (30 m × 250 µm id., 0.25 µm film thickness, Agilent Technologies) was used for PAEs separation. The program for the GC oven was initiated at 80 °C, increased to 265 °C at a rate of 30 °C/min, then ramped to 270 °C at a rate of 5 °C/min, and finally kept for 12 min until all the analytes were eluted. The sample injector was set at 300 °C using the splitless mode. The electron impact (EI) ionization energy was 70 eV. The temperatures of the transfer line, ion source, and quadrupole were maintained at 280, 230, and 150 °C, respectively. Ultra-pure helium (99.99%) was used as the carrier gas at a constant flow rate of 1 mL/min, and the sample injection volume was 1.0 µL.
Quantification of DMP, DEP, DBP, BBP, DEHP, and DnOP concentrations in shallow watercourses using GC/MS () was validated, and the key parameters from validation studies, including a limit of detection (LOD), limit of quantification (LOQ), and relative standard deviation (RSD), are shown in Table 2. For every batch, a water sample was field-fortified (field blank) with a known concentration of surrogate standard for their recovery. Besides, for each batch, a water sample from a source whose PAE concentrations were absent was spiked with a known concentration of surrogate standard (procedural blank) and validated for recovery (Table 2). Two known concentrations of the standard mixture were spiked with deionized water to be analyzed together with other batch samples for the verification of extraction efficiencies (Table 2). Calibration curves were prepared for DMP, DEP, and DBP, in the range 0.5–10 µg/L and for BBP, DEHP, and DnOP in the range 1–10 µg/L with the linearity of R2 between 0.995–0.999 and RSD <10%. The precursor ion for DMP was selected as 163 (m/z), and the same for DEP, DBP, BBP, DEHP, and DnOP was selected as 149 (m/z).

2.5. Statistical Analysis

The correlation between DMP, DEP, DBP, DEHP, BBP, and DnOP concentrations and key factors influencing the presence of PAEs in water (pH, temperature, and salinity) was obtained by calculating the coefficients of correlation for all samples using XLSTAT version 2018.2 (statistical software for Excel). The correlation between two variables was considered significant when p < 0.05 and reckoned to be strong, moderate, or weak when the correlation coefficient was >0.7, 0.7–0.5, or 0.5–0.3, respectively. A student t-test was conducted to determine the significant differences between respective means of PAEs and reckoned significant when p < 0.05.

3. Results and Discussion

3.1. Occurrence of PAEs in Watercourses

DEP, DBP, BBP, and DEHP were detected in most of the watercourses, while DMP and DnOP were below the respective LOQs (0.5 µg/L for DMP and 1.0 µg/L for DnOP) for all the watercourses (Table 3). The average concentrations detected for DEP, DBP, BBP, and DEHP were in the range of 2.5–265.0, 1.0–32.0, 61–108, and 12–165 µg/L, respectively and these average values were compared with the same detected in watercourses of different countries (Table 4). DEHP and DBP in most of the watercourses of our study exceeded those of Canadian permissible levels (16 and 19 µg/L) for the protection of aquatic life. DMP, DBP, and DnOP concentrations were of the same order of magnitude as reported in other countries, while DEP, BBP and DEHP concentrations detected were more than one order of magnitude compared with those observed in many other countries (Table 4). The possible factors for a vast variation of PAE concentrations in watercourses (Table 4) include a varying degree of migration potential of PAEs from industries and households, inherent properties of PAEs (volatility, solubility, biodegradability, photodegradability), quality of the receiving water (pH, salinity, temperature), and extent to which such PAEs are being regulated.

3.2. Correlation of PAE Concentrations with Receiving Water Quality

In our study, the minimum water quality parameter values observed were: pH 5.45 (SP 20), temperature 27.5 °C (SP 21), and salinity 0% (SP 8, SP 17 to SP 21), and the maximum values were: pH 8.90 (SP 10), temperature 31.5 °C (SP 15), and salinity 2.4% (SP 16) (Table 1). Multivariate analysis corroborated that DEP, DEHP, DBP, and BBP have weak positive correlations with pH and temperature and a weak negative correlation with salinity where all correlation coefficients were <0.3 and the interactions were not significant (p > 0.05) (Table 5). Contrary to our findings regarding the weak positive relationship of PAEs with temperature, Thomsen et al. [40] have reported that the unimeric solubility of PAEs manifests a negative relationship with the temperature of the water column. However, Xu and co-workers [17] have found that with increasing temperature the partition coefficient of BBP in marine sediments decreases considerably, giving rise to a shift in BBP equilibrium from the solid phase to the aqueous phase [17]. In support of our findings on the correlation of PAE concentrations with salinity of the water column, it was reported that with increasing concentrations of Cl in the water column due to salinity intrusion, the solubility of PAEs in water reduces, resulting in increased adsorption of PAEs to colloids in the water and sediment layer [18].

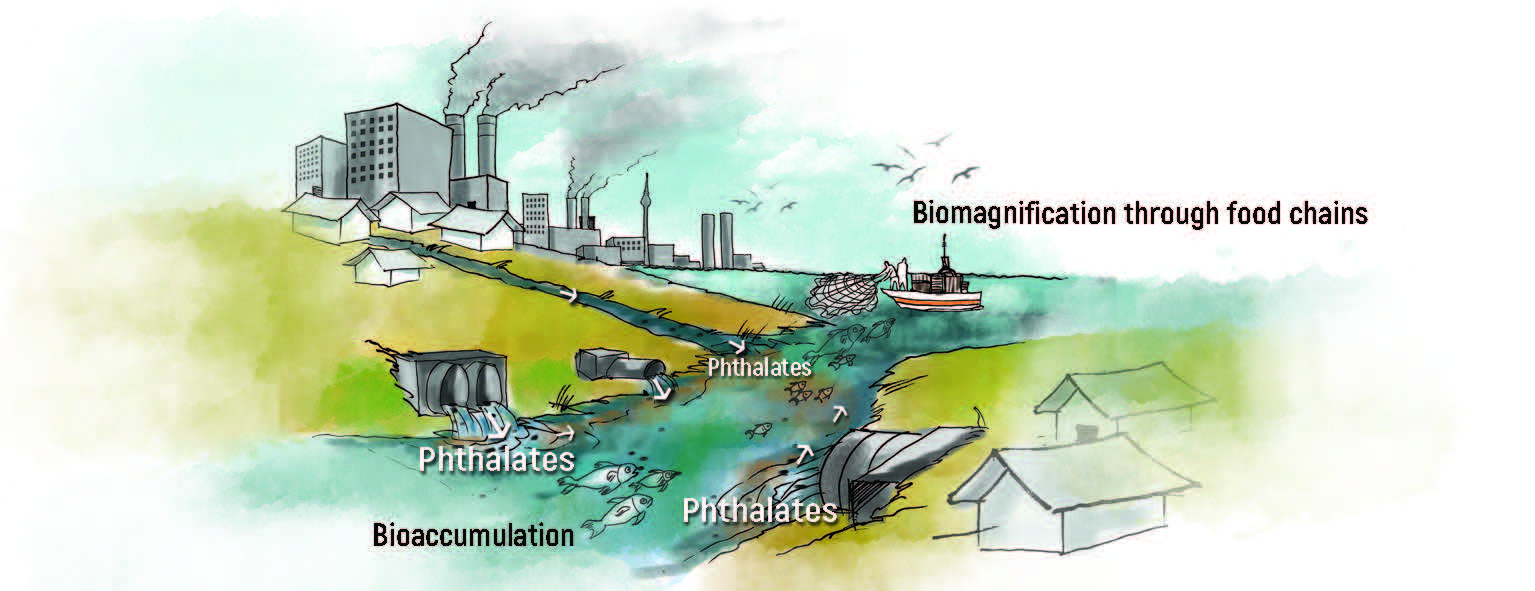
3.3. Behavior of PAEs in the Aquatic Environment

Our results corroborated that concentrations of PAEs detected at all sampling locations were less than the maximum water solubility of the respective PAE; hence there exists a potential for further dissolution. High concentrations of PAEs detected in the watercourses possessed high hydrophobicity and Log Kow values indicating that such PAEs are ubiquitous in the aquatic environment.

3.4. Possible Sources and Implications of PAEs in Watercourses

Figure 1 shows the spatial variation of possible industries that have a potential for migration of PAEs in the sub-catchments of the sampling locations, and Table 6 summarizes the types of industries with their densities located in each sub-catchment of the study area. A maximum of thirteen different types of industries that have a potential for migration of PAEs were identified within each sub-catchment of the study area (Table 6). Table 7 lists individual PAEs present in the industrial products or outputs of respective industries with their typical weight percentages. All the industries that discharge PAEs with their wastewater do not have tertiary treatment for the removal of PAEs. The population of the study area, due to urban sprawl, is greater than 10,000/km2. The sanitation facilities are poor, as many dwelling units depend on septic tanks associated with soakage pit systems. Thus, most of the urban watercourses receive fecally contaminated wastewater, indicating that there is a high possibility of receiving PAEs with domestic fecally contaminated wastewater.
DMP concentrations were <0.5 µg/L (LOQ) in all the watercourses (Table 3). Among 13 different types of industries located in the sub-catchments (Table 6), DMP is added in the manufacturing and packaging of cosmetic and personal care products, pesticides, paints and apparel industries in which the maximum percentages by weight are 1, 2, 10, and 4%, respectively (Table 7). DMP is a low-cost, low odorous, safe, and non-irritable solvent with low molecular weight, which is ubiquitously detected in personal care products such as cosmetics, creams, fragrances, perfumes, candles, and shampoo. The plausible reasons for the detection of DMP in trace levels could be the presence of a few industries contributing to the migration of DMP in sub-catchments, and a shorter lapse time for complete biodegradation.
Concentrations of DEP varied by one order in 13 samples and two orders of magnitude in three samples, compared to the lowest DEP concentration detected (2.5 µg/L at SP 21) (Table 3) while five samples showed levels <0.5 µg/L (LOQ). Among all types of industries in the sub-catchments, DEP is frequently used in manufacturing and packaging industries of pharmaceutical products (2.7% w/w), cosmetics and personal care products (72% w/w), pesticides (2% w/w), and the apparel industry (60% w/w) (Table 7). The mean concentration of DEP of each sample was significantly higher than the corresponding mean concentration of DMP (p < 0.05), possibly due to the contribution from a multitude of industries containing DEP with considerably higher weight percentages (Table 7) and from households. SP 9 with a high concentration of DEP (110.5 µg/L) was reported in the Dematagoda canal, which is slow flowing (average velocity <0.5 m/s) and highly polluted (average BOD = 60 mg/L and COD = 187.2 mg/L) with marginal dilution. For SP 9, three types of industries (Table 6 and Table 7) and high population density are attributable to the high DEP concentration in water. SP 10, which is in Beira Lake, showed the highest average DEP concentration (265.0 µg/L) among all sampling locations. Beira Lake is an almost non-flowing watercourse, where average BOD and COD levels were 20 and 52 mg/L, respectively, and it is connected to another highly polluted shallow watercourse (St. Sebastian canal with average BOD and COD of 60 and 187.2 mg/L, respectively). For SP 10, only two types of industries (Table 6 and Table 7) are attributable to the DEP budget, and the contribution from households seems to be extremely high as this sub-catchment has a very high population density (20,300 per km2). The second highest average DEP concentration (246.0 µg/L) was observed at SP 19 in the Weras river, which is a large shallow watercourse receiving numerous industrial wastewater inflows. Two types of industries (Table 6 and Table 7) within the sub-catchment of the Weras river, and the migration of DEP with raw leachate from the municipal solid waste open dump located just upstream with daily dumping of more than 400 metric tons, contribute to the DEP budget.
DBP concentrations ranged by one order of magnitude compared to the minimum level detected (2.5 µg/L at SP 21) (Table 3) except at three locations whose levels were <0.5 µg/L (LOQ). Among all 13 types of industries in the sub-catchments, DBP is often added in PET bottle manufacturing (56% w/w), stationery product distributors (10% w/w), manufacturing and packaging of pharmaceutical products (2.7% w/w), cosmetic and personal care product packaging (8% w/w), pesticide packaging (1% w/w), paint manufacturing (1% w/w), and the apparel industry (60% w/w) (Table 7). The DBP concentrations of 14 watercourses exceeded the maximum threshold Canadian levels for the protection of aquatic life (19 µg/L), indicating that the aquatic life in such watercourses is in danger. In general, DBP concentrations with one order of magnitude were detected because of high microbial degradation, and low weight percentages added in industrial products. Hashizume and co-authors [34] have reported that the microbes isolated from a river completely degraded DBP.
Five sampling locations (SP 4, SP 9, SP 10, SP 19, and SP 20) showed high concentrations of BBP (61, 72, 75, 69, and 108 µg/L, respectively) and such concentrations varied by one order of magnitude compared to the other 17 samples recorded with BBP concentrations <1 µg/L (LOQ) (Table 3). SP 20 (in the Rathmalana canal) showed the highest BBP concentration (108 µg/L) which was attributed to three types of industries with high weight percentages and a substantial contribution from households from the sub-catchment (population density = 12,000 per km2). The plausible reasons for detection of BBP at trace levels in 17 sampling locations could be the possible degradation of BBP to PAEs with lower weights (e.g., DMP), and a shorter lapse time of BBP for complete biodegradation.
DEHP was ubiquitous in many watercourses compared to other PAEs. The DEHP concentrations varied by one order of magnitude in nine sample locations compared to the minimum concentration recorded (12 µg/L at SP 14) (Table 3). The SP 21 recorded DEHP concentration was <1 µg/L (LOQ). Given the inherent properties, such as high molecular weight, low volatility, low conductivity, long shelf life, and ease of handling, DEHP is the most desired PAE of all PAEs by industrialists. In our study area, DEHP was used in ten types of industries out of 13 with the highest percentages added in the manufacturing industries of plastic (67% w/w), PVC products (67% w/w), PET bottles (43% w/w), toys (40% w/w), household-hardware products (40% w/w), and PVC cables (40% w/w) (Table 7). Thus, the contribution from such industries may have been a significant factor for the occurrence of DEHP in many watercourses. Besides, the abundance of DEHP in watercourses is attributed to its higher molecular weight with less biodegradability compared to other PAEs. DEHP concentrations of 20 watercourses exceeded the maximum threshold Canadian levels for the protection of aquatic life (16 µg/L), indicating that the aquatic life in such watercourses is in peril. SP 2 (in the Peliyagoda canal) and SP 3 (in the main drain) showed high concentrations of DEHP (165 and 105 µg/L), possibly attributable to manufacturing industries using a high percentage of DEHP. SP 7 (in St. Sebastian canal) and SP 17 (in the Maharagama Ela) reported higher concentrations (110, 108 µg/L) attributable mainly to the contributions from households, as there is no major contribution from industries. SP 10 recorded the highest DEHP concentration (137 µg/L), perhaps due to the contributions from manufacturing industries and households (Table 6 and Table 7). The DnOP concentrations detected were <1 µg/L (LOQ) in all samples, possibly due to the small contribution of this compound from the types and numbers of industries present (Table 6 and Table 7), and low solubility in water due to its high molecular weight.

4. Conclusions

The presence of six PAEs (DMP, DEP, DBP, BBP, DEHP, and DnOP) in 22 shallow open watercourses in Colombo and its suburbs, Sri Lanka, was investigated. In all watercourses, DMP and DnOP were less than their LOQs (0.5 µg/L for DMP and 1.0 µg/L for DnOP) because of less contribution from the nearby industries and urban sprawl. The average concentrations detected for DEP, DBP, BBP, and DEHP were in the range of 2.5–265.0, 1.0–32.0, 61–108, and 12–165 µg/L, respectively, because of factors such as their high solubility in water, lower volatility, and greater contribution from industries and urban sprawl. It is apparent that the contamination of PAEs in most of the watercourses is detrimental for the protection of aquatic life, as concentrations of DEHP and DBP were higher than those of Canadian permissible concentrations (16 and 19 µg/L). Nevertheless, a comprehensive analysis needs to be undertaken to study the fate and transport phenomena of PAEs to get an insight into the possible adverse impacts on the environmental matrices.

Author Contributions

Conceptualization, M.J. and G.D.; Methodology, B.G. and K.Z.; Software, J.D.; Validation, B.G. and K.Z.; Formal analysis, M.J. and G.D.; Investigation, M.J. and J.M.; Resources, M.J. and J.M.; Data curation, J.D. and B.G.; Writing—original draft preparation, M.J., G.D. and J.D.; Writing—review and editing, B.G. and J.M.; Visualization, M.J., G.D., and J.D.; Supervision, M.J., N.B., and J.M.; Project administration, N.B. and G.D.; Funding acquisition, N.B.

Funding

This research was funded by the University Research Grant of the University of Sri Jayewardenepura, Sri Lanka (Grant No: ASP/01/RE/SCI/2017/12) and the National Research Council (NRC), Sri Lanka (Grant Nos. 15-056 and 12-086).

Acknowledgments

The authors extend their gratitude to all technical and non-technical staff of the University of Moratuwa and the University of Sri Jayewardenepura, Sri Lanka, for the support given in many ways to complete this study.

Conflicts of Interest

The authors declare no conflict of interest.

References

  1. Paluselli, A.; Fauvelle, V.; Schmidt, N.; Galgani, F.; Net, S.; Sempéré, R. Distribution of phthalates in Marseille Bay (NW Mediterranean Sea). Sci. Total Environ. 2018, 621, 578–587. [Google Scholar] [CrossRef] [PubMed]
  2. Huang, Z.; Wu, P.; Lu, Y.; Wang, X.; Xhu, N.; Dang, Z. Enhancement of photocatalytic degradation of dimethyl phthalate with nano-TiO2 immobilized onto hydrophobic layered double hydroxides: A mechanism study. J. Hazard. Mater. 2013, 246, 70–78. [Google Scholar] [CrossRef] [PubMed]
  3. Jaakkola, J.J.; Knight, T.L. The role of exposure to phthalates from polyvinyl chloride products in the development of asthma and allergies: A systematic review and meta-analysis. Environ. Health Perspect. 2008, 116, 845–853. [Google Scholar] [CrossRef] [PubMed]
  4. Wu, Q.; Liu, M.; Ma, X.; Wang, W.; Wang, C.; Zang, X.; Wang, Z. Extraction of phthalate esters from water and beverages using a graphene-based magnetic nanocomposite prior to their determination by HPLC. Microchim. Acta 2012, 177, 23–30. [Google Scholar] [CrossRef]
  5. Kaneco, S.; Katsumata, H.; Suzuki, T.; Ohta, K. Titanium dioxide mediated photocatalytic degradation of dibutyl phthalate in aqueous solution-kinetics, mineralization and reaction mechanism. Chem. Eng. J. 2006, 125, 59–66. [Google Scholar] [CrossRef]
  6. Wallner, P.; Kundi, M.; Hohenblum, P.; Scharf, S.; Hutter, H. Phthalates Metabolites, Consumer Habits and Health Effects. Int. J. Environ. Res. Public Health 2016, 13, 717. [Google Scholar] [CrossRef]
  7. Ito, Y.; Yamanoshita, O.; Asaeda, N.; Tagawa, Y.; Lee, C.; Aoyama, T.; Ichihara, G.; Furuhashi, K.; Kamijima, M.; Gonzalez, F.J.; et al. Di (2-ethylhexyl) phthalate Induces Hepatic Tumorigenesis through a Peroxisome Proliferator-activated Receptor α-independent Pathway. J. Occup. Health 2007, 49, 172–182. [Google Scholar] [CrossRef] [PubMed]
  8. Wen, Z.; Huang, X.; Gao, D.; Liu, G.; Fang, C.; Shang, Y.; Du, J.; Zhao, Y.; Lv, L.; Song, K. Phthalate esters in surface water of Songhua River watershed associated with land use types, Northeast China. Environ. Sci. Pollut. Res. Int. 2018, 25, 7688–7698. [Google Scholar] [CrossRef] [PubMed]
  9. Roslev, P.; Vorkamp, K.; Aarup, J.; Frederiksen, K.; Nielsen, P.H. Degradation of phthalate esters in an activated sludge wastewater treatment plant. Water Res. 2007, 41, 969–976. [Google Scholar] [CrossRef] [PubMed]
  10. Peijnenburg, W.J.G.M.; Struijs, J. Occurrence of phthalate esters in the environment of the Netherlands. Ecotoxicol. Environ. Saf. 2006, 63, 204–215. [Google Scholar] [CrossRef] [PubMed] [Green Version]
  11. Canadian Council of Ministers of the Environment. Canadian Water Quality Guidelines for the Protection of Aquatic Life; Canadian Council of Ministers of the Environment: Winnipeg, MB, Canada, 1999; p. 146. [Google Scholar]
  12. Mittermeier, A.; Volkel, W.; Fromme, H. Kinetics of the phthalate metabolites mono-2-ethylhexyl phthalate (MEHP) and mono-n-butyl phthalate (MnBP) in male subjects after a single oral dose. Toxicol. Lett. 2016, 252, 22–28. [Google Scholar] [CrossRef] [PubMed]
  13. Chatterjee, S.; Karlovsky, P. Removal of the endocrine disrupter butyl benzyl phthalate from the environment. Appl. Microbiol. Biotechnol. 2010, 87, 61–73. [Google Scholar] [CrossRef] [PubMed] [Green Version]
  14. Sun, G.; Liu, K. Developmental toxicity and cardiac effects of butyl benzyl phthalate in zebrafish embryos. Aquat. Toxicol. 2017, 192, 165–170. [Google Scholar] [CrossRef] [PubMed]
  15. Li, R.; Liang, J.; Gong, Z.; Zhang, N.; Duan, H. Occurance, special distribution, historical trend and ecological risk of phthalate esters in the Jiulong River, Southeast China. Sci. Total Environ. 2016, 580, 388–397. [Google Scholar] [CrossRef] [PubMed]
  16. EPA Method 8061A, Phthalate Esters by Gas Chromatography with Electron Capture Detection (GC/ECD). Available online: https://www.epa.gov/sites/production/files/2015-12/documents/8061a.pdf (accessed on 6 February 2019).
  17. Xu, X.; Li, X. Sorption behavior of benzyl butyl phthalate on marine sediments: Equilibrium assessments, effects of organic carbon content, temperature and salinity. Mar. Chem. 2009, 115, 66–71. [Google Scholar] [CrossRef]
  18. Xu, X.; Li, X. Adsorption behavior of dibutyl phthalate on marine sediments. Mar. Pollut. Bull. 2008, 57, 403–408. [Google Scholar] [CrossRef]
  19. Staples, C.A.; Peterson, D.R.; Parkerton, T.F.; Adams, W.J. The environment fate of phthalate esters: A literature review. Chemosphere 1997, 35, 667–749. [Google Scholar] [CrossRef]
  20. Howard, P.H.; Banerjee, S.; Robillard, K.H. Measurement of water solubilities, octanol/water partition coefficients and vapor pressures of commercial phthalate esters. Environ. Toxicol. Chem. 1985, 4, 653–661. [Google Scholar] [CrossRef]
  21. DeFoe, L.; Holcombe, G.W.; Hammermeister, D.E.; Beisinger, K.E. Solubility and toxicity of eight phthalate esters to four aquatic organisms. Environ. Toxicol. Chem. 1990, 9, 623–636. [Google Scholar] [CrossRef]
  22. Osipoff, R.J.; Hutzler, N.J.; Crittenden, J.C. Interaction of Specific Organic Chemicals Percolating through a Soil. In Proceedings of the 35th Industrial Waste Conference, Lafayette, IN, USA, 13–15 May 1980; Volume 35, pp. 17–23. [Google Scholar]
  23. Russell, D.J.; McDuffie, B. Chemo dynamic Properties of Phthalates: Partitioning and Soil Mimation. Chemosphere 1986, 15, 1003–1021. [Google Scholar] [CrossRef]
  24. USEPA’s Estimation Program Interference Suits 4.1; United States Environment Protection Agency, 2012. Available online: https://www.epa.gov/tsca-screening-tools/epi-suitetm-estimation-program-interface (accessed on 6 February 2019).
  25. Wolfe, N.L.; Bums, L.A.; Steen, W.C. Use of Linear Free Energy Relationships and an Evaluative Model to Assess the Fate and Transport of Phthalate Esters in the Aquatic Environment. Chemosphere 1980, 9, 393–402. [Google Scholar] [CrossRef]
  26. Ritsema, R.; Cofino, W.P.; Frintrop, P.C.M.; Brinkman, U.A. Trace-Level Analysis of Phthalate Esters in surface water and suspended particulate matter by means of capillary gas chromatography with electron capture and mass selective detection. Chemosphere 1989, 18, 2161–2175. [Google Scholar]
  27. Furtmarm, K. Phthalate in der Aquatischen Umvelt; Landesant fur Wasser, und Abfall Nordhein-Westfalen: Dusseldorf, Germany, 1993; 197p and Appendices. [Google Scholar]
  28. Wei, X.; Shi, Y.; Fei, Y.; Chen, J.; Lv, B.; Chen, Y.; Zheng, H.; Shen, J.; Zhu, L. Removal of trace phthalate esters from water by thin-film composite nanofiltration hollow fiber membranes. Chem. Eng. J. 2017, 292, 382–388. [Google Scholar] [CrossRef]
  29. Zhang, R.; Wang, W.; Shi, X.; Yu, X.; Li, M.; Xiao, L.; Cui, Y. Health risk of semi-volatile organic pollutants in Wujin river inflow into Taihu Lake. Ecotoxicology 2011, 20, 1083–1089. [Google Scholar] [CrossRef] [PubMed]
  30. He, H.; Hu, G.; Sun, C.; Chen, S.; Yang, M.; Li, J.; Zhao, Y.; Wang, H. Trace analysis of persistent toxic substances in the main stream of Jiangsu section of the Yangtze River, China. Environ. Sci. Pollut. Res. Int. 2010, 18, 638–648. [Google Scholar] [CrossRef] [PubMed]
  31. Wang, F.; Xia, X.; Sha, Y. Distribution of phthalic acid esters in Wuhan section of the Yangtze River, China. J. Hazard. Mater. 2007, 154, 317–324. [Google Scholar] [CrossRef] [PubMed]
  32. Dargnat, C.; Blanchard, M.; Chevreuil, M.; Teil, M.J. Occurrence of phthalate esters in the Seine River estuary (France). Hydrol. Process. 2009, 23, 1192–1201. [Google Scholar] [CrossRef]
  33. Fromme, H.; Kuchler, T.; Otto, T.; Pilz, K.; Muller, J.; Wenzel, A. Occurrence of phthalates and bisphenol A and F in the environment. Water Res. 2002, 36, 1429–1438. [Google Scholar] [CrossRef]
  34. Hashizume, K.; Nanya, J.; Toda, C.; Yasui, T.; Nagano, H.; Kojima, N. Phthalate esters detected in various water samples and biodegradation of the phthalates by microbes isolated from river water. Biol. Pharm. Bull. 2002, 25, 209–214. [Google Scholar] [CrossRef]
  35. Bastos, P.M.; Haglund, P. The use of comprehensive two-dimensional gas chromatography and structure-activity modeling for screening and preliminary risk assessment of organic contaminants in soil, sediment, and surface water. J. Soils Sediments 2012, 12, 1079–1088. [Google Scholar] [CrossRef]
  36. Olujimi, O.O.; Fatoki, O.S.; Odendaal, J.P.; Daso, A.P. Chemical monitoring and temporal variation in levels of endocrine disrupting chemicals (priority phenols and phthalate esters) from selected wastewater treatment plant and freshwater systems in Republic of South Africa. Microchem. J. 2012, 101, 11–23. [Google Scholar] [CrossRef]
  37. Sánchez-Avila, J.; Fernandez-Sanjuan, M.; Vicente, J.; Lacorte, S. Development of a multi residue method for the determination of organic micro pollutants in water, sediment and mussels using gas chromatography–tandem mass spectrometry. J. Chromatogr. A 2011, 1218, 6799–6811. [Google Scholar] [CrossRef] [PubMed]
  38. Regueiro, J.; Liompart, M.; Garcia-Jares, C.; Garcia-Monteagudo, J.C.; Cela, R. Ultrasound-assisted emulsification–microextraction of emergent contaminants and pesticides in environmental waters. J. Chromatogr. A 2008, 1190, 27–38. [Google Scholar] [CrossRef]
  39. Yuan, S.Y.; Liu, C.; Liao, C.S.; Chang, B.V. Occurrence and microbial degradation of PAEs esters in Taiwan river sediments. Chemosphere 2002, 49, 1295–1299. [Google Scholar] [CrossRef]
  40. Thomsen, M.; Carlsen, L.; Hvidt, S. Solubilities and surface activities of phthalates investigated by surface tension measurements. Environ. Toxicol. Chem. 2001, 20, 127–132. [Google Scholar] [CrossRef] [PubMed] [Green Version]
  41. Earls, A.O.; Axford, I.P.; Braybrook, J.H. Gas chromatography-mass spectrometry determination of the migration of phthalate plasticizers from polyvinyl chloride toys and childcare articles. J. Chromatogr. A 2003, 983, 237–246. [Google Scholar] [CrossRef]
  42. Stringer, R.; Labunska, I.; Santillo, D.; Johnston, P.; Siddorn, J.; Stephenson, A. Concentration of phthalate esters and identification of other additives in PVC children’s toys. Environ. Sci. Pollut. Res. Int. 2000, 7, 27–36. [Google Scholar] [CrossRef] [PubMed]
  43. Bouma, K.; Schakel, D.J. Migration of phthalates from PVC toys into saliva simulant by dynamic extraction. Food Addit. Contam. 2002, 19, 602–610. [Google Scholar] [CrossRef]
  44. Rodgers, K.M.; Rudel, R.A.; Just, A.C. Phthalates in food packaging, consumer products, and indoor environments. In Toxicants in Food Packaging and Household Plastics, Molecular and Integrative Toxicology; Snedeker, S.M., Ed.; Springer: London, UK, 2014; pp. 31–59. [Google Scholar]
  45. Schettler, T. Human exposure to phthalates via consumer products. Int. J. Androl. 2006, 29, 134–139. [Google Scholar] [CrossRef] [PubMed] [Green Version]
  46. Bauer, M.J.; Herrmann, R. Estimation of the environmental contamination by phthalic acid esters leaching from household wastes. Sci. Total Environ. 1997, 208, 49–57. [Google Scholar] [CrossRef]
  47. Bosnir, J.; Puntaric, D.; Galic, A.; Skes, I.; Dijanic, T.; Klaric, M.; Grgic, M.; Curkovic, M.; Smit, Z. Migration of phthalates from plastic containers into soft drinks and mineral water. Food Technol. Biotechnol. 2006, 45, 91–95. [Google Scholar]
  48. Calafat, A.M.; Needham, L.L.; Silva, M.J.; Lambert, G. Exposure to Di-(2-Ethylhexyl) Phthalate Among Premature Neonates in a Neonatal Intensive Care Unit. Pediatrics 2004, 113, 429–434. [Google Scholar] [CrossRef]
  49. Edgren, D.E.; Carpenter, H.A.; Bhatti, G.K.; Ayer, A.D. Encinal Pharmaceutical investments LLC. U.S. Patent US6,217,905, 7 May 1990. [Google Scholar]
  50. Houlihan, J.; Brody, C.; Schwan, B. Not Too Pretty: Phthalates, Beauty Products and the FDA; Environmental Working Group: Washington, DC, USA, 2002. [Google Scholar]
  51. Latini, G.; Knipp, G.; Mantovani, A.; Macrovecchio, M.L.; Chiarelli, F.; Soder, O. Endocrine disruptors and human health. Mini-Rev. Med. Chem. 2010, 10, 1–10. [Google Scholar] [CrossRef]
  52. Koniecki, D.; Wang, R.; Moody, R.P.; Zhu, J. Phthalates in cosmetic and personal care products: Concentrations and possible dermal exposure. Environ. Res. 2011, 111, 329–336. [Google Scholar] [CrossRef] [PubMed]
  53. Yang, T.C.; Peterson, K.E.; Meeker, J.D.; Sanchez, B.N.; Zhang, Z.; Cantoral, A.; Solano, M.; Tellez-Rojo, M.M. Bisphenol A and phthalates in utero and in childhood: Association with child BMI z-score and adiposity. Environ. Res. 2017, 156, 326–333. [Google Scholar] [CrossRef] [PubMed]
  54. Jones, H.A.; Fla, O.; Bushland, R.C. Pyrethrin and Dibenzyl Phthalate Insecticide. U.S. Patent 2,428,494, 7 October 1947. [Google Scholar]
  55. Schripp, T.; Salthammer, T.; Fauck, C.; Beko, G.; Weschler, C.J. Latex paint as a delivery vehicle for diethylphthalate and di-n- butylphthalate: Predictable boundary layer concentrations and emission rates. Sci. Total Environ. 2014, 494–495, 299–305. [Google Scholar] [CrossRef] [PubMed]
  56. Reynolds, P.A. Aqueous Composition for Plasticizing Paint Prior to Strip. U.S. Patent US6,468,952B1, 28 December 1995. [Google Scholar]
  57. Kitchloo, P.V.; Sallavanti, R.A. Infusion of Dye Using Plasticizer. U.S. Patent US6,719,812B1, 11 April 2000. [Google Scholar]
  58. Lippmann, D.C.; Conn, G. Wearing Apparel. U.S. Patent 2,360,953, 24 October 1942. [Google Scholar]
Figure 1. Sampling locations and the industries that have a potential for migration of phthalic acid esters (PAEs) from sub-catchment areas.
Water 11 00519 g001
Table 1. Description of sampling locations and in situ parameters measured.
Sample IDSampling SiteDescription of the Sampling SitepHTemp. 1 (°C)Salinity 2 (%)
SP 1Sri Wickrama canalAbout 5 m wide, velocity <1.0 m/min, brackish, fecally polluted7.45 ± 0.1229.3 ± 0.10.7 ± 0.1
SP 2Peliyagoda canalAbout 4 m wide, velocity <1.0 m/min, brackish, fecally polluted7.50 ± 0.1030.7 ± 0.20.3 ± 0.0
SP 3Main DrainAbout 6 m wide, velocity <1.0 m/min, brackish, fecally polluted7.65 ± 0.1430.0 ± 0.10.9 ± 0.2
SP 4Beira lake-North lock gateAbout 6 m wide, velocity <2.0 m/min, brackish, fecally polluted7.55 ± 0.1228.2 ± 0.20.9 ± 0.3
SP 5St. Sebastian canal (North)About 6 m wide, velocity <1.0 m/min, brackish, fecally polluted7.30 ± 0.1529.7 ± 0.20.4 ± 0.1
SP 6Kittampahuwa canalAbout 4 m wide, velocity <1.0 m/min, brackish, fecally polluted6.90 ± 0.2028.6 ± 0.10.4 ± 0.1
SP 7St. Sebastian canal (South)About 6 m wide, velocity <1.0 m/min, brackish, fecally polluted7.40 ± 0.3130.6 ± 0.20.1 ± 0.0
SP 8Raggahawatta canalAbout 4 m wide, velocity <5.0 m/min, fresh, fecally polluted6.45 ± 0.2030.5 ± 0.10.0 ± 0.0
SP 9Dematagoda canalAbout 6 m wide, velocity <2.0 m/min, brackish, fecally polluted8.60 ± 0.2231.1 ± 0.200.2 ± 0.0
SP 10Beira lake-EastLake, very slow water movements, brackish, fecally polluted8.90 ± 0.1230.7 ± 0.20.7 ± 0.2
SP 11Kimbula canalAbout 2 m wide, velocity <2.0 m/min, brackish, fecally polluted8.10 ± 0.2129.8 ± 0.20.1 ± 0.0
SP 12Diyawanna lakeLake, very slow water movements, fresh, fecally polluted7.45 ± 0.3130.7 ± 0.30.0 ± 0.0
SP 13Kirulapona canalAbout 5 m wide, velocity <2.0 m/min, fresh, fecally polluted7.70 ± 0.2828.5 ± 0.20.1 ± 0.0
SP 14Wellawatta canalAbout 6 m wide, velocity <2.0 m/min, brackish, fecally polluted7.65 ± 0.2630.5 ± 0.10.9 ± 0.3
SP 15Poorwarama canalAbout 6 m wide, velocity <2.0 m/min, brackish, fecally polluted7.30 ± 0.2531.5 ± 0.20.1 ± 0.0
SP 16Dehiwela canalAbout 6 m wide, velocity <3.0 m/min, brackish, fecally polluted8.25 ± 0.2528.4 ± 0.32.4 ± 0.6
SP 17Maharagama ElaAbout 2 m wide, velocity <1.0 m/min, fresh, fecally polluted5.80 ± 0.3227.9 ± 0.30.0 ± 0.0
SP 18Nadimala canalAbout 2 m wide, velocity <1.0 m/min, fresh, fecally polluted6.60 ± 0.4228.7 ± 0.20.0 ± 0.0
SP 19Weras GangaAbout 10 m wide, velocity <2.0 m/min, fresh, fecally polluted7.45 ± 0.3429.5 ± 0.30.0 ± 0.0
SP 20Ratmalana canalAbout 2 m wide, velocity <1.0 m/min, fresh, fecally polluted5.45 ± 0.2130.8 ± 0.40.0 ± 0.0
SP 21Kesbawa lakeLake, very slow water movements, fresh, fecally polluted7.20 ± 0.3027.5 ± 0.20.0 ± 0.0
SP 22Bolgoda lakeLake, very slow water movements, fresh, fecally polluted7.20 ± 0.3030.6 ± 0.30.1 ± 0.0
1 Temp.: Temperature of the water at the time of sampling; 2 Salinity: salinity of the water.
Table 2. Validation parameters of the optimized GC/MS methodology for PAE quantification.
PAELOD
(µg/L)
LOQ
(µg/L)
Recovery Efficiency for External Standards
(RSD %); N = 6
Recovery Efficiency for DPP
(RSD %); N = 6
1 µg/L5 µg/LField BlankProcedural Blank
DMP0.30.598–102 (8%)95–120 (5%)NANA
DEP0.30.598–103 (5%)95–120 (3%)NANA
DBP0.30.598–104 (6%)95–120 (3%)NANA
BBP0.5195–110 (8%)95–120 (5%)NANA
DEHP0.5195–110 (8%)95–120 (4%)NANA
DnOP0.5195–110 (8%)95–120 (5%)NANA
DPP0.30.5NANA95–105 (4%)95–110 (6%)
LOD: Level of detection; LOQ: Level of quantification; RSD: Relative standard deviation; N: Sample size; NA: Not applicable.
Table 3. PAE concentrations in water at sampling locations.
SamplePAE Concentration (µg/L)
DMPDEPDBPBBPDEHPDnOP
SP 1<0.522.0 ± 317.0 ± 1<158 ± 2<1
SP 2<0.537.0 ± 1516.0 ± 5<1165 ± 136<1
SP 3<0.520.5 ± 826.0 ± 11<1105 ± 54<1
SP 4<0.561.0 ± 3927.5 ± 261 ± 482 ± 16<1
SP 5<0.526.0 ± 715.5 ± 3<170 ± 6<1
SP 6<0.5<0.5<0.5<173 ± 1<1
SP 7<0.531.0 ± 1720.0 ± 15<1110 ± 56<1
SP 8<0.5< 0.532.0 ± 11<144 ± 2<1
SP 9<0.5110.5 ± 5120.5 ± 372 ± 3114 ± 23<1
SP 10<0.5265.0 ± 2527.5 ± 475 ± 11137 ± 6<1
SP 11<0.5<0.5<0.5<1102 ± 2<1
SP 12<0.5<0.5<0.5<121 ± 3<1
SP 13<0.527.5 ± 127.0 ± 17<153 ± 3<1
SP 14<0.542.0 ± 724.5 ± 5<112 ± 1<1
SP 15<0.525.0 ± 119.0 ± 3<193 ± 12<1
SP 16<0.548.0 ± 1724.0 ± 3<190 ± 22<1
SP 17<0.525.0 ± 821.0 ± 3<1108 ± 50<1
SP 18<0.5<0.5<0.5<162 ± 2<1
SP 19<0.5246.0 ± 2621.5 ± 669 ± 6101 ± 45<1
SP 20<0.526.0 ± 1327.0 ± 7108 ± 7134 ± 1<1
SP 21<0.52.5 ± 12.5 ± 1<1<1<1
SP 22<0.561.0 ± 1520.5 ± 4<198 ± 20<1
LOQ for DMP: 0.5 µg/L; DEP: 0.5 µg/L; DBP: 0.5 µg/L; BBP: 1 µg/L; DEHP: 1 µg/L; DnOP: 1 µg/L; N = 3.
Table 4. Comparison of average levels of PAEs of watercourses in different countries.
Country PAE Concentration (µg/L)
DMPDEPDBPBBPDEHPDnOPReferences
Sri Lanka 1<0.52.5–265.01.0–32.061–10812–165<1This Study
China 20.065–0.2080.140–0.3340.190–4.762<0.0010.364–2.6820.001–0.621[28]
China 3<0.001<0.0016.8250.215.196NM[29]
China 4<0.0100.098–0.1970.146–0.225<0.0100.582–2.050.010–0.059[30]
China 5<0.001<0.00135.65NM54.730.84[31]
France 6<0.01<0.0150.086<0.0050.090<0.01[32]
Germany 7NMNM0.12–8.80<0.020.33–97.80NM[33]
Japan 8<0.03<0.033.34NM0.97NM[34]
Sweden 90.400.636.80.17NMNM[35]
South Africa 10ND53–8131343–56001–140107–3611–5[36]
Spain 110.003–0.0080.300–1.742NM0.005–0.1220.014–0.180NM[37]
Spain 120.1580.261<0.1250.0290.133NM[38]
Taiwan 13NM0.6–2.51–13.5<0.61–18.5NM[39]
1 Canals and lakes; 2 Songhua river; 3 Wujin river; 4 QX section of Yangtze section; 5 Wuhan section of Yangtze river; 6 Seine river; 7 Rivers, lakes, and canals; 8 Tempaku river; 9 River water; 10 Veldwachters river (downstream); 11 Shallow water bodies; 12 River water; 13 River water; NM, not measured.
Table 5. Multivariate analysis for PAEs with influencing factors.
pHTemperatureSalinity
DEPCorrelation coefficient0.230.39−0.09
p-value0.300.070.67
DBPCorrelation coefficient0.260.03−0.06
p-value0.240.880.76
BBPCorrelation coefficient0.130.14−0.15
p-value0.580.540.50
DEHPCorrelation coefficient0.290.25−012
p-value0.190.260.60
Table 6. Distribution of industries that have a potential for PAE migration in sub-catchments of sampling locations.
SampleType of Industry
12345678910111213
SP 1-------------
SP 21---31--1311-
SP 3-111-1112253-
SP 42211133233541
SP 52211133233541
SP 611---1-22-53-
SP 7-------1-1---
SP 8-1-122-2-112-
SP 911---1211112-
SP 10--3-1-2-112--
SP 1124---1222154-
SP 12---2-22212341
SP 1322---1212-32-
SP 1411----211-41-
SP 152-----112-1--
SP 1643-1221--1-1-
SP 171----------1-
SP 183---22-----11
SP 1911-122---1211
SP 2011-1112--1--1
SP 21- -1-1-1---1-
SP 22-2-1-1-2---2-
Note: The numbers in the table represent the total numbers of the respective type of industries within the sub-catchments of sampling locations. Type 1: Stationery products distributors; Type 2: Toy manufacturing industry; Type 3: Household-hardware manufacturing industry; Type 4: Plastic manufacturing industry; Type 5: PET bottle manufacturing industry; Type 6: PVC cable manufacturing industry; Type 7: Pharmaceutical packaging industry; Type 8: Cosmetic and personal care product packaging industry; Type 9: PVC manufacturing industry; Type 10: Polyethylene manufacturing industry; Type 11: Pesticides packaging industry; Type 12: Paint manufacturing industry; Type 13: Apparel industry.
Table 7. Typical percentages of different PAEs in industrial products.
TypeIndustryPercentages by Weight in Final ProductsReferences
DMPDEPDBPBBPDEHPDnOP
1Stationery products distributors 10 138 14 120 11 [41]
2Toy manufacturing 0.1 230–40 31 22 [42], 3 [43]
3Household-hardware product manufacturing 14 414–40 5 4 [44], 5 [45]
4Plastic manufacturing 67 6 6 [46]
5PET bottle manufacturing 56 7 43 7 7 [47]
6PVC Cable manufacturing 40 8 8 [48]
7Pharmaceutical packaging 2.7 92.7 9 9 [49]
8Cosmetic and personal care product packaging1 1072 108 106 104 10 10 [50]
9PVC manufacturing 40–50 11, 67 12 11 [51], 12 [52]
10Polyethylene manufacturing 20 13 13 [53]
11Pesticide packaging2 142 141 14 14 [54]
12Paint manufacturing4–10 15 1 1510 154–10 16 15 [55], 16 [56]
13Apparel1–4 1710–60 1810–60 18 17 [57], 18 [58]
Note: the subscript numbers 1–18 indicated in PAEs correspond to the same in the last column, which specify the appropriate reference.

