Cover Crops and Landscape Position Effects on Nitrogen Dynamics in Plant-Soil-Water Pools


1
Division of Plant Sciences, University of Missouri, Novelty, MO 63460, USA
2
Department of Forestry, Southern Illinois University, Carbondale, IL 62901, USA
3
Delta Research and Extension Center, Mississippi State University, Stoneville, MS 38776, USA
*
Author to whom correspondence should be addressed.
Water 2019, 11(3), 513; https://doi.org/10.3390/w11030513
Submission received: 23 January 2019
/
Revised: 27 February 2019
/
Accepted: 7 March 2019
/
Published: 12 March 2019
(This article belongs to the Special Issue Nitrogen Removal in Agricultural Watersheds: Through Agricultural Practices and Phytodepuration)
Abstract
:Nitrogen dynamics and water quality benefits deriving from the use of cover crops (CCs) are mostly incurred from plot-scale studies without incorporating large-scale variability that is induced by landscape positions. Our understanding of how topography affects the N response in CC systems is limited. The objectives of this study were to evaluate the effects of topography (shoulder, backslope, and footslope) and CCs (cereal rye, Secale cereale L. and hairy vetch, Vicia villosa L.) on nitrogen (N) uptake, soil inorganic N content (nitrate-N, NO3-N and total N, TN), and N leaching in watersheds that were planted with or without CCs. The crop rotation in CC watersheds was corn (Zea mays L.)-cereal rye-soybean (Glycine max L.)-hairy vetch whereas control watersheds had corn-no CC-soybean-no CC rotation. Data from the watersheds was collected for three cash crop seasons and three CC seasons from 2015 to 2018. Nitrogen uptake of hairy vetch in CC watersheds was 110.9, 85.02, and 44.89 kg ha−1 higher at the shoulder, backslope, and footslope positions, when compared to shoulder, backslope, and footslope positions of no CC watersheds. About 12 to 69% reduction in soil solution NO3-N and TN was observed with cereal rye CC when compared to no CCs watersheds. However, reductions in soil solution N concentrations were only seen at the footslope position where the hairy vetch reduced NO3-N and TN concentrations by 7.71 and 8.14 mg L−1 in CC watersheds compared to no CC watersheds. During the corn and soybean growing seasons, similar reductions in soil solution N concentration were only seen at the footslope position in the CC watersheds. The excessive N at footslope positions of CC watersheds may have been fixed in CC biomass, immobilized, or lost through denitrification stimulated by higher water availability at the footslope position. The results of this research can help farmers and stakeholders to make decisions that are site-specific and topographically driven for the management of CCs in row-cropped systems.
Keywords:
cereal rye; corn; maize; hairy vetch; nitrate leaching; soybean; topography; water quality; watersheds1. Introduction
Residual soil N after the harvest of cash crops can potentially be leached during the winter fallow period following precipitation events. Cover crops have been widely studied due to their feasibility as an in-field best management practice (BMP) to manage N loss [1,2,3,4,5]. Cover crops can reduce N leaching by scavenging soil N and immobilizing it in aboveground biomass. The multifunctional benefits of CCs include the reduction in soil compaction; improving soil structural and hydraulic properties; moderating soil temperature; improving soil microbial properties; recycling nutrients; suppressing weeds; and, their potential to control nitrate loss through runoff and leaching to the groundwater have made CCs a widely promoted BMP in the Midwestern United States [6,7,8].
A reduction in nutrient leaching using CCs as a BMP can be achieved by the selection of CCs that are easy to establish and can overwinter. Multiple CC studies have collected soil solution using lysimeters and reported a reduction in nitrate leaching with the use of CCs [9,10]. In Michigan, a cereal rye CC reduced NO3-N leaching 27 to 67% compared to no CC treatments [10]. Tension cup lysimeters were used to compare NO3-N leaching in CC and no CC treatments in California, and it was reported that cereal rye reduced NO3-N leaching by 62% [9]. Brandi-Dohrn, et al. [11] used passive wick lysimeters to study NO3-N leaching in a corn-broccoli (Brassica oleracea L. var. botrytis) rotation with or without cereal rye CC. The authors reported a 33 to 61% reduction in NO3-N leaching in a three-year study period with a cereal rye CC as compared to no CC. In another study, Meisinger and Ricigliano [8] used drainage lysimeters for studying the effect of CCs on NO3-N leaching, and their results indicated that NO3-N leaching was affected more by the amount of the precipitation that was received during the establishment season than by the CC species. They found a 45% greater reduction in nitrate leaching with use of a non-legume CC during years with less than average precipitation (dry years) when compared to wet years. All of the above studies were either plot or small-scale field studies, without having variability that is induced by topographic positions, thereby limiting their ability to address how CCs help in the reduction of NO3-N from soil solution at the large/watershed scale.
The N scavenging by CCs depends on the type of CCs used in the cropping sequence. Cereal rye has been extensively studied in its growth and biomass accumulation [12], N scavenging from soil [3], decomposition after termination [13], and its impacts on cash crop yields [14]. However, a legume CC, like hairy vetch, has been studied less extensively for its feasibility as a potential soil residual N scavenging CC [3,5]. Legume CCs can also take up residual N from soils and subsequently reduce NO3-N leaching [15,16,17]. However, the potential of a legume CC in the reduction of NO3-N leaching is highly variable and it can be lower when compared to non-legume CCs [17]. McCracken, Smith, Grove, Blevins, and MacKown [17] reported a 94% reduction in nitrate leaching under cereal rye CC when compared to a 48% reduction under hairy vetch CC. They concluded that cereal rye resumed growth earlier in the spring, resulting in greater root density than hairy vetch, thereby resulting in greater nitrate reduction. Jones [16] and Chapman, Liebig, and Rayner [15] also reported a 6 to 30% reduction in NO3-N leaching using hairy vetch CC when compared to no CC in different crop production systems.
The results of residual N scavenging and NO3-N leaching reduction by CCs have been primarily reported from plot scale studies. Extrapolating plot scale results to larger scales, such as field or watershed, should be done with caution with support from additional research. At the field or watershed scale, topography plays an important role in adding spatial variability to biomass production [18], crop yields [19,20], and carbon accrual [21,22]. Therefore, it is important to understand the combined influences of CCs and topography on N cycling in crop production systems that are planted with CCs. The interaction of CCs and topography has been previously studied for biomass accrual [23], cash crop yield [18], soil NO3-N levels [24], soil carbon [21,25], and carbon dioxide and nitrous oxide fluxes [26,27]. Ladoni, Kravchenko, and Robertson [24] reported that red clover (Trifolium pretense L.) a legume CC increased the NO3-N concentration of the soil by 35% on the depression, 20% on the slope, and 32% on the summit, whereas cereal rye reduced NO3-N in soil by 15% on the depression topographic positions and no reduction was observed at the slope and summit topographic positions.
During our literature review, we were not able to find any studies that measured NO3-N leaching loss with CCs that were planted at different topographic positions at the watershed scale. Part of the reason could be the difficulties associated with experimental design across diverse terrains and the cost of adding replicates at a larger scale. Therefore, the overall objective of this study was to understand the performance of CCs at different topographic positions for N cycling in the plant, soil, and water pools. Specific study objectives were to evaluate the: effects of topography (shoulder, backslope, and footslope) on N uptake by CCs and cash crops in watersheds planted with CCs or without CCs, influence of CC as compared to no CC on the soil N levels at different topographic positions, and influence of a CC compared to no CC and topography on N concentrations (NO3-N and TN) using tension cup lysimeters during CC as well as the cash crop seasons.
2. Materials and Methods
2.1. Site Description, Topographic Positions, and Experimental Design
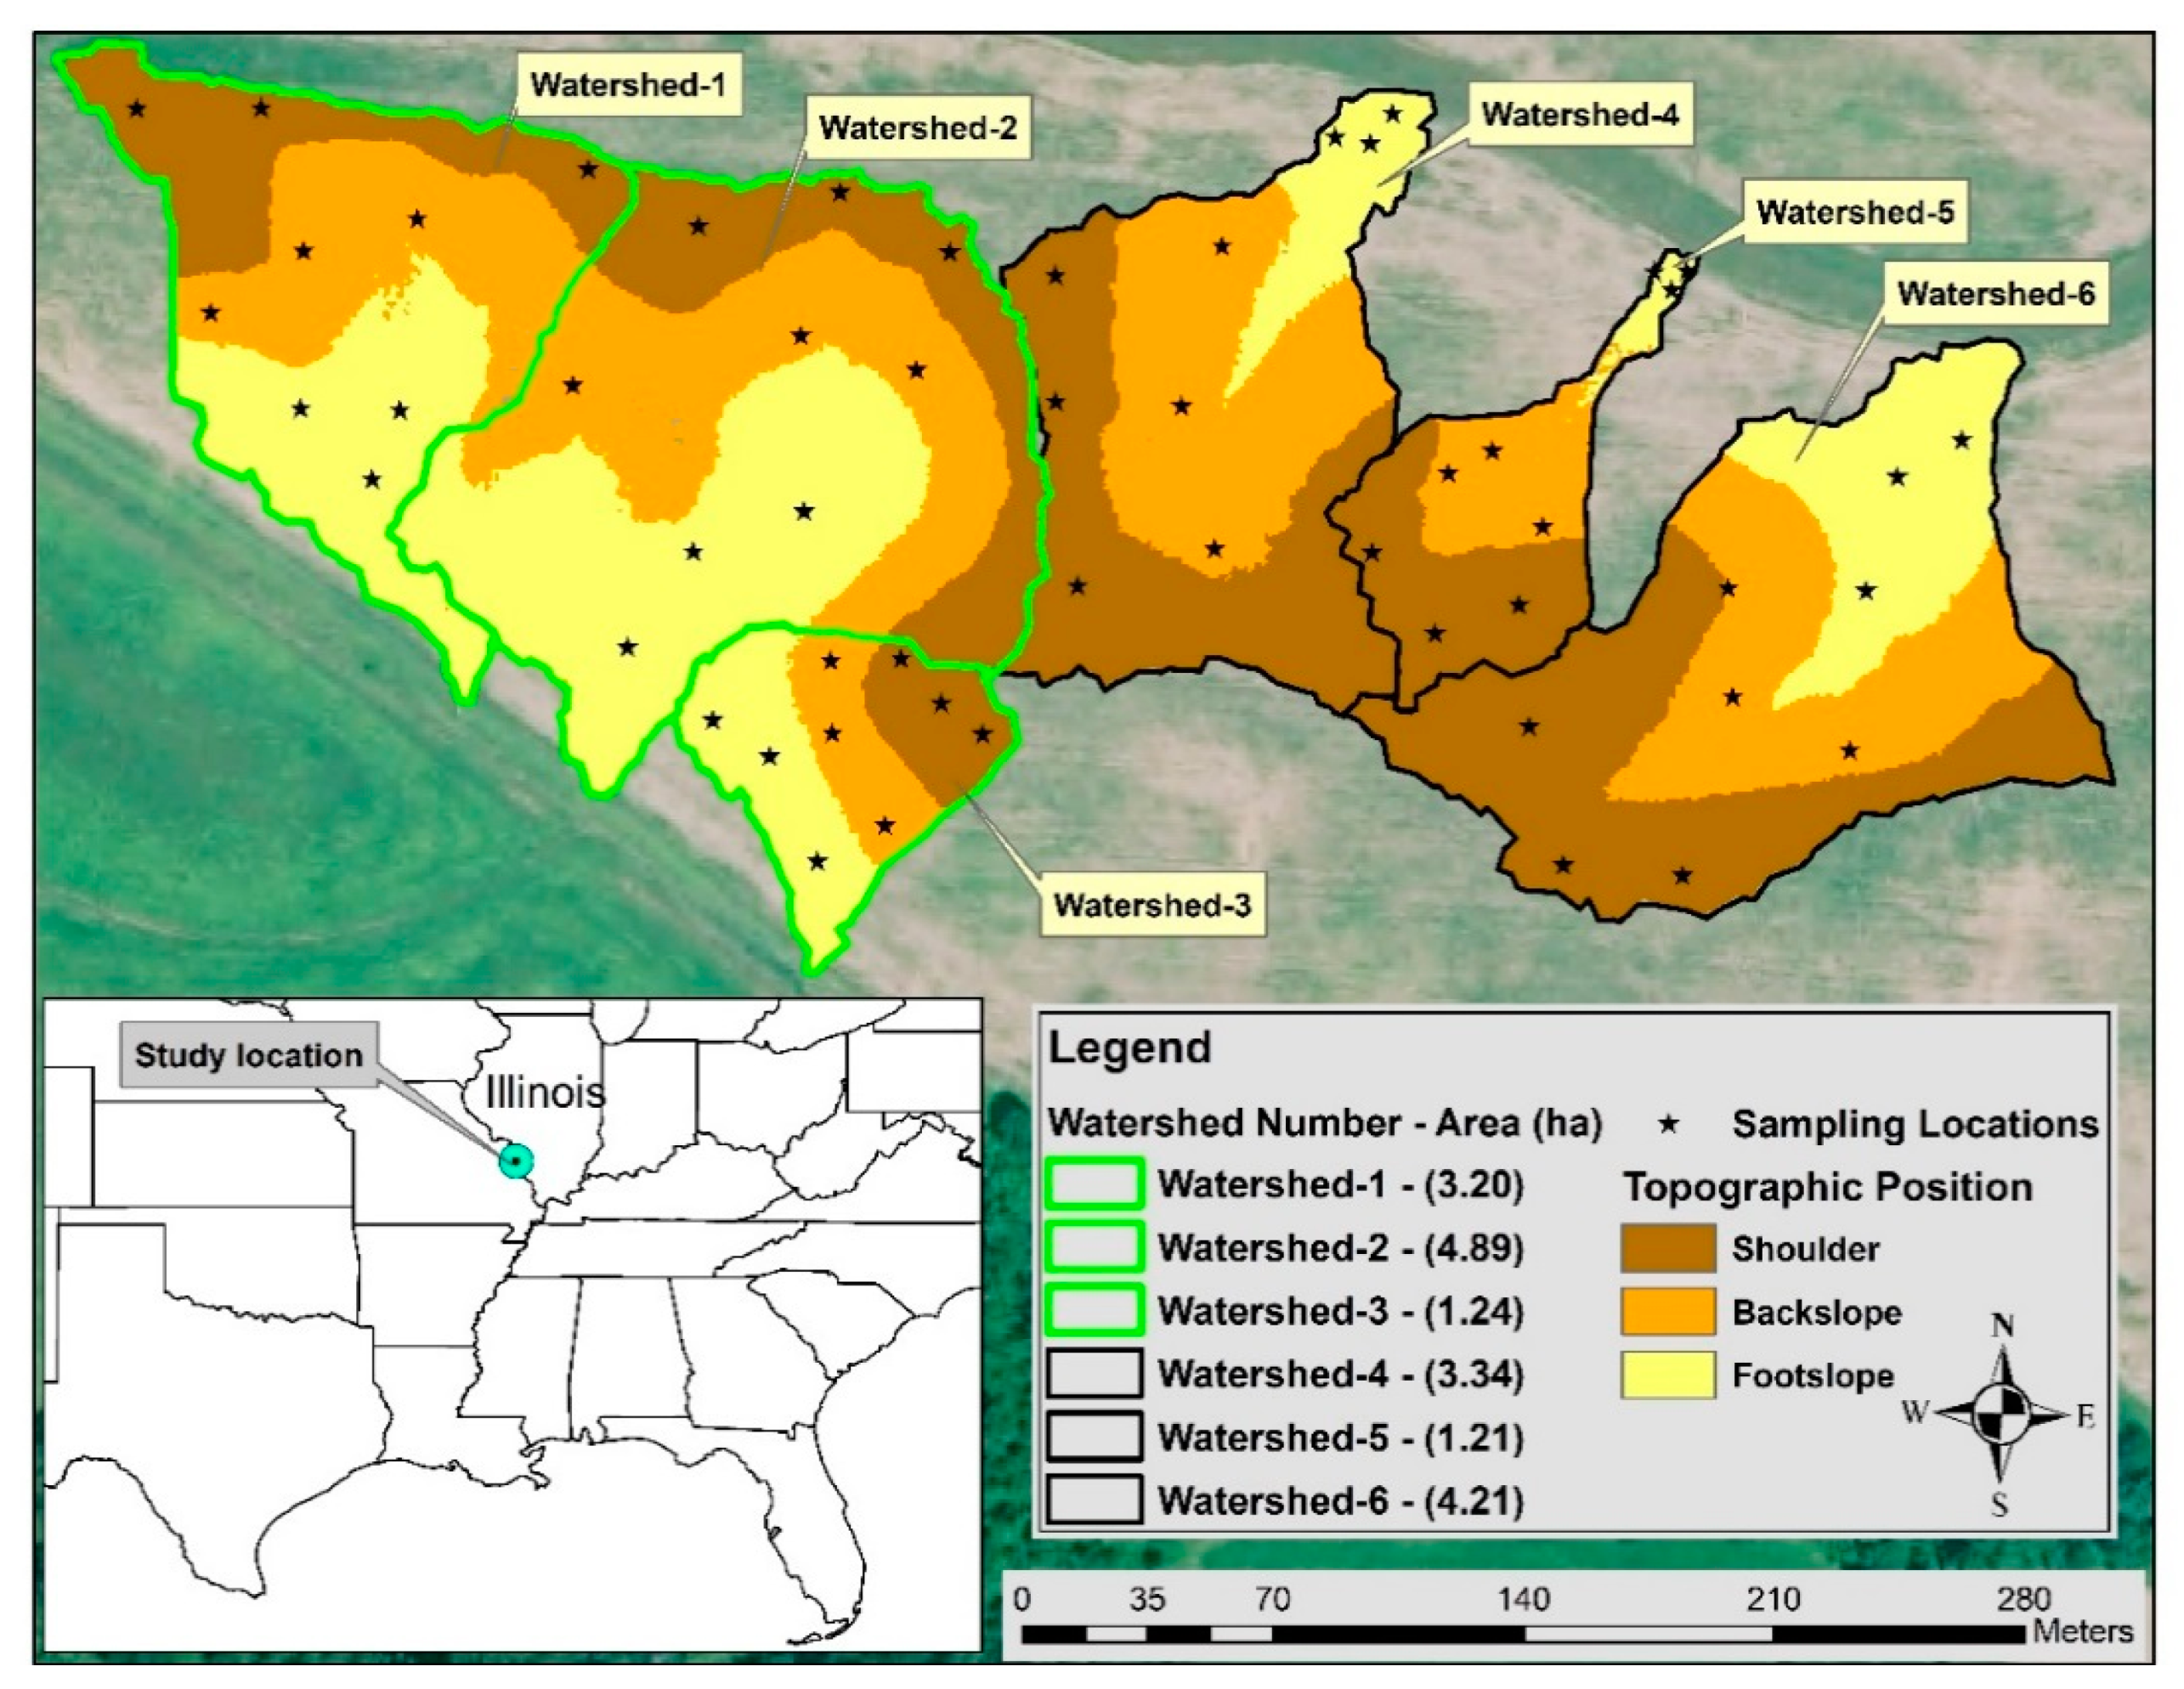
The CC by topography study was established in 2015 on six non-tile drained watersheds at the Southern Illinois University (SIU) Research Farm (37°42′34″ N, −89°16′08″ W). Hosmer silt loam soil series (Fine-silty, mixed, active, mesic Oxyaquic Fragiudalfs) dominated the landscape of the watersheds at shoulder and backslope topographic positions and Bonnie silt loam (Fine-silty, mixed, active, acid, mesic Typic Fluvaquents) was at the footslope topographic position (Figure 1). Moderately well-drained soils formed from loess deposits characterized the Hosmer soil series, with slope varying between 2–10%, and classified into a very high to high runoff class with depth to the restricting soil layer (Fragipan), ranging between 60 to 90 cm [28]. Conversely, the Bonnie soil series was classified as a poorly to very poorly drained, with slope varying between 0–2%, and they were formed from silty alluvium of floodplains. Hosmer soils had an argillic Bt horizon that extends from a depth of 33 cm and below having average clay content greater than 30% [29]. The 20-year average annual rainfall was 1067 mm and the research site was classified into hot summer humid continental climate, according to Köppen-Geiger climate classification.
Twelve watersheds under corn-soybean production were delineated in ArcMap (Version 10.4.1, ESRI Redlands, CA, USA) using a hydrology toolbox. Out of twelve, six watersheds were selected based on the area of the watersheds for a CC x topography study. Three watersheds highlighted in green were planted with CCs and three in black outline were the control (no CC) watersheds (Figure 1). Topographic positions of the six watersheds were delineated using a digital elevation model having a raster resolution of 1.219 by 1.219 m that was obtained from the Illinois geospatial clearing house [30]. A topographic position index (TPI) tool created by Jenness [31] and modified by Evans, et al. [32] was set to a TPI of 125 m and convergence index of 20 m to delineate shoulder, backslope, and footslope topographic positions in ArcMap (Version 10.4.1). Details of classifying topographic positions and the baseline soil properties that were collected in spring 2015 from the six watersheds are provided in Singh, et al. [33]. At each topographic position, three sampling locations were randomly selected for collecting plant biomass, soil and soil solution samples. In total, there were 54 sampling locations in six watersheds (six watersheds × three topographic positions per watershed × three sampling locations per topographic position).
2.2. Lysimeter Installation and Justification
Tension cup lysimeters were used for soil solution sampling. Soil Moisture Equipment Corp. (Santa Barbara, CA, USA) supplied the Lysimeter model 1920F1. Lysimeters had a 4.8 cm outside diameter polyvinyl chloride pipe that was attached to a standard 2 bar porous ceramic cup on one end. The other end of the lysimeter was sealed and it had two tubes. One extended to the ceramic cup and was used for sampling soil solution and the other was attached to the sealed end for setting −65 kPa pressure in the lysimeters.
Lysimeters were installed according to the procedure that was outlined by the model manual and Venterea, et al. [34]. Singh, et al. [35] provided a picture of the installation process. The installation depth of lysimeters was 46 cm in the argillic horizon at shoulder and backslope positions, and in the gleying mineral horizon at the footslope position. The 46-cm depth of lysimeter installation was selected, because the Hosmer soil series had a fragipan that ranged between 60 to 90 cm from the soil surface that can restrict the root growth and water movement. Lysimeters were installed in April 2015 by excavating a hole in the soil using a soil auger and backfilling with the same soil from the hole. After installation, lysimeters were flushed for two months to stabilize the concentration of leachates that may have been affected by soil disturbance during installation. The lysimeters were sampled for soil solution concentrations starting in June 2015 until the conclusion of the study in May 2018. In total, the soil solution was collected for 70 sampling events during the study period of three years.
Since this study was replicated for the topographic positions at the watershed scale, the tension cup lysimeters proved to be more practical to use and maintain. It is important to note that results of all leachates from the tension cup lysimeters are reported in concentration units, not in loads. It has been reported in lysimeter comparison studies that it is not accurate to report loads from tension cup lysimeters [36,37]. The ceramic cup of the lysimeter only captures micropore water that is potentially available for plant uptake, not gravitational drainage water in the soil [35,36,37].
2.3. Crop Management Practices
Watersheds were under no-tillage since 2006, with a two-year corn-soybean rotation until 2015. Starting in 2015, watersheds with CCs followed a corn-cereal rye-soybean-hairy vetch (legume) rotation, whereas no CC watersheds had corn-no CC-soybean-no CC rotation. Cereal rye CC was planted after harvesting corn, because a non-legume CC like cereal rye can scavenge residual N from soil better than a legume CC. Hairy vetch fixes atmospheric N and was planted after harvesting soybean to provide a N benefit to corn. Table 1 provides the dates for field operations and data collection. A pre-plant fertilizer application to corn averaged around 222 kg N ha−1 as anhydrous ammonia, 34 kg P ha−1 as diammonium phosphate, and 56 kg K ha−1 as muriate of potash (KCl). Additionally, on average soybean received 160 kg K ha−1 as KCl in spring before planting. Cereal rye CC was drilled at 88 kg ha−1 after corn harvest in fall 2015 and 2017 (Figure 1). Hairy vetch was planted after soybean harvest in 2016 at 28 kg ha−1 and then terminated in May (Table 1). Corn and soybean were planted with a 76.2-cm row spacing. Soybean cultivar Asgrow AG3334 and corn hybrid DKC58-06RIB were planted in the watersheds.
2.4. Data Collection and Analysis
Aboveground CC biomass in the CC-treatment watersheds and winter annual weed biomass in the no CC treatment watersheds were collected at each sampling location using a 0.4-m2 polyvinyl chloride quadrat before termination of the CC (Table 1). Additionally, corn biomass in fall 2015 and 2017 and soybean biomass in fall 2016 were also collected at physiological maturity at each sampling location. All of the aboveground CC and cash crop biomass were dried at 60 °C until constant weight. Dry weights were recorded and scaled to kg per hectare basis. Dried samples were ground and then analyzed for TN on Carbon-Nitrogen (CN) soil-plant analyzer (Flash 2000, organic elemental analyzer, Thermo Fisher Scientific, Waltham, MA, USA). Percent N from the CN analyzer was multiplied by the biomass to determine the N uptake by the CCs and cash crops.
Soil samples were collected from all 54 locations twice a year following CC termination and after cash crop harvest. Soil samples were extracted using a push probe (JMC soil core sampler, Newton, Iowa, USA) at two depths (0–15 and 15–30 cm). A total of seven soil cores were collected at each location and then were composited for the two depth increments. Soil samples were air dried and grounded (Gilson company Inc., Ohio, USA) to pass through a 2-mm sieve. The KCl extraction method [38] by Brookside Laboratories (New Bremen, Ohio, USA) was used to analyze samples for available N as NO3-N and ammonium-N (NH4-N). Soil bulk density samples were collected using a hydraulic-powered soil probe truck having a soil probe diameter of 5 cm. The collected soil cores were separated into two depths (0–15 and 15–30 cm). The soil bulk density samples were oven-dried at 105 °C until a constant soil weight was achieved. Bulk density was used for converting available N concentrations from mg kg−1 to kg ha−1 by multiplying the concentration by the bulk density and soil depth.
Soil solution samples from tension cup lysimeters were collected following significant storm events (i.e., >12 mm of precipitation). The soil solution samples were transferred to the Southern Illinois University water quality lab and were fine-filtered through 0.45 µm filters using vacuum filtration. After filtration, soil solution samples were divided into two sub-samples (acidified with concentrated hydrochloric acid and non-acidified) and refrigerated below 4 °C until further analysis. The non-acidified soil solution samples were analyzed within a week for NO3-N on an ion chromatograph (2000isp, Dionex, Thermo Fisher Scientific, Waltham, MA, USA), whereas an acidified sub-sample was analyzed within a month for TN using a Shimadzu TOC-L analyzer (Shimadzu Corporation, Kyoto, Japan). All of the results for soil solution samples were reported in concentration (mg L−1).
2.5. Statistical Methods
All statistical analysis was conducted with SAS Statistical software v9.4 (SAS Institute, Cary, NC, USA). Prior to analyses, all of the variables were tested for normality using the Univariate procedure in SAS. Shapiro-Wilk and Kolmogorov-Smirnov tests were used for determining normality of data. Based on normality tests, the N uptake data of CC biomass for spring and corn biomass for fall 2017 were log transformed. Similarly, soil NO3-N data for all seasons were log transformed. Soil solution data (NO3-N and TN) collected from lysimeters were also log transformed for all of the seasons. All log-transformed data were back-transformed to the original scale for reporting in tables and figures.
Initially, soil NO3-N and NH4-N data were analyzed for three fixed factors (CC treatment, topography, and depth) and their interactions using the Glimmix procedure. The three-way interaction between CC treatment, topography, and depth was not significant, therefore two depths (0–15 and 15–30 cm) were summed (additive over the two depths) for the analysis. After summing up the depths, the soil NO3-N and NH4-N data was finally analyzed by season using the Glimmix procedure, including CC treatments, topography, and their interaction as fixed factors. Nitrogen uptake by crops was also analyzed by season using the Glimmix procedure. The CC treatments, topography, and their interactions were treated as the fixed factors. Watersheds and sample locations were treated as random factors in the above models. Additionally, a repeated measures statement was added in the models to account for spatial variability that is caused by the location (latitude and longitude) of the sample with covariance structure of type = SP(EXP(c-list)). For a comparison of means, all of the variables were analyzed using Tukey–Kramer grouping and least squares means were calculated at alpha = 0.05. The probability values that were associated with the results are presented in Table 2 and Table 3 for the N uptake by crops and soil available N (NO3-N and NH4-N) collected six times over the study period.
Soil solution data (NO3-N and TN) that were collected using tension cup lysimeters were also analyzed using the mixed model Glimmix procedure. Due to the spatial and temporal variability in the field and in the precipitation received by the treatments, there were missing values in the final data set. However, missing data is common in studies that involve the monitoring of soil solution using lysimeters and the Glimmix procedure in SAS can process missing data. Due to the two-year cropping rotation of the watersheds, the crops in the field changed with every season. Therefore, soil solution data were split by season. For example, 16 soil solution collection events that were collected between fall 2015 and spring 2016 were analyzed together using a repeated measure model (Figure 1). For the model statement, NO3-N and TN collected in the soil solution during a season were the dependent variables. The independent variables were CC treatments, topography, and their interaction, which were treated as fixed factors and replications treated as a random factor. Additionally, a repeated measures analysis statement for the soil solution collection events was added, having an exponential spatial or temporal covariance structure type = SP(EXP(c-list)) selected based on the lowest Akaike’s Information Criteria (AIC) [39]. Tukey–Kramer grouping was used for a comparison of means at alpha = 0.05. Probability values that are associated with NO3-N and TN are reported in Table 4.
3. Results and Discussion
3.1. Environmental Conditions During Study Period
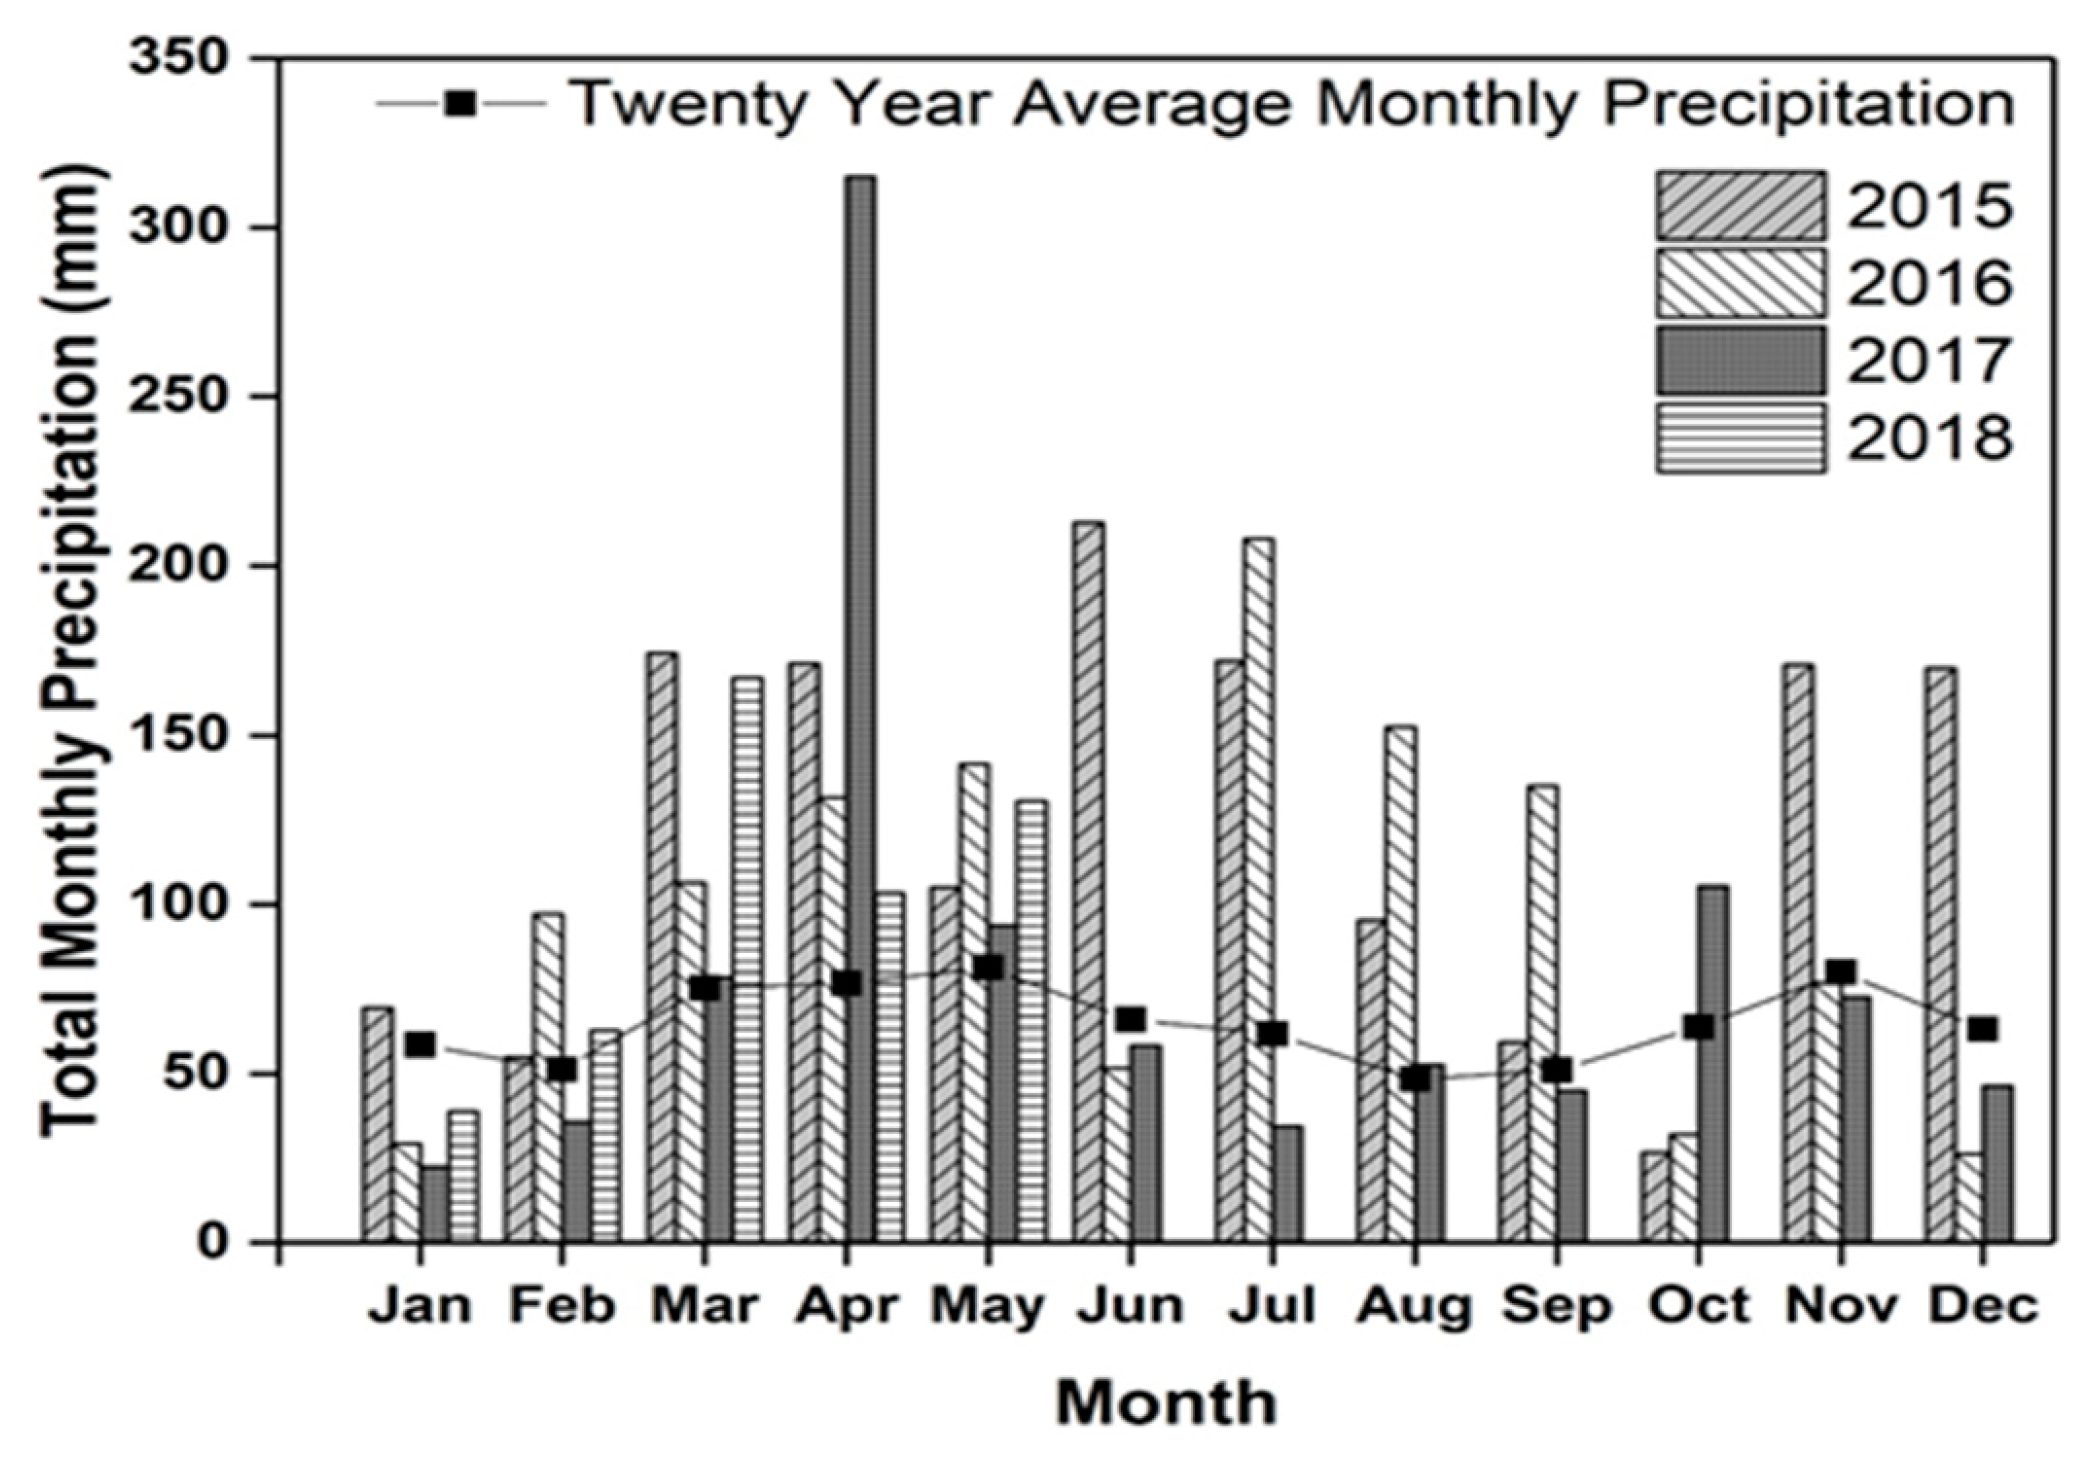
The total annual precipitation in 2015, 2016, and 2017 was 1481, 1187, and 999 mm, respectively, at the study location (Figure 2). Among the years in which corn was grown, 2015 was wetter and it received 482 mm higher rainfall compared to 2017. The growing season precipitation for corn (May to September) was 644 mm in 2015 and 284 mm in 2017. The total monthly precipitation of April 2017 was 144 mm higher compared to April 2015, which resulted in delaying the termination of hairy vetch CC from April to May (Table 1). Delaying the termination of CCs in spring can result in higher biomass accumulation by CCs. Total precipitation in June and July 2015 and July 2016 was 138 to 179 mm higher than July 2017. Nitrogen leaching loss during cash crop season is dependent on precipitation that is received during the growing season [8]. The total precipitation that was received from CC planting to their termination for cereal rye (2015–2016), hairy vetch (2016–2017), and cereal rye (2017–2018) was 650, 605, and 622 mm, respectively. The differences in total precipitation between the crop growing seasons may result in variable responses in crop biomass and production that can affect N uptake and N leaching.
3.2. N Uptake: Cover Crops
Topography and interaction of topography and CC affected cereal rye N uptake in 2016 (Table 2 and Table 5). In the CC watersheds, cereal rye N uptake was 13.28 kg ha−1 (87%) and 14.74 kg ha−1 (107%) greater at the shoulder position than the backslope and footslope positions, respectively. Comparatively better growing conditions were present at the shoulder positions compared to the footslope position due to good drainage (efficient surface water runoff and less water logging conditions), resulting in optimum soil moisture conditions that might have resulted in higher biomass at the shoulder positions, which increased N uptake at this topographic position. In watersheds without a CC, the N uptake by weeds at the backslope position was 9.46 kg ha−1 (45%) and 8.96 kg ha−1 (44%) lower than at the shoulder and footslope positions, respectively, in 2016 (Table 5). Backslope positions typically undergo high degradation as a result of soil erosion. Therefore, soils at the backslope position usually have lower nutrient content and fertility, which might have led to a poor stand of cereal rye and consequently lower N uptake. Planting cereal rye in 2016 did not appear to influence the changes in N uptake between watersheds with or without CCs. In our study, cereal rye biomass production was not significantly higher than the winter annual weeds in the no CC watersheds (1.33 vs. 1.38 Mg ha−1) and this might have resulted in the observed lack of an increase in N uptake due to CC planting in our study. Similarly, Shipley, et al. [40] reported that the TN content of cereal rye CC was similar to weeds in treatments that received 168 kg N ha−1 during the previous corn growing season in one out of two years of their study.
Cereal rye in 2018 had significant differences in N uptake due to CC treatment and topography (Table 2 and Table 5). Shoulder topographic positions for CC watersheds had 7.73 kg ha−1 more N uptake than the no CC watersheds. However, the footslope topographic positions in the CC watersheds had significantly less (9.94 kg N ha−1) N uptake than the no CC watersheds. There was no difference in N uptake between watersheds for the backslope topographic positions. During 2018, the watershed shoulder position with CCs had 22.4 kg ha−1 more N uptake compared to the footslope position. Meisinger and Ricigliano [8] reported that higher biomass production by cereal rye increased N uptake as compared to a fallow treatment. The summit topographic position had greater cereal rye biomass accumulation than in the depression slope [27]. Therefore, higher N uptake by cereal rye at the shoulder position in our study was due to higher cereal rye biomass accumulation at this topographic position. Many studies have reported the benefits of cereal rye in N scavenging from soils by recycling residual N in the biomass [3,8,41,42,43,44]. The effect of CCs on biomass production, N scavenging, and N uptake is dependent on multiple factors, including climatic conditions during the CC growing season, soil conditions (soil moisture, type, residual soil fertility levels), fertilizer application time (fall vs. spring), CC species and varieties, seeding rate, and the timing of sowing and termination [12,45,46]. Blesh and Drinkwater [1] reported that unfavorable environmental conditions and excessive rainfall during planting of CCs negatively impacted their establishment and resulted in lower N recovery. Excessive water and poorly drained footslope positions of the watersheds with CCs in our study might have resulted in the poor establishment of cereal rye. Poor establishment of cereal rye lead to lower biomass accumulation (data not present in this paper) at the footslope positions which reduced N uptake by cereal rye.
In contrast to cereal rye in 2016, hairy vetch CC significantly increased N uptake at each topographic position in CC watersheds as compared to the no CC watersheds in 2017 (Table 5). Nitrogen uptake of hairy vetch was 110.9, 85.02, and 44.89 kg ha−1 higher than weeds in the no CC watersheds at the shoulder, backslope, and footslope positions, respectively. Nitrogen uptake is a product of biomass production and tissue N concentration. In our study, biomass production in CC watersheds was 3.05 Mg ha−1 higher than the no CC watersheds, which resulted in higher N uptake. Being a legume, hairy vetch can fulfill its N requirement through biological N fixation, which can be another reason for higher N uptake in CC watersheds. Similarly, greater N accumulation by hairy vetch compared to non-legume CCs like cereal rye, austrian winter pea (Lathryrus hirsutus L.), annual ryegrass (Lolium multiflorum Lam. cv. Billion), canola (Brassica napus L. cv. Santana), and no CC treatments was also reported by Kuo, et al. [47]. Previous studies have shown that legume CCs have greater TN content due to their higher N concentration [40,48]. Holderbaum, Decker, Messinger, Mulford, and Vough [48] reported that hairy vetch CC, due to its high dry matter yield, had the highest N content (161 to 351 kg ha−1). Within CC watersheds in 2017, the N uptake was 62.78 kg ha−1 greater at the shoulder position compared to the footslope position due to higher biomass accumulation by hairy vetch at the shoulder topographic positions (biomass data not shown). In contrast, Muñoz, et al. [18] reported that the depression topographic positions had a higher accumulation of red clover biomass than the summit topographic positions. Greater biomass of red clover at the depression reflected in study by Muñoz, et al. [18] could be attributed to the better drainage condition at their research site. Topography affects plant growth and biomass production through its effects on physical and chemical properties of upslope and downslope soils, including soil nutrients, organic matter, and water availability, because of both vertical and horizontal water redistribution [20,49]. Therefore, the establishment of CCs at footslope positions in our study was challenging due to poor drainage and it resulted in poor CC stand and lower N uptake.
3.3. N Uptake: Cash Crops
Nitrogen uptake by corn in 2015 at the shoulder position was 74.8 kg ha−1 higher in the CC watersheds when compared to the no CC watersheds (Table 5). No differences were found between the watersheds for corn N uptake at backslope and footslope positions in 2015. Within the CC watersheds in 2015, N uptake was ranked shoulder > backslope > footslope. Intense solar radiation and higher wind velocity is experienced by the higher landscape positions, which can result in comparatively drier conditions [50], whereas lower landscape positions are subjected to soil organic matter and moisture accumulation, as well as waterlogging in the case of extreme rainfall events that commonly occur in the springs of the Midwestern United States. The presence of a subsoil fragipan further intensifies waterlogging at the lower landscape positions which can result in significant crop losses at the footslope positions due to anaerobic stress. It is possible that better soil moisture conditions at the shoulder position in 2015 with an annual precipitation of 1481 mm might have resulted in improved corn growth, biomass production, and higher N uptake.
Topography affected corn N uptake in 2017. Corn N uptake was 53.64 and 66.5 kg ha−1 lower at the backslope position compared to the shoulder and footslope positions, respectively (Table 5). The 2017 growing season was a dry year compared to 2015 (Figure 2). Downward movement of soil water from higher landscape positions might have resulted in greater soil moisture content at the lower landscape positions that increased corn biomass production and N uptake at the footslope position. The use of hairy vetch and cereal rye CC did not influence N uptake of corn in 2017 and soybean in 2016, respectively. Contrary to our study, Zotarelli, et al. [51] reported that plant biomass and N uptake of sweet corn increased in treatments with cereal rye and hairy vetch as compared to fallow when N was applied at 0 and 67 kg ha−1. Ebelhar, et al. [52] reported in Kentucky that hairy vetch, because of its higher biomass production (5.1 Mg ha−1) and N content (209 kg ha−1), had higher N concentration in corn when the data were averaged over five years. The lack of an influence of CCs on corn N uptake in our study may be due to lower biomass production and only two years of CC seasons preceding corn as compared to five years by Ebelhar et al. (1984) [52]. In addition, 2017 was a dry year and it might have limited N mineralization and availability from CC decomposition. Precipitation during the growing season often interacts with terrain and impacts crop production, because topography affects soil properties and available water to plants [53]. Within the CC watersheds, soybean N uptake in 2016 was 76.95 kg ha−1 greater at the shoulder position than the footslope position (Table 5).
3.4. Soil Nitrate-N and Ammonium-N: Cover Crop Season
Soil NO3-N content was affected by topography in 2016 and by an interaction of treatments and topography in 2018 (Table 3 and Table 6). At the backslope topographic positions, watersheds that were planted with cereal rye in 2018 had 1.79 kg ha−1 lower soil NO3-N as compared to watersheds without CCs. Ammonium-N in the CC watershed was higher than the no CC watershed in all three CC seasons. Due to the lack of studies evaluating the effects of CC, no CC, and topography on soil NO3-N and NH4-N, we were not able to compare our results to other studies. The soil samples in our study were taken in April before termination of CCs (Table 1). It is possible that nitrification was slow due to the low soil temperature (15–18 °C) at the time of soil sampling, resulting in higher NH4-N pools and lower NO3-N pools in soils. Additionally, the low biomass production of cereal rye in 2016 (1.33 Mg ha−1) might have resulted in lower N uptake by plants and higher N remaining in the soil. Similar to our study, Krueger, et al. [54] reported that no early season NO3-N depletion in soil was observed under cereal rye in one of the two years of study which possibly was due to low N accumulation in cereal rye biomass in Minnesota. Another study in Minnesota also showed no differences in residual NO3-N in a 1.5 m soil profile during a spring sampling event after cereal rye termination when compared to no CC [55]. However, Blesh and Drinkwater (2014) [1] reported that cereal rye reduced soil inorganic N content in the spring as compared to no CC treatment, which was equivalent to TN uptake by the CC biomass. Due to the scale of our study, the inherent differences in the watershed prior to implementing CCs cannot be ruled out. Therefore, the observed difference in NH4-N between the CC and no CC watersheds could also be due to pre-existing differences among the watersheds (Table 6).
3.5. Soil Nitrate-N and Ammonium-N: Cash Crop Season
Soil NO3-N content after corn harvest in 2015 was higher at the shoulder landscape position compared to the footslope position (Table 3 and Table 6). There were no differences in soil NO3-N due to treatment or treatment by topography interaction for corn 2015, as well as a treatment by topography interaction for soybean 2016. However, soybean watersheds with CCs in 2016 had significantly less (3.22 N kg ha−1) soil NO3-N as compared to no CC watersheds. In 2017, significant differences in soil NO3-N in the corn crop were only due to topographic positions between watersheds.
Soil NH4-N was 5.95 kg N ha−1 higher during corn season in 2015 for watersheds with CCs compared to no CC. For the soil sampling in soybean (2016), NH4-N in CC watersheds at the shoulder position was 8.29 kg N ha−1 higher when compared to the shoulder in the no CC watersheds. Krueger, Ochsner, Porter, and Baker [54] reported that soil NO3-N was lower in cereal rye (terminated in late-April) than in the control for a soil sampling event in early June at depths 0–30 cm and 30–60 cm. These differences disappeared at the 0–30 cm depth by the end of June and at the 30–60 cm depth by August, when N uptake by cash crop increased. Researchers found no differences between the CC and control by the time of the cash crop harvest in September [54]. Ebelhar, Frye, and Blevins [52] also reported that the inorganic N content in soil was higher in hairy vetch CC treatments about 2 to 4 weeks after CC termination as compared to no CC treatments, whereas no differences were present between CC treatments at the time of cash crop harvest. It is possible that the N fixed in the CC biomass in our study might have mineralized and was available for cash crop uptake during the growing season. Therefore, by the time fall soil sampling was conducted the difference due to the interaction of topography and CC might have disappeared.
3.6. Soil Solution Nitrate-N and Total N: Cover Crop Season
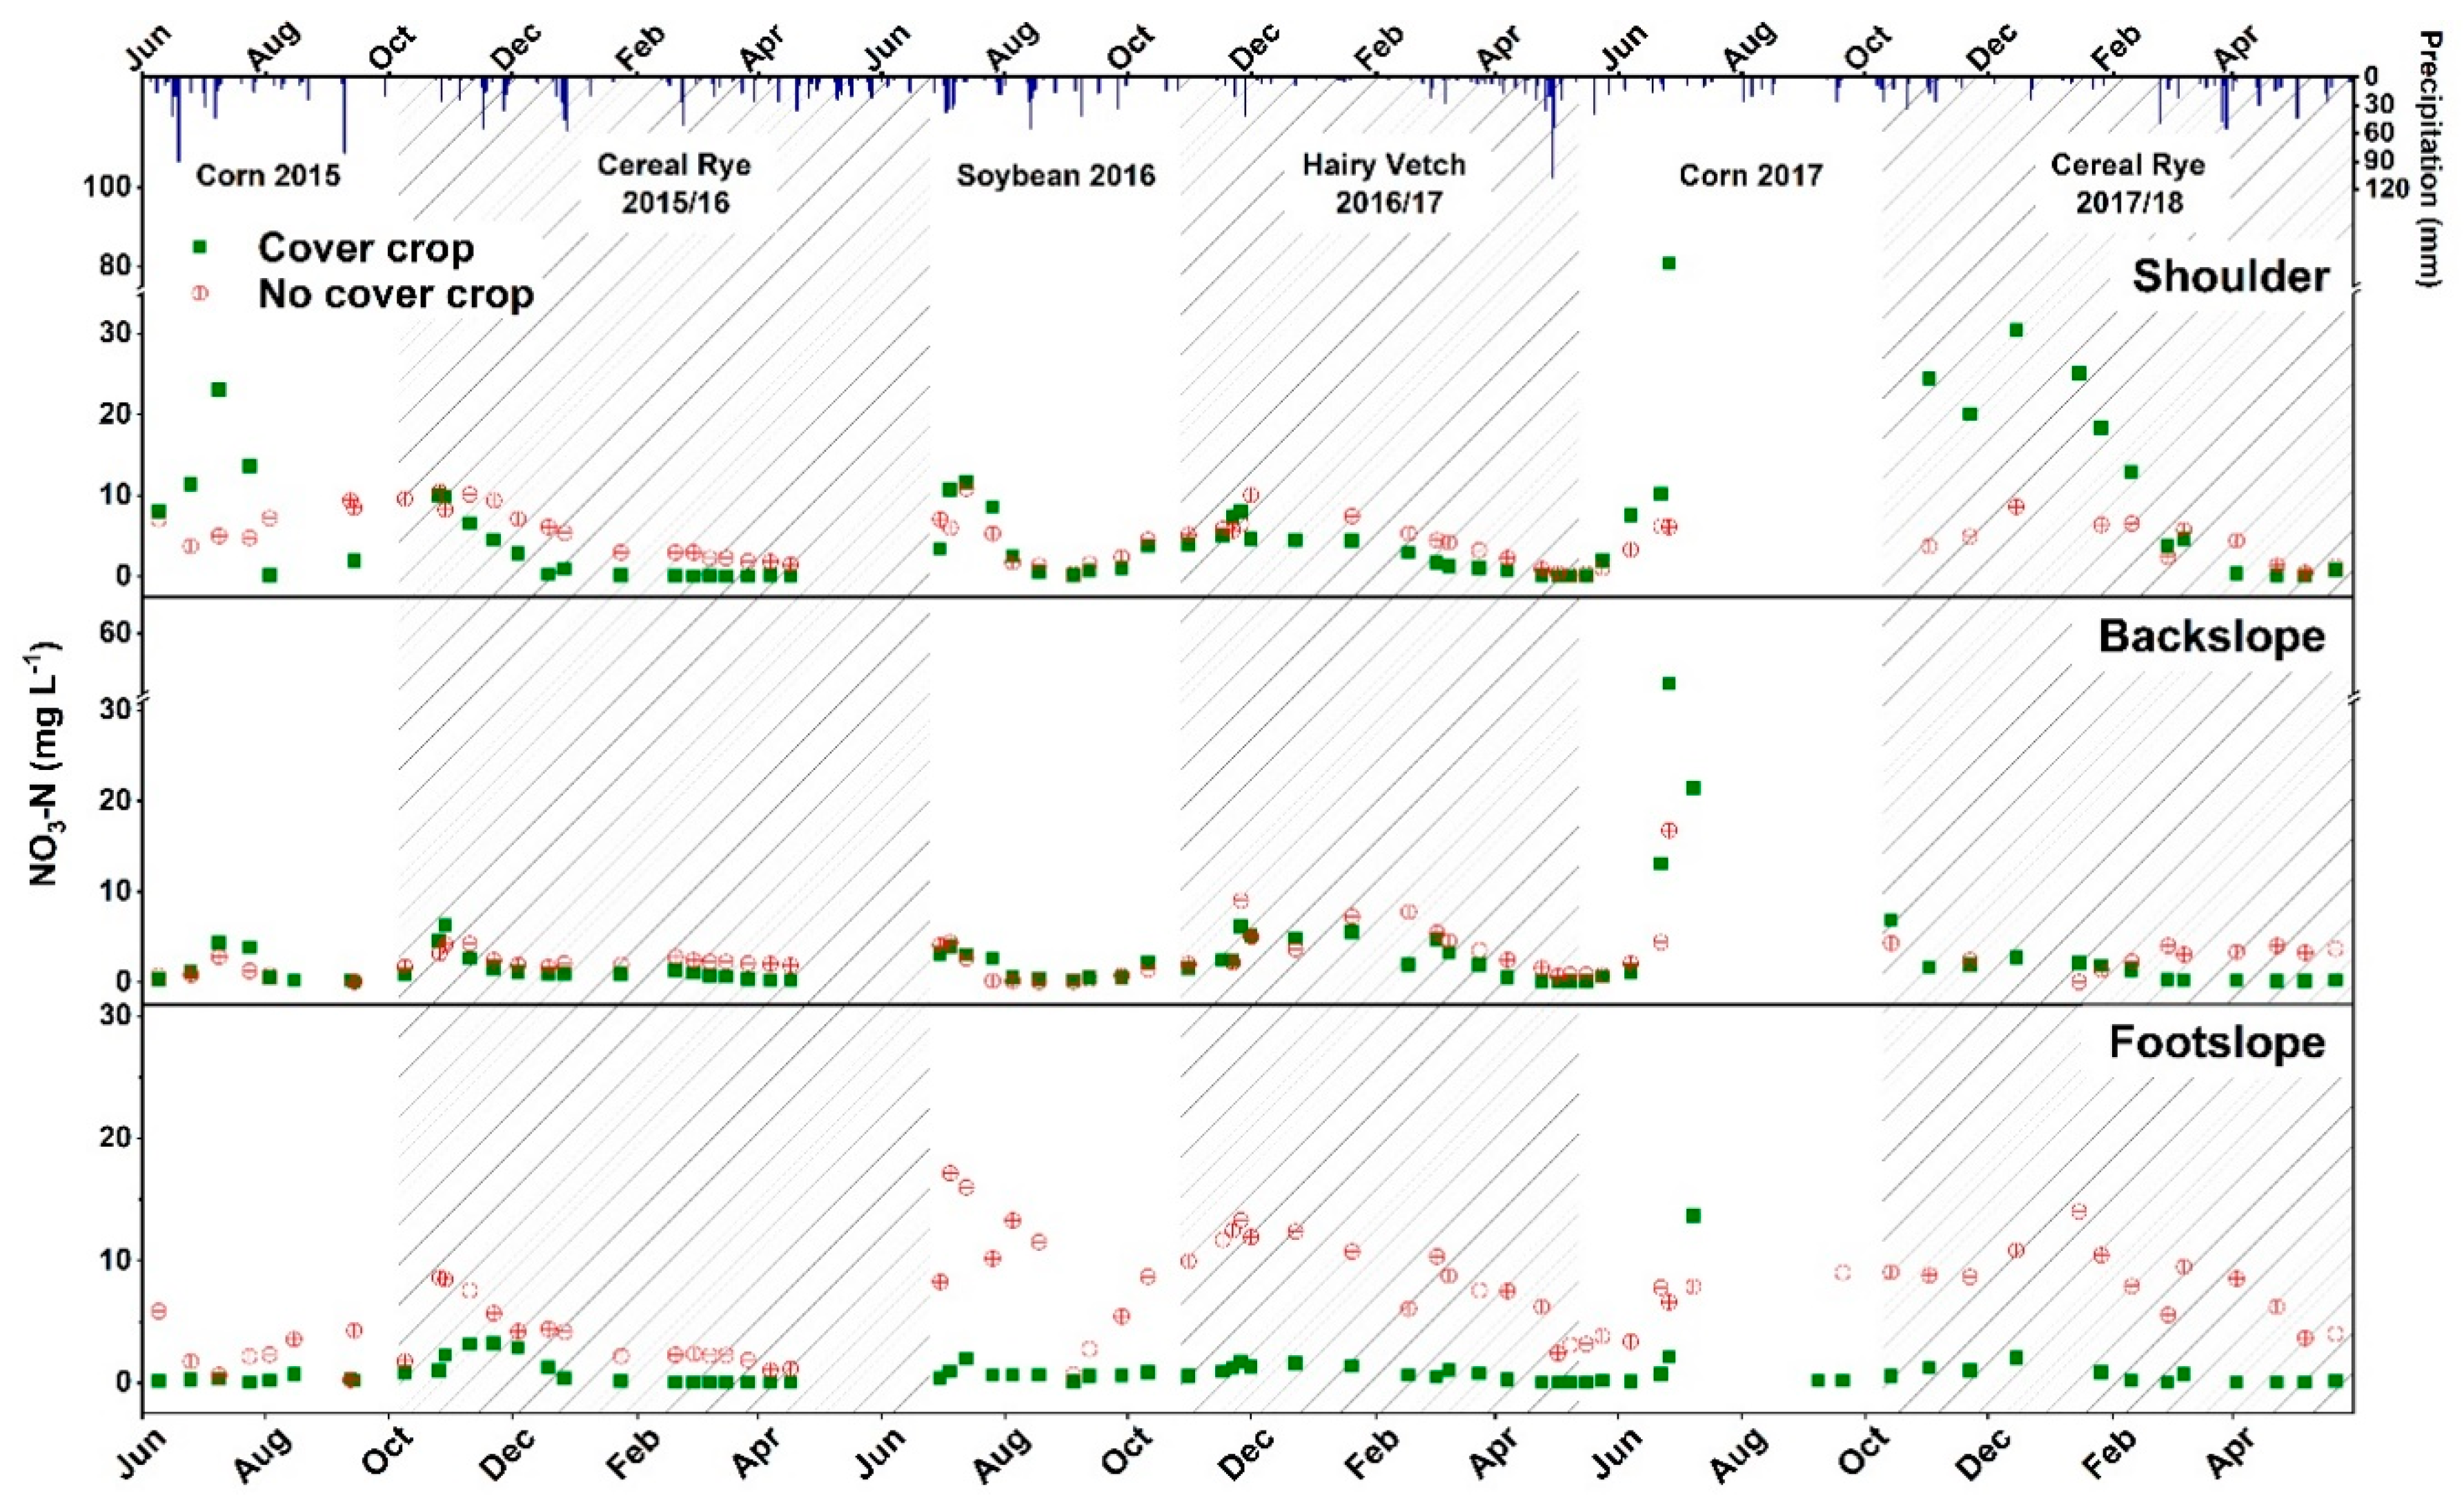
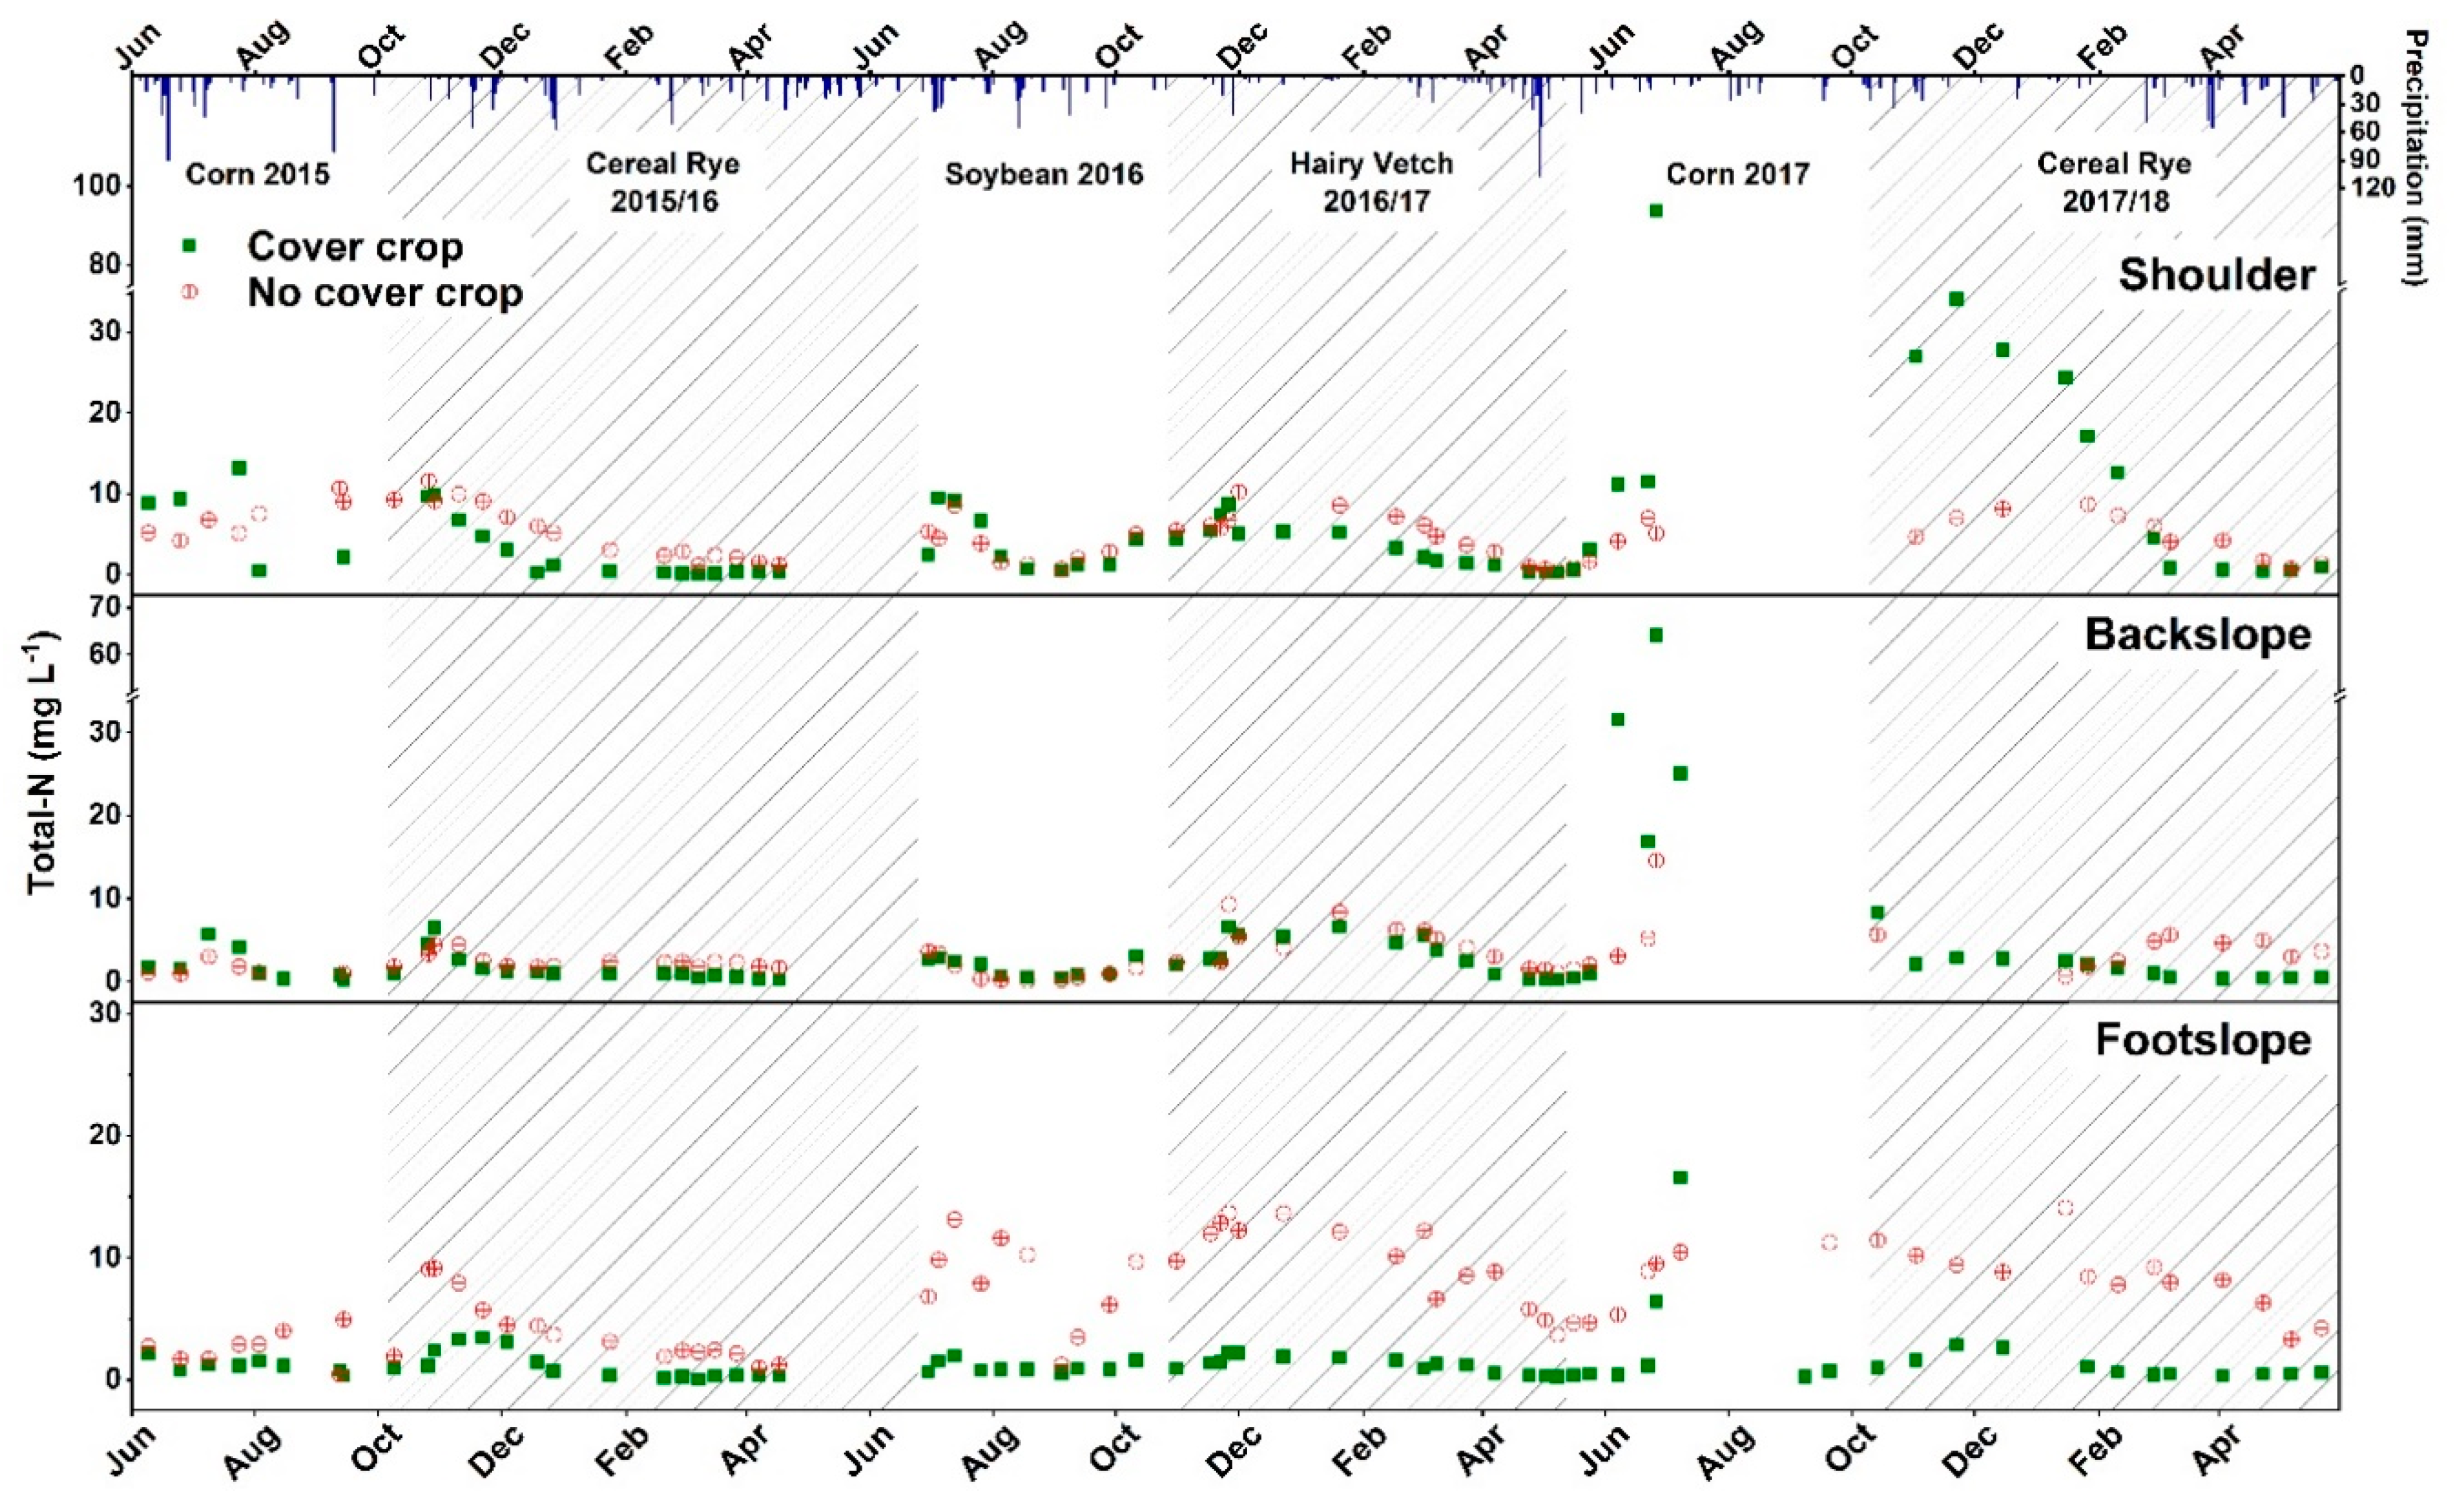
Seasonal variation in NO3-N and the TN in soil solution are shown in Figure 3 and Figure 4. Nitrogen concentrations were generally lower in the CC treatment as compared to no CC treatment watersheds during the CC growing season at all topographic positions. McCracken, Smith, Grove, Blevins, and MacKown reported lower concentrations of NO3-N with cereal rye and hairy vetch as compared to winter fallow treatments [17]. During 2015–2016, cereal rye reduced NO3-N and TN concentrations in CC watersheds by 2.54 (67%) and 2.4 (65%) mg L−1 as compared to no CC (Table 7). The nitrogen uptake of cereal rye in the CC watersheds was 19.19 kg ha−1 and the uptake by weeds in no CC watersheds was 17.74 kg ha−1. Although the N uptake was not significantly different, it may have resulted in less N in soil being available for leaching. During 2017–2018, NO3-N at the footslope position was 7.22 mg L−1 (94%) lower in CC watersheds when compared to the footslope position of the no CC watersheds. Total N was reduced by 2.46 mg L−1 (59%) and 6.89 mg L−1 (88%) at backslope and footslope topographic positions in CC watersheds as compared to the backslope and footslope positions of no CC watersheds, respectively, in 2017–2018. Multiple studies have reported a reduction in nitrate leaching with cereal rye CC as it scavenges N into its biomass [12,44,56,57,58,59,60]. For example, cereal rye reduced the nitrate leaching by at least 50% compared to no CC treatment in a four-year study in Iowa [57]. Ball-Coelho and Roy [56] reported that cereal rye reduced subsoil solution NO3-N concentration 11 mg NO3-N L−1 in spring following a dry growing season compared to no CC. In Oregon, cereal rye reduced nitrate leaching 32 to 42% and NO3-N concentration 1.8 mg N L−1 during the winter season, where no N fertilizer was applied to the cash crop [11]. However, Yeo, et al. [61] reported a 93% reduction in nitrate leaching by cereal rye with early planting at the field scale and concluded that early planting of CC increased the N uptake and decreased NO3-N leaching by 2 kg ha−1 as compared to late-planting.
At the footslope position, hairy vetch in spring 2017 reduced NO3-N by 7.71 and TN by 8.14 mg L−1 in CC watersheds compared to no CC (Table 7). At the footslope position, N uptake by hairy vetch was 44.89 kg ha−1 greater in the CC watersheds than no CC which may have resulted in lower inorganic N concentrations in the soil available for leaching. Within the CC watershed, NO3-N in the soil solution at the footslope position was 1.67 and 1.80 mg L−1 lower than shoulder and backslope positions, respectively, whereas TN was 2.01 mg L−1 lower at the footslope than backslope position. The low soil NO3-N at the footslope position might lower NO3-N and TN in the soil solution at the footslope position compared to the shoulder position (Table 6 and Table 7). In the no CC watersheds in spring 2017, the NO3-N concentrations were 4.30 to 4.73 mg L−1 lower at the shoulder and backslope positions as compared to the footslope position; however, the TN at the footslope position was higher than shoulder and backslope positions by 4.62 and 5.25 mg L−1, respectively (Table 6).
In two out of three CC growing seasons, the footslope positions of CC watersheds had significantly lower soil solution NO3-N and TN concentrations. Footslope positions on the non-tile drain fields are usually poorly drained and accumulate water. Higher available water, along with carbon inputs from the CC biomass either produced by CCs on footslope positions or carbon transported and deposited from backslope or shoulder positions, can act as a substrate for denitrification which can further reduce the N concentration of the soil solution [21,24].
3.7. Soil Solution Nitrate-N and Total N: Cash Crop Season
Seasonal soil solution NO3-N and TN concentrations during the cash crop growing season are given in Figure 3 and Figure 4. The NO3-N concentrations at all topographic positions during the individual soil solution sampling events were generally lower in the CC treatment than no CC treatment watersheds during the soybean growing season in 2016. However, the trend of soil solution NO3-N concentrations was reversed during the corn growing season in 2017. The differences in the soil solution NO3-N concentrations between the corn and soybean growing seasons may be due to the CN ratio of CC biomass preceding each cash crop [59]. Additionally, N that was fixed in the hairy vetch biomass might have been mineralized during June–July 2017 and then released a flush of available N in soil which was indicated by higher NO3-N soil solution concentrations in Figure 3. The leaching of NO3-N also depends upon the rainfall received. Martinez-Feria, et al. [62] found a linear positive relationship between precipitation, drainage water volume, and NO3-N losses in subsurface drainage. Baker and Timmons [63] also reported that the NO3-N concentrations in lysimeters at a 137-cm depth were detected after the first significant rainfall event of 54 mm occurred seven-days after N was applied. Dry growing seasons can result in higher residual NO3-N in soils of corn fields, because of reduced N uptake by drought-stressed corn plants and the insufficient availability of water for drainage to export soil NO3-N [10]. Meisinger and Ricigliano [8] found that cereals such as cereal rye, wheat, or barley, reduced NO3-N leaching by 95% in a dry year and by 50% in wet year. In addition, Meisinger and Ricigliano [8] found that the amount of rainfall following the cash crop had greater effects on NO3-N leaching than CC species.
Reductions in NO3-N and TN concentrations (3.21 and 3.95 mg L−1) at the footslope positions in CC compared to no CC watersheds were observed in the corn growing season in 2017 (Table 7). However, no differences in the NO3-N and TN concentrations were found at the shoulder and backslope positions during corn 2017. Within CC watersheds, NO3-N and TN were lower at the footslope position than the shoulder and backslope positions in 2017. However, no differences were observed for NO3-N or TN due to the topography within the no CC watershed. Our results indicate that hairy vetch CC on non-drained footslope topographic positions had residual effects and resulted in reduction of soil solution NO3-N or TN concentration even in the corn growing season 2017. It is possible that hairy vetch CC would have temporarily immobilized N from soil into its biomass, resulting in early cash crop season reduction in soil solution N concentrations and later in season mineralizing N to synchronize its release with maximum N demand by corn. Contrary to our study, Kuo, et al. [64] found that hairy vetch CC treatments resulted in higher NO3-N concentrations in leachate, which indicated the continued mineralization of hairy vetch N into the fall and winter seasons. The reduction in nitrate leaching by a CC depends upon the successful establishment of the CC [10,65]. Aronsson and Torstensson [65] reported that N leaching was reduced 40–50% with a CC compared to no CC in years when establishment of the CC was successful. However, the poor establishment of CCs in the third year, along with previous year’s CC residue, increased N leaching in the third year of their study [65]. On sandy loam soil in southwest Michigan, cereal rye reduced nitrate leaching by as much as 65 kg N ha−1 when it was well-established [10]. In our study, hairy vetch was well established in the watersheds and, due to wet spring of 2017, it was terminated in May. Late termination resulted in a substantial increase in the hairy vetch biomass (data not show) that probably resulted in higher N uptake in its biomass (Table 5), which could have carried its effects of soil solution N reduction into the 2017 corn growing season.
At footslope positions, NO3-N and TN (8.56 mg L−1 and 8.84 mg L−1) were reduced in the CC compared to no CC watersheds during the soybean growing season in 2016. Nitrogen uptake in the soybean biomass was similar between CC and no CC watersheds at footslope positions (Table 5). However, soil NO3-N in soybean was significantly higher in no CC than CC watersheds, which might be responsible for higher NO3-N and TN soil solution concentrations in the no CC watersheds (Table 6). Similarly, Ball-Coelho and Roy [56] reported an 8 mg NO3-N L−1 reduction in the nitrate concentrations in subsoil solution with cereal rye compared to no CC. In CC watersheds during soybean, NO3-N and TN at the shoulder position were 4.38 and 4.42 mg L−1 greater than the footslope position, respectively. The footslope position also had higher NO3-N and TN concentrations than the shoulder and backslope positions in the no CC watersheds. Cover crops planted at the watershed scale in our study only reduced the root zone soil solution N concentration at the footslope positions during the cash crop growing season.
4. Conclusions
The performance of CCs at different topographic positions was affected by the variability caused by inherent differences in topography. In general, N uptake in the CC biomass was higher at the shoulder position compared to the footslope positions due to better establishment of CCs. However, a N reduction in the vadose zone was generally only seen at the footslope position in CC watersheds compared to no CC watersheds. The results of the study are important for implementing economically viable management decisions for the farmers. At the watershed scale, the cost of implementing CCs can increase due to the area targeted under CCs and the poor establishment of CCs at this scale, which can result in significant loss off time, money, and efforts involved by the CC user. Therefore, dividing fields into different management zones based on topographic positions would allow micromanagement of watersheds. Multiple goals can be setup in an individual watershed to achieve the benefits of using CCs depending on the management zones. If the goal of a CC user is to get a reduction in soil solution N concentrations on the non-tile drained watersheds, then site specific CC planting targeting footslope topographic positions can be implemented. In our study, only footslope positions showed a reduction in soil solution N concentrations. Farmers can plant CCs on the footslope or the areas that are near to a headwater stream to manage N loss. If the goal of CC user is to prevent soil erosion on highly erodable topographic positions, such as backslopes, then CC species that establish well during winter and accumulate greater biomass can be adopted. Lastly, if the goal is obtaining an N benefit, then legume CCs can be planted at shoulder positions that can result in higher cash crop yields during normal precipitation years and can compensate for yield losses that are observed in the areas that may yield less. Cover crops at the watershed scale should be practiced and promoted; however, it is critical to keep in mind what kind of CC is to be implemented. Long-term research projects where different CCs and CCs mixes are planted on different topographic positions at the watershed scale are needed to further evaluate the potential of this BMP.
Author Contributions
Data curation, G.S.; writing—original draft preparation, G.S.; writing—review and editing, G.S., K.W., J.S., K.A.N., G.K.; supervision, K.W., J.S.; project administration, K.W., J.S.; funding acquisition, G.S., K.W., J.S.
Funding
The funding for this project was provided by Illinois Nutrient Research and Education Council, Award No. 2017-11-002, McIntire-Stennis Cooperative Forest Research Program (USDA-NIFA) and the Agronomy Science Foundation.
Acknowledgments
We are thankful to Randy McElroy for providing CC seed. We would like to acknowledge Randy Lange, Southern Illinois University Farm Workers/Staff and all the undergraduate workers who provided the essential assistance needed for this project.
Conflicts of Interest
The authors declare no conflict of interest.
References
- Blesh, J.; Drinkwater, L. Retention of 15n-labeled fertilizer in an Illinois prairie soil with winter rye. Soil Sci. Soc. Am. J. 2014, 78, 496–508. [Google Scholar] [CrossRef]
- Miguez, F.E.; Bollero, G.A. Winter cover crops in Illinois. Crop Sci. 2006, 46, 1536–1545. [Google Scholar] [CrossRef]
- Tonitto, C.; David, M.; Drinkwater, L. Replacing bare fallows with cover crops in fertilizer-intensive cropping systems: A meta-analysis of crop yield and n dynamics. Agric. Ecosyst. Environ. 2006, 112, 58–72. [Google Scholar] [CrossRef]
- Villamil, M.; Bollero, G.; Darmody, R.; Simmons, F.; Bullock, D. No-till corn/soybean systems including winter cover crops. Soil Sci. Soc. Am. J. 2006, 70, 1936–1944. [Google Scholar] [CrossRef]
- Dozier, I.A.; Behnke, G.D.; Davis, A.S.; Nafziger, E.D.; Villamil, M.B. Tillage and cover cropping effects on soil properties and crop production in Illinois. Agron. J. 2017, 109, 1261–1270. [Google Scholar] [CrossRef]
- Blanco-Canqui, H.; Shaver, T.M.; Lindquist, J.L.; Shapiro, C.A.; Elmore, R.W.; Francis, C.A.; Hergert, G.W. Cover crops and ecosystem services: Insights from studies in temperate soils. Agron. J. 2015, 107, 2449–2474. [Google Scholar] [CrossRef]
- Kessavalou, A.; Walters, D.T. Winter rye as a cover crop following soybean under conservation tillage. Agron. J. 1997, 89, 68–74. [Google Scholar] [CrossRef]
- Meisinger, J.; Ricigliano, K. Nitrate leaching from winter cereal cover crops using undisturbed soil-column lysimeters. J. Environ. Qual. 2017, 46, 576–584. [Google Scholar] [CrossRef] [PubMed]
- Heinrich, A.; Smith, R.; Cahn, M. Winter-killed cereal rye cover crop influence on nitrate leaching in intensive vegetable production systems. HortTechnology 2014, 24, 502–511. [Google Scholar] [CrossRef]
- Rasse, D.P.; Ritchie, J.T.; Peterson, W.R.; Wei, J.; Smucker, A.J. Rye cover crop and nitrogen fertilization effects on nitrate leaching in inbred maize fields. J. Environ. Qual. 2000, 29, 298–304. [Google Scholar] [CrossRef]
- Brandi-Dohrn, F.M.; Hess, M.; Selker, J.S.; Dick, R.P.; Kauffman, S.M.; Hemphill, D.D. Nitrate leaching under a cereal rye cover crop. J. Environ. Qual. 1997, 26, 181–188. [Google Scholar] [CrossRef]
- Mirsky, S.B.; Spargo, J.T.; Curran, W.S.; Reberg-Horton, S.C.; Ryan, M.R.; Schomberg, H.H.; Ackroyd, V.J. Characterizing cereal rye biomass and allometric relationships across a range of fall available nitrogen rates in the eastern united states. Agron. J. 2017, 109, 1520–1531. [Google Scholar] [CrossRef]
- Sievers, T.; Cook, R.L. Aboveground and root decomposition of cereal rye and hairy vetch cover crops. Soil Sci. Soc. Am. J. 2018, 82, 147–155. [Google Scholar] [CrossRef]
- Kaspar, T.; Bakker, M. Biomass production of 12 winter cereal cover crop cultivars and their effect on subsequent no-till corn yield. J. Soil Water Conserv. 2015, 70, 353–364. [Google Scholar] [CrossRef]
- Chapman, H.; Liebig, G.; Rayner, D. A lysimeter investigation of nitrogen gains and losses under various systems of covercropping and fertilization, and a discussion of error sources. Calif. Agric. 1949, 19, 57–128. [Google Scholar] [CrossRef] [Green Version]
- Jones, R.J. Nitrogen losses from Alabama soils in lysimeters as influenced by various systems of green manure crop management. Agron. J. 1942, 34, 574–585. [Google Scholar] [CrossRef]
- McCracken, D.V.; Smith, M.S.; Grove, J.H.; Blevins, R.L.; MacKown, C.T. Nitrate leaching as influenced by cover cropping and nitrogen source. Soil Sci. Soc. Am. J. 1994, 58, 1476–1483. [Google Scholar] [CrossRef]
- Muñoz, J.D.; Steibel, J.P.; Snapp, S.; Kravchenko, A.N. Cover crop effect on corn growth and yield as influenced by topography. Agric. Ecosyst. Environ. 2014, 189, 229–239. [Google Scholar] [CrossRef]
- Kaspar, T.C.; Pulido, D.; Fenton, T.; Colvin, T.; Karlen, D.; Jaynes, D.; Meek, D. Relationship of corn and soybean yield to soil and terrain properties. Agron. J. 2004, 96, 700–709. [Google Scholar] [CrossRef]
- Kravchenko, A.N.; Bullock, D.G. Correlation of corn and soybean grain yield with topography and soil properties. Agron. J. 2000, 92, 75–83. [Google Scholar] [CrossRef]
- Beehler, J.; Fry, J.; Negassa, W.; Kravchenko, A. Impact of cover crop on soil carbon accrual in topographically diverse terrain. J. Soil Water Conserv. 2017, 72, 272–279. [Google Scholar] [CrossRef]
- Singh, G.; Schoonover, J.E.; Williard, K.W.; Kaur, G.; Crim, J. Carbon and Nitrogen pools in deep soil horizons at different landscape positions. Soil Sci. Soc. Am. J. 2018, 82, 1512–1525. [Google Scholar] [CrossRef]
- Muñoz, J.D.; Kravchenko, A. Deriving the optimal scale for relating topographic attributes and cover crop plant biomass. Geomorphology 2012, 179, 197–207. [Google Scholar] [CrossRef]
- Ladoni, M.; Kravchenko, A.N.; Robertson, G.P. Topography mediates the influence of cover crops on soil nitrate levels in row crop agricultural systems. PLoS ONE 2015, 10, e0143358. [Google Scholar] [CrossRef] [PubMed]
- Ladoni, M.; Basir, A.; Robertson, P.G.; Kravchenko, A.N. Scaling-up: Cover crops differentially influence soil carbon in agricultural fields with diverse topography. Agric. Ecosyst. Environ. 2016, 225, 93–103. [Google Scholar] [CrossRef]
- Han, Z.; Walter, M.T.; Drinkwater, L.E. Impact of cover cropping and landscape positions on nitrous oxide emissions in northeastern us agroecosystems. Agric. Ecosyst. Environ. 2017, 245, 124–134. [Google Scholar] [CrossRef]
- Negassa, W.; Price, R.F.; Basir, A.; Snapp, S.S.; Kravchenko, A. Cover crop and tillage systems effect on soil co2 and n2o fluxes in contrasting topographic positions. Soil Tillage Res. 2015, 154, 64–74. [Google Scholar] [CrossRef]
- Schoeneberger, P.; Wysocki, D.; Benham, E. Field Book for Describing and Sampling Soils, version 3.0; Natural Resources Conservation Service, National Soil Survey Center: Lincoln, NE, USA, 2012; p. 36. [Google Scholar]
- Staff, S.S. Web Soil Survey. Available online: https://websoilsurvey.sc.egov.usda.gov (accessed on 11 January 2018).
- Illinois Geospatial Data Clearinghouse. Available online: https://clearinghouse.isgs.illinois.edu/ (accessed on 13 December 2017).
- Jenness, J. Topographic Position Index (TPI) v. 1.2; Jenness Enterprises: Flagstaff, AZ, USA, 2006. [Google Scholar]
- Evans, D.A.; Williard, K.W.; Schoonover, J.E. Comparison of terrain indices and landform classification procedures in low-relief agricultural fields. J. Geospat. Appl. Nat. Resour. 2016, 1, 1–13. [Google Scholar]
- Singh, G.; Williard, K.W.; Schoonover, J.E. Spatial relation of apparent soil electrical conductivity with crop yields and soil properties at different topographic positions in a small agricultural watershed. Agronomy 2016, 6, 57. [Google Scholar] [CrossRef]
- Venterea, R.T.; Hyatt, C.R.; Rosen, C.J. Fertilizer management effects on nitrate leaching and indirect nitrous oxide emissions in irrigated potato production. J. Environ. Qual. 2011, 40, 1103–1112. [Google Scholar] [CrossRef] [PubMed]
- Singh, G.; Kaur, G.; Williard, K.; Schoonover, J.; Kang, J. Monitoring of water and solute transport in the vadose zone: A review. Vadose Zone J. 2018, 17. [Google Scholar] [CrossRef]
- Carrick, S.; Fraser, P.; Dennis, S.; Knight, T.; Tabley, F. Challenges for Leachate Monitoring from Alluvial Sedimentary Soils; Fertilizer and Lime Research Centre, Massey University: Palmerston North, New Zealand, 2013. [Google Scholar]
- Wang, Q.; Cameron, K.; Buchan, G.; Zhao, L.; Zhang, E.; Smith, N.; Carrick, S. Comparison of lysimeters and porous ceramic cups for measuring nitrate leaching in different soil types. N. Z. J. Agric. Res. 2012, 55, 333–345. [Google Scholar] [CrossRef] [Green Version]
- Dahnke, W.; Johnson, G.V. Testing soils for available nitrogen. In Soil Testing and Plant Analysis; Westerman, R.L., Ed.; Soil Science Society of America: Madison, WI, USA, 1990; Volume 3, pp. 128–139. [Google Scholar]
- Littell, R.C.; Milliken, G.A.; Stroup, W.W.; Wolfinger, R.D.; Schabenberger, O. Sas for Mixed Models, 2nd ed.; SAS Institute Inc.: Cary, NC, USA, 2006. [Google Scholar]
- Shipley, P.R.; Messinger, J.; Decker, A. Conserving residual corn fertilizer nitrogen with winter cover crops. Agron. J. 1992, 84, 869–876. [Google Scholar] [CrossRef]
- Meisinger, J.; Hargrove, W.; Mikkelsen, R.; Williams, J.; Benson, V. Effects of cover crops on groundwater quality. In Cover Crops for Clean Water; Hargrove, W., Ed.; Soil and Water Conservation Society: Ankeny, IA, USA, 1991; pp. 793–799. [Google Scholar]
- Meisinger, J.; Shipley, P.; Decker, A. Using winter cover crops to recycle nitrogen and reduce leaching. In Conservation Tillage for Agriculture in the 1990’s Proceeding 1990 Southern Region Conservation Tillage Conference; Mueller, J., Wagger, M., Eds.; North Carolina State University: Raleigh, NC, USA, 1990; Volume 90. [Google Scholar]
- Kaspar, T.; Jaynes, D.; Parkin, T.; Moorman, T.; Singer, J. Effectiveness of oat and rye cover crops in reducing nitrate losses in drainage water. Agric. Water Manag. 2012, 110, 25–33. [Google Scholar] [CrossRef]
- Singh, G.; Williard, K.W.; Schoonover, J.E. Cover crops and tillage influence on nitrogen dynamics in plant-soil-water pools. Soil Sci. Soc. Am. J. 2018, 82, 1572–1582. [Google Scholar] [CrossRef]
- Lacey, C.; Armstrong, S. The efficacy of winter cover crops to stabilize soil inorganic nitrogen after fall-applied anhydrous ammonia. J. Environ. Qual. 2015, 44, 442–448. [Google Scholar] [CrossRef]
- Clark, A.J.; Decker, A.M.; Meisinger, J.J. Seeding rate and kill date effects on hairy vetch-cereal rye cover crop mixtures for corn production. Agron. J. 1994, 86, 1065–1070. [Google Scholar] [CrossRef]
- Kuo, S.; Sainju, U.; Jellum, E. Winter cover cropping influence on nitrogen in soil. Soil Sci. Soc. Am. J. 1997, 61, 1392–1399. [Google Scholar] [CrossRef]
- Holderbaum, J.; Decker, A.; Messinger, J.; Mulford, F.; Vough, L. Fall-seeded legume cover crops for no-tillage corn in the humid east. Agron. J. 1990, 82, 117–124. [Google Scholar] [CrossRef]
- McVay, K.; Budde, J.; Fabrizzi, K.; Mikha, M.; Rice, C.; Schlegel, A.; Peterson, D.; Sweeney, D.; Thompson, C. Management effects on soil physical properties in long-term tillage studies in Kansas. Soil Sci. Soc. Am. J. 2006, 70, 434–438. [Google Scholar] [CrossRef]
- Sariyildiz, T.; Anderson, J.; Kucuk, M. Effects of tree species and topography on soil chemistry, litter quality, and decomposition in northeast turkey. Soil Biol. Biochem. 2005, 37, 1695–1706. [Google Scholar] [CrossRef]
- Zotarelli, L.; Avila, L.; Scholberg, J.; Alves, B. Benefits of vetch and rye cover crops to sweet corn under no-tillage. Agron. J. 2009, 101, 252–260. [Google Scholar] [CrossRef]
- Ebelhar, S.; Frye, W.; Blevins, R. Nitrogen from legume cover crops for no-tillage corn. Agron. J. 1984, 76, 51–55. [Google Scholar] [CrossRef]
- Timlin, D.; Pachepsky, Y.; Snyder, V.; Bryant, R. Spatial and temporal variability of corn grain yield on a hillslope. Soil Sci. Soc. Am. J. 1998, 62, 764–773. [Google Scholar] [CrossRef]
- Krueger, E.S.; Ochsner, T.E.; Porter, P.M.; Baker, J.M. Winter rye cover crop management influences on soil water, soil nitrate, and corn development. Agron. J. 2011, 103, 316–323. [Google Scholar] [CrossRef]
- Strock, J.; Porter, P.; Russelle, M. Cover cropping to reduce nitrate loss through subsurface drainage in the northern us corn belt. J. Environ. Qual. 2004, 33, 1010–1016. [Google Scholar] [CrossRef] [PubMed]
- Ball-Coelho, B.; Roy, R. Overseeding rye into corn reduces NO3 leaching and increases yields. Can. J. Soil Sci. 1997, 77, 443–451. [Google Scholar] [CrossRef]
- Kaspar, T.; Jaynes, D.; Parkin, T.; Moorman, T. Rye cover crop and gamagrass strip effects on no concentration and load in tile drainage. J. Environ. Qual. 2007, 36, 1503–1511. [Google Scholar] [CrossRef]
- Ruffo, M.L.; Bullock, D.G.; Bollero, G.A. Soybean yield as affected by biomass and nitrogen uptake of cereal rye in winter cover crop rotations. Agron. J. 2004, 96, 800–805. [Google Scholar] [CrossRef]
- Singh, G. Effect of Cover Crops on Nutrient Dynamics and Soil Properties in Corn-Soybean Rotation in Southern Illinois. Ph.D. Thesis, Southern Illinois University, Carbondale, IL, USA, 2018. [Google Scholar]
- Singh, G.; Schoonover, J.E.; Williard, K.W. Cover crops for managing stream water quantity and improving stream water quality of non-tile drained paired watersheds. Water 2018, 10, 521. [Google Scholar] [CrossRef]
- Yeo, I.-Y.; Lee, S.; Sadeghi, A.M.; Beeson, P.C.; Hively, W.D.; McCarty, G.W.; Lang, M.W. Assessing winter cover crop nutrient uptake efficiency using a water quality simulation model. Hydrol. Earth Syst. Sci. 2014, 18, 5239–5253. [Google Scholar] [CrossRef] [Green Version]
- Martinez-Feria, R.A.; Dietzel, R.; Liebman, M.; Helmers, M.J.; Archontoulis, S.V. Rye cover crop effects on maize: A system-level analysis. Field Crops Res. 2016, 196, 145–159. [Google Scholar] [CrossRef]
- Baker, J.; Timmons, D. Fertilizer management effects on leaching of labeled nitrogen for no-till corn in field lysimeters. J. Environ. Qual. 1994, 23, 305–310. [Google Scholar] [CrossRef]
- Kuo, S.; Huang, B.; Bembenek, R. Effect of winter cover crops on soil nitrogen availability, corn yield, and nitrate leaching. Sci. World J. 2001, 1, 22–29. [Google Scholar] [CrossRef] [PubMed]
- Aronsson, H.; Torstensson, G. Measured and simulated availability and leaching of nitrogen associated with frequent use of catch crops. Soil Use Manag. 1998, 14, 6–13. [Google Scholar] [CrossRef]
Figure 1.
Cover crop research site at Carbondale, Illinois USA. Crop rotation followed was no-till corn-cereal rye-soybean-hairy vetch in watersheds planted with cover crops (CCs) indicted by the green outline and corn-no cover crop (no CC)-soybean-no CC in control watersheds indicated by the black outline. Soil solution collection events are the total number of water sampling events per cropping season from planting until harvest/termination of crops.

| 2015 | 2016 | 2017 | 2018 | |||||||||||||||||||||||||||||||||||||||||||||
|---|---|---|---|---|---|---|---|---|---|---|---|---|---|---|---|---|---|---|---|---|---|---|---|---|---|---|---|---|---|---|---|---|---|---|---|---|---|---|---|---|---|---|---|---|---|---|---|---|
| J | F | M | A | M | J | J | A | S | O | N | D | J | F | M | A | M | J | J | A | S | O | N | D | J | F | M | A | M | J | J | A | S | O | N | D | J | F | M | A | M | J | J | A | S | O | N | D | |
| Treatment | ||||||||||||||||||||||||||||||||||||||||||||||||
| CC | Corn | Cereal rye | Soybean | Hairy vetch | Corn | Cereal rye | ||||||||||||||||||||||||||||||||||||||||||
| No CC | Corn | No CC | Soybean | No CC | Corn | No CC | ||||||||||||||||||||||||||||||||||||||||||
| Soil Solution Collection Events | 8 | 16 | 10 | 16 | 7 | 13 | ||||||||||||||||||||||||||||||||||||||||||
Figure 2.
Total monthly precipitation at the research site from 2015 to 2018 with a twenty-year average of monthly precipitation from 1993 to 2014.
Figure 2.
Total monthly precipitation at the research site from 2015 to 2018 with a twenty-year average of monthly precipitation from 1993 to 2014.

Figure 3.
Soil solution nitrate-N (NO3-N) concentrations for cover crop and no-cover crop treatments at shoulder, backslope, and footslope topographic positions. Shaded areas indicate the cover crop growing season. Bars at the top of the figure represent daily precipitation received at the research site.

Figure 4.
Soil solution total nitrogen (total N) concentrations for cover crop and no-cover crop treatments at shoulder, backslope, and footslope topographic positions. Shaded areas indicate the cover crop growing season. Bars at the top of the figure represent daily precipitation received at the research site.


Table 1.
Dates of field operations and data collection.
| Crop | N-Fertilizer Application | Planting | Biomass Collection 1 | Harvest/Termination 2 | Soil Sampling |
|---|---|---|---|---|---|
| Corn | 30 April 2015 | 3 May 2015 | 10 September 2015 | 1 October 2015 | 8 October 2015 |
| Cereal rye | - | 5 October 2015 | 15 April 2016 | 18 April 2016 | 13 April 2016 |
| Soybean | - | 16 June 2016 | 27 September 2016 | 25 October 2016 | 25 October 2016 |
| Hairy vetch | - | 26 October 2016 | 12 May 2017 | 12 May 2017 | 12 April 2017 |
| Corn | 3 May 2017 | 19 May 2017 | 13 September 2017 | 6 October 2017 | 9 October 2017 |
| Cereal rye | - | 13 October 2017 | 7 May 2018 | 10 May 2018 | 18 April 2018 |
1 Aboveground cash crop biomass was collected from 1-m row length. Aboveground biomass including weed biomass was collected from watersheds with cover crop whereas for watersheds without cover crops only weed biomass was collected from a 0.4-m2 polyvinyl chloride quadrat at each sampling location. 2 Cover crop before corn was terminated using glyphosate, N-(phosphonomethyl)glycine at 1.27 kg a.e. ha−1 plus 2,4-D, (2,4-Dichlorophenoxyacetic acid) at 4.21 kg a.e. ha−1 plus diammonium sulfate (DAS) at 2% v/v. Cover crop prior to planting soybean was terminated using glyphosate at 0.95 kg a.e. ha−1 plus saflufenacil (N′-[2-chloro-4-fluoro-5-(3-methyl-2,6-dioxo-4-(trifluoromethyl)-3, 6-dihydro-1(2H)-pyrimidinyl)benzoyl]-N-isopropyl-N-methylsulfamide) at 0.04 kg a.i. ha−1 plus methylated seed oil (MSO) at 1% v/v plus DAS at 1.5% v/v.
Table 2.
Probability values (p-values) and numerator degrees of freedom (df) associated with the sources of variation in the statistical analysis of N uptake by the cover and cash crops.
Table 2.
Probability values (p-values) and numerator degrees of freedom (df) associated with the sources of variation in the statistical analysis of N uptake by the cover and cash crops.
| Source of Variation | df | N Uptake | |||||
|---|---|---|---|---|---|---|---|
| 2015–2016 | 2016–2017 | 2017–2018 | |||||
| Corn | Cereal Rye | Soybean | Hairy Vetch | Corn | Cereal Rye | ||
| p-Values | |||||||
| Treatment 1 | 1 | 0.7983 | 0.1284 | 0.7649 | <0.0001 | 0.4211 | 0.2845 |
| Topography 2 | 2 | <0.0001 | <0.0001 | 0.1304 | 0.0233 | 0.0085 | <0.0001 |
| Treatment * Topography | 2 | 0.0051 | 0.0007 | 0.0753 | 0.0005 | 0.2064 | <0.0001 |
1 Treatment is cover crop or no cover crop. 2 Topography is shoulder, backslope, or footslope. * Indicates an interaction effect.
Table 3.
Probability values (p-values) and numerator degrees of freedom (df) associated with the sources of variation in the statistical analysis of nitrate-N (NO3-N) and ammonium-N (NH4-N) during the six soil sampling events for the crop-year.
Table 3.
Probability values (p-values) and numerator degrees of freedom (df) associated with the sources of variation in the statistical analysis of nitrate-N (NO3-N) and ammonium-N (NH4-N) during the six soil sampling events for the crop-year.
| Source of Variation | df | 2015–2016 | 2016–2017 | 2017–2018 | |||||||||
|---|---|---|---|---|---|---|---|---|---|---|---|---|---|
| Corn | Cereal Rye | Soybean | Hairy Vetch | Corn | Cereal Rye | ||||||||
| NO3-N | NH4-N | NO3-N | NH4-N | NO3-N | NH4-N | NO3-N | NH4-N | NO3-N | NH4-N | NO3-N | NH4-N | ||
| p-Values | |||||||||||||
| Treatment 1 | 1 | 0.8471 | 0.0419 | 0.6145 | 0.0055 | 0.0454 | 0.1363 | 0.7001 | 0.0011 | 0.2601 | 0.1069 | 0.2895 | 0.0041 |
| Topography 2 | 2 | 0.0129 | 0.2859 | 0.0001 | 0.8638 | 0.0005 | 0.8765 | 0.3335 | 0.9625 | 0.0052 | 0.0469 | 0.1006 | 0.4278 |
| Treatment * Topography | 2 | 0.4684 | 0.1142 | 0.3091 | 0.6043 | 0.7250 | 0.0062 | 0.1043 | 0.1428 | 0.0239 | 0.162 | 0.0002 | 0.6421 |
1 Treatment is cover crop or no cover crop. 2 Topography is shoulder, backslope, or footslope. * Indicates an interaction effect.
Table 4.
Probability values (p-values) and numerator degrees of freedom (df) associated with the sources of variation in the statistical analysis for soil solution nitrate-N (NO3-N) and total N (TN) concentrations that were collected with a tension cup lysimeter.
Table 4.
Probability values (p-values) and numerator degrees of freedom (df) associated with the sources of variation in the statistical analysis for soil solution nitrate-N (NO3-N) and total N (TN) concentrations that were collected with a tension cup lysimeter.
| Source of Variation | df | 2015–2016 | 2016–2017 | 2017–2018 | |||||||||
|---|---|---|---|---|---|---|---|---|---|---|---|---|---|
| Corn | Cereal Rye | Soybean | Hairy Vetch | Corn | Cereal Rye | ||||||||
| NO3-N | TN | NO3-N | TN | NO3-N | TN | NO3-N | TN | NO3-N | TN | NO3-N | TN | ||
| p-Values | |||||||||||||
| Treatment 1 | 1 | 0.0974 | 0.4981 | 0.0121 | 0.0175 | 0.0008 | 0.0175 | <0.0001 | <0.0001 | 0.5008 | 0.9183 | <0.0001 | 0.0002 |
| Topography 2 | 2 | <0.0001 | <0.0001 | 0.0085 | 0.4640 | 0.0136 | 0.0025 | 0.9493 | 0.6832 | 0.0039 | 0.0072 | 0.1456 | 0.3742 |
| Treatment * Topography | 2 | 0.0008 | 0.0062 | 0.9107 | 0.2747 | <0.0001 | <0.0001 | <0.0001 | <0.0001 | <0.0001 | <0.0001 | <0.0001 | <0.0001 |
1 Treatment is cover crop or no cover crop. 2 Topography is shoulder, backslope, or footslope. * Indicates an interaction effect.
Table 5.
Nitrogen uptake (kg ha−1) of cover crop (CC) + weeds and cash crops (corn/soybean) determined by CC treatment and topography. Within a column and within a given factor or combination of factors, means followed by the same letter are not statistically different (α = 0.05).
Table 5.
Nitrogen uptake (kg ha−1) of cover crop (CC) + weeds and cash crops (corn/soybean) determined by CC treatment and topography. Within a column and within a given factor or combination of factors, means followed by the same letter are not statistically different (α = 0.05).
| Treatment | Topography | N Uptake | |||||
|---|---|---|---|---|---|---|---|
| 2015–2016 | 2016–2017 | 2017–2018 | |||||
| Corn | Cereal Rye | Soybean | Hairy Vetch | Corn | Cereal Rye | ||
| kg ha−1 | |||||||
| CC watersheds | 189.35 | 19.19 | 206.54 | 94.03a | 256.09 | 15.41 | |
| No CC watersheds | 185.10 | 17.74 | 200.92 | 13.76b | 229.00 | 14.14 | |
| Shoulder | 251.97a | 24.79a | 222.40 | 70.50a | 256.14a | 23.15a | |
| Backslope | 183.28b | 13.42b | 202.50 | 50.47b | 202.50b | 12.02b | |
| Footslope | 126.43c | 17.17a | 186.29 | 40.73b | 269.00a | 9.59b | |
| CC watersheds | Shoulder | 289.37a | 28.52a | 244.19a | 125.95a | 260.08 | 27.02a |
| CC watersheds | Backslope | 177.81b | 15.24bc | 208.19ab | 92.98ab | 238.36 | 14.57bc |
| CC watersheds | Footslope | 100.88c | 13.78bc | 167.24b | 63.17b | 269.82 | 4.62d |
| No CC watersheds | Shoulder | 214.57b | 21.06ab | 200.62ab | 15.05dc | 252.19 | 19.29b |
| No CC watersheds | Backslope | 188.75b | 11.60c | 196.81ab | 7.96d | 166.63 | 9.46c |
| No CC watersheds | Footslope | 151.98bc | 20.56ab | 205.33ab | 18.28c | 268.18 | 14.56bc |
Table 6.
Soil nitrate-N (NO3-N) and ammonium-N (NH4-N) in cover crop (CC) watersheds with topography being summed over two depths (0–15 and 15–30 cm). Within a column and within a given factor or combination of factors, means followed by the same letter are not statistically different (α = 0.05).
Table 6.
Soil nitrate-N (NO3-N) and ammonium-N (NH4-N) in cover crop (CC) watersheds with topography being summed over two depths (0–15 and 15–30 cm). Within a column and within a given factor or combination of factors, means followed by the same letter are not statistically different (α = 0.05).
| Treatment | Topography | 2015–2016 | 2016–2017 | 2017–2018 | |||||||||
|---|---|---|---|---|---|---|---|---|---|---|---|---|---|
| Corn | Cereal Rye | Soybean | Hairy Vetch | Corn | Cereal Rye | ||||||||
| NO3-N | NH4-N | NO3-N | NH4-N | NO3-N | NH4-N | NO3-N | NH4-N | NO3-N | NH4-N | NO3-N | NH4-N | ||
| kg ha−1 | |||||||||||||
| CC watersheds | 8.85 | 32.43a | 2.36 | 23.61a | 18.68b | 20.08 | 1.45 | 33.57a | 23.38 | 17.51 | 1.53 | 26.70a | |
| No CC watersheds | 7.26 | 26.48b | 2.60 | 18.58b | 21.90a | 17.95 | 1.26 | 24.31b | 19.32 | 13.87 | 2.05 | 22.04b | |
| Shoulder | 10.49a | 30.45 | 3.76a | 21.38 | 20.20ab | 18.70 | 1.64 | 29.02 | 34.69a | 14.08b | 1.79 | 24.17 | |
| Backslope | 7.22ab | 30.70 | 1.92b | 21.22 | 16.18b | 19.52 | 1.15 | 28.75 | 17.76b | 17.61a | 2.10 | 25.43 | |
| Footslope | 6.46b | 27.21 | 1.76b | 20.69 | 24.50a | 18.82 | 1.27 | 29.06 | 14.59b | 15.38ab | 1.48 | 23.52 | |
| CC watersheds | Shoulder | 11.67 | 36.15 | 3.96 | 23.37 | 18.33 | 22.85a | 2.09 | 33.71 | 33.76a | 14.86 | 2.17ab | 26.28 |
| CC watersheds | Backslope | 8.03 | 33.40 | 1.43 | 24.50 | 15.43 | 20.33ab | 1.13 | 31.51 | 26.12ab | 18.94 | 1.20b | 27.20 |
| CC watersheds | Footslope | 6.86 | 27.73 | 1.68 | 22.97 | 22.28 | 17.06ab | 1.14 | 35.49 | 10.24b | 18.72 | 1.21b | 26.63 |
| No CC watersheds | Shoulder | 9.32 | 24.75 | 3.55 | 19.40 | 22.07 | 14.56b | 1.18 | 24.34 | 29.61ab | 13.30 | 1.41b | 22.06 |
| No CC watersheds | Backslope | 6.42 | 27.99 | 2.41 | 17.94 | 16.93 | 18.70ab | 1.18 | 25.98 | 9.40b | 16.29 | 2.99a | 23.65 |
| No CC watersheds | Footslope | 6.05 | 26.69 | 1.84 | 18.41 | 26.71 | 20.57ab | 1.40 | 22.62 | 18.93ab | 12.03 | 1.74b | 20.40 |
Table 7.
Comparison of mean nitrate-N (NO3-N) and total N (TN) concentrations collected using tension cup lysimeters. Within a column and within a given factor or combination of factors, means followed by the same letter are not statistically different (α = 0.05).
Table 7.
Comparison of mean nitrate-N (NO3-N) and total N (TN) concentrations collected using tension cup lysimeters. Within a column and within a given factor or combination of factors, means followed by the same letter are not statistically different (α = 0.05).
| Treatment | Topography | 2015–2016 | 2016–2017 | 2017–2018 | |||||||||
|---|---|---|---|---|---|---|---|---|---|---|---|---|---|
| Corn | Cereal Rye | Soybean | Hairy Vetch | Corn | Cereal Rye | ||||||||
| NO3-N | TN | NO3-N | TN | NO3-N | TN | NO3-N | TN | NO3-N | TN | NO3-N | TN | ||
| mg L−1 | |||||||||||||
| CC watersheds | 4.76 | 6.31 | 1.16b | 1.3b | 2.56b | 2.8b | 1.89b | 2.38b | 15.19 | 19.21 | 3.76b | 4.78b | |
| No CC watersheds | 3.46 | 3.65 | 3.7a | 3.7a | 5.25a | 5.61a | 5.43a | 6.01a | 5.00 | 5.98 | 4.97a | 5.49a | |
| Shoulder | 9.37a | 11.07a | 3.18a | 3.2 | 4.61a | 5.01a | 3.27 | 3.75 | 13.8a | 15.32a | 6.73 | 7.60 | |
| Backslope | 1.52b | 2.1b | 1.92b | 1.92 | 2.09b | 2.13b | 3.12 | 3.61 | 12.07ab | 16.45a | 2.23 | 2.94 | |
| Footslope | 1.44b | 1.77b | 2.19b | 2.37 | 5.02ab | 5.48a | 4.58 | 5.23 | 4.42b | 6.02b | 4.10 | 4.40 | |
| CC watersheds | Shoulder | 12.61a | 15.82a | 1.46 | 1.61 | 5.11b | 5.48b | 2.4b | 2.82bc | 23.52a | 26.15a | 9.50a | 10.78a |
| CC watersheds | Backslope | 1.58b | 2.34bc | 1.11 | 1.16 | 1.84bc | 1.87bc | 2.53b | 3.17b | 19.25a | 27.42a | 1.28bc | 1.71b |
| CC watersheds | Footslope | 0.10b | 0.77c | 0.92 | 1.14 | 0.73c | 1.06c | 0.73c | 1.16c | 2.81b | 4.04b | 0.49c | 0.92b |
| No CC watersheds | Shoulder | 6.14ab | 6.33ab | 4.9 | 4.8 | 4.11bc | 4.55bc | 4.14b | 4.68b | 4.08ab | 4.49ab | 3.95ab | 4.41a |
| No CC watersheds | Backslope | 1.46b | 1.85bc | 2.74 | 2.69 | 2.34bc | 2.39bc | 3.71ab | 4.05b | 4.89ab | 5.47ab | 3.25ab | 4.17a |
| No CC watersheds | Footslope | 2.79b | 2.77bc | 3.47 | 3.6 | 9.3a | 9.9a | 8.44a | 9.3a | 6.02a | 7.99a | 7.71ab | 7.81a |
© 2019 by the authors. Licensee MDPI, Basel, Switzerland. This article is an open access article distributed under the terms and conditions of the Creative Commons Attribution (CC BY) license (http://creativecommons.org/licenses/by/4.0/).
Share and Cite
MDPI and ACS Style
Singh, G.; Williard, K.; Schoonover, J.; Nelson, K.A.; Kaur, G. Cover Crops and Landscape Position Effects on Nitrogen Dynamics in Plant-Soil-Water Pools. Water 2019, 11, 513. https://doi.org/10.3390/w11030513
AMA Style
Singh G, Williard K, Schoonover J, Nelson KA, Kaur G. Cover Crops and Landscape Position Effects on Nitrogen Dynamics in Plant-Soil-Water Pools. Water. 2019; 11(3):513. https://doi.org/10.3390/w11030513
Chicago/Turabian StyleSingh, Gurbir, Karl Williard, Jon Schoonover, Kelly A. Nelson, and Gurpreet Kaur. 2019. "Cover Crops and Landscape Position Effects on Nitrogen Dynamics in Plant-Soil-Water Pools" Water 11, no. 3: 513. https://doi.org/10.3390/w11030513
Note that from the first issue of 2016, this journal uses article numbers instead of page numbers. See further details here.