Evaluation of Water Uptake and Root Distribution of Cherry Trees under Different Irrigation Methods


1
College of Water Resources and Civil Engineering, China Agricultural University, Beijing 100083, China
2
Department of Water Resources of Guangxi Zhuang Autonomous Region; Nanning 530023, China
3
Beijing Ming Tombs Reservoir Administrative Office; Beijing 102200, China
4
Teaching Affairs Office, Beijing Forestry University; Beijing 100083, China
*
Author to whom correspondence should be addressed.
Water 2019, 11(3), 495; https://doi.org/10.3390/w11030495
Submission received: 15 January 2019
/
Revised: 22 February 2019
/
Accepted: 5 March 2019
/
Published: 8 March 2019
(This article belongs to the Section Water Use and Scarcity)
Abstract
:Although water-saving measures are increasingly being adopted in orchards, little is known about how different irrigation methods enhance water use efficiency at the root system level. To study the allocation of water sources of water absorption by cherry roots under two irrigation methods, surface irrigation and drip irrigation, oxygen isotope tracing and root excavation were used in this study. We found that different irrigation methods have different effects on the average δ18O content of soil water in the soil profile. The IsoSource model was applied to calculate the contribution rate of water absorption by cherry roots under these irrigation methods. During the drought period in spring (also a key period of water consumption for cherry trees), irrigation water was the main source of water absorbed by cherry roots. In summer, cherry roots exhibited a wide range of water absorption sources. In this case, relative to the surface irrigation mode, the drip irrigation mode demonstrated higher irrigation water use efficiency. After two years of the above experiment, root excavation was used to analyze the effects of these irrigation methods on the distribution pattern of roots. We found that root distribution is mainly affected by soil depth. The root system indexes in 10–30 cm soil layer differ significantly from those in other soil layers. Drip irrigation increased the root length density (RLD) and root surface area (RSA) in the shallow soil. There was no significant difference in root biomass density (RBD) and root volume ratio (RVR) between the two irrigation treatments. The effects of these irrigation methods on the 2D distribution of cherry RBD, RLD, RSA and RVR, which indicated that the cherry roots were mainly concentrated in the horizontal depths of 20 to 100 cm, which was related to the irrigation wet zone. In the current experiment, more than 85% of cherry roots were distributed in the space with horizontal radius of 0 to 100 cm and vertical depth of 0 to 80 cm; above 95% of cherry roots were distributed in the space with the horizontal radius of 0 to 150 cm and the vertical depth of 0 to 80 cm. Compared with surface irrigation, drip irrigation makes RLD and RSA more concentrated in the horizontal range of 30–100 cm and vertical range of 0–70 cm.
1. Introduction
Root growth is an important stage of plant growth. Many studies have investigated many aspects of plant roots, such as their growth and distribution, water absorption, and adaptive self-regulation [1,2,3]. Plant roots can extract water from various sources, including soil water, irrigation water, rainwater and groundwater [4,5]. The implementation of water-saving irrigation measures in orchards influences the distribution of roots, maximum root depth, and water absorption by roots [6,7,8,9]. In addition, the distribution range of roots shifts in accordance with the soil water content [10].
The stable oxygen isotope composition varies significantly amongst irrigation water, soil water at different depths, and groundwater because of the physical processes of evaporation, penetration, and slow chemical reactions [11,12]. Specifically, water absorbed by plant roots is considered to contain a mixture of all possible sources of water. Therefore, the relative contribution rate of each source of water to plant growth can be quantitatively determined by comparing the relationship between the water content of xylem and the isotopic characteristics of other sources of water [13]. This method forms the theoretical basis for the evaluation of plant water use with the stable oxygen isotope method. Relative to traditional methods, such as root excavation and soil moisture measurement, the stable isotope technique is perceived as a more valuable tool for more accurate assessment of water uptake patterns during crop growth [14,15]. This method causes minimal harm to the root environment and is thus suitable for long-term research [16]. Yano et al. stated that the stable hydrogen isotope composition of dry-farmed rice fields in the lowlands fluctuates due to the influence of precipitation [17]. Trees adapt their water absorption in the growing season and under varied soil moisture conditions [18]. Cao et al. found that cherry trees could absorb soil water and irrigation water at different depths depending on the degree of water deficit during different growth stages [19]. These findings indicate that the variation in and the ability to adapt the water extraction strategy can benefit root growth and improve a plant’s water-use efficiency, which is critical for irrigation water productivity and final yields in water limiting environments.
Several methods can be adopted to quantitatively assess the spatial distribution of roots in soil, including profiling, soil drilling, clod method, or excavation of intact root structures [1]. Despite the various advantages of the stable isotope methods, obtaining a thorough understanding of root growth and root distribution is considered the most direct means, and also the most challenging, for understanding crop growth, especially for large perennials such as fruit trees [20]. By far, the profiling method is the most commonly used method in orchard research [21,22]. Crop root distribution is influenced by many factors, including soil properties, soil types, rootstock types, and orchard management [23,24]. Different research groups have reported an important link between the root distribution of fruit trees and the soil moisture characteristics [25,26]. Based on the root excavation method, Williamson et al. and Parker and Meyer evaluated the root distribution of peach trees [2,3]. Yao et al. examined the growth, variation, and distribution of apple tree roots under different orchard ground management regulations [27]. Liang et al. studied the spatial distribution characteristics of the root system of intercropped apricots [28]. Paltineanu et al. studied the root distribution of apricot and peach trees [29,30] and Ceausescu et al. analyzed the relationship between root morphology, and stomata, solar radiation angle, orchard management and fertilization [31].
Cherry tree (Prunus avium) is an important fruit tree species in the suburbs of Beijing, China. Hence, it is essential to study the effects of irrigation in agricultural water-saving practices on cherry root distribution, root water absorption characteristics and water-use efficiency. Most of the existing studies focused on forest, grassland, and field crops to clarify the effects of different sources of water on root distribution and water absorption [3,4,5,6,20,21,22,23,24,25]. However, few studies focused on fruit trees to assess how different water sources, especially different irrigation methods, affect root water uptake patterns and then influence the root redistribution. The selection of water source and estimation of the possible contribution of each water source via irrigation water to total water absorption under different irrigation methods requires an in-depth study of root water uptake and root system distribution in cherry orchards [32]. The aim of this study was to identify the contribution of irrigation water to total plant root water uptake and root distribution under different irrigation methods to provide an adequate theoretical basis for guiding the precise water management of orchards.
2. Data and Methods
2.1. Site Description
The field experiments were conducted at Xi Feng Yue water-saving irrigation demonstration orchard (39°43’ N, 116°41’ E, 23.73 m a.s.l.) located in Tongzhou District in Beijing, China, in 2015 and 2016. The area has a typical semi-arid temperate continental monsoon climate characterized by drought in spring, hot and rain in summer, autumn sunny, and cold and dry in winter. The area receives considerable sunlight with a mean annual sunshine duration of 2562–2744 h and annual average temperature of 11.5 °C. The average annual precipitation is 565 mm, the mean annual evaporation is 1140 mm. No groundwater is available to influence cherry tree water uptake. The test period lasted from April to November. Note that the rainy season starts in June and ends in September, where the precipitation accounts for over 75% of the annual precipitation. The physical properties of soil in this area are listed in Table 1.
2.2. Experimental Design
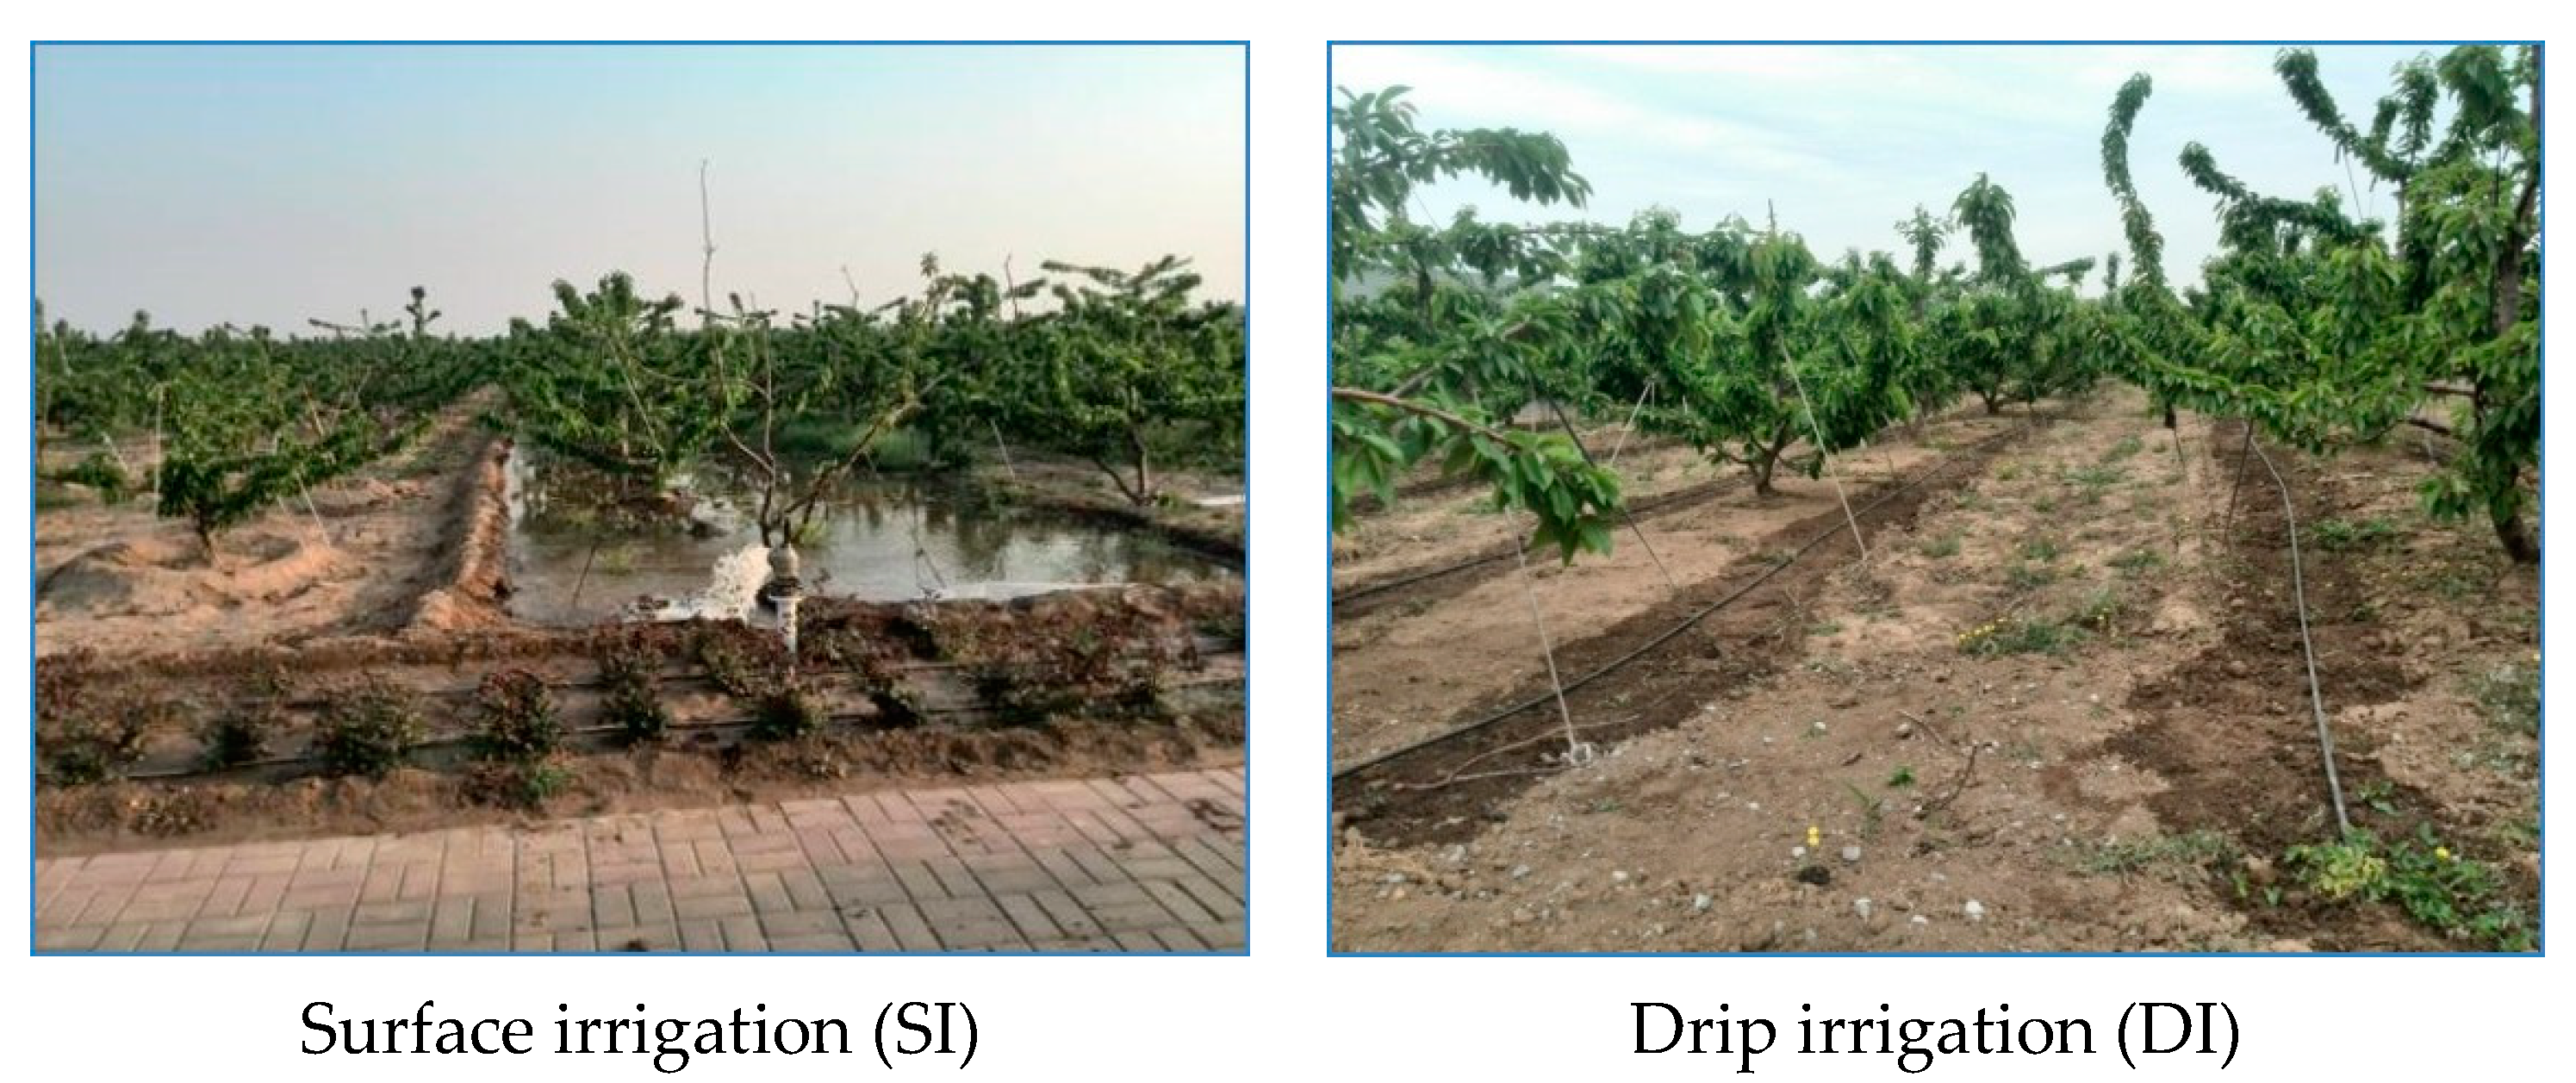
Before the experiment began, the orchard was irrigated by surface irrigation. A comparative study was completed by adding drip irrigation in March 2015. We selected the cherry orchard (cultivar is P. avium, rootstock is P. pseudocerasus) with average tree age of five years (±1 year) by 2015, and a planting density of 625 plants per hectare (4 × 4 m). Pipe irrigation was employed for the surface irrigation group, where each row of cherry trees has a pipe, and irrigation volume was measured with a water meter. Two rows of drip irrigation devices were placed along both sides of each fruit tree at intervals 0.7 m between the two adjacent rows. The space between emitters was 30 cm, and the water flow was 2 L/h for each emitter. Figure 1 depicts the two irrigation methods.
Similar to the local management methods, we adopted routine management practices such as fertilizer application, orchard pruning, and pest and disease control along with the two irrigation methods.
The irrigation amount (m) is calculated using [33]:
where z is the depth of soil moisture (we set a depth of 70 cm for a cherry tree at five years old in accordance with field experiments of similar orchards) [18,19,33], γ is the average volumetric density across the soil profile for 0–70 cm (at 1.41 g/cm3), θw is the average field capacity of 26.57%, p (%) is the designed wetted soil surface area of 25%; β1 is 0.95 times the upper threshold of soil moisture, and β2 is 0.60 times the lower threshold of soil moisture. The irrigation efficiency (η) for the surface irrigation is 0.5, whereas that for the drip irrigation is 0.9. Based on Equation (1), the irrigation amount for the surface irrigation and drip irrigation were 44.40 mm and 24.67 mm, respectively. The growth periods of the cherry trees in 2015 and 2016 are shown in Table 2.
m = 0.001zγθwp (β1 − β2)η
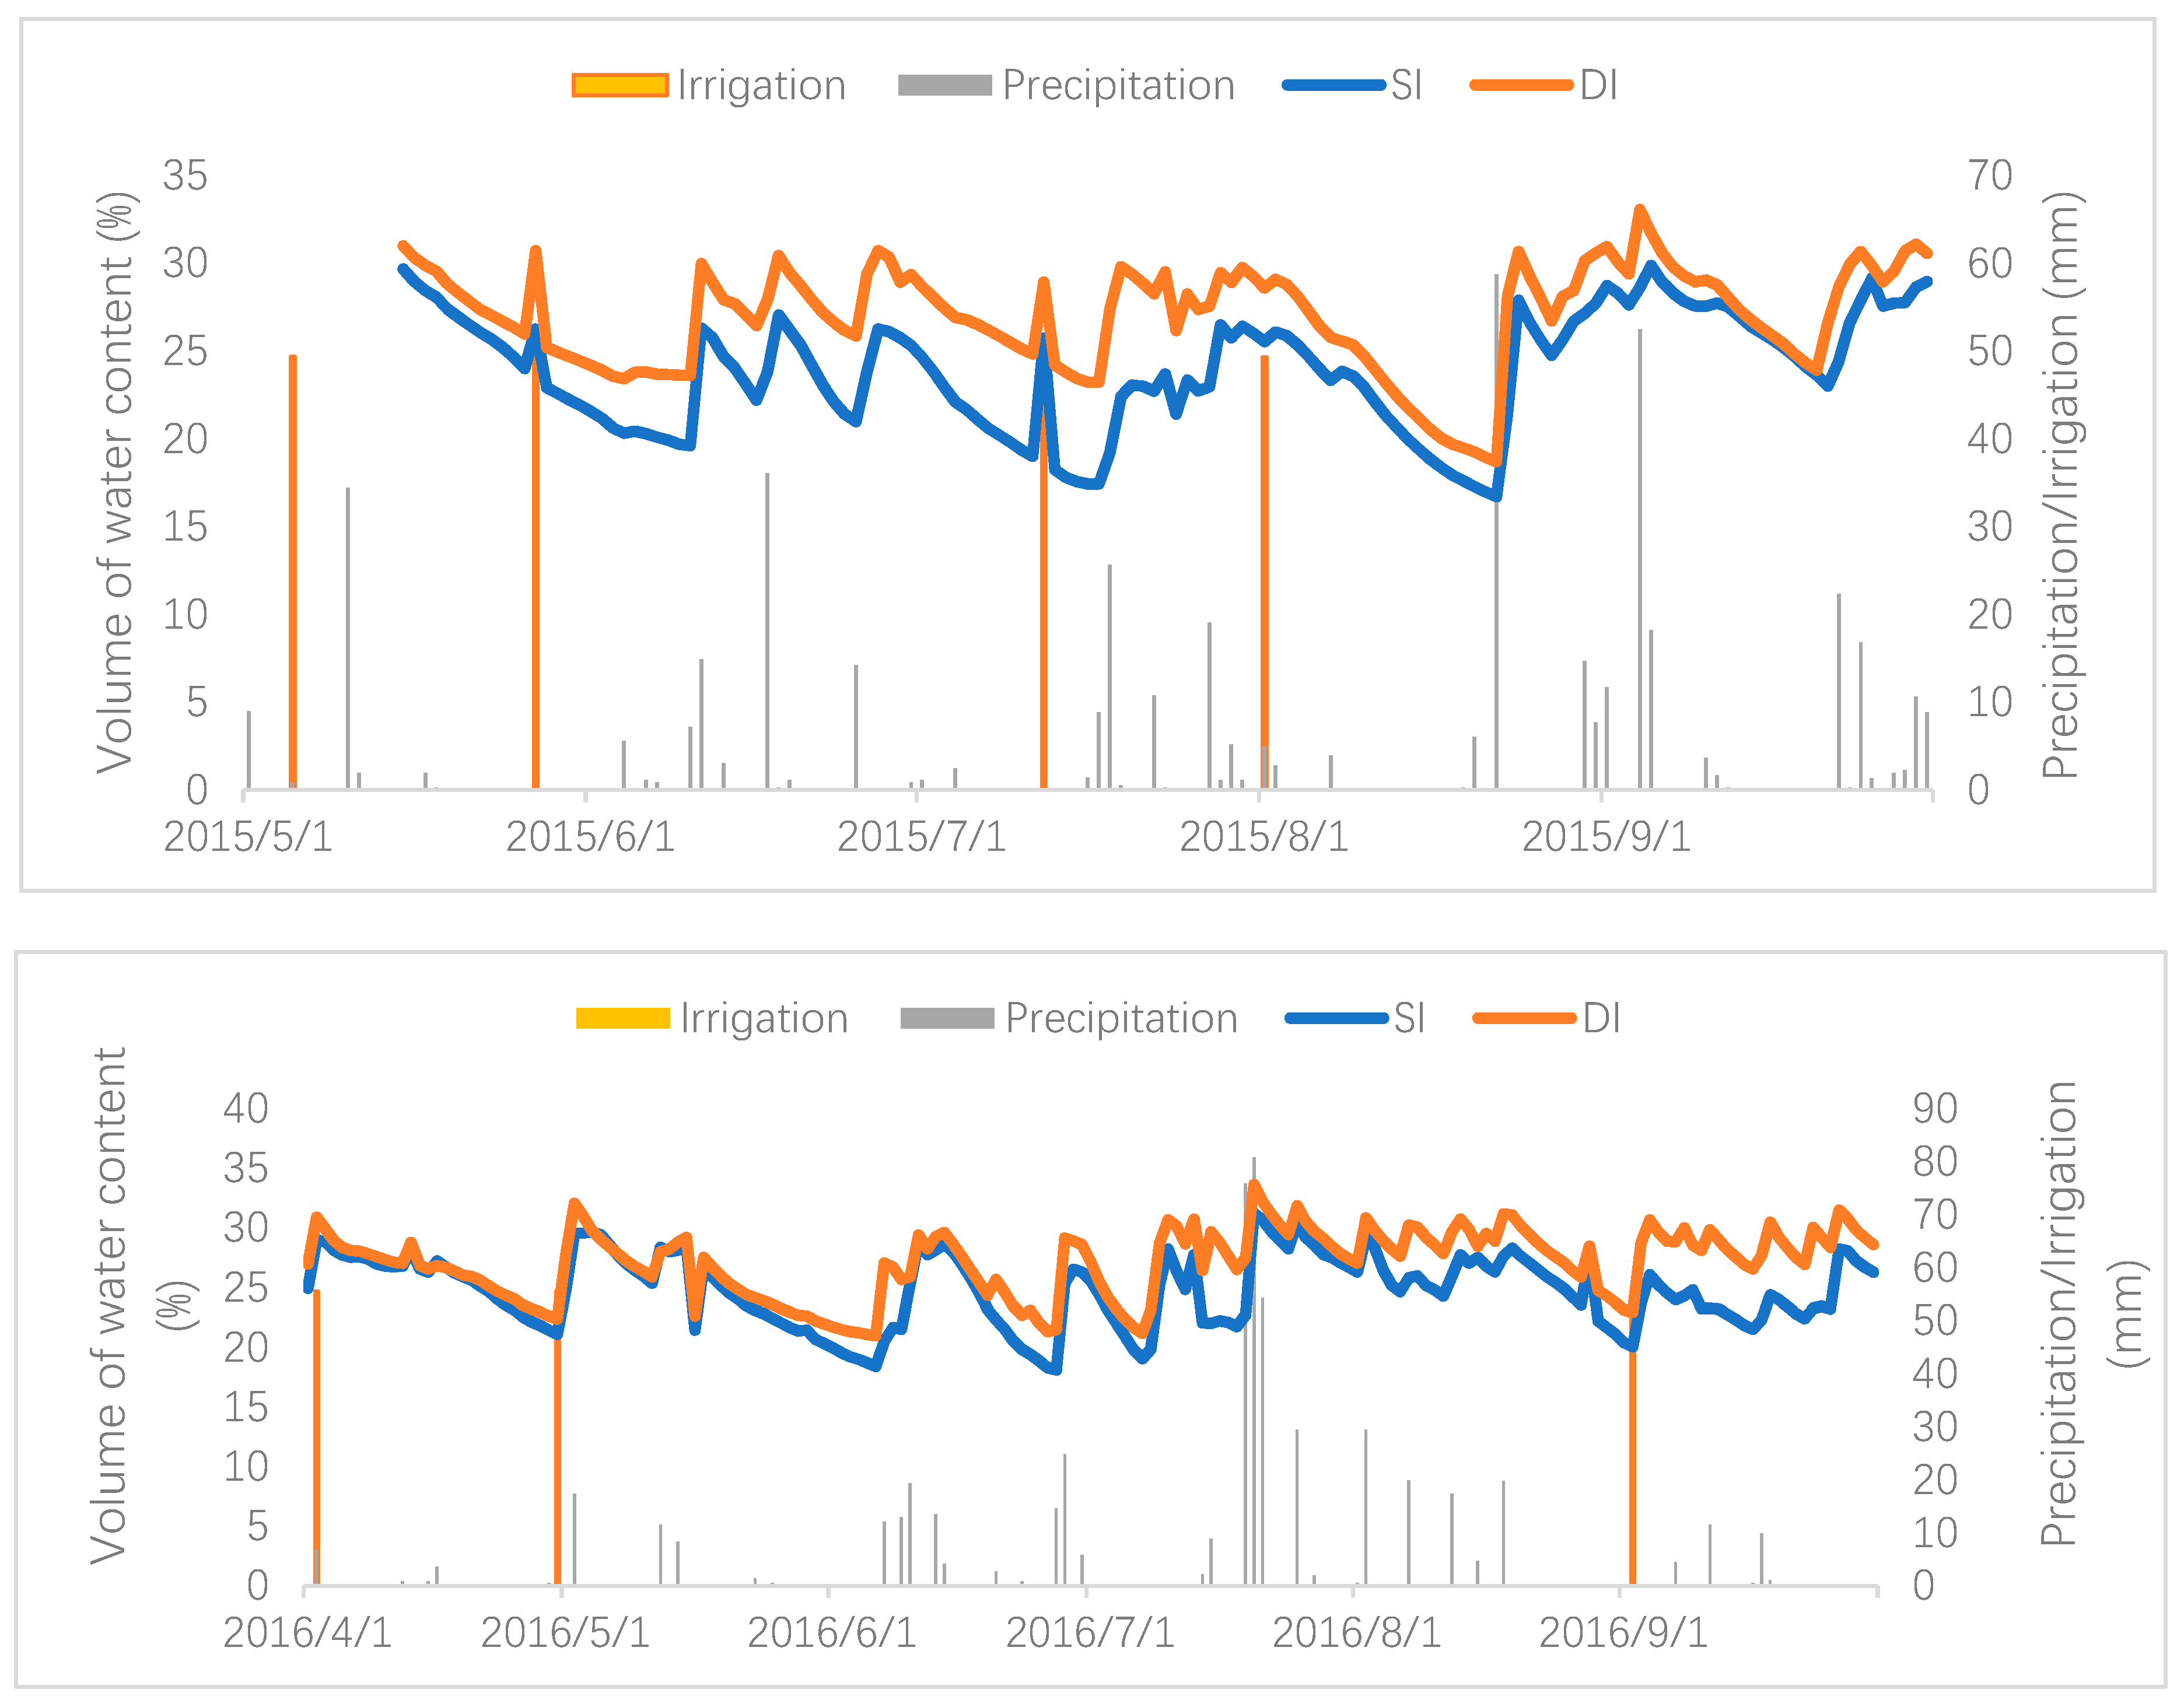
The rainfall and soil moisture content at depths of 20–40 cm for both surface irrigation and drip irrigation are shown in Figure 2.
Most of the precipitation in Tongzhou District in Beijing occurred during the late growth stage of cherry trees (from June to September). After July, there was more effective precipitation and higher average soil moisture (Figure 2). The precipitation during the late growth stage in 2015 and 2016 accounted for about 83% and 90% of the annual precipitation, respectively (Figure 2). Therefore, the research time was divided into two periods, spring drought season and summer rainy season, in order to analyze the oxygen isotope profile of the soil water and the characteristics of water absorption by cherry roots. The root excavation method was employed to study the distribution of the root system. Since this method is destructive to cherry fruit trees, it was implemented at a later stage of the experiment. After the isotope study, to determine the water absorbed by the roots treated under the two irrigation methods in 2015 and 2016, the excavation profile measurement was determined as the spring soil warmed up in 2017.
2.3. Sampling and Measuring
The water that was collected as sample included irrigation water (groundwater at the local area), soil moisture at different depths and stem water. The collection lasted from the flowering period to the late growing period.
2.3.1. Xylem Stem Water
About 3 days after each irrigation when rainfall had not occurred for at least 3 days, 3 trees with similar growth potential were selected for each treatment. Cut stem sections were chosen with a length of 3–5 cm from branches that appeared fully suberized without green (photosynthetic) tissue or bark to avoid possible isotope fractionation caused by plant transpiration. The sections were then placed into glass vials and each vial was sealed with plastic film and refrigerated immediately to prevent evaporation [6]. Stem water was extracted using a cryogenic vacuum distillation system and then placed into 5-mL polyethylene air-tight vials [16]. In order to ensure that the isotopic composition of the stem xylem sap was not affected by light, temperature, or other external conditions, each sampling was completed at 8:00 a.m.
2.3.2. Water Sample from the Soil
About 3 days after each irrigation, when rainfall had not occurred for at least 3 days, 3 positions close to the drippers were chosen as soil sample locations from each layer (0–30 cm, 30–60 cm, and 60–100 cm) using a soil auger. The sampling location of surface irrigation treatment was the same as that of drip irrigation treatment. All the soil samples were collected at 8:00 a.m. The water samples were collected using the same method for the xylem sap samples.
2.3.3. Soil Water Content
A time domain reflection (TDR) sectional soil moisture measurement system (TRIME-PICO-IPH, IMKO, Ettlingen, Germany) and frequency domain reflection (FDR) tubular moisture analyzer (Insentek Technology Co., Ltd., Beijing, China) were used to determine the soil moisture content. During the growing season (April to November), soil moisture content at the soil depths of 0–10, 10–20, 20–40, 40–60, 60–80, and 80–100 cm were measured using a FDR tubular moisture analyzer, where the measurements were collected at 1-h intervals. The TDR measurements were validated using the additional gravity measurement of the soil sample. Similar to previous studies [19,34], the soil moisture content (at depths of 20–40 cm) was higher than 60% of the soil saturated water content (θFC) and the corresponding soil moisture content was 22.71%.
2.3.4. Collection of Root Samples
The distribution of cherry roots was studied using the profile method in May 2017. Three trees were selected for each irrigation treatment. Every sample tree was the same age and had similar canopy growth. Average values of each treatment were taken as root samples for one-dimensional and two-dimensional graphics. A section (200 cm long, 100 cm wide, and 120 cm deep), perpendicular to the tree rows, was dug at a distance of 30 cm from the trunk. The length of the section was exactly the distance between the midpoint of the two rows, and the section line faced the trunk. This configuration ensured the symmetry of the soil samples and minimized errors. Every 10 cm along the horizontal direction from 30 cm to 200 cm was set as one unit, and every 10 cm of the upper layer of the soil along the vertical direction was set as one unit. As there were fewer roots in the lower soil layers, the interval along the vertical direction gradually increased till no roots were found in the excavated soil to reduce the workload. From the experiment, there were basically no roots in the soil layer below the depth of 100 cm. A total of eight groups of samples were excavated from these soil depths: 0–10, 10–20, 20–30, 30–45, 45–60, 60–80, 80–100, and 100–120 cm. All the excavated soil samples were placed into separate sample bags and delivered to the laboratory. The roots were separated from each soil sample via sieving with a 3-mm pore size sifter and stored in cling wrap. After being rinsed with water, roots shorter than 2-mm long were picked out for weighing with an electronic balance and scanned using a full-color scanner (Epson, Perfection 4870 photo, Suwa, Japan) [35,36,37]. By analyzing the weighing data and scanned results with Win RHIZO (Regent Co. Ltd., Beijing, China; Quebec City, Canada) analysis software, we obtained four parameters: root biomass density (RBD, g/cm3), root length density (RLD, cm/cm3), root surface area (RSA, cm2/cm3), and root volume ratio (RVR, cm3/cm3).
2.3.5. Other Sampling Procedures and Data
Data of solar radiation (Avalon, AV-20P, Chicago, IL, USA), photosynthetically active radiation (Avalon, AV-19Q, Chicago, IL, USA), net radiation above the canopy (Jinzhou Sunshine Technology Co. Ltd., TBB-1, Jinzhou, China), air temperature and relative humidity (Avalon, AV-10TH, Chicago, IL, USA), air pressure (Avalon, AV-41BP, Chicago, IL, USA), wind speed (Avalon, AV-30 WS, Chicago, IL, USA), and precipitation (Avalon, AV-36R, Chicago, IL, USA) were recorded using an automatic weather station located about 200 m away from the orchard. Average (or total, in the case of precipitation) observed data were recorded at half-hour intervals with a Squirrel Data Logger (Yugen Technology Co. Ltd., Grant 2040 series, Beijing, China) and were downloaded automatically.
2.3.6. Oxygen Isotope Measurement
All water samples were stored in containers sealed with parafilm and subsequently frozen at approximately −20 °C prior to analysis. At the Institute of Environmentally Stable Isotopes, Chinese Academy of Agricultural Sciences, a liquid water isotope analyzer (Isoprime Ltd., Isoprime 100, Cheadle Hulme, SK, UK and Lachat, Quick Chem 8500, Loveland, CO, USA) was used to analyze the oxygen stable isotope composition (δ, ‰) of the water samples. The Vienna Standard Mean Ocean Water (V-SMOW) was set as reference [19]. The results were calculated using the following formula:
where Rsample is the molar ratio of 18O/16O in a water sample and Rstandard is the molar ratio of 18O/16O in the V-SMOW. The analysis accuracy of δ18O is ±0.1‰ (2 standard deviation).
δ18O = (Rsample/Rstandard − 1) × 1000
2.4. Data Analysis Methods
Excel (Microsoft, Office 2016, Redmond, WA, USA) was used to sort, calculate and map the test data. Statistical software (IBM, SPSS 18.0, Amund, NY, USA) was used to perform the statistical analysis and comprehensive evaluation. Oxygen isotope contents of soil water were investigated with a two-way ANOVA and Duncan multiple range test with factors irrigation methods and soil layers, and 6 replicates. Oxygen isotope contents of stem water were investigated with a one-way ANOVA with factor irrigation methods, and six replicates. Vertical distribution characteristics of cherry roots were investigated with a two-way ANOVA and Duncan multiple range test with factors irrigation methods and soil layers, and 3 replicates. Two-dimensional graphs of the roots in the soil were prepared using the Surfer (Golden Software, Surfer 15.4.354, Golden, CO, USA).
In this study, two methods were adopted to analyze the water absorbed by cherry roots. The first method is a direct referencing method that compares the δ18O values in the stem water with those of soil water in each depth range [16,19]. An IsoSource model (Donald L. Phillips) based on multi-source mass balance was used as the second method [38]. For water in the soil samples and sap in the plant xylem stem samples collected at the same stage, the ratio of each water source to the total water uptake was be calculated as:
where f1, f2, f3, and f4 are the percentages of each water source in the water absorbed by cherry roots; δX1, δX2, δX3, and δX4 are the isotope contents of each water source, including soil water samples at each depth range (0–30 cm, 30–60 cm and 60–100 cm) and irrigation water δ; and δX is the isotope characteristics of sap in the dry xylem and is considered as a mixture of these possible water sources. The tolerance for this method is 0.01‰, the level of uncertainty is 0.2, and the increment is 1%.
δX = f1δX1 + f2δX2 + f3δX3 + f4δX4
1 = f1 + f2 + f3 + f4
3. Results
3.1. Oxygen Isotope Contents of Soil Water, Irrigation Water and Stem Water
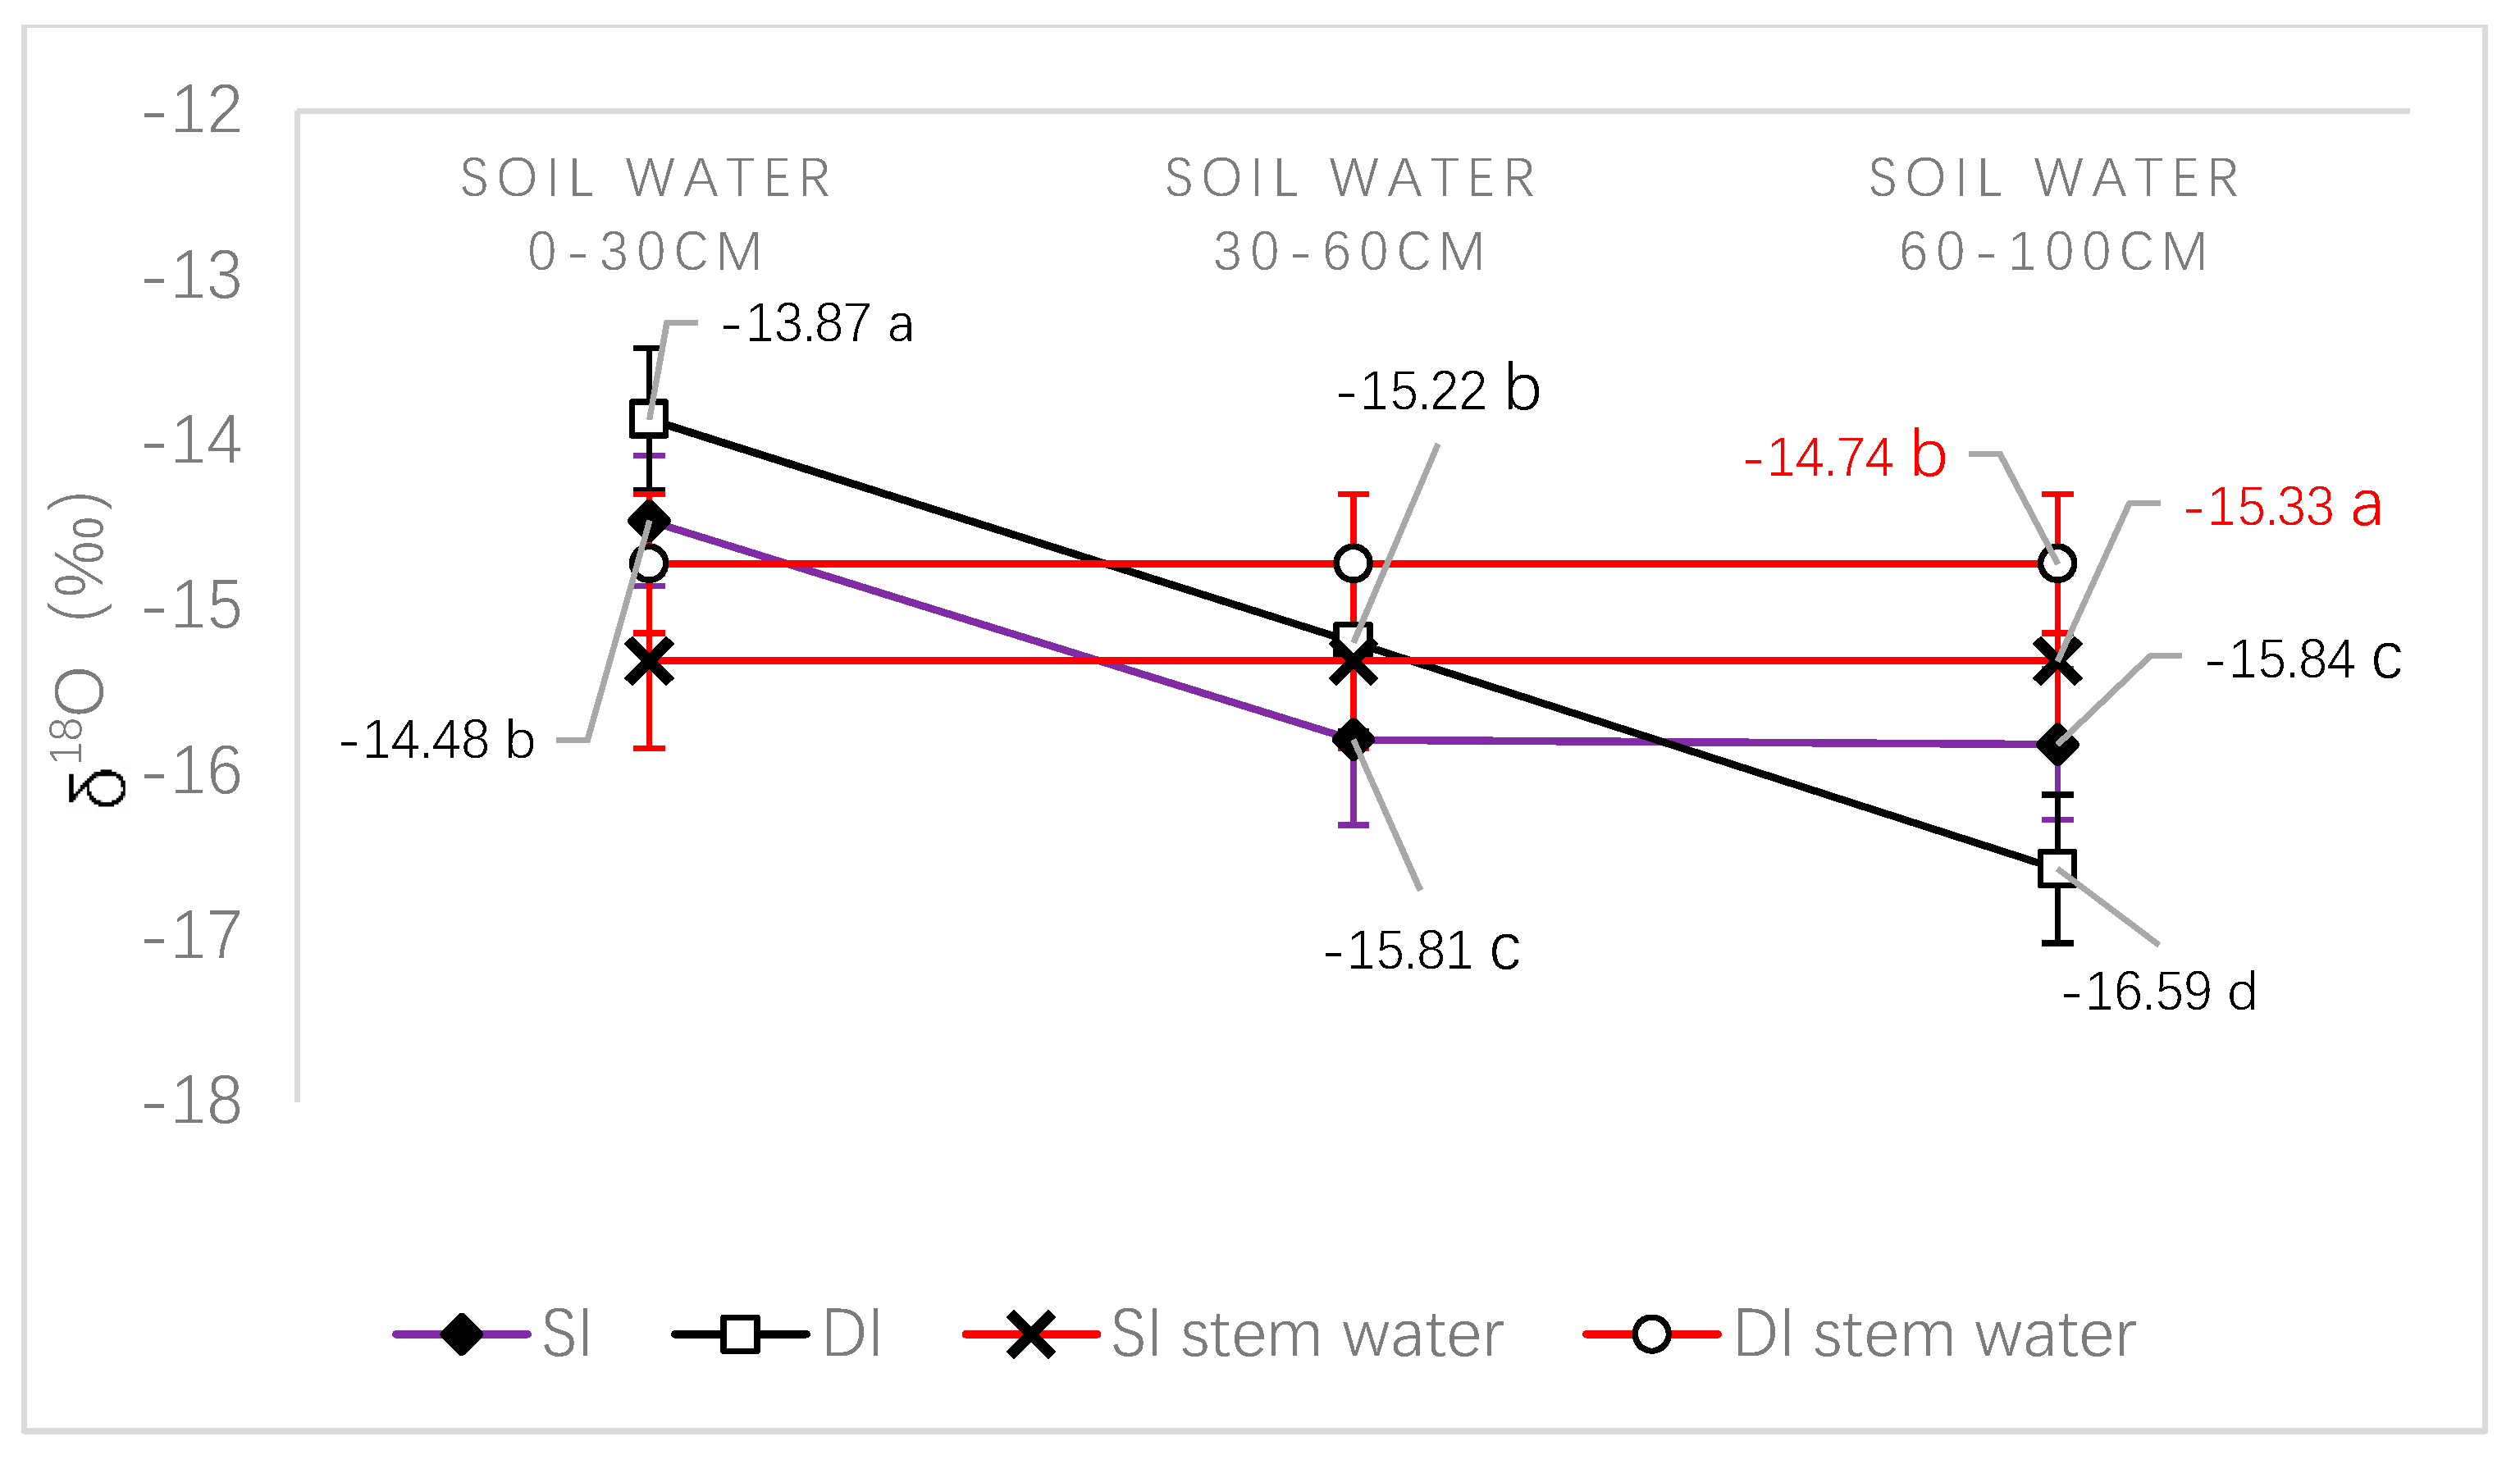
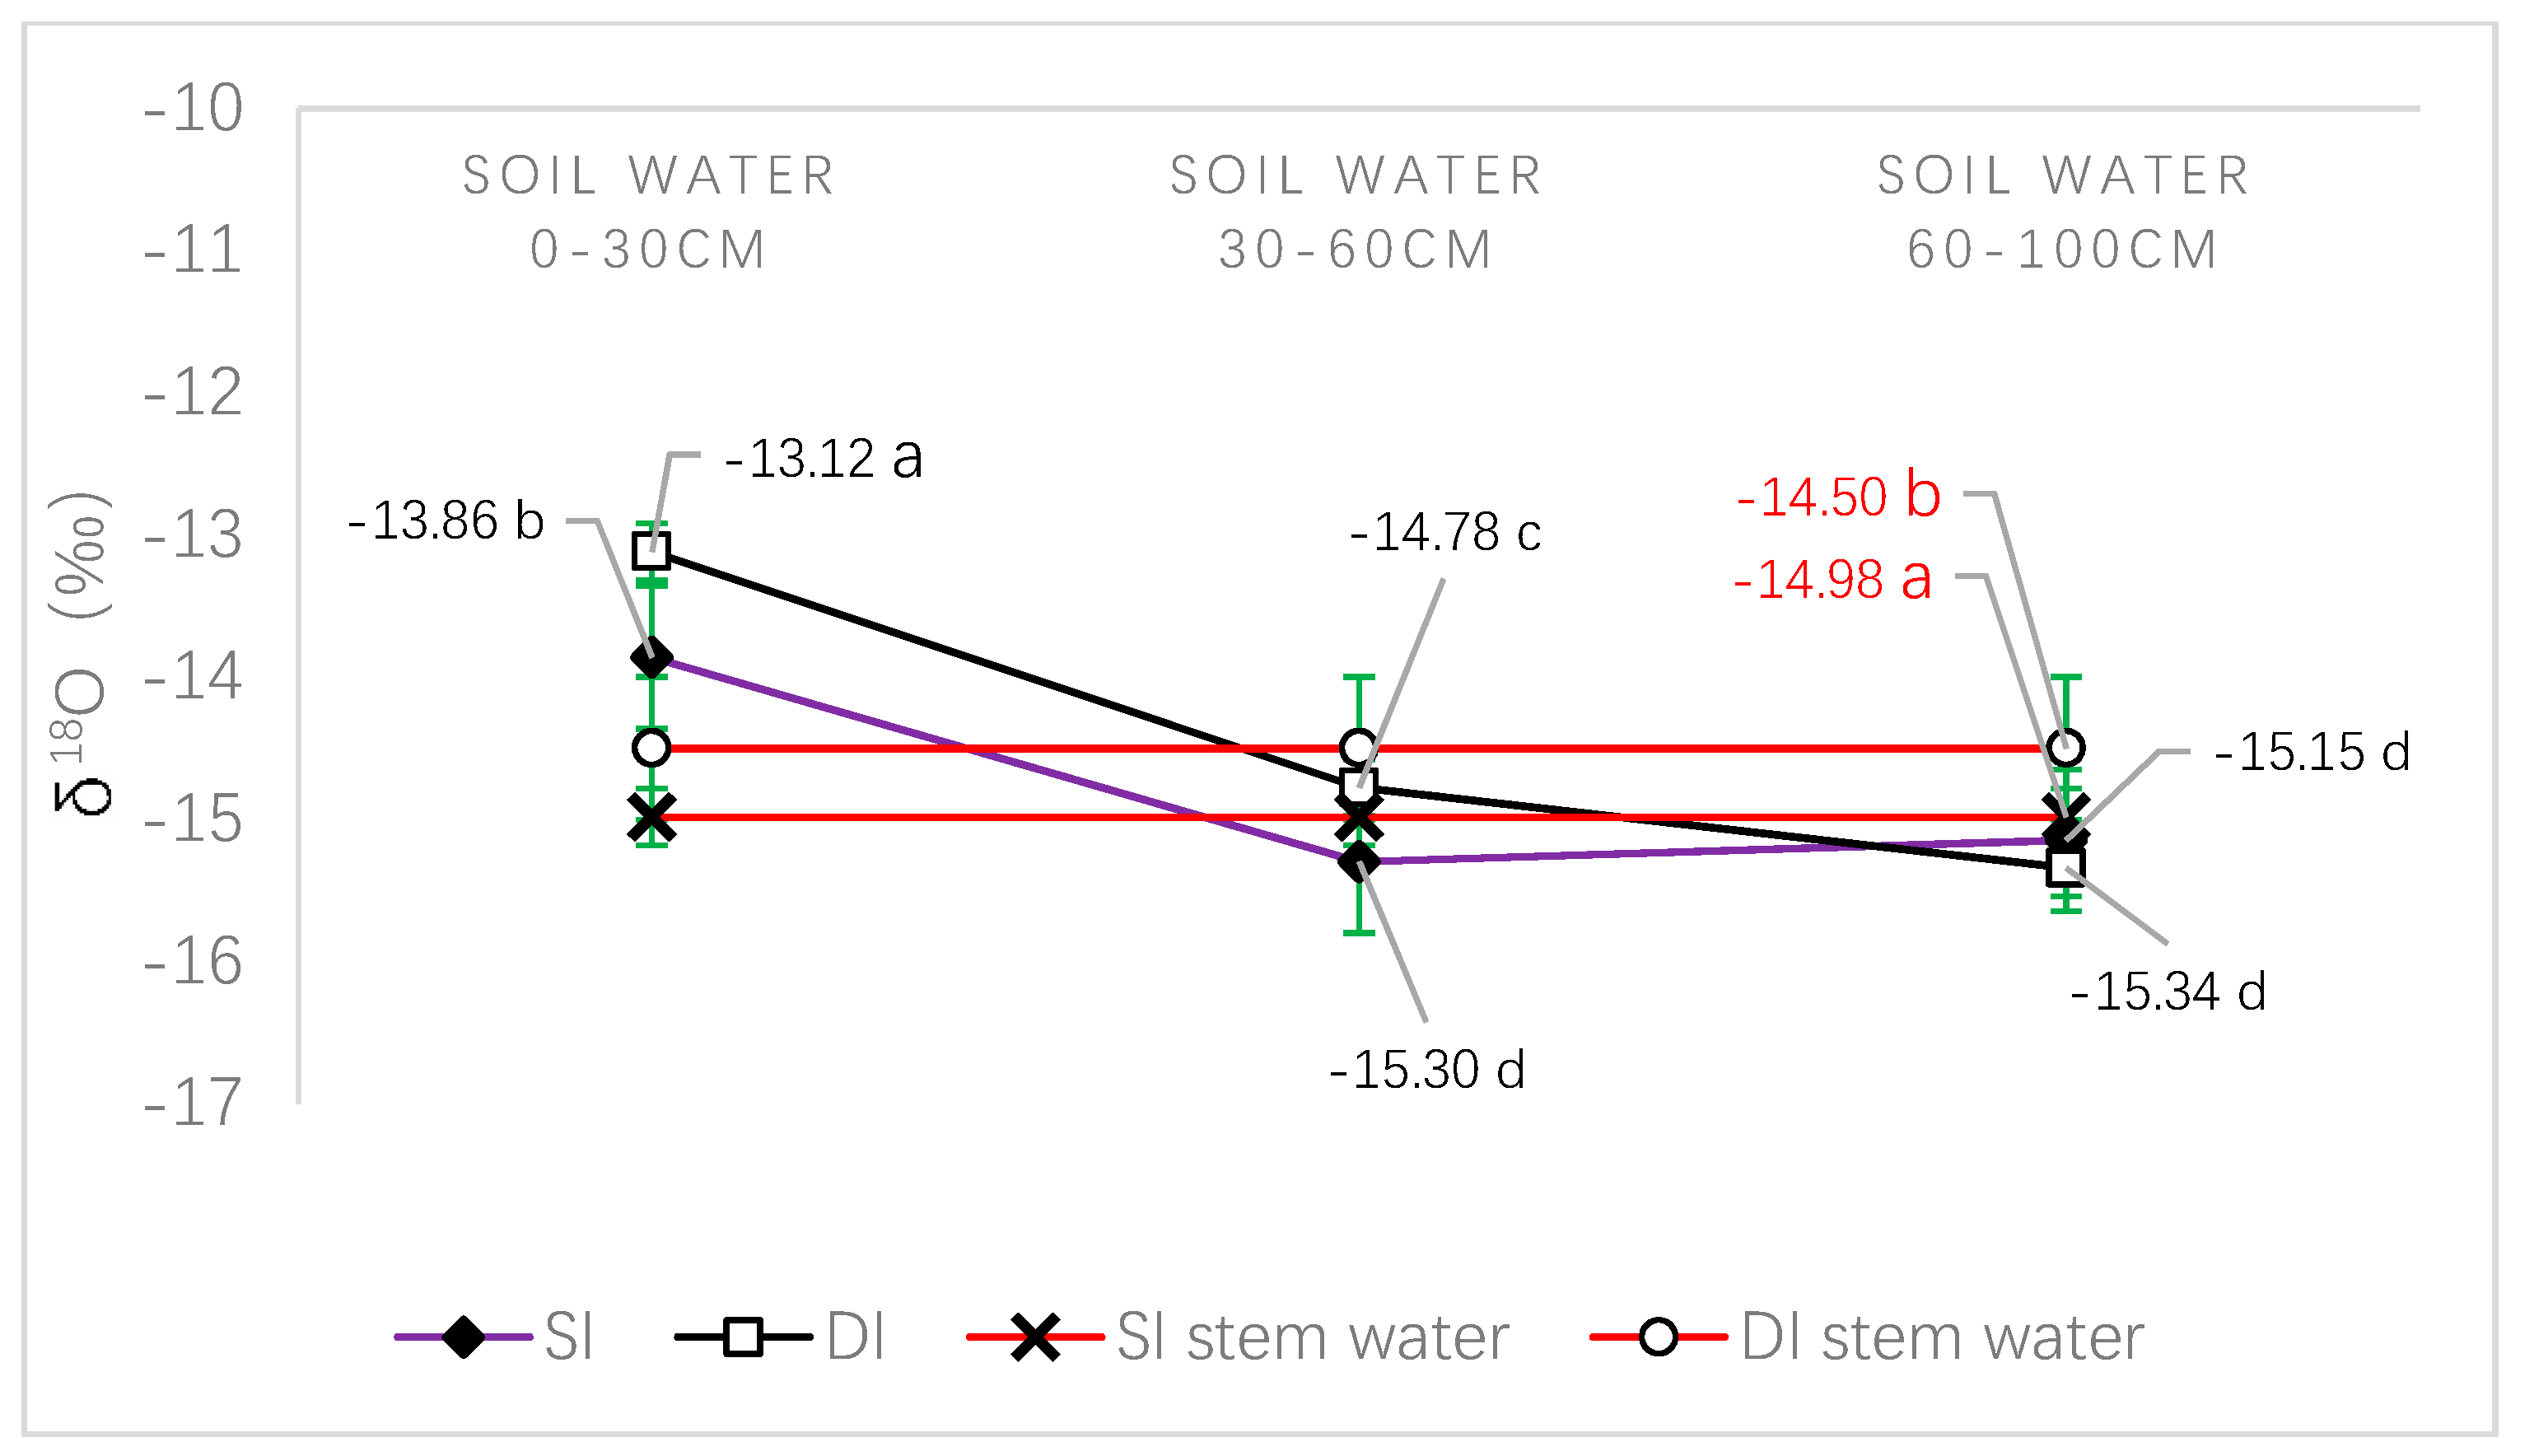
Oxygen isotope content in irrigation water was measured before irrigation. The average δ18O contents of irrigation water in spring and summer were −8.46‰ and −8.20‰. Figure 3 and Figure 4 show the average δ18O contents of the soil water and stem water after different treatments in spring and summer, respectively. The average δ18O contents of the soil water at the difference depths were difference. In spring, there were significant differences in the soil δ18O content at the depths of 0–30 cm and 60–100 cm between the two irrigation treatments. Significant differences were observed in the soil δ18O content at depths of 30–60 cm and in the stem water between the two irrigation treatments. In summer, significant differences between the two irrigation treatments were recorded in the soil δ18O content at depths of 0–30 cm. There were significant differences in the soil δ18O content at depths of 30–60 cm and the stem water between two irrigation treatments. There was no significant differences in the soil δ18O content at depths of 60–100 cm between the two irrigation treatments.
We deduced that the δ18O content of soil water at each layer is related to the irrigation method, irrigation duration, and soil moisture depth. Surface irrigation consumes less time but requires large amounts of water per unit time, which is likely to cause the percolation of water into the deeper soil layers. The δ18O content of irrigation water more strongly influences the increase in δ18O content of water in the deep soil, but has a lesser effect on the increase in δ18O content of water in the shallow soil. By contrast, drip irrigation process takes longer, and the soil wet zone is distributed within the depth of 70 cm. In this case, the δ18O content of irrigation water has little role in the increase in δ18O water content in the deep soil, and has a stronger impact on the increase in δ18O content of water in the shallow soil.
In summary, during the growth stage of cherry trees in spring, the δ18O water content absorbed by cherry roots was similar for both irrigation water and soil water at depths of 0–30 cm. During the growth stage of cherry trees in summer, the δ18O content of water absorbed by cherry roots increased slightly with the increase in δ18O content in soil, but the amount of absorbed water was still dominated by soil water in the soil layer within the depth of 60 cm.
3.2. Contribution of Different Sources of Water to the Water Absorption of Cherry Trees
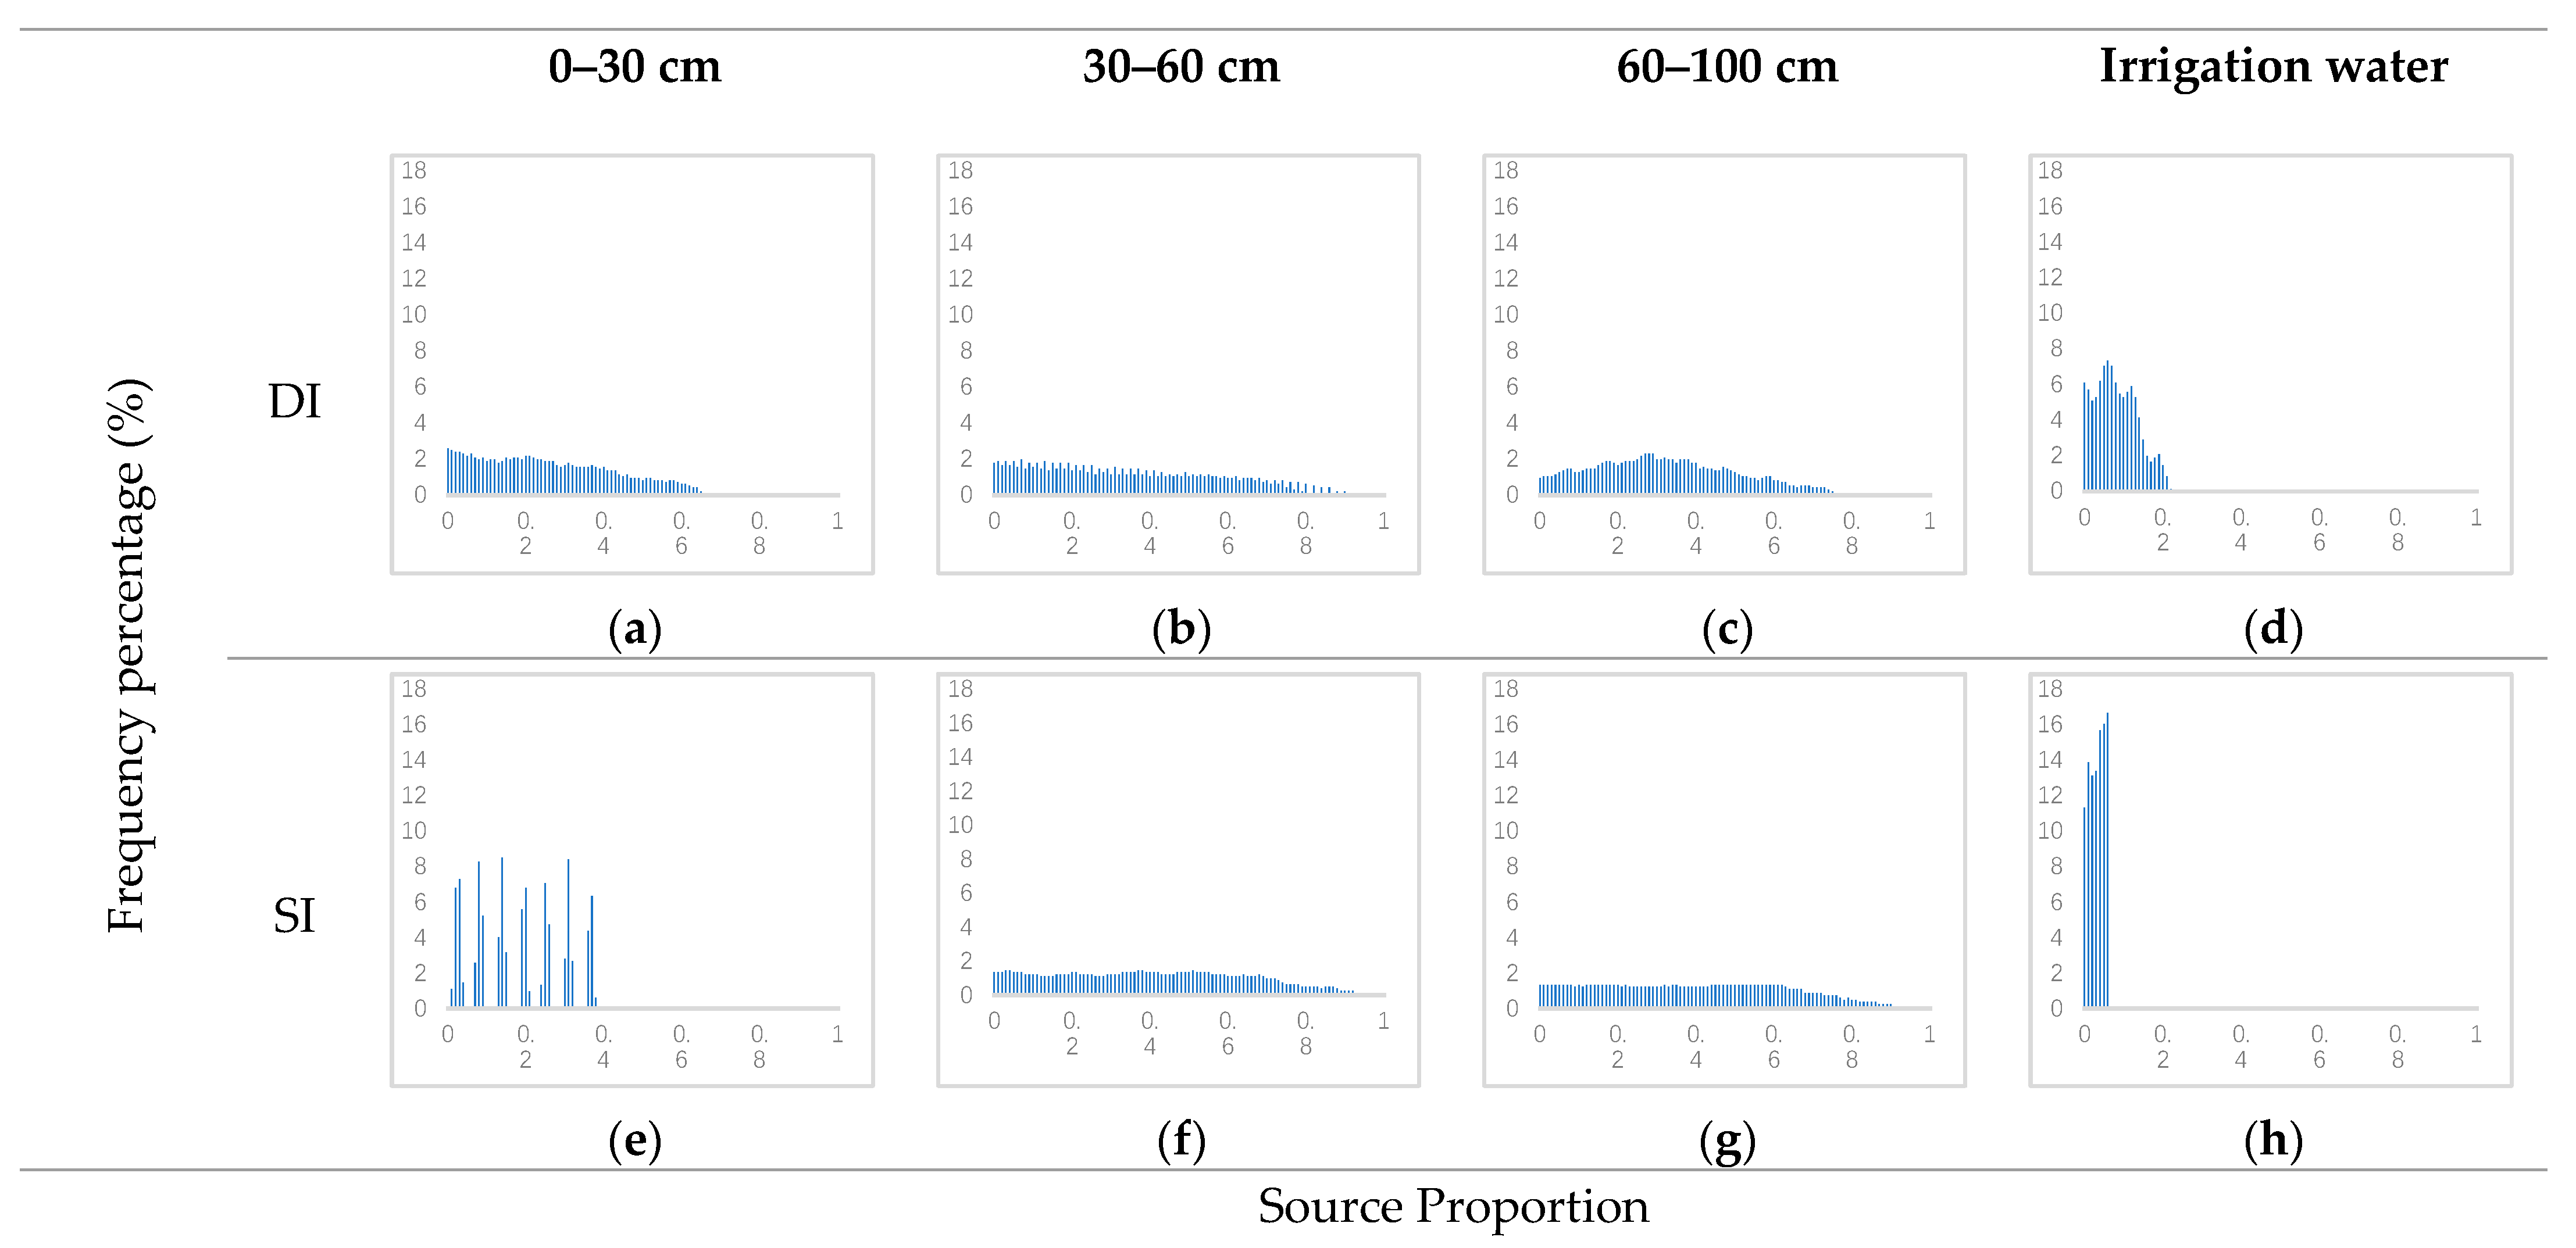
According to the change of δ18O content in soil water specified in the previous section, only the main depth of water absorption in cherry roots can be inferred. Different sources and shares of water absorbed by cherry roots could not be determined. The frequency histograms of the contribution rate of water absorption by cherry roots under different irrigation methods are shown in Figure 5 and Figure 6. During the drought period in spring (also the key period of water consumption of cherry trees), irrigation water was the main source of water absorbed by cherry roots. In the drip irrigation mode, irrigation water accounted for 0–22% (peak 6%) of water absorbed by cherry roots (Figure 5d). The soil water at these depths (0–30 cm, 30–60 cm, and 60–100 cm) provided equal proportions of the total water absorption (Figure 5a–c). In the surface irrigation mode, irrigation water accounted for 0–6% (with a peak of 6%) of water absorbed by cherry roots (Figure 5h). Similar to above, the soil water at the depths of 0–30 cm, 30–60 cm and 60–100 cm also has the same sources of water absorption (Figure 5e–g).
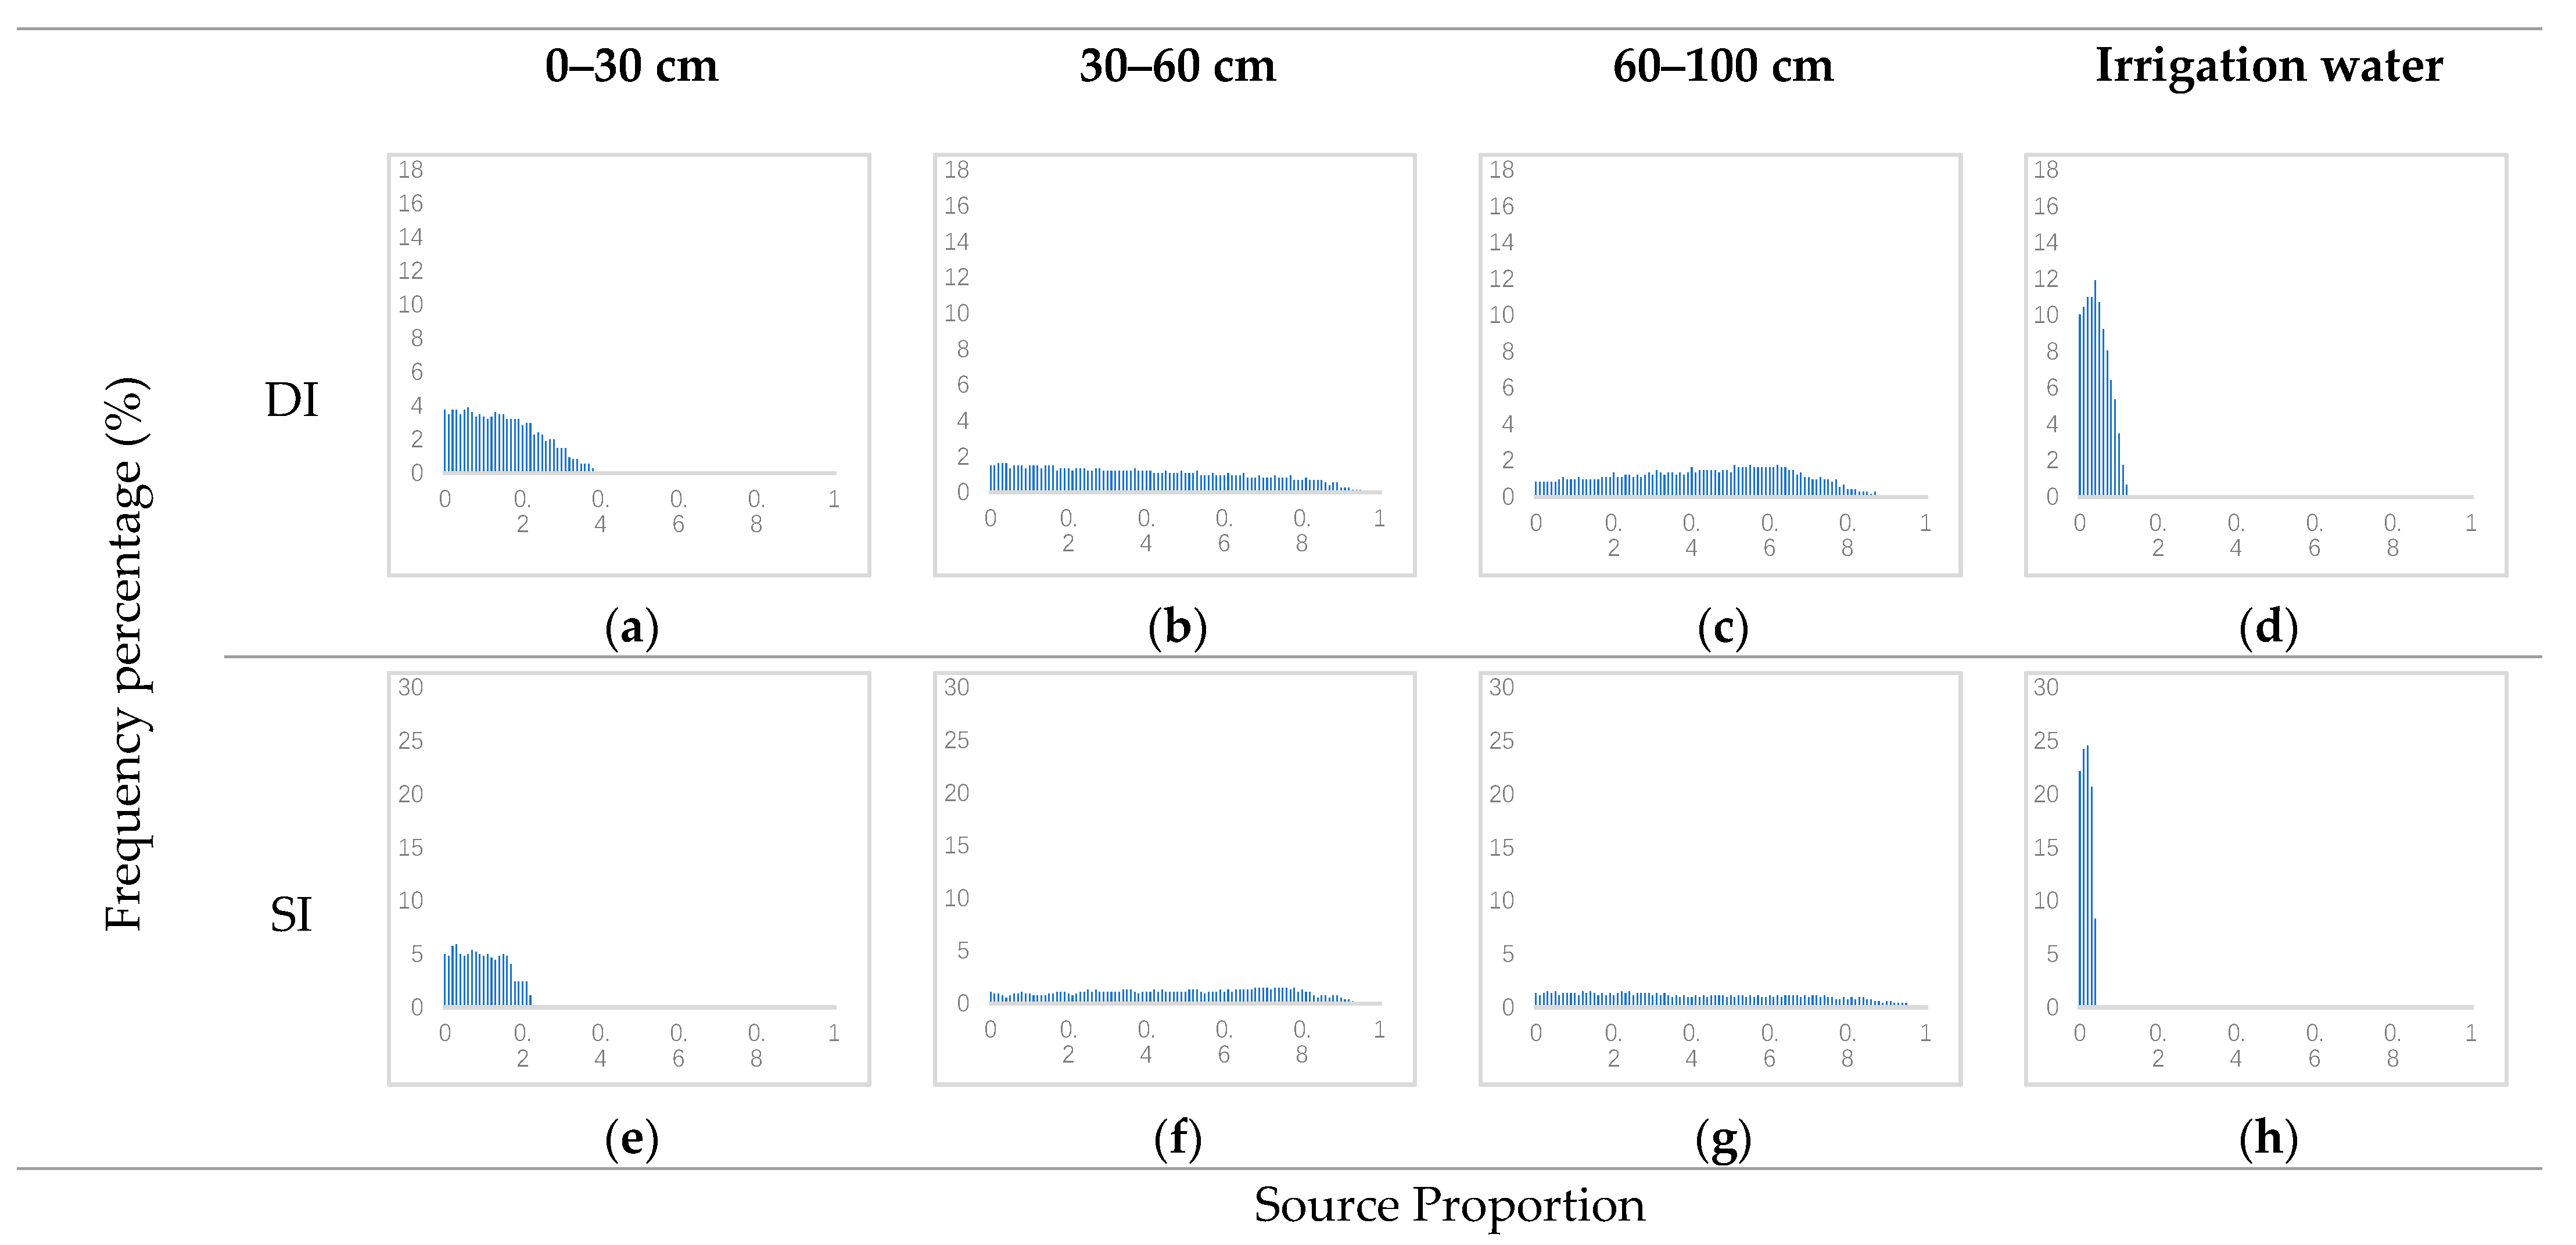
Under drip irrigation in summer, irrigation water accounted for 0–12% (with a peak of 4%) of the total water absorbed by cherry roots (Figure 6d). Again, soil water at these soil depths (0–30 cm, 30–60 cm, and 60–100 cm) provided equal proportions of the total water absorption (Figure 6a–c). Under surface irrigation, the irrigation water and the soil water at depths of 0–30, 30–60, and 60–100 cm contributed equally to the total water absorption.
These results indicate that during the critical period of water consumption in spring, most of the water absorbed by cherry roots was obtained from the irrigation system. When drip irrigation was employed, the share of irrigation water supply increased (compared to that under surface irrigation). This implies that water saving measures enhanced the water absorbed by cherry trees. In summer, cherry roots used a wide range of water absorption sources. In the surface irrigation mode, irrigation water was not the main source of water absorption by cherry roots.
3.3. Vertical Distribution Characteristics of Cherry Roots
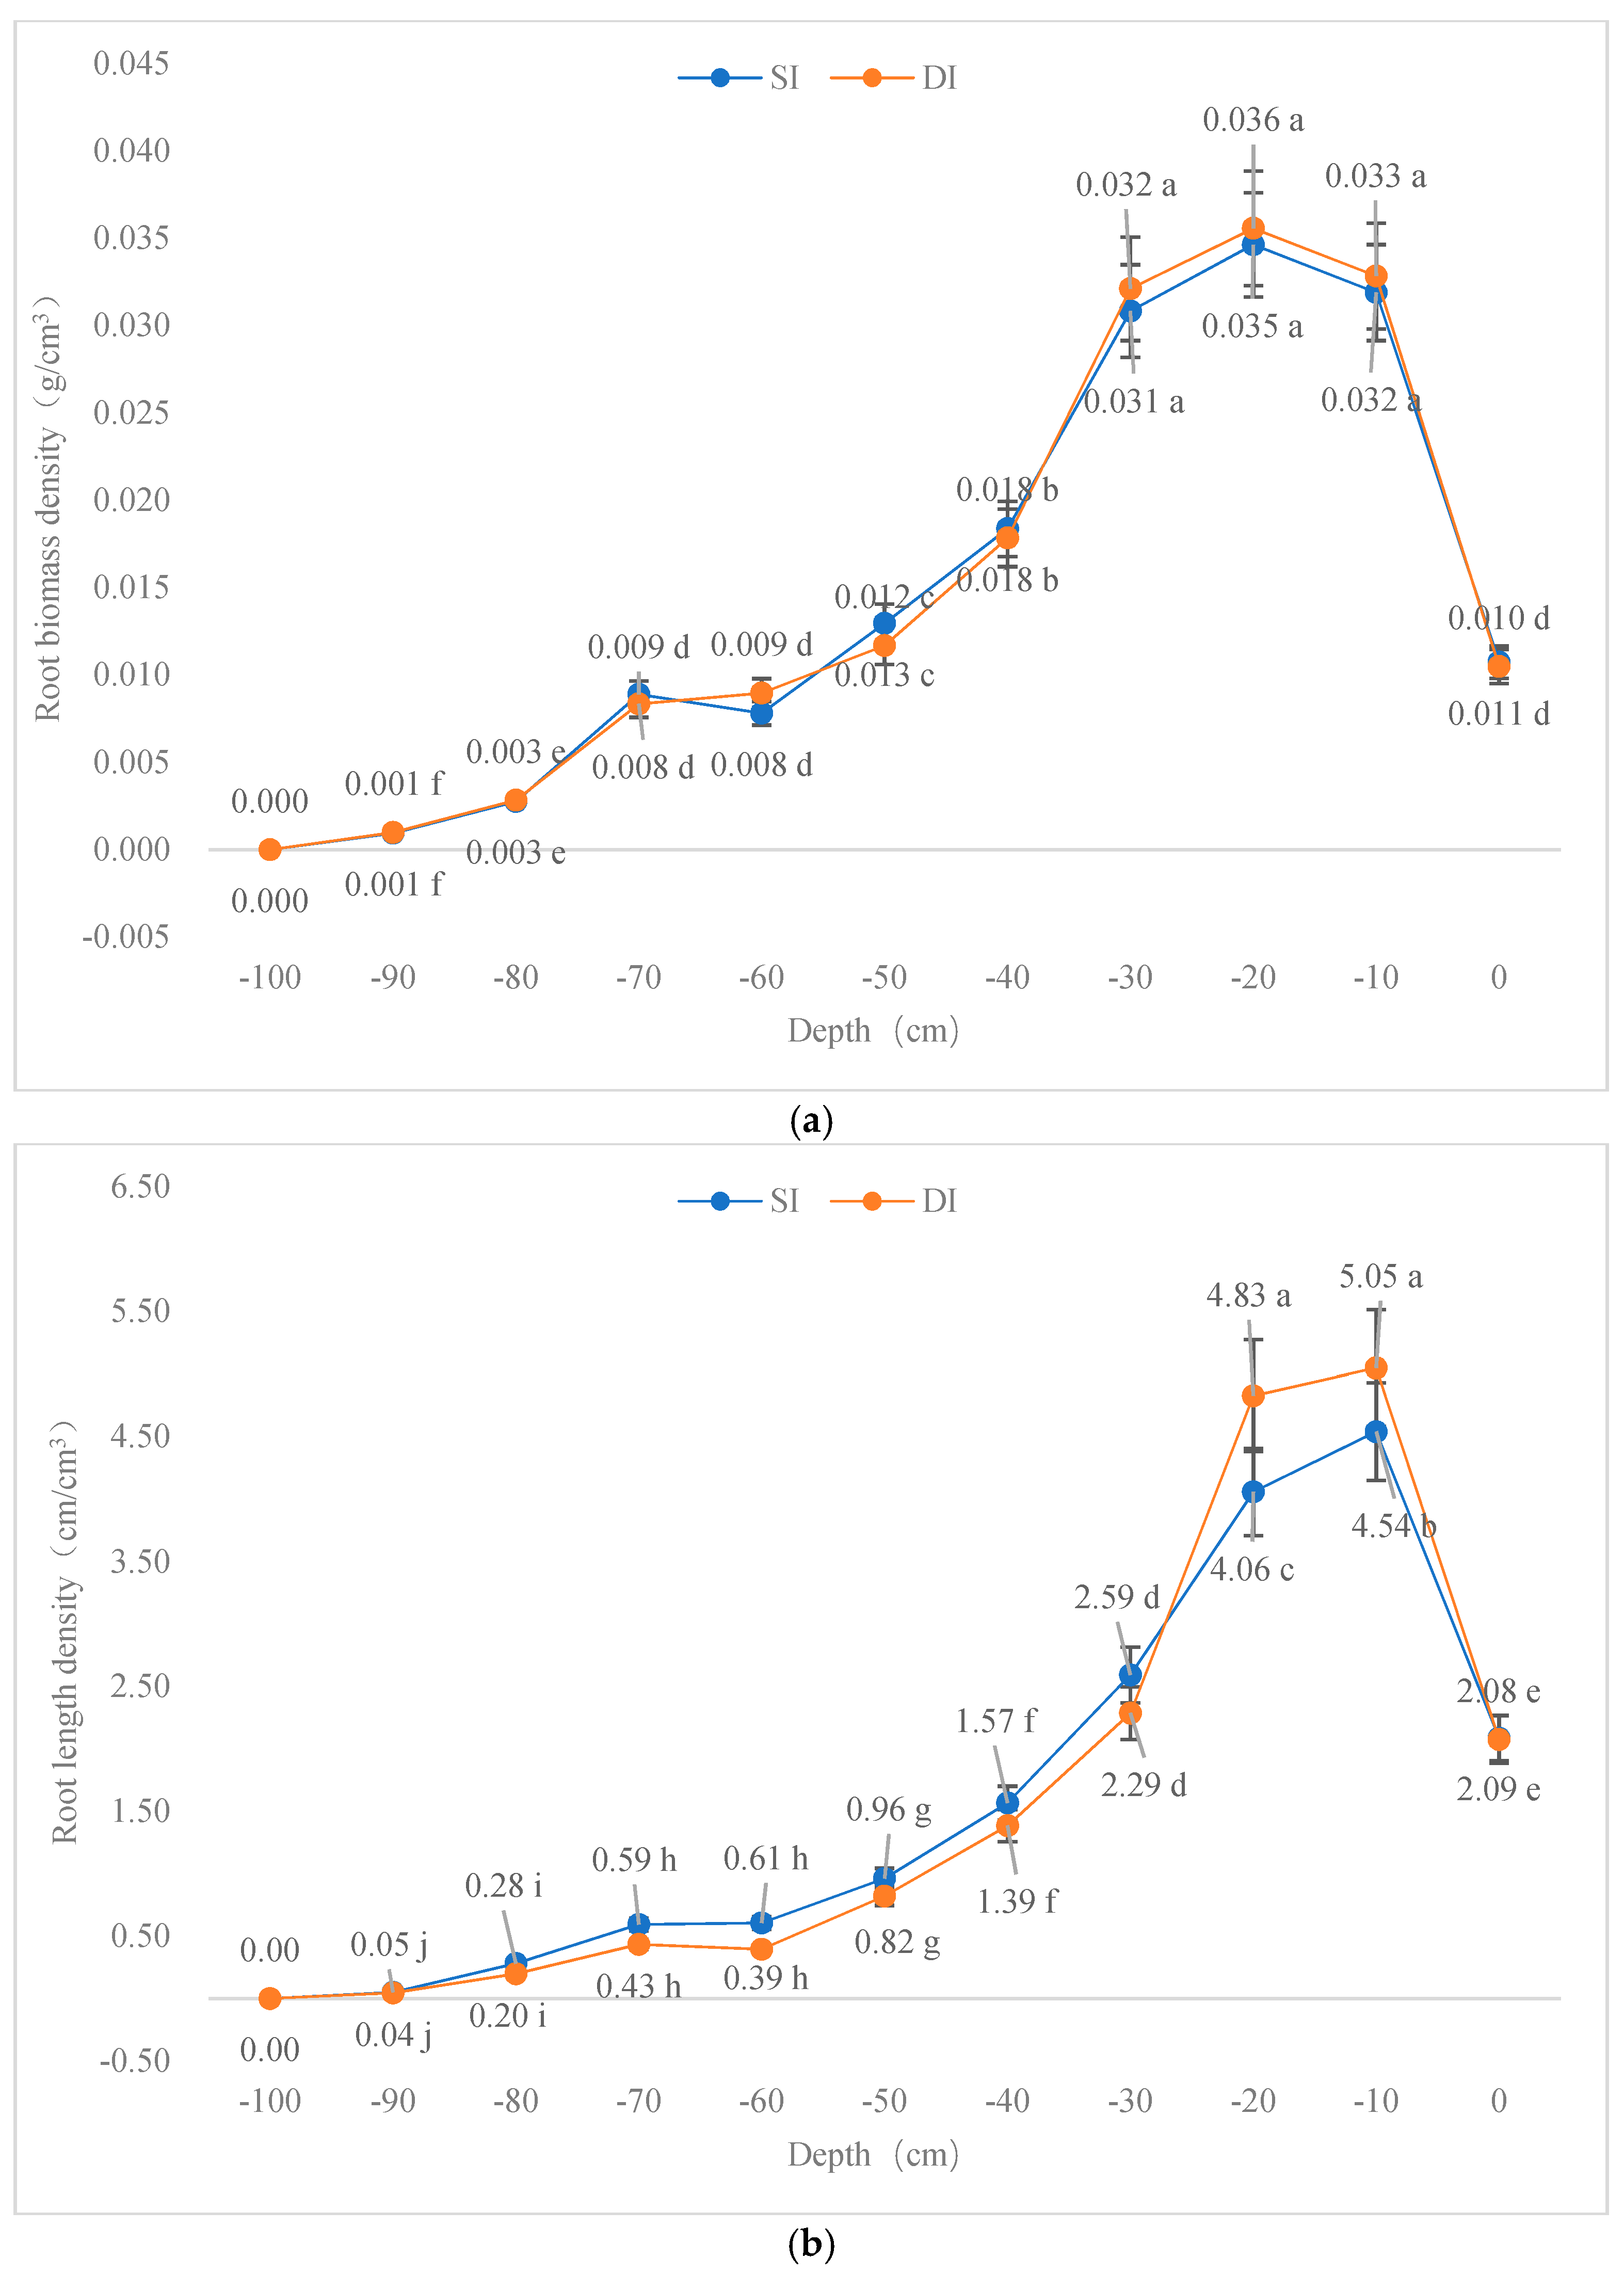
Cherry trees seldom reached a vertical depth of 100 cm, and the main root depth was within the range of 0 to 80 cm at the experimental site. The distributions of average RBD, RLD, RSA and RVR of the cherry trees were highest at around 20-cm deep and decreased with increasing depth (Figure 7). Since the root system of the cherry trees in the orchard within 0 to 10 cm is easily affected by the surroundings, the root system within this depth range grew poorly due to fertilization, weeding, trampling, and strong evaporation from the surface soil. The most densely-distributed root system appeared at the depth range of 10 to 20 cm. The vertical distributions of the four parameters of the root system were basically the same, and the cumulative parameters at the depth range of 0 to 60 cm (0 to 80 cm) accounted for 90% (95%) of the corresponding parameters of the entire root system.
Root distribution is mainly affected by soil depth. The root system indexes in 10–30 cm soil layer differ significantly from those in other soil layers (Figure 7). Compared with drip irrigation, some changes were observed in the distribution characteristics of the root systems of cherry trees. Relative to surface irrigation, drip irrigation increased the RLD in the shallow soil by 18.9% (20 cm) and 11.1% (10 cm), slightly reduced the RLD in the 40–70 cm soil layer, which shows in Figure 7b. Enhanced the RSA in the 20 cm soil layer by 10%, which shows in Figure 7c. Statistical analysis showed that there was no significant difference in RBD and RVR between the two irrigation treatments after two years of experiment, which shows in Figure 7a,d.
3.4. Two-Dimensional Spatial Distribution Characteristics of Cherry Roots
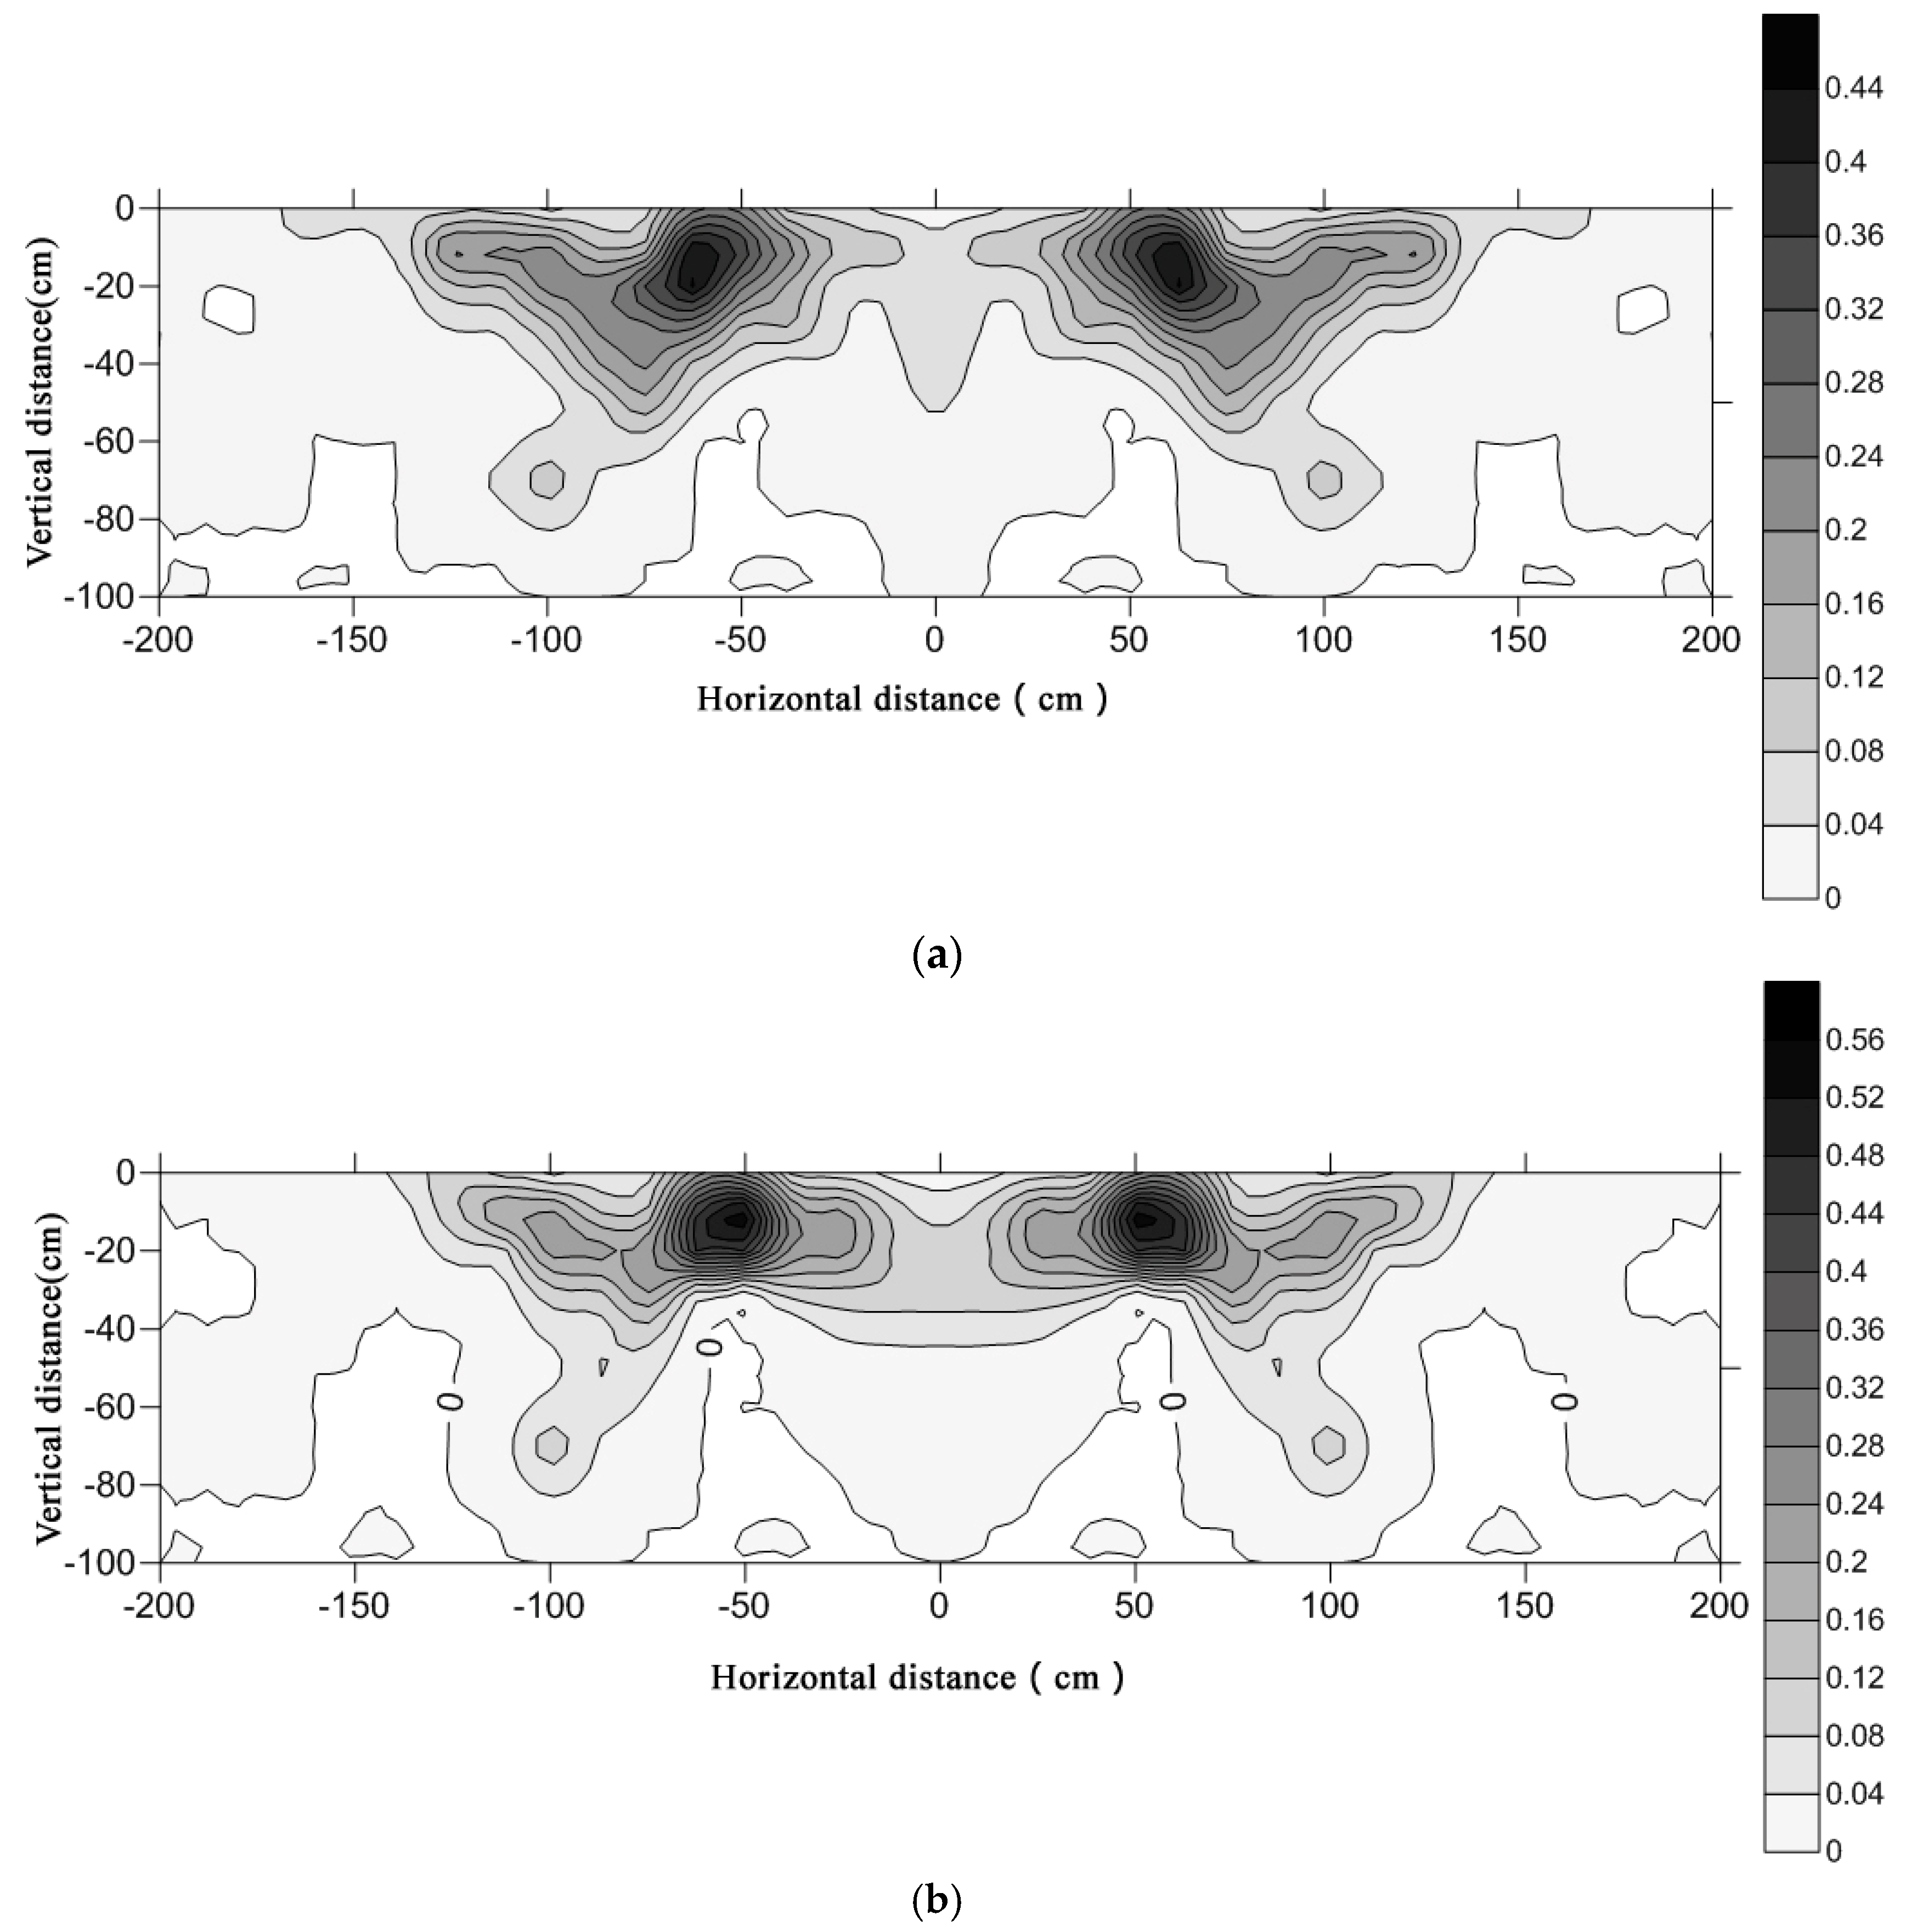
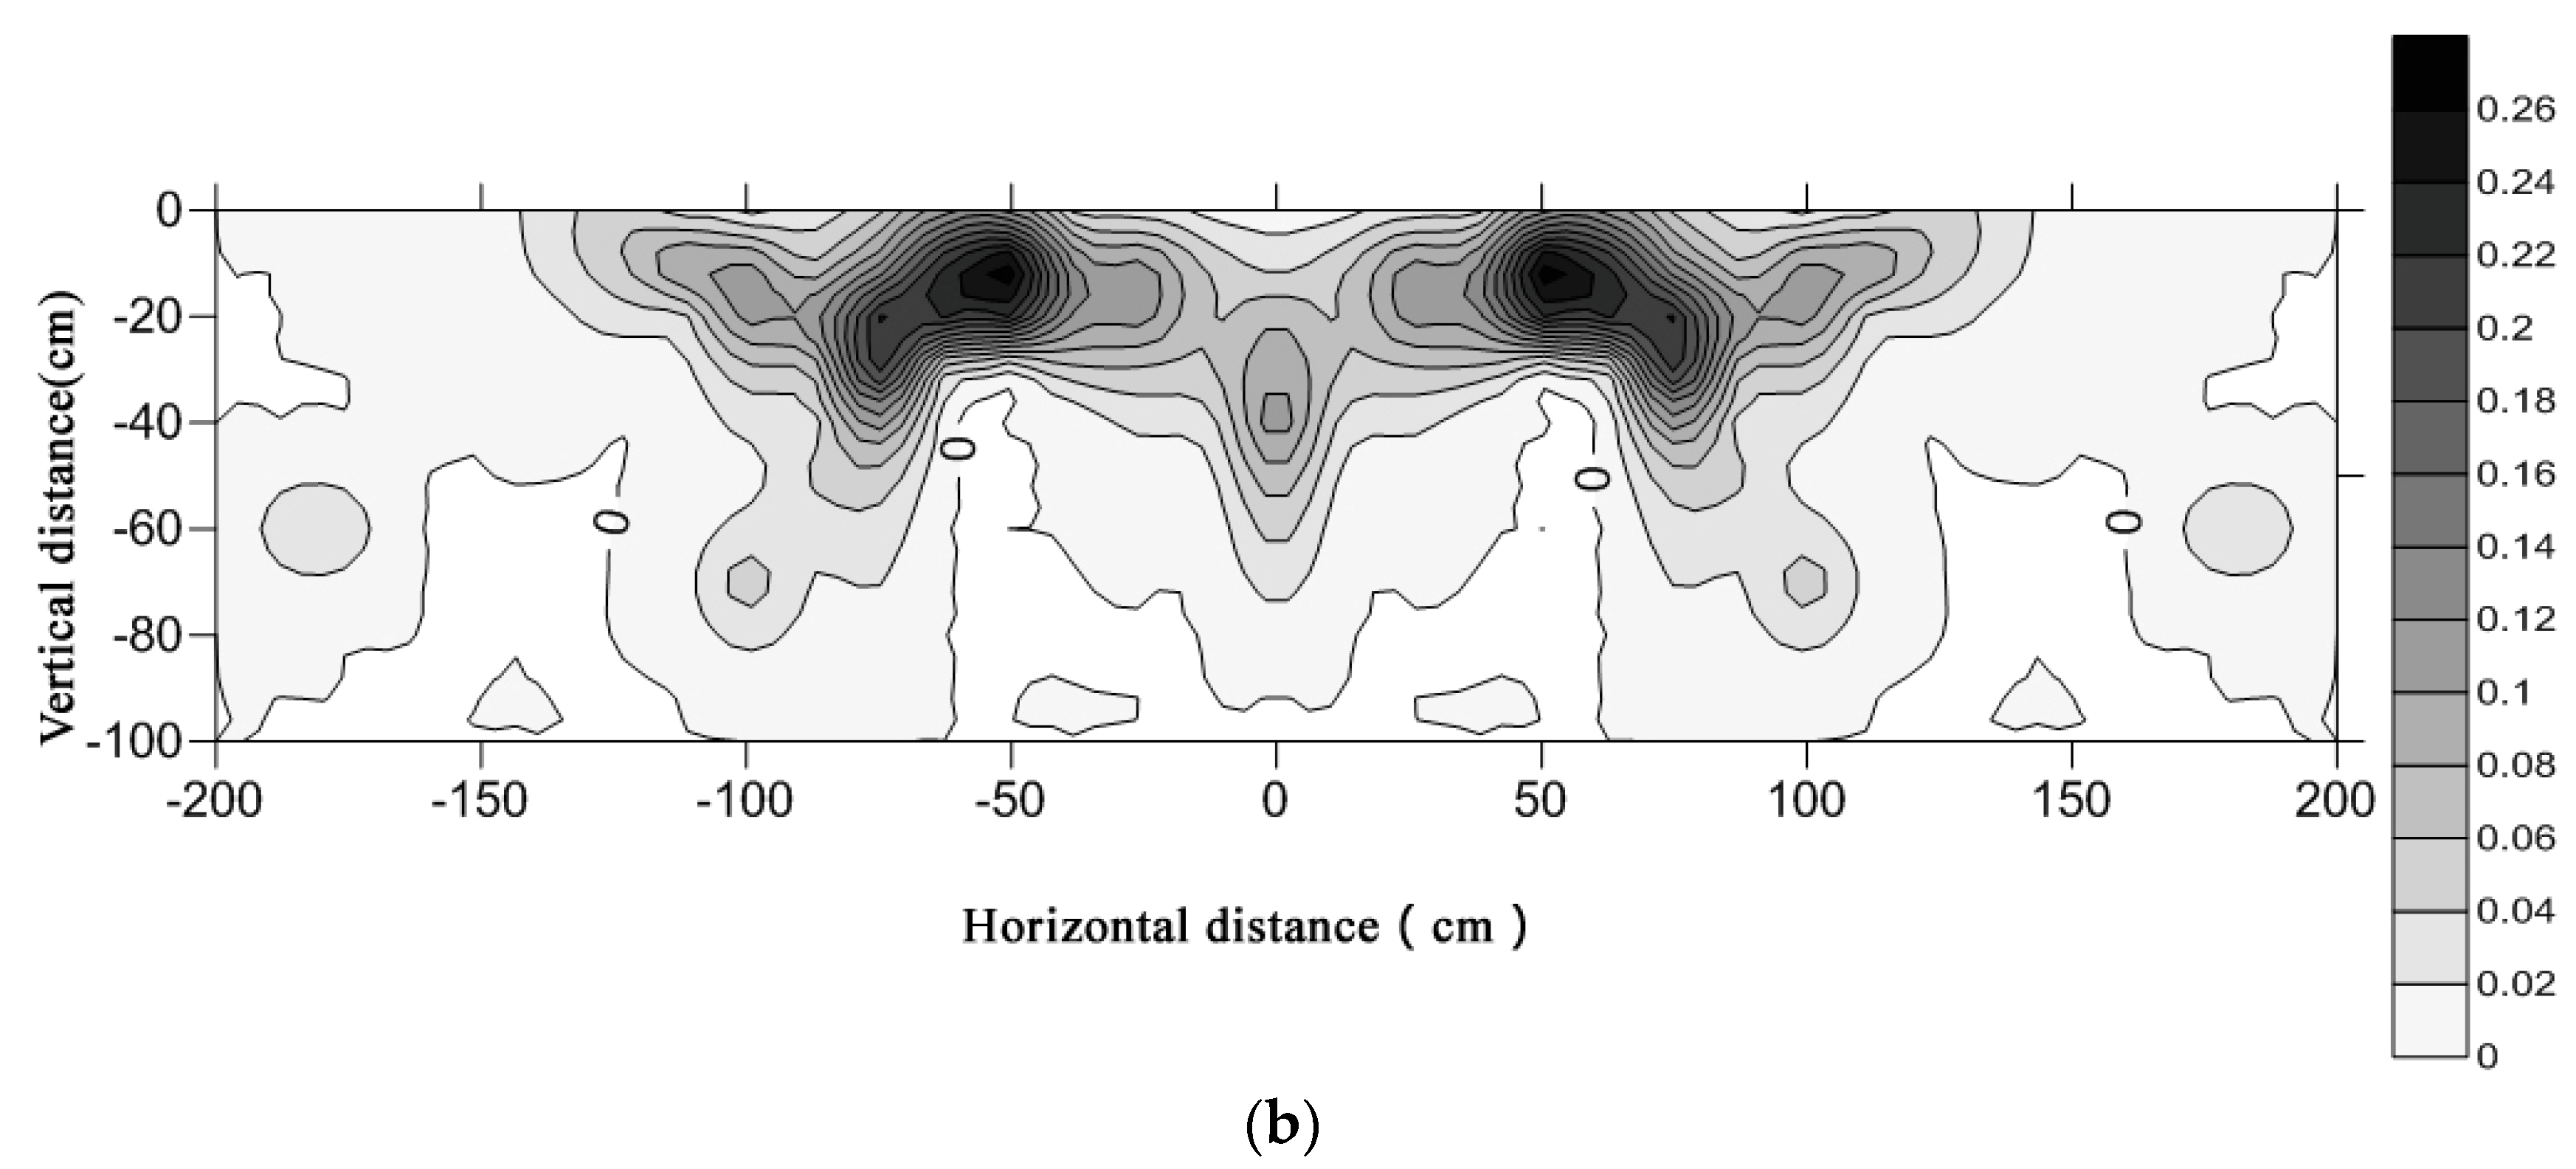
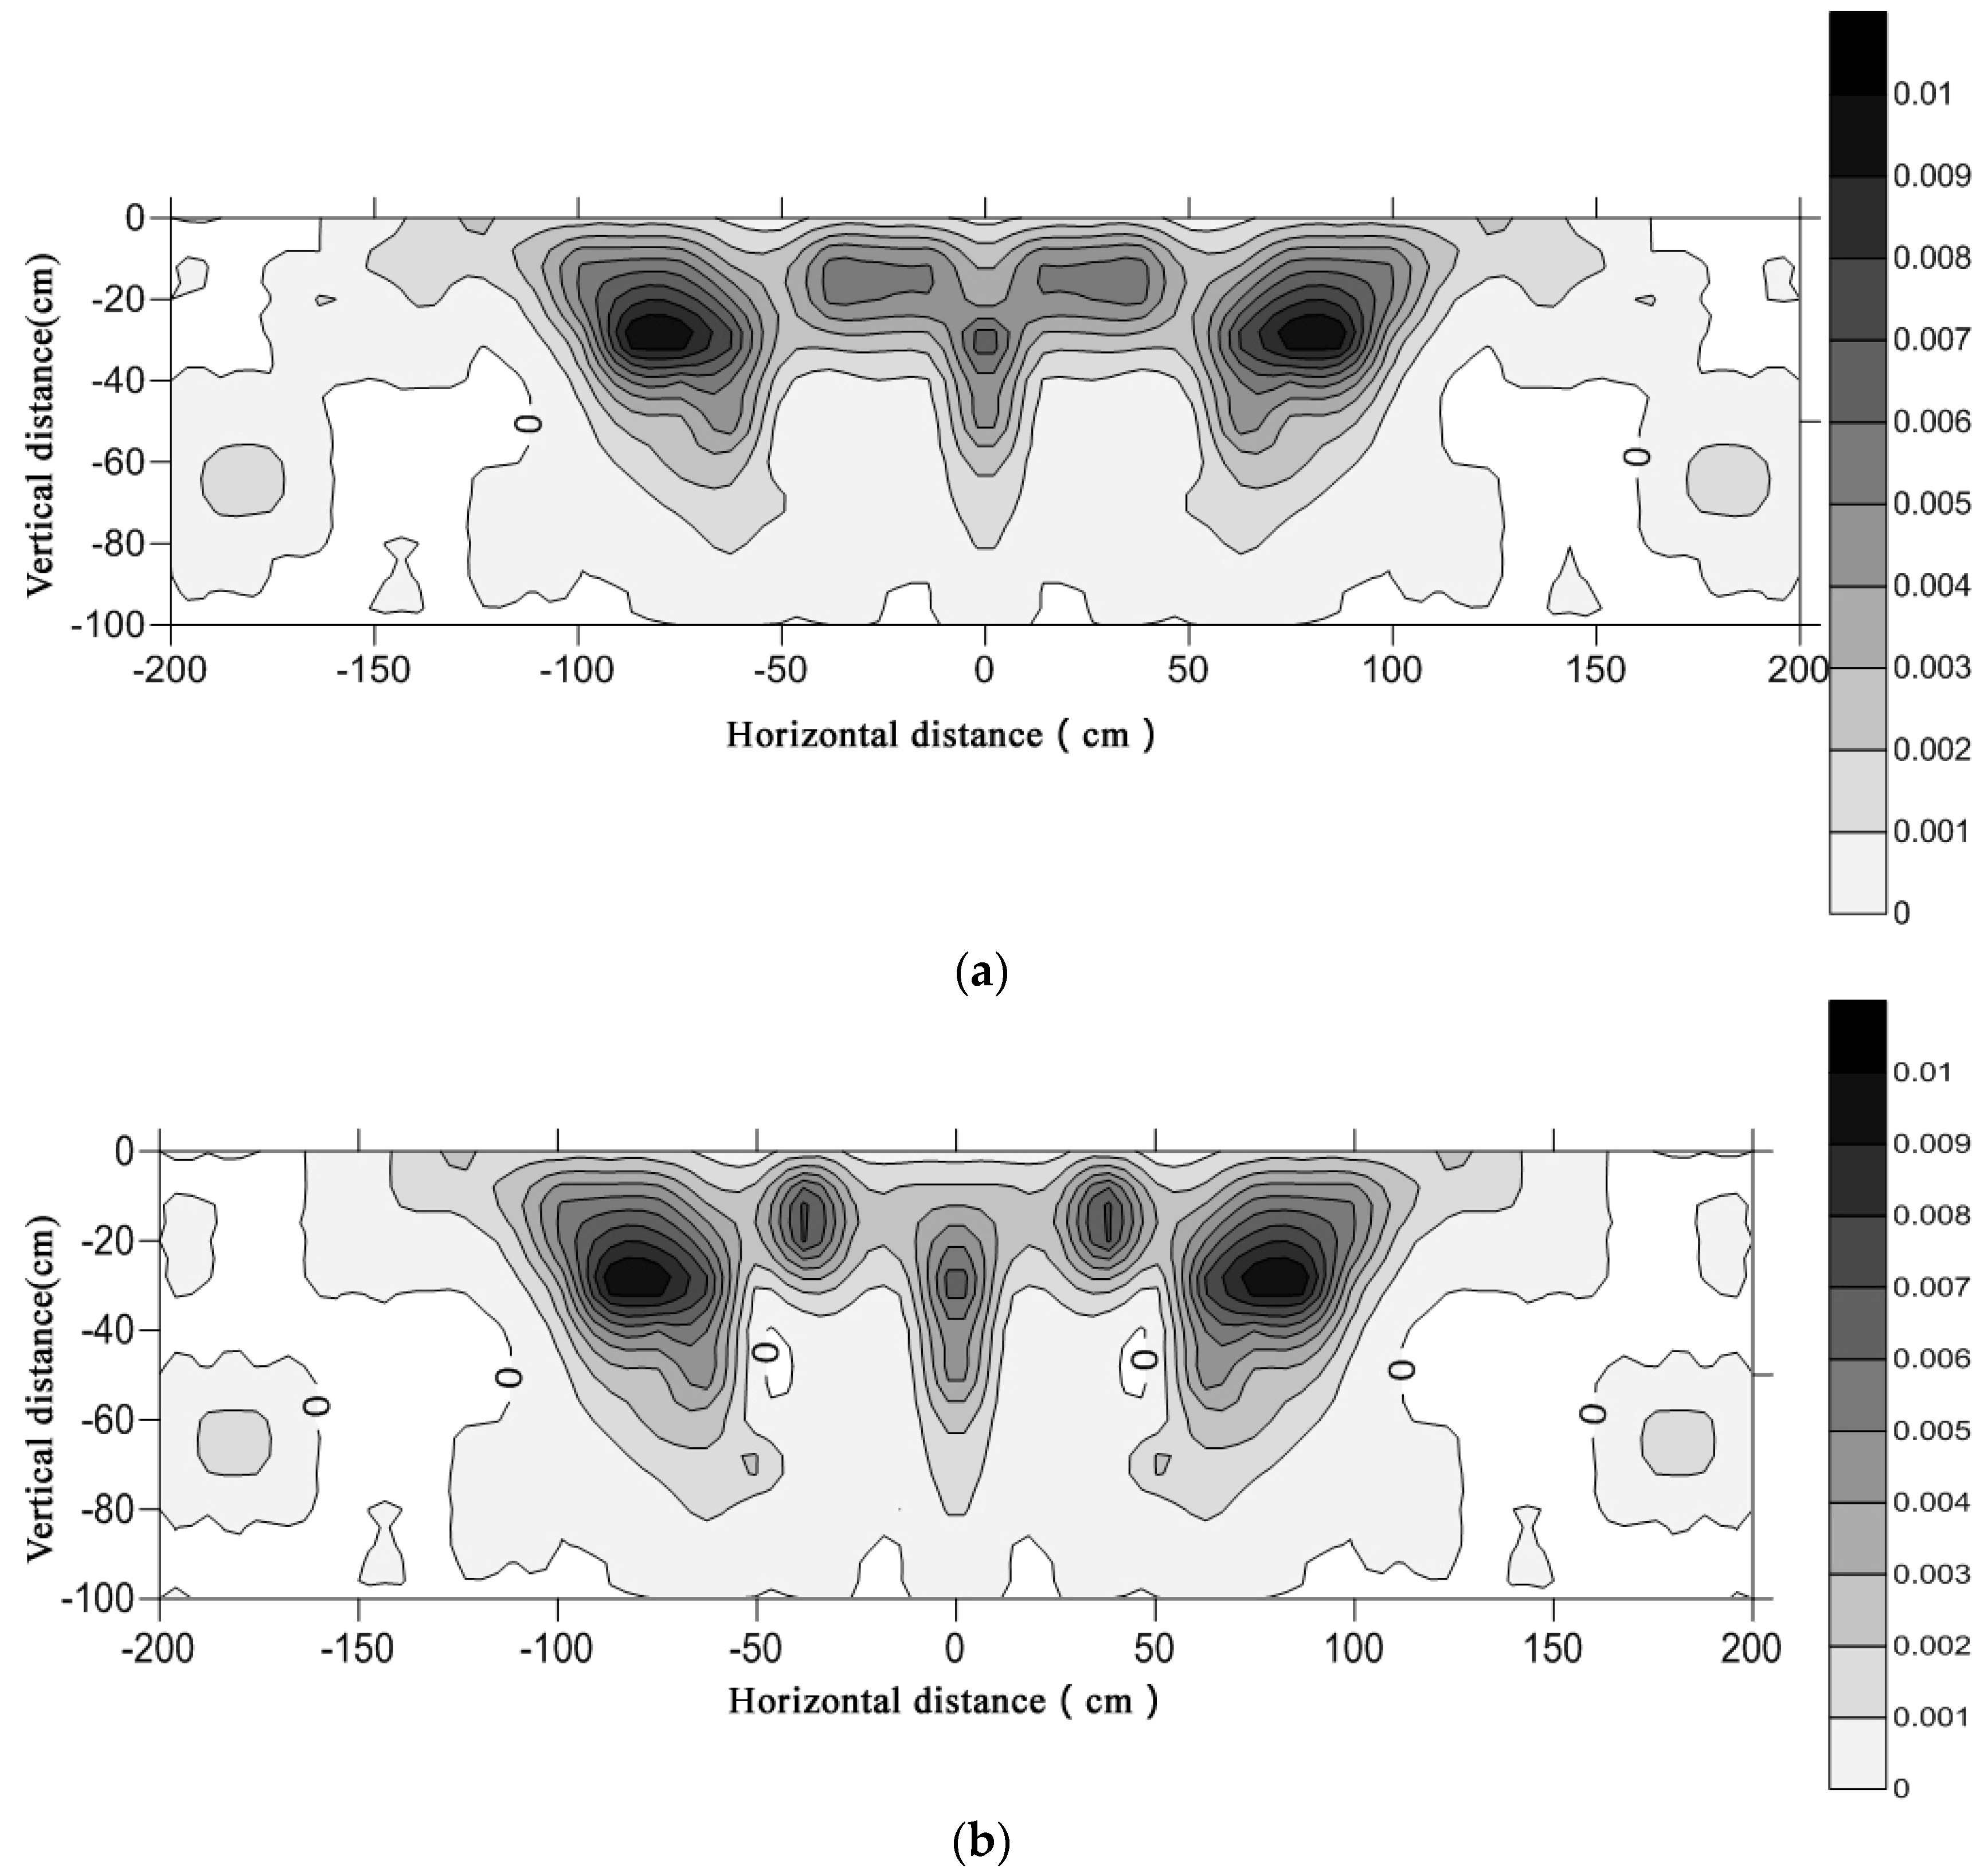
The two-dimensional (2D) distribution of cherry roots (i.e., vertically and horizontally) for each surface irrigation mode further reflects the characteristics of root distribution in the study area. The 2D distributions of the cherry RBD, RLD, RSA, and RVR are shown in Figure 8, Figure 9, Figure 10 and Figure 11, respectively. These results demonstrate that the root system was mainly concentrated within the radius of 30–100 cm in the horizontal direction, in relation to the wet zone under the surface irrigation. More than 85% of cherry roots were distributed in the horizontal radius range of 0 to 100 cm and in the vertical depth of 0–80 cm. Above 95% of cherry roots were distributed in the horizontal radius of 0–150 cm and vertical depths of 0–80 cm.
RLD and RSA are important indicators of root water uptake. Compared with the RLD and RSA distribution under surface irrigation shows in Figure 9a and Figure 10a. Under drip irrigation, RLD and RSA distribution results show that the root system more concentrated within the radius of 30–100 cm in the horizontal direction, which was related to the wet zone under the drip irrigation shows in Figure 9b and Figure 10b. Beyond 85% of cherry roots were distributed in the space with the horizontal radius range of 0 to 100 cm and the vertical depths of 0–70 cm, whereas more than 95% of cherry roots were distributed in the space with the horizontal radius of 0–150 cm and vertical depths of 0–80 cm. Hence, drip irrigation is suitable for a shallow-root plant species like cherry trees. Surface irrigation results in water wastage and nutrient loss. According to the distribution range of the RLD and RSA shows in Figure 9 and Figure 10, high water-use efficiency is achievable using drip irrigation if the wet layer appears at the depth of 0–60 cm and the horizontal wet zone is within the radius range of 100 cm from the trunk.
4. Discussion
The results of our studies showed that the effects of different irrigation methods on oxygen isotope content in different layers of soils vary with seasons. The reason for this finding is that under different irrigation methods, irrigation water and soil water at each growth stage contribute differently to the water absorbed by cherry roots. Cherry trees mainly absorbed irrigation water in spring. Irrigation water use with dripping irrigation was more efficient than that for surface irrigation. Drip irrigation promotes the absorption of irrigation water by cherry roots. Beijing’s climate is generally dry during spring. In the early growth stage of cherry trees, drip irrigation was applied, which benefited the cherry growth and the effective use of irrigation water. Our findings align with those reported by Cao et al. [19] and Bertrand et al. [6].
In summer, cherry roots used a wide range of water absorption sources. Compared to the surface irrigation mode, drip irrigation more efficiently used water resources. Under the surface irrigation mode, irrigation water was not the main source of water absorption by cherry roots. The reason for this finding is that in summer, cherry grows slowly and requires less water. Root parameters, such as root zone index or physiological activity of shallow roots, generally decrease with increasing root depth [16]. In this period, the decline in the use rate of irrigation water might be due to the abundance of rainfall during the rainy season, which increased the soil moisture content of the surface soil. After rainfall and irrigation, the water absorption capacity of the lateral roots in the surface soil was greatly activated. The surface soil water from rainfall basically met the water requirements for cherry growth, and the soil water replaced the irrigation water as the main source of water absorption. Every layer of soil water acts as sources of water absorption by cherry roots, and the benefit of water-saving irrigation measures was reduced accordingly, which is similar other published results [14,34]. In this circumstance, drip irrigation should be applied to reduce the deep migration caused by surface irrigation and avoid the development of the root system into the deeper soil layers [39].
The root parameters of cherry trees irrigated under surface and drip irrigation were compared. After two years of experiments, we found that drip irrigation significantly improved RLD in shallow soil. For shallow soil, the RVR changed to some extent, but not significantly. The two-year test showed little effect of irrigation system on RVR and RBD. To investigate the reason for this finding, we examined the following. The 2D distribution of roots on the soil profile was analyzed to describe the changes in soil moisture and nutrient uptake, which play important roles in the calculation and prediction of root water absorption and nutrient absorption. The root distribution has high plasticity and is sensitive to changes in external factors [40,41]. Compared with surface irrigation, drip irrigation would cause the irrigation to concentrate in the shallow soil or middle soil. Since cherry is a shallow root plant, micro-irrigation should be implemented more often. The horizontal humidification range would ensure high water-use efficiency within 100 cm of the trunk. The adoption of drip irrigation would improve the water use efficiency and produce water saving effects.
5. Conclusions
Different irrigation methods have different effects on the average δ18O content of soil water in the soil profile. The δ18O content of irrigation water has little effect on the increase in δ18O content in the deep soil water but has a greater impact on the increase in δ18O content in the shallow soil. δ18O content of soil water at each layer is related to the irrigation method, irrigation duration, and soil moisture depth.
The IsoSource model was applied to calculate the contribution rate of water absorption by cherry roots under different irrigation methods. During the drought period in spring (also the key period of water consumption of cherry trees), irrigation water was the main source of water absorbed by cherry roots. Under drip irrigation, the share of irrigation water supply increased compared to that under surface irrigation. In summer, cherry roots were able to access more sources of water. Relative to the surface irrigation mode, drip irrigation more efficiently uses irrigation water. Under surface irrigation, irrigation water was not the main source of water absorbed by cherry roots.
Root distribution is mainly affected by soil depth. The root system indexes in 10–30 cm soil layer differ significantly from those in other soil layers. Drip irrigation increased the RLD and RSA in the shallow soil. There was no significant difference in RBD and RVR between the two irrigation treatments.
The 2D distribution of cherry roots under these irrigation methods show that cherry root systems seldom reached a depth of 100 cm, and the main root length was within depths of 0–80 cm. The distributions of RBD, RLD, RSA and RVR of the cherry roots at each layer generally decreased with increasing depth. As the root system in the surface layer at a depth range of 0 to 20 cm was quite sensitive to its surroundings. Compared with surface irrigation, drip irrigation makes RLD and RSA more concentrated in the horizontal range of 30–100 cm and vertical range of 0–70 cm.
Author Contributions
Data curation, H.T. and J.W.; Investigation, X.C.; Supervision, P.Y.; Writing—original draft, P.L.
Funding
The National Natural Science Foundation of China: 51679239; National Science and Technology Support Program: 2014BAD12B06; Beijing Science and Technology Committee: D151100004115003.
Conflicts of Interest
The authors declare no conflicts of interest.
References
- Bohm, W. Methods of Studying Root Systems; Ecological Series No. 33; Springer: Berlin, Germany, 1979. [Google Scholar]
- Williamson, J.G.; Coston, D.C.; Cornell, J.A. Root restriction affects shoot development of peach in a high-density orchard. J. Am. Soc. Hortic. Sci. 1992, 117, 362–367. [Google Scholar] [CrossRef]
- Parker, M.L.; Meyer, J.R. Peach tree vegetative and root growth respond to orchard floor management. Hortscience 1996, 31, 330–333. [Google Scholar] [CrossRef]
- Shi, H.; Liu, S.; Zhao, X. Application of stable hydrogen and oxygen isotope in water circulation. Chin. J. Soil Water Conserv. 2003, 17, 163–166. [Google Scholar]
- Sun, S.; Huang, J.; Lin, G.; Zhao, W.; Han, X. Application of stable isotope technique in the study of plant water use. Chin. J. Acta Ecol. Sin. 2005, 25, 2362–2371. [Google Scholar]
- Bertrand, G.; Masini, J.; Goldscheider, N.; Meeks, J.; Lavastre, V.; Celle-Jeanton, H.; Gobat, J.M.; Hunkeler, D. Determination of spatiotemporal variability of tree water uptake using stable isotopes (δ18O, δ2H) in an alluvial system supplied by a high-altitude watershed, Pfyn forest, Switzerland. Ecohydrology 2014, 7, 319–333. [Google Scholar] [CrossRef]
- Chimner, R.A.; Cooper, D.J. Using stable oxygen isotopes to quantify the water source used for transpiration by native shrubs in the San Luis Valley, Colorado USA. Plant Soil 2004, 260, 225–236. [Google Scholar] [CrossRef]
- Xu, Q.; Li, H.; Chen, J.; Cheng, X.; Liu, S.; An, S. Water use patterns of three species in subalpine forest, Southwest China: The deuterium isotope approach. Ecohydrology 2011, 4, 236–244. [Google Scholar] [CrossRef]
- Zencich, S.J.; Froend, R.H.; Turner, J.V.; Gailitis, V. Influence of groundwater depth on the seasonal sources of water accessed by Banksia tree species on a shallow, sandy coastal aquifer. Oecologia 2002, 131, 8–19. [Google Scholar] [CrossRef] [PubMed]
- Ehlers, W.; Hamblin, A.P.; Tennant, D. Root system parameters determining water uptake of field crops. Irrig. Sci. 1991, 12, 115–124. [Google Scholar] [CrossRef]
- Allison, G. The relationship between 18O and deuterium in water in sand columns undergoing evaporation. J. Hydrol. 1982, 55, 163–169. [Google Scholar] [CrossRef]
- Dawson, T.E.; Pate, J.S. Seasonal water uptake and movement in root systems of Australian phraeatophytic plants of dimorphic root morphology: A stable isotope investigation. Oecologia 1996, 107, 13–20. [Google Scholar] [CrossRef] [PubMed]
- Flanagan, L.; Ehleringer, J. Stable isotope composition of stem and leaf water: Applications to the study of plant water use. Funct. Ecol. 1991, 5, 270–277. [Google Scholar] [CrossRef]
- Du, T.; Kang, S.; Zhang, J. Water-saving and crop quality improvement of alternate partial root-zone irrigation and application of isotope technology in the research of crop water use. Chin. J. Plant Physiol. J. 2011, 47, 823–830. [Google Scholar]
- Thorburn, P.J.; Ehleringer, J.R. Root water uptake of field-growing plants indicated by measurements of natural-abundance deuterium. Plant Soil 1995, 177, 225–233. [Google Scholar] [CrossRef]
- Wang, P.; Song, X.; Han, D.; Zhang, Y.; Liu, X. A study of root water uptake of crops indicated by hydrogen and oxygen stable isotopes: A case in Shanxi Province, China. Agric. Water Manag. 2010, 97, 475–482. [Google Scholar] [CrossRef]
- Yano, K.; Sekiya, N.; Samson, B.K.; Mazid, M.; Yamauchi, A.; Kono, Y.; Wade, L.J. Hydrogen isotope composition of soil water above and below the hardpan in a rainfed lowland rice field. Field Crops Res. 2006, 96, 477–480. [Google Scholar] [CrossRef]
- Yang, S.; Liu, H.; Hao, Z.; Wu, W. Spatial distribution characteristics of cherry tree roots under border irrigation condition. Chin. J. Tran. CSAE 2009, 25 (Suppl. 1), 34–38. [Google Scholar]
- Cao, X.; Yang, P.; Bernard, A.E.; Li, P. The effects of rainfall and irrigation on cherry root water uptake under drip irrigation. Agric. Water Manag. 2018, 197, 9–18. [Google Scholar] [CrossRef]
- Black, B.L.; Drost, D.; Lindstrom, T.; Reeve, J.; Gunnell, J.D.; Reighard, G.L. A Comparison of root distribution patterns among prunus rootstocks. J. Am. Pomol. Soc. 2010, 64, 52–62. [Google Scholar]
- Oskamp, J.; Batjer, L.P. Soils in Relation to Fruit Growing in New York. II. Size, Production and Rooting Habit of Apple Trees on Different Soil Types in the Hilton and Morton Areas, Monroe County; Cornell University Agricultural Experiment Station: Ithaca, NY, USA, 1932. [Google Scholar]
- Kolesnikov, V. The Root System of Fruit Plants; Mir Publishers: Moscow, Russia, 1971. [Google Scholar]
- Atkinson, D.; Wilson, S.A. The growth and distribution of fruit tree roots: Some consequences for nutrient uptake. In Proceedings of the Acta Horticulturae ISHS: Symposium on Mineral Nutrition and Fruit Quality of Temperate Zone Fruit Trees, Canterbury, UK, 1–7 April 1980; Volume 92, pp. 137–150. [Google Scholar]
- Atkinson, D. The growth, activity and distribution of the fruit tree root system. Plant Soil 1983, 71, 23–35. [Google Scholar] [CrossRef]
- Gliński, J.; Lipiec, J.; Stępniewski, W. Plant Roots and Soil Physical Factors; Chesworth, W., Ed.; Encyclopedia of Soil Science; Springer: Berlin/Heidelberg, Germany, 2008. [Google Scholar]
- Lipiec, J.; Nosalewicz, A.; Pietrusiewicz, J. Crop Responses to soil physical conditions. In Encyclopedia of Agrophysics; Gliński, J., Horabik, J., Lipiec, H., Eds.; Springer: Dordrecht, The Netherlands; Heidelberg, Germany; London, UK; New York, NY, USA, 2011. [Google Scholar]
- Yao, S.; Merwin, I.A.; Brown, M.G. Apple root growth, turnover, and distribution under different orchard groundcover management systems. Hortscience 2009, 44, 168–175. [Google Scholar] [CrossRef]
- Liang, Y.; Gao, S.R.; Bo, C.P.; Yang, Y.; Wang, S.W.; Pan, C.D.; Chen, G.A. Spatial distribution characteristics of absorbing roots of apricot trees in the intercropping systems. Xinjiang Agric. Sci. 2011, 48, 821–825. [Google Scholar]
- Paltineanu, C.; Septar, L.; Gavat, C.; Chitu, E.; Iancu, M.; Oprita, A.; Moale, C.; Lamureanu, G.; Calciu, I.; Stroe, V.M. Spatial distribution of apricot roots in a semi-arid environment. Agrofor. Syst. 2015, 90, 469–478. [Google Scholar] [CrossRef]
- Paltineanu, C.; Septar, L.; Gavat, C.; Chitu, E.; Oprita, A.; Moale, C.; Calciu, I.; Vizitiu, O.; Lamureanu, G. Charac-terizing root density of peach trees in a semi-arid chernozem to increase plant density. Int. Agrophys. 2016, 30, 67–74. [Google Scholar] [CrossRef]
- Ceausescu, I.; Negrila, A.; Isac, I.; Lazar, A. Fruit Growing; Publishing House Ceres: Bucharest, Romania, 1982. (In Romanian) [Google Scholar]
- Asbjornsen, H.; Mora, G.; Helmers, M.J. Variation in water uptake dynamics among contrasting agricultural and native plant communities in the Midwestern US. Agric. Ecosyst. Environ. 2007, 121, 343–356. [Google Scholar] [CrossRef]
- Li, X.; Yang, P.; Ren, S.; Li, Y.; Liu, H.; Du, J.; Li, P.; Wang, C.; Ren, L. Modeling cherry orchard evapotranspiration based on an improved dual-source model. Agric. Water Manag. 2010, 98, 12–18. [Google Scholar] [CrossRef]
- Wu, Y.; Du, T.; Li, F.; Li, S.; Ding, R.; Tong, L. Quantification of maize water uptake from different layers and root zones under alternate furrow irrigation using stable oxygen isotope. Agric. Water Manag. 2016, 168, 35–44. [Google Scholar] [CrossRef]
- Wang, L.; Ma, Y.; Zhao, J.; Hong, M.; You, L. Simulation of Effective Roots Distribution of Walnut Tree under Drip Irrigation Condition in Arid Area. Water Sav. Irrig. 2013, 10, 17–20. [Google Scholar]
- Hao, Z.; Yang, P. Experimental Investigation on root system distribution of apple tree. J. China Agric. Univ. 1998, 3, 63–66. [Google Scholar]
- Li, J.; Feng, Q.; Si, J.; Chang, Z.; Su, Y.; Xi, H. Nonlinear analysis of root distribution of Populus euphratica forests in the extremely arid region-Ejina, Inner Mongolia in northern China. J. Beijing For. Univ. 2007, 29, 109–113. [Google Scholar]
- Phillips, D.L.; Gregg, J.W. Source partitioning using stable isotopes: Coping with too many sources. Oecologia 2003, 136, 261–269. [Google Scholar] [CrossRef] [PubMed]
- Williams, D.G.; Ehleringer, J.R. Intra-and inter specific variation for summer precipitation use in Pinyon-juniper woodlands. Ecol. Monogr. 2000, 70, 517–537. [Google Scholar]
- Asseng, S.; Ritchie, J.T.; Smucker, A.J.M.; Robertson, M.J. Root growth and water uptake during water deficit and recovering in wheat. Plant Soil 1998, 20, 265–273. [Google Scholar] [CrossRef]
- Feddes, R.A.; Kowalik, P.; Kolinska-Malinka, K.; Zaradny, H. Simulation of field water uptake by plants using a soil water dependent root extraction function. J. Hydrol. 1976, 31, 13–26. [Google Scholar] [CrossRef]
Figure 1.
Photographs of surface irrigation (left) and drip irrigation (right) at the experimental site.
Figure 1.
Photographs of surface irrigation (left) and drip irrigation (right) at the experimental site.

Figure 2.
Volumetric soil water content (20–40 cm) under surface irrigation (SI), drip irrigation (DI), irrigation, and precipitation from April to October in 2015 and 2016.
Figure 2.
Volumetric soil water content (20–40 cm) under surface irrigation (SI), drip irrigation (DI), irrigation, and precipitation from April to October in 2015 and 2016.

Figure 3.
δ18O contents of soil water at different soil depths, stem water, and irrigation water under drip irrigation (DI) and surface irrigation (SI) in spring. Different letters in the figures show significant differences for the probability p ≤ 0.05% according to Duncan multiple range test.
Figure 3.
δ18O contents of soil water at different soil depths, stem water, and irrigation water under drip irrigation (DI) and surface irrigation (SI) in spring. Different letters in the figures show significant differences for the probability p ≤ 0.05% according to Duncan multiple range test.

Figure 4.
δ18O contents of soil water at different soil depths, stem water, and irrigation water under DI and SI in summer. Different letters in the figures show significant differences for the probability p ≤ 0.05% according to Duncan multiple range test.
Figure 4.
δ18O contents of soil water at different soil depths, stem water, and irrigation water under DI and SI in summer. Different letters in the figures show significant differences for the probability p ≤ 0.05% according to Duncan multiple range test.

Figure 5.
Frequency histograms obtained by the multi-source mass balance, which show the estimated ranges of proportional contribution of water from each water source to cherry root water uptake in spring. (a) Frequency percentage in 0–30 cm soil layer under drip irrigation, (b) Frequency percentage in 30–60 cm soil layer under drip irrigation, (c) Frequency percentage in 60–100 cm soil layer under drip irrigation, (d) Frequency percentage in irrigation water under drip irrigation, (e) Frequency percentage in 0–30 cm soil layer under surface irrigation, (f) Frequency percentage in 30–60 cm soil layer under surface irrigation, (g) Frequency percentage in 60–100 cm soil layer under surface irrigation, (h) Frequency percentage in irrigation water under surface irrigation.

Figure 6.
Frequency histograms obtained by the multi-source mass balance, which show the estimated ranges of proportional contribution of water from each water source to cherry root water uptake in summer. (a) Frequency percentage in 0–30 cm soil layer under drip irrigation, (b) Frequency percentage in 30–60 cm soil layer under drip irrigation, (c) Frequency percentage in 60–100 cm soil layer under drip irrigation, (d) Frequency percentage in irrigation water under drip irrigation, (e) Frequency percentage in 0–30 cm soil layer under surface irrigation, (f) Frequency percentage in 30–60 cm soil layer under surface irrigation, (g) Frequency percentage in 60–100 cm soil layer under surface irrigation, (h) Frequency percentage in irrigation water under surface irrigation.

Figure 7.
Vertical one-dimensional distributions of the cherry root parameters. (a) Root biomass density, (b) root length density, (c) root surface area, (d) root volume ratio. Different letters in the figures show significant differences for the probability p ≤ 0.05% according to Duncan multiple range test.


Figure 8.
A two-dimensional (2D) distribution map of the cherry root biomass density (RBD, g/m3) for (a) surface and (b) drip irrigation. The maps derive from soil sections transversal to the tree row.
Figure 8.
A two-dimensional (2D) distribution map of the cherry root biomass density (RBD, g/m3) for (a) surface and (b) drip irrigation. The maps derive from soil sections transversal to the tree row.

Figure 9.
A 2D distribution map of the cherry root length density (RLD, m/m3) under (a) surface and (b) drip irrigation. The maps derive from soil sections transversal to the tree row.
Figure 9.
A 2D distribution map of the cherry root length density (RLD, m/m3) under (a) surface and (b) drip irrigation. The maps derive from soil sections transversal to the tree row.

Figure 10.
A 2D distribution map of the cherry root surface area (RSA, cm2/dm3) under (a) surface and (b) drip irrigation. The maps derive from soil sections transversal to the tree row.
Figure 10.
A 2D distribution map of the cherry root surface area (RSA, cm2/dm3) under (a) surface and (b) drip irrigation. The maps derive from soil sections transversal to the tree row.


Figure 11.
A 2D distribution map of the cherry root volume ratio (RVR, cm3/cm3) under (a) surface and (b) drip irrigation. The maps derive from soil sections transversal to the tree row.
Figure 11.
A 2D distribution map of the cherry root volume ratio (RVR, cm3/cm3) under (a) surface and (b) drip irrigation. The maps derive from soil sections transversal to the tree row.


Table 1.
Physical properties of the soil at the experimental site.
| Soil Depth | Volumetric Weight | Saturated Water Content (θw) | Field Water Holding Capacity (θw) | Soil Component (%) | Soil Texture |
|---|---|---|---|---|---|
| (cm) | (g/cm3) | (%) | (%) | Clay/Silt/Sand | |
| 0−20 | 1.26 | 26.4 | 25.6 | 8.75/47.25/44.00 | Loam silt |
| 20–40 | 1.45 | 27.3 | 26.1 | 9.82/52.76/37.42 | Silt |
| 40–60 | 1.48 | 31.6 | 27.8 | 5.27/31.25/63.48 | Loam sandy |
| 60–80 | 1.52 | 36.8 | 25.6 | 3.83/26.54/69.63 | Sandy loam |
| 80–100 | 1.46 | 36.5 | 25.4 | 0.84/6.53/92.63 | Sand |
Table 2.
Growth periods of cherry trees in 2015 and 2016.
| Growth Stage | Flowering | Fruit Growth | Harvest | Postharvest | Leaf Fall | Dormancy |
|---|---|---|---|---|---|---|
| 2015 (month/day) | 3/30–4/2 | 5/7–6/7 | 6/8 | 6/9–8/30 | 9/1–10/15 | 11/7 |
| 2016 (month/day) | 4/2–4/6 | 5/2–6/5 | 6/6 | 6/7–9/2 | 9/2–10/20 | 11/10 |
© 2019 by the authors. Licensee MDPI, Basel, Switzerland. This article is an open access article distributed under the terms and conditions of the Creative Commons Attribution (CC BY) license (http://creativecommons.org/licenses/by/4.0/).
Share and Cite
MDPI and ACS Style
Li, P.; Tan, H.; Wang, J.; Cao, X.; Yang, P. Evaluation of Water Uptake and Root Distribution of Cherry Trees under Different Irrigation Methods. Water 2019, 11, 495. https://doi.org/10.3390/w11030495
AMA Style
Li P, Tan H, Wang J, Cao X, Yang P. Evaluation of Water Uptake and Root Distribution of Cherry Trees under Different Irrigation Methods. Water. 2019; 11(3):495. https://doi.org/10.3390/w11030495
Chicago/Turabian StyleLi, Pingfeng, Huang Tan, Jiahang Wang, Xiaoqing Cao, and Peiling Yang. 2019. "Evaluation of Water Uptake and Root Distribution of Cherry Trees under Different Irrigation Methods" Water 11, no. 3: 495. https://doi.org/10.3390/w11030495
Note that from the first issue of 2016, this journal uses article numbers instead of page numbers. See further details here.