Article

Changes in the Content of Heavy Metals in Bílina River during 2012–2017: Effects of Flood and Industrial Inputs

1
Unipetrol Centre for Research and Education, Inc., Revolucni 84, 40001 Ústi nad Labem, Czech Republic
2
Faculty of Mechanical Engineering, Jan Evangelista Purkyně University in Ústí nad Labem, Pasteurova 3544/1, 40096 Ústí nad Labem, Czech Republic
3
Faculty of Environment, Jan Evangelista Purkyně University in Ústí nad Labem, Králova výšina 3132/7, 40096 Ústí nad Labem, Czech Republic
4
Faculty of Food Technology, Kazan National Research Technological University, Karl-Marx-Str., 68., 420015 Kazan, Russia
*
Author to whom correspondence should be addressed.
Water 2019, 11(3), 481; https://doi.org/10.3390/w11030481
Submission received: 21 January 2019 / Revised: 1 March 2019 / Accepted: 1 March 2019 / Published: 7 March 2019
(This article belongs to the Section Water Resources Management, Policy and Governance)

Abstract

:
This article presents the development of selected heavy metals contained in river sediments at selected sites along the Bílina River. It describes the situation before the large flood in 2013, the situation just after that flood, the situation approximately 1 year after the flood, and 4 years after the flood. The contents of selected heavy metals from industrial pollution originating from transport and industry located along the river flow were monitored. Since the situation in the river before the flood was also known, it was possible to assess the impact of the 2013 flood on the distribution of heavy metals in the settled sediments. The results obtained show that the heavy metal content has changed significantly. During the flood in 2013 there was an increase in the concentration of almost all the monitored elements compared to the situation before the flood and one year after the flood. This could be caused by the churning of sediments as a result of the flood. The only exception was Cd, the concentration of which did not change significantly. However, Cd is present in the sediment samples at a low concentration at the limit of quantification (LOQ), so the change may not be noticeable. In 2017, four years after the flood, an increase in the concentration of all the monitored elements was found. The highest increase in the content of the monitored elements was observed at the sites with the highest industrial pollution. Following the flood in 2014, there was a situation where no significant differences were observed in the content of metals at the individual sampling points in contrast to the values obtained in 2012, 2013, and 2017. As a result of sediment churning and re-settlement during and after the flood, the sediment became homogenized along the entire river flow. After a longer period of time that was not accompanied by floods, a significant increase in the heavy metal concentration was observed due to anthropogenic pollution. The results show that the effect of flooding is only temporal and that anthropogenic pollution is more important than the impact of floods.

1. Introduction

Floods not only bring about immediate material damage caused by the direct effects of high water levels and accelerated flow, but also cause sediment swirling and the redistribution of fixed pollutants, including heavy metals. Since they concentrate in the river sediments, the churned-up sediments become their secondary source, as they are carried by flowing water and can deposit contaminants on nearby land [1]. The river sediments can contain a variety of heavy elements, the nature and content of which depend mainly on transport and industrial polluters around the river. Heavy metals are fixed in anoxic sediments mostly in the form of sulphides [2]. Heavy metals are transported both by water as well as sorbed to fine sediment particles. Sedimenting particles with sorbed heavy metals then form their own sediment, where the increase of heavy metal content concentrations and the formation of anoxic conditions result from further settling. The sorption of heavy metals from the aqueous phase to the solid phase is influenced by various factors, such as the pH, concentration of ions capable of forming inorganic complexes, concentrations of organic chelates, etc. [3]. The fixation of heavy metals into sediments is, under normal conditions, a certain form of immobilization of heavy metals. However, during extraordinary events, such as floods, their content is suddenly rearranged along the entire river flow, and the river and its surroundings can be contaminated even over a long distance. The sediments with concentrated heavy metals thus become a secondary source of contamination, and as a result of the increased flow rate and river overflowing during floods, they can contaminate the vast surroundings of the river, which may also result in contamination of agricultural land. The sediments are considered to be the most significant source of heavy metals in the aquatic environment, containing about 99% of the heavy metals present in the aquatic environment. The quality of the sediments therefore reflects the quality of the ecosystem as well as its heavy metal pollution. For the above reason, it is very important to monitor heavy metal contents in sediments, especially in small rivers and streams that are more susceptible to overflowing, which causes denudation and redistribution of heavy metal containing sediments [4].
During floods, increases in the mass flow of heavy metals comes about as a result of high water flow, although absolute heavy metal concentrations are lower. In the River Ystwyth, metal concentrations in the suspended sediments can be very high, while in the soluble fraction, under low-flow conditions, concentrations rarely exceed 0.01 mg/L. During floods, the dissolved concentration is diluted, and soluble metals tend to be rapidly scavenged onto sediments [1,5]. In the Biała Przemsza River in southern Poland, a threefold decrease of heavy metal concentrations in sediments was observed, caused by a flood in 1997, compared to heavy metal contents in 1993. A lower flood in 1998 decreased the heavy metal contents in the lower course. The period between floods was characterised by a gradual increasing of the heavy metal contents [6]. In the river Geul (Netherlands), it was proven that during the floods, the effect of river discharge is very important, as opposed to the period between floods when the effect of river discharge is negligible and the quantity and quality of transported sediment depends on the variable activity of various sediment sources upstream. During periods of low flow and probably less turbulence, the carrying capacity is low, causing a build-up of ooze deposits in depressions along the streambed and in the numerous millraces of the river. [7].
The Bílina River is a medium-sized river, with an average flow rate, Qa, (1981–2010) of 6.81 m3/s (reported profile in Trmice near the city of Ústí nad Labem) [8], flowing through the industrial area of Northern Bohemia. The anthropogenic impact on the environment in this area is related mainly to the mining and processing of brown coal and other ores, the highly developed chemical industry, the energy industry, and the metalworking industry. The river has been also polluted by fertilizers and agricultural activities. There is therefore a considerable influence of human activities on the pollution of the river. The Bílina River has been monitored for pollution for many years; such pollutants include heavy metals [9,10,11,12,13], polyaromatic hydrocarbons [14], and chlorinated hydrocarbons [15,16,17,18,19]. Also, several toxicological studies using indicator organisms [16,20] and ecological studies [21,22] were carried out. A joined study of sediment and water quality in Bílina River and following Labe River was recently carried out [23]. Generally, there has been no regular monitoring of sediments; the regular monitoring of water quality is provided by River Board Authority “Povodí Ohře”, s.p.
During the end of May and the beginning of June 2013, due to several days of heavy rains, a huge flood affected the Czech Republic, including the North Bohemia region. In the North Bohemia region, the Bílina River overflowed. Urbanization along both banks of the river limits the retention capacity of the landscape and accelerates the water runoff. The Bílina River crested in Trmice on June 5 2013 in the morning, when the water level reached the 275 cm river stage and the flow rate was 62 m3/s, which is almost 10 times the average flow rate [8].
This work compares the heavy metal contents and distribution in sediments and in river water along Bílina River before the flood, immediately after the flood, and after the flood with a time lag. The result is an overview of the redistribution of heavy metals that occurred during the floods in 2013.

2. Supplementary and Methods

2.1. Description of the Study Area

The Bílina River is an 82 km long left-side tributary of the Labe (Elbe) River. Within the length of 12 km it runs through urban areas in the towns of Jirkov, Most, Bílina, and Ústí nad Labem. The catchment area of the Bílina River is 1082 km2 and the average flow rate in the hydrological station of Trmice is 6.81 m3 s−1 [
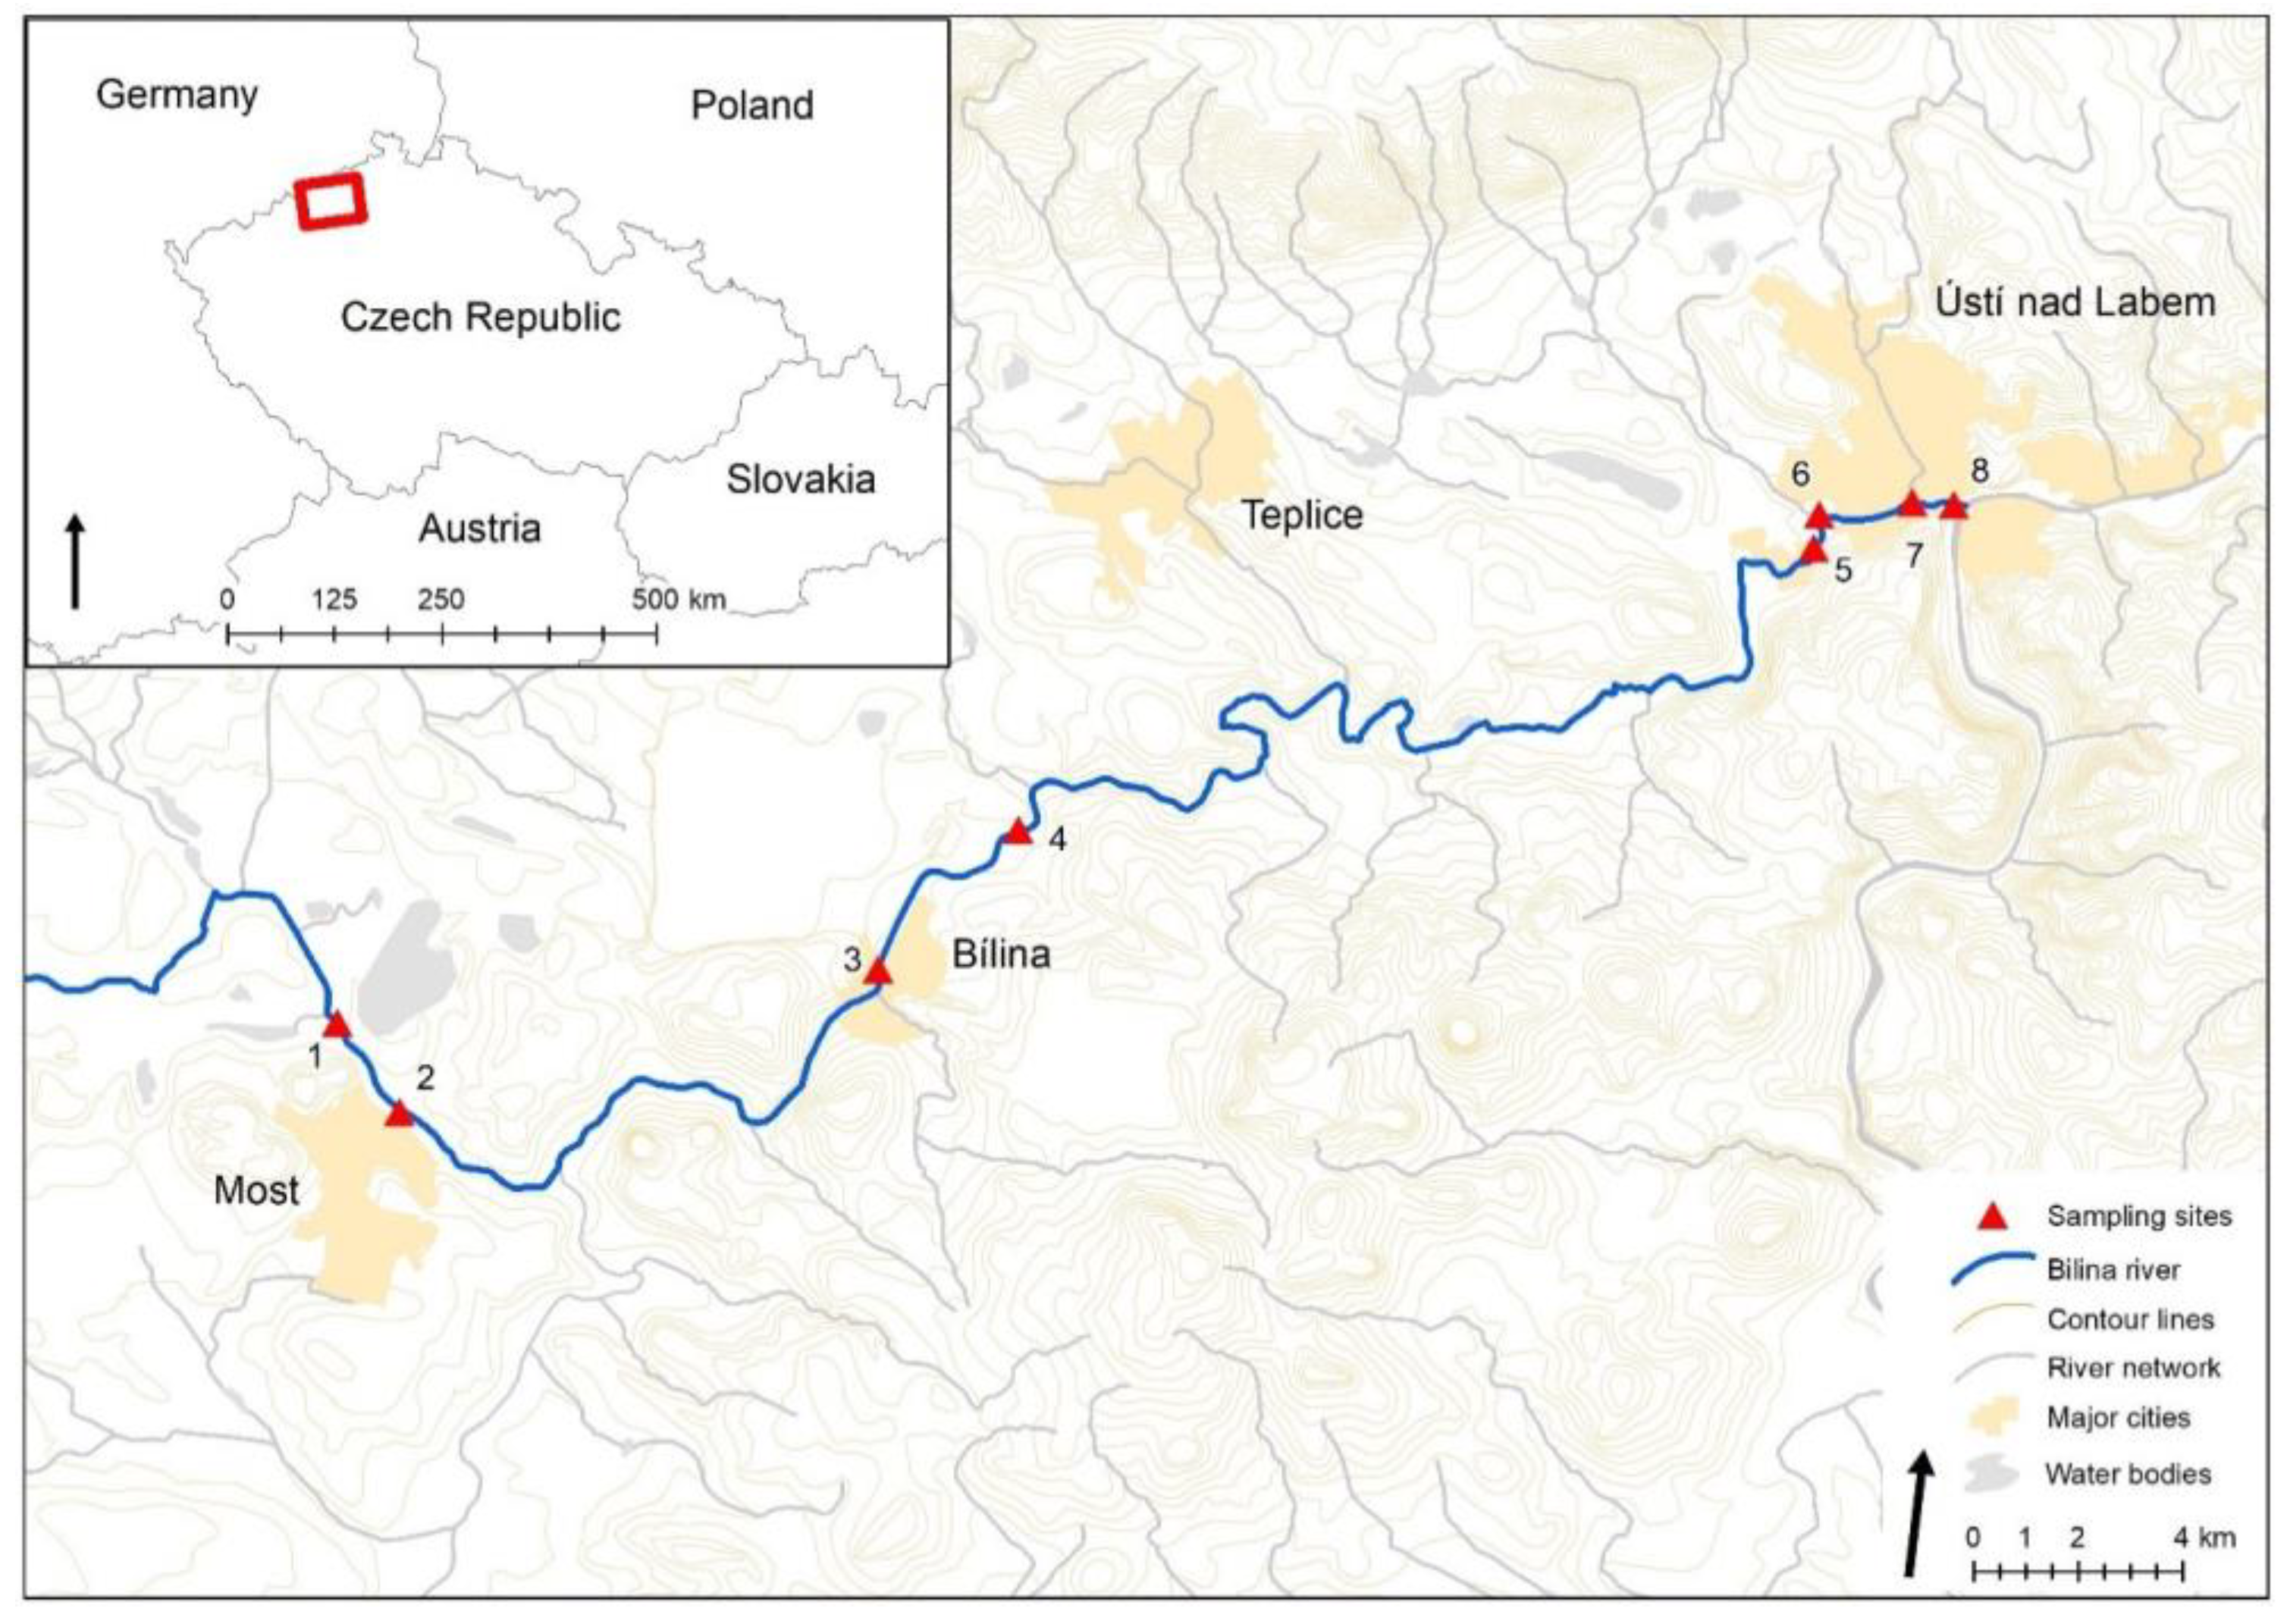
8]. The river basin is burdened by industry and anthropogenic pollution—brown coal mining in the Most region, an oil processing plant in Litvínov, the Ledvice coal-fired power station, the heating plant in Trmice, and the chemical production in Ústí nad Labem. The major part of the river follows the main road route between Most and Ústí nad Labem, so heavy metal pollution can come from both large industrial companies and transport. The bottom of the river in the urban areas is paved by stone blocks. The shape of the channel is trapezoidal and deep, with steep river banks. Banks are fortified with stones. The river is extensively regulated, and the original river bed has been altered in many places due to the surrounding coal mining. In one section, the natural river bed has even been replaced by a pipeline, which should have prevented the overflow of water during floods into the nearby coal open-pit mines. Recently, however, a plan has been formed to gradually return the river to the natural river bed. The river is occasionally hit by floods as a result of intense or prolonged rains. Small floods occur on the Bílina River regularly. Larger floods have also occurred, e.g., in August 2002, August 2010, January 2011, and June 2013.
Flow rates at the Trmice hydrological station at the time of sampling are given in Table 1 [7].

2.2. Sampling

Sampling sites were chosen to cover most of the Bílina River flow, from Most Lake to the confluence with the Labe (Elbe) River, and they also included places where industrial polluters (chemical factories, brown coal mines) are located on the river. Sampling sites were selected based on previous studies where monitoring prior to floods in 2013 was carried out [11,24]. The selection of sampling sites was also influenced by the river bed regulation and its eventual stone block paving, which was especially done in the areas where the river flows through urban areas. We also made sampling points that were more or less the same distance between each other and good accessibility to the place was another important factor. Altogether eight sampling points were identified, see Table 2. The sampling points are also shown in the map in Figure 1.
Samples of sediments and water were collected along the Bílina River in four different time periods showing situations before the flood (June 2012), during the flood (July 2013), 1 year after the flood (July 2014), and four years after the flood (July 2017).
Water sampling was performed according to ISO 5667-6 [25]. Samples were collected with a polyethylene (PE) telescopic scoop and poured into 2-L PE sample containers. Water samples for heavy metal analysis were stabilized with nitric acid to a final concentration of 0.5% according to ISO 5667-3 [26] and stored in the cold until heavy metal content determination. Sediment sampling was performed according to ISO 5667-12 [27]. The sediments were collected with a polytetrafluorethylene (PTFE) scoop or with a PE cup on a telescopic rod. The sediments were cooled down immediately after the collection, and after transportation to the laboratory, they were frozen until further processing. Before decomposition of the sediments, they were thawed and dried at room temperature. Since they were hard, they had to be crushed and then sieved with a mesh size of 1 mm. Such treated sediment sample was then digested by aqua regia (pseudototal extraction) according to European standard EN 13657 [28]. After decomposition, the sample was filtrated through paper filter Ahlstrom type 390 and the heavy metal concentration was determined by the inductively coupled plasma optical emission spectrometry (ICP-OES) method. Simultaneously with the determination of heavy metals, sediment dry matter was also determined using the Kern DBS 60-3 (Kern&Sohn, Balingen, Germany) drying scales. The obtained results of the determination of the selected heavy metals were recalculated to the dry matter in sediments.
Results were evaluated according to the environmental quality standards set out in the Czech Government Regulation No. 401/2015, which defines the indicators and values of permissible surface water and wastewater pollution, and details of the permits to discharge wastewater into surface water and sewage systems, and on sensitive areas [29]. The content of the heavy metals in the sediments was assessed with reference to Annex No. 1 to Decree 257/2009 Coll., which sets limits for risk elements and hazardous substances in the sediments [30].

2.3. Chemical Analyses

Preserved water samples were analysed directly without further treatment. In the samples, the desired metals were determined by the ICP-OES method. The sediment samples were frozen immediately after collection. Prior to processing, the sediment samples were dried, crushed in an agate mortar, and passed through a sieve with a mesh size of 1 mm. To 2 g of the thus prepared sample, 7 mL of nitric acid (65% Suprapura, Merck, Kenilworth, NJ, USA) were added. After 2 hours, 21 mL of hydrochloric acid (30% Suprapura, Merck, Kenilworth, NJ, USA) was added; the mixture was allowed to stand overnight and the next day it was boiled for 2 hours on a heating plate. The decomposed samples were filtered and transferred to a 100 mL volumetric flask. Then, distilled water was added to the samples in the flasks. In such prepared samples, the selected elements were then determined by the ICP-OES method. As a reference material for the determination of metals, the multi-element standard Astasol-MIX, AN 9090 (MN), by Analytika, s.r.o., was used, containing 100 mg/L of each of the measured metals in 2% HNO3.
The actual determination of selected heavy metals in both the preserved water samples and the decomposed sediments was performed using the inductively coupled plasma optical emission spectroscopy method on the Optima 8000 (Perkin-Elmer, Waltham, MA, USA) instrument. The instrument was equipped with a Scott spray chamber and a cross flow nebulizer. Parameters of the ICP-OES spectrometer are listed in Table 3.

2.4. Data Evaluation and Statistics

Non-parametric multiple ANOVA, also known as PERMANOVA [31], was applied to test the statistical significant influence of two factors (locality and year) on the metal concentration. The significance was computed by permutation of the group membership, with 9999 replicates. The PAST (ver. 3.17, Natural History Museum, University of Oslo, Oslo, Norway) software was used for computations.

3. Results

3.1. Heavy Metals Concentrations in Water

The selected heavy metal contents were determined from the samples of water and sediments collected from the Bílina River. The analysed samples cover the period from 2012 to 2017, so the collected samples thus reflect the situation prior to the flood in 2013, the situation during the flood, and the situation one year and four years after the flood. The results of the water analysis are shown in Table 4.
For all the heavy metals monitored, low concentrations in river water can be observed, which are on or below the limit of quantification of the method used and do not exceed the emission limits defined by Czech legislation [29]. In water samples collected during the flood in 2013 and in subsequent years after the flood (2014 and 2017), no increase in Cd and Pb was recorded. For Ni, Cu, and Zn, increased water concentrations were observed in the period just after the flood (July 2013). An increased Zn content was observed also in 2014 and 2017. An increased Ni content was observed also one year after the flood in 2014. The highest content of Cu in river water was observed in 2017. From the results obtained for the river water samples, it is clear that the flood had no lasting impact on water contamination. The Cd and Pb contents were below the detection limit at all sampling sites, but trace amounts of copper, nickel, and zinc have been present in the water for a long time. The content of these heavy metals is most likely due to industrial pollution and transport along the entire Bílina River. Despite the ban of leaded fuel use in the Czech Republic, transportation remains a significant source of metal pollution [32], e.g., Cd, Zn, and Pb (burning of fuel, even unleaded), braking (Cu, Zn, Ba, Sb, Zn, etc.) and tire abrasion (especially Zn) [33,34]. The greatest fluctuations in concentrations along the flow were recorded for zinc in 2014 and 2017. Since 2014, a significant increase in the zinc content in water has been observed from sampling point 4 and downstream along the entire flow to sampling point 8, which is evidence of inputs from external sources. From sampling point 4, industrial complexes for the combustion of fossil fuels (lignite power plant), zinc processing (hot-dip galvanizing), and the production of chemicals join the usual sources of zinc in environments, such as atmospheric deposition (fossil fuel burning, zinc processing) and zinc-containing fertilizers.

3.2. Heavy Metals Concentrations in Sediments

The determination of the heavy metal contents was also performed in the sediment samples, which were collected together with the river water samples. The heavy metal contents in the sediment samples at individual sampling points in different time periods after the flood are shown in Figure 2, Figure 3, Figure 4, Figure 5 and Figure 6, detailed data are available in Supplementary (Tables S1–S4).
The results obtained show that the contents of the monitored elements in the sediments are many times higher than in the river water samples, which confirms the preferred binding in the solid phase [24]. Particularly noteworthy are the Pb and Ni concentrations in the sediments, as their concentration in water is below the limit of quantification, yet the content of these elements in the sediment is in the order of tens of milligrams per kilogram. From the results obtained, it is also evident that during the flood, the heavy metal content increased compared to the content before the flood, probably due to sediment churning. One year after the flood, the sediments settled again and the heavy metal content approached the state before the flood. After a long period of time, there is a very significant accumulation of heavy metals in the sediments.

4. Discussion

A PERMANOVA comparison of the metal concentrations in the sediments (Table 5) revealed significant differences between sampling points, sampling years as well as the interaction of these factors. During the flood, a slight increase was determined for most of the monitored elements along the whole river flow.
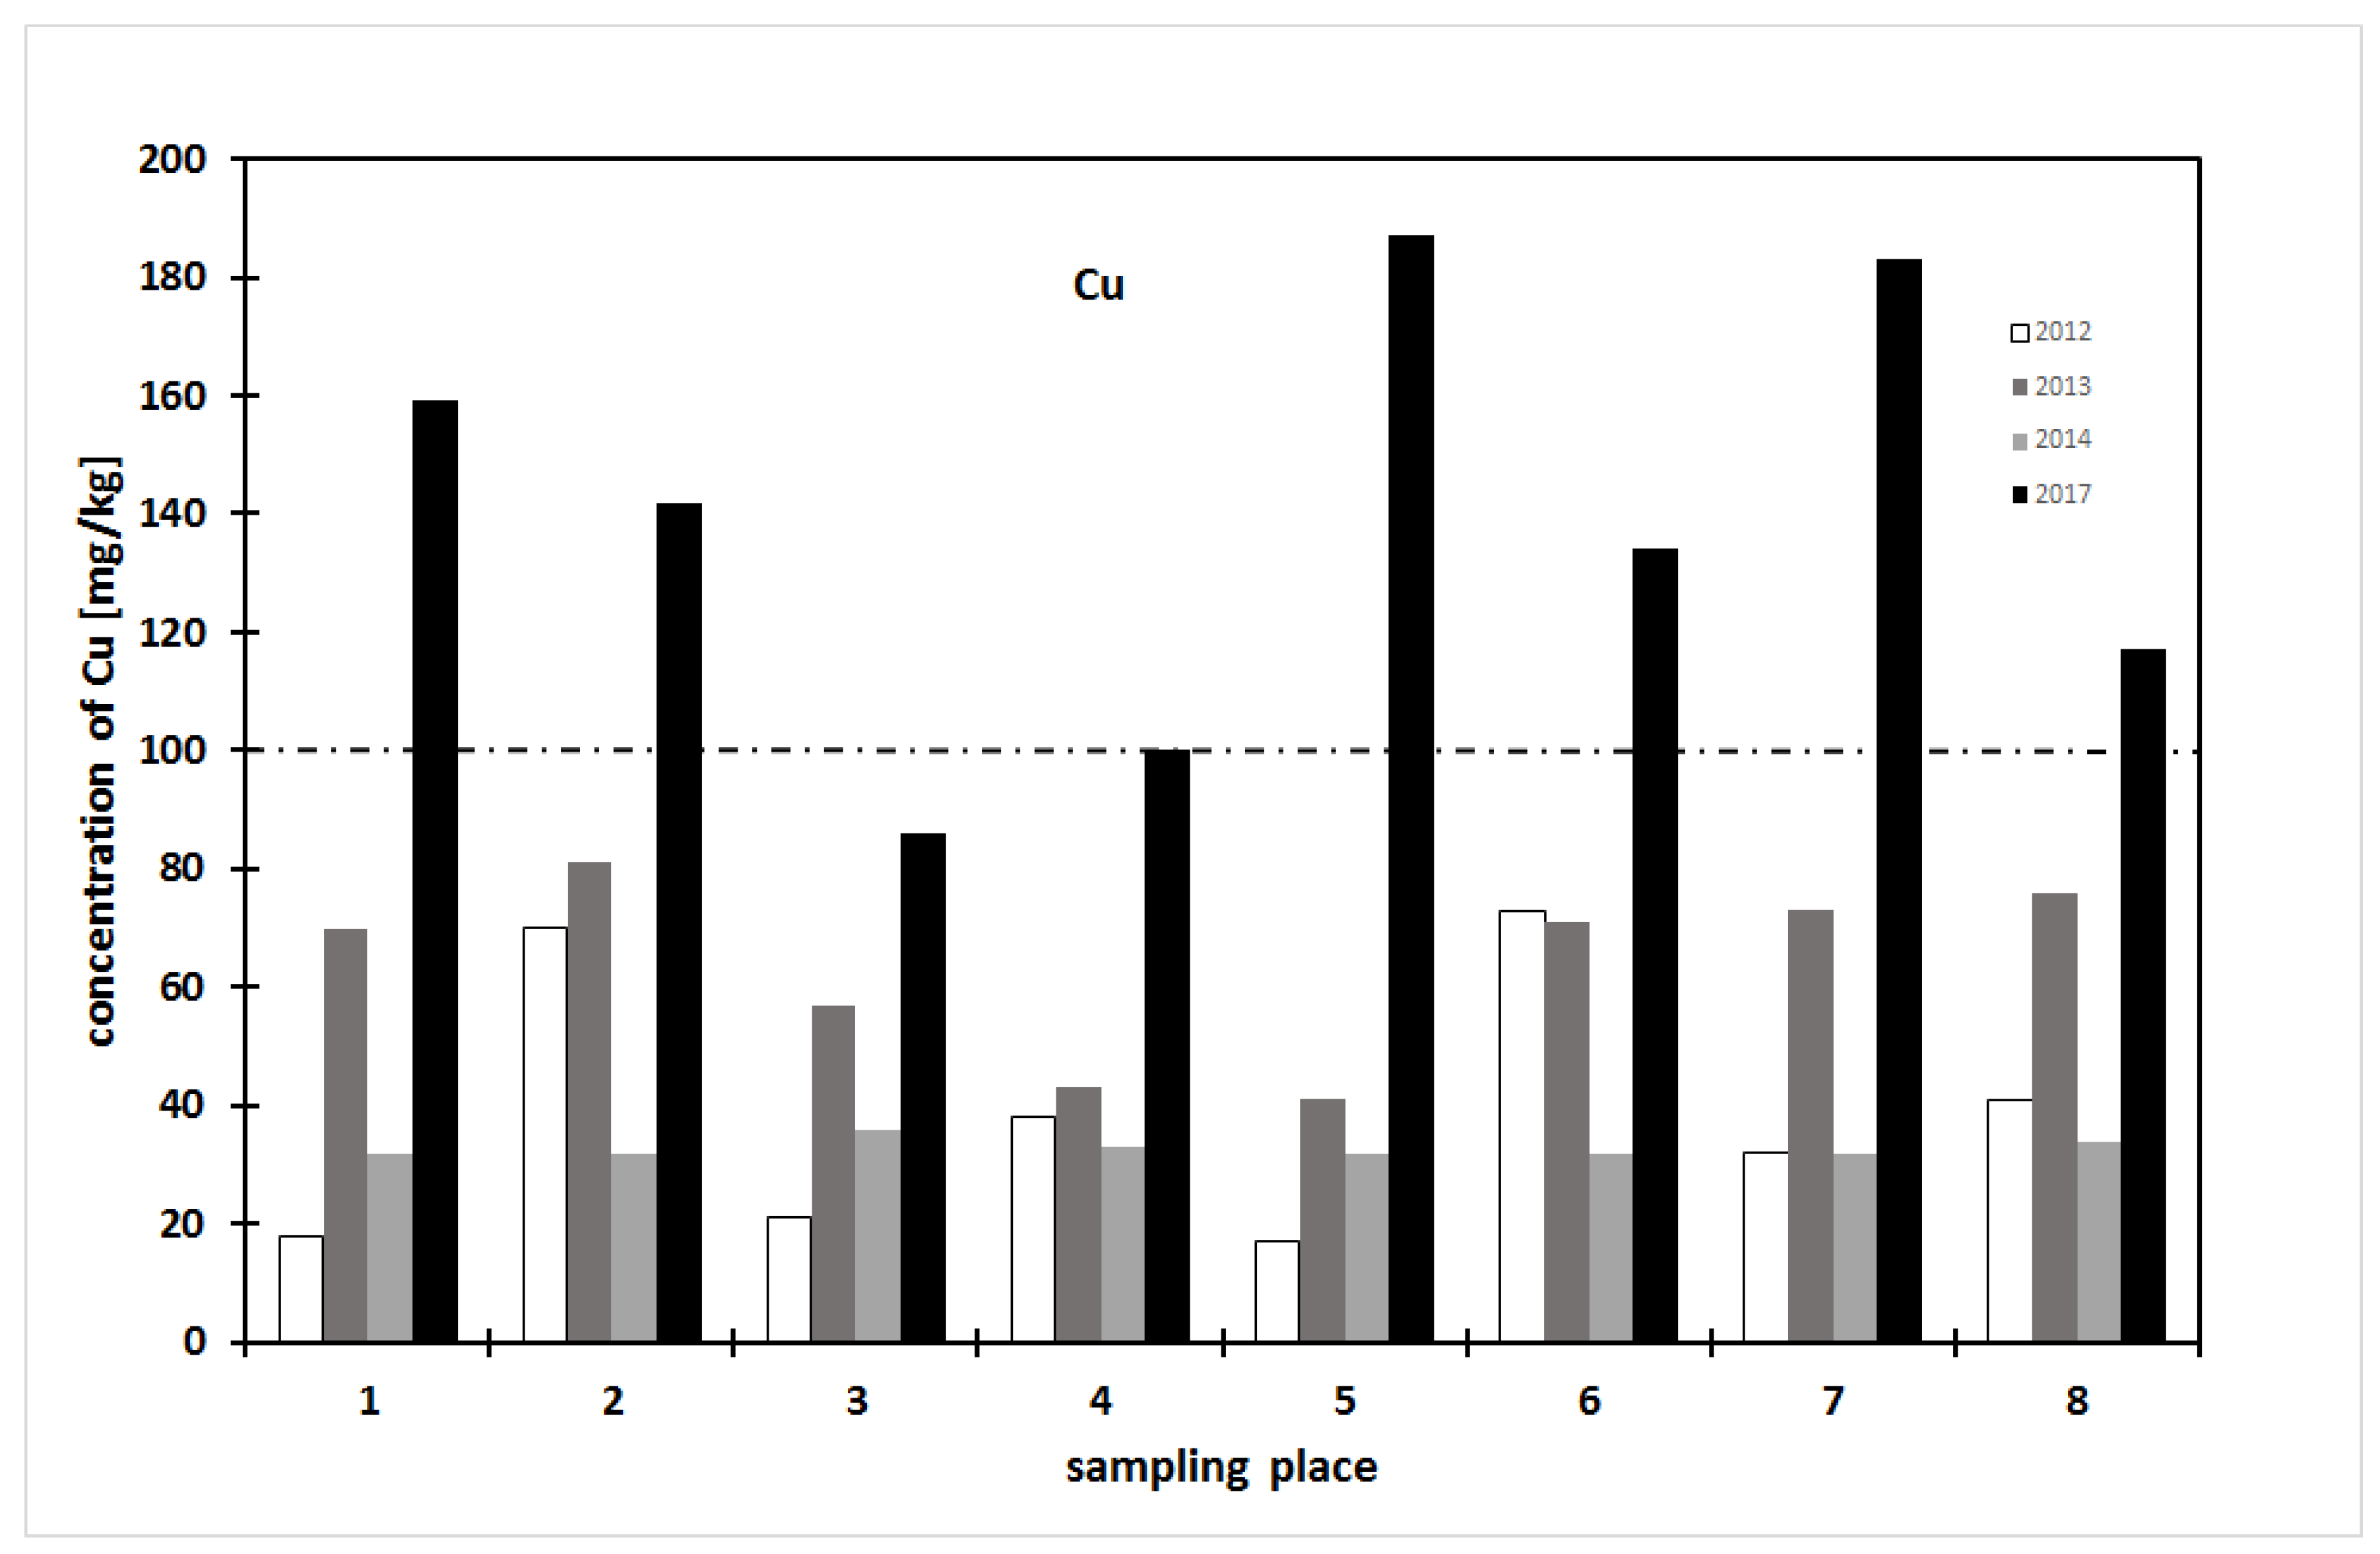
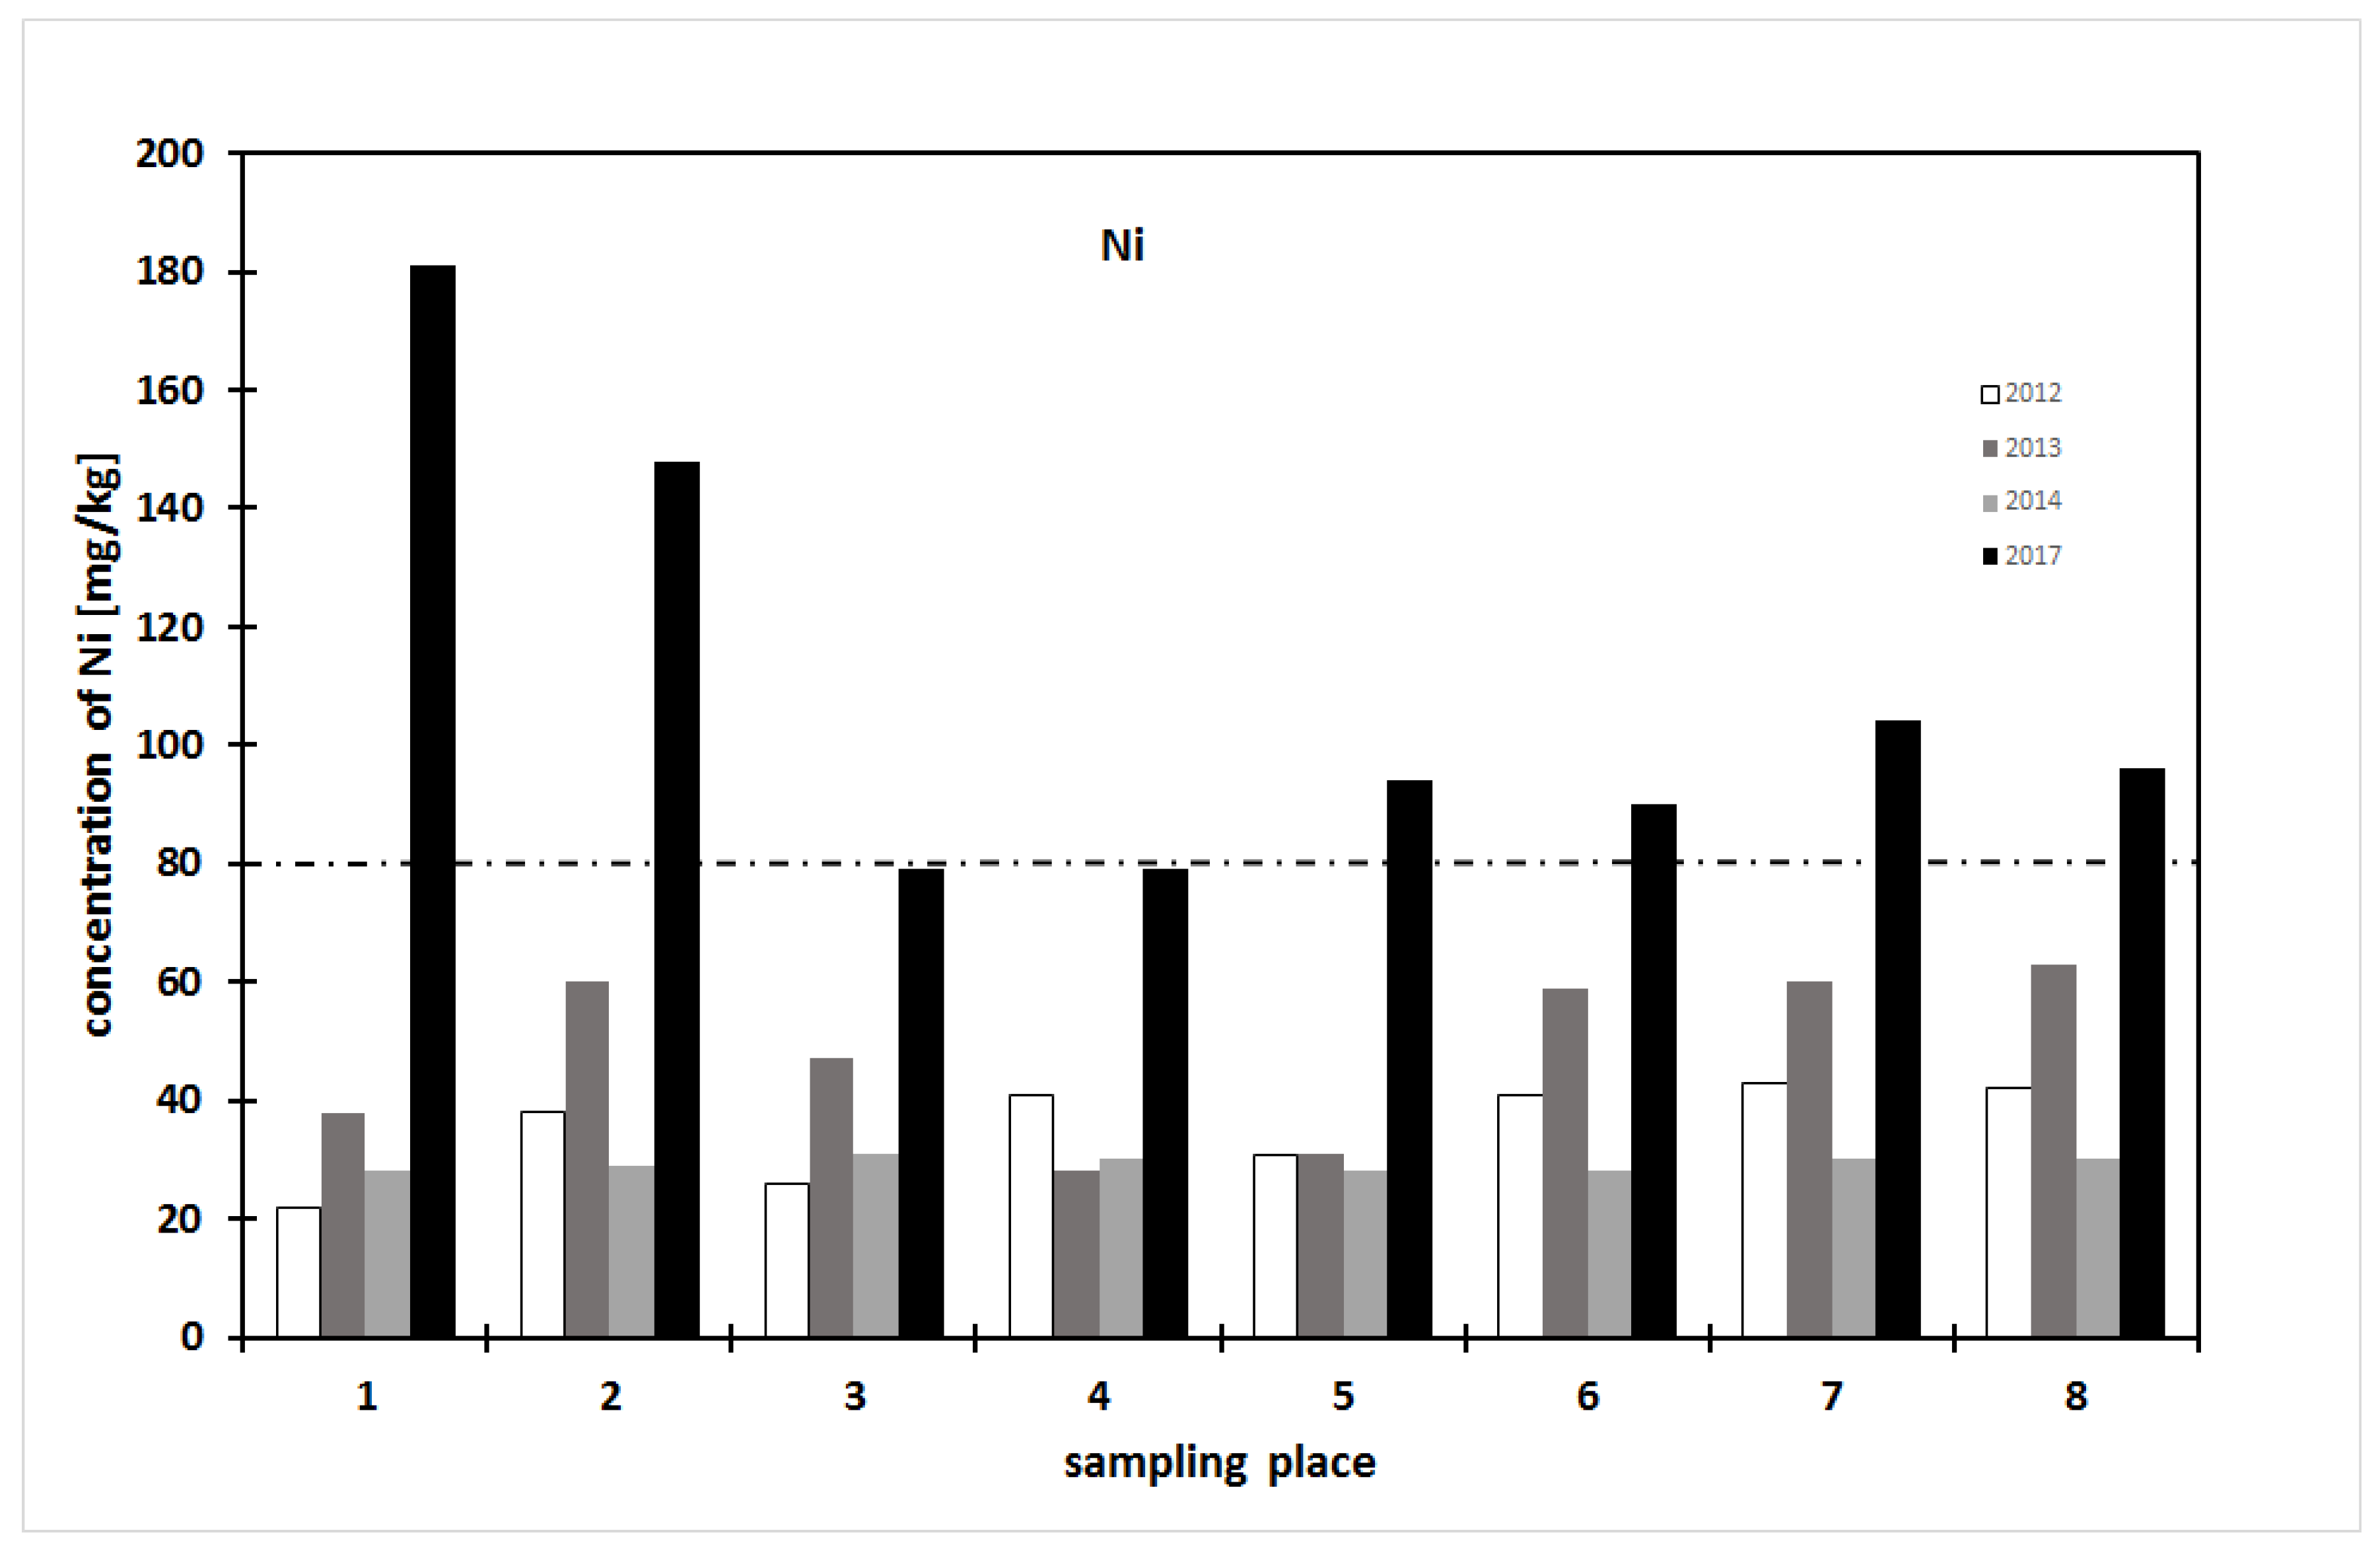
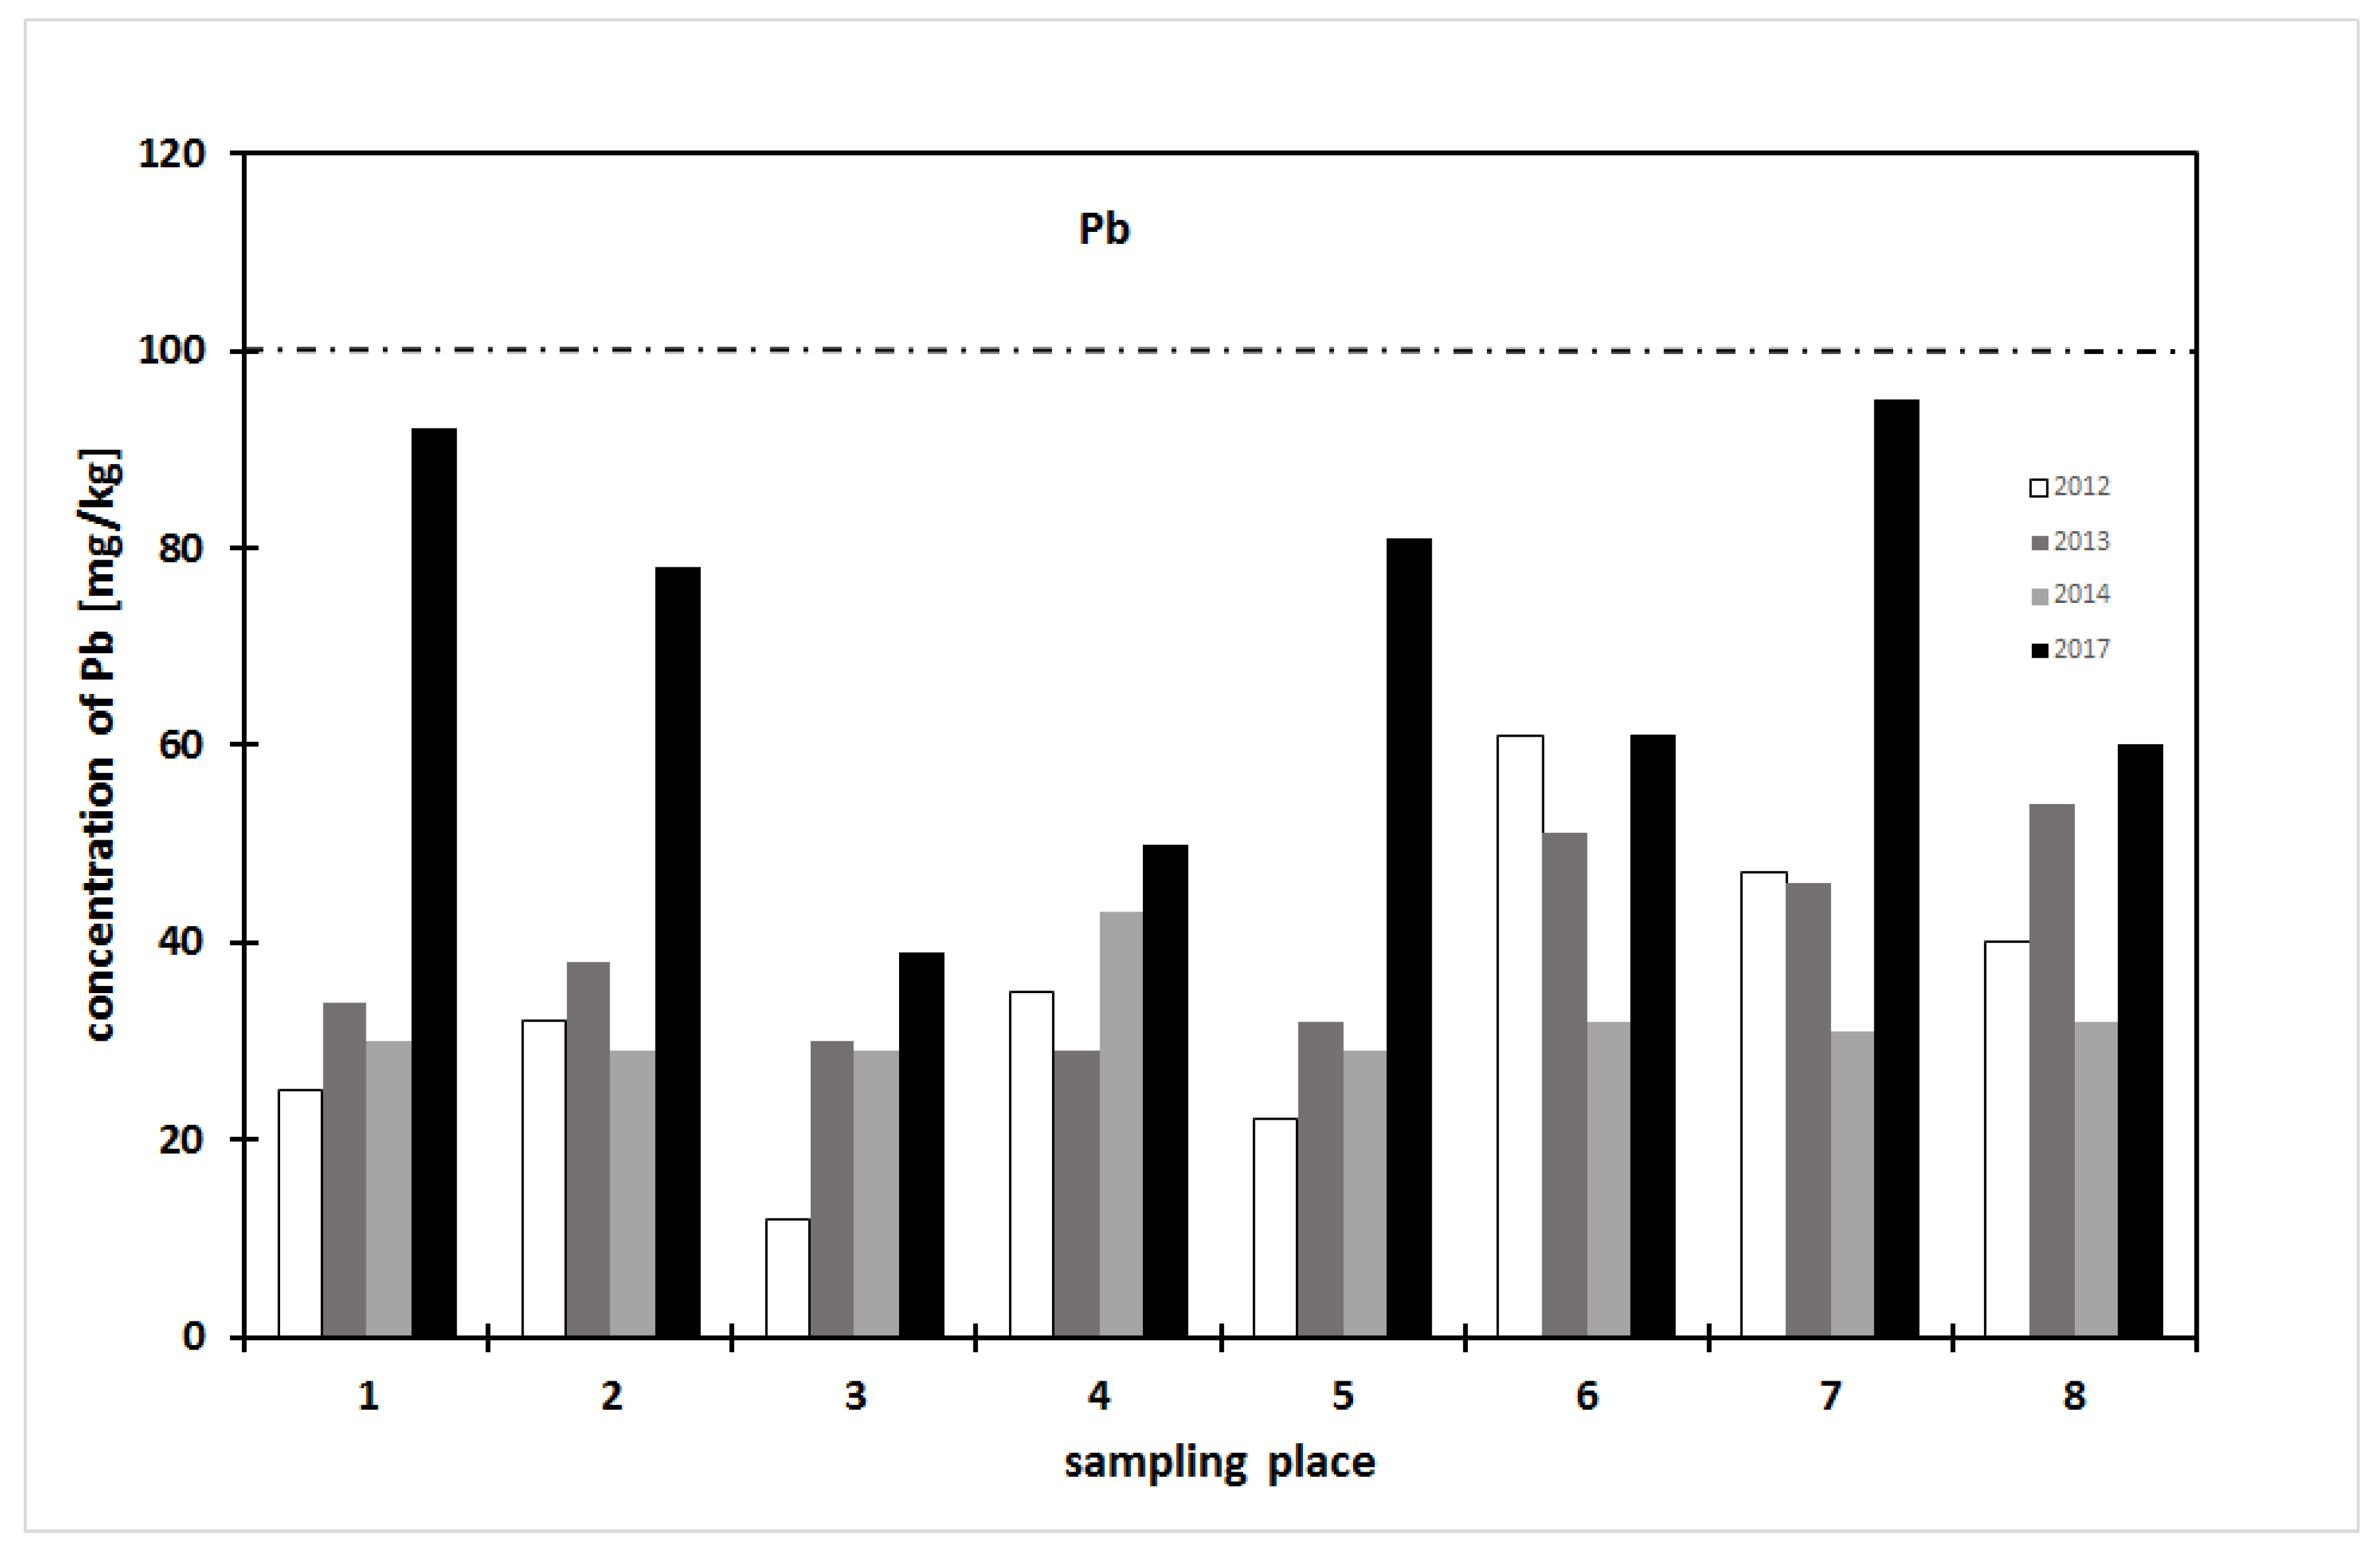
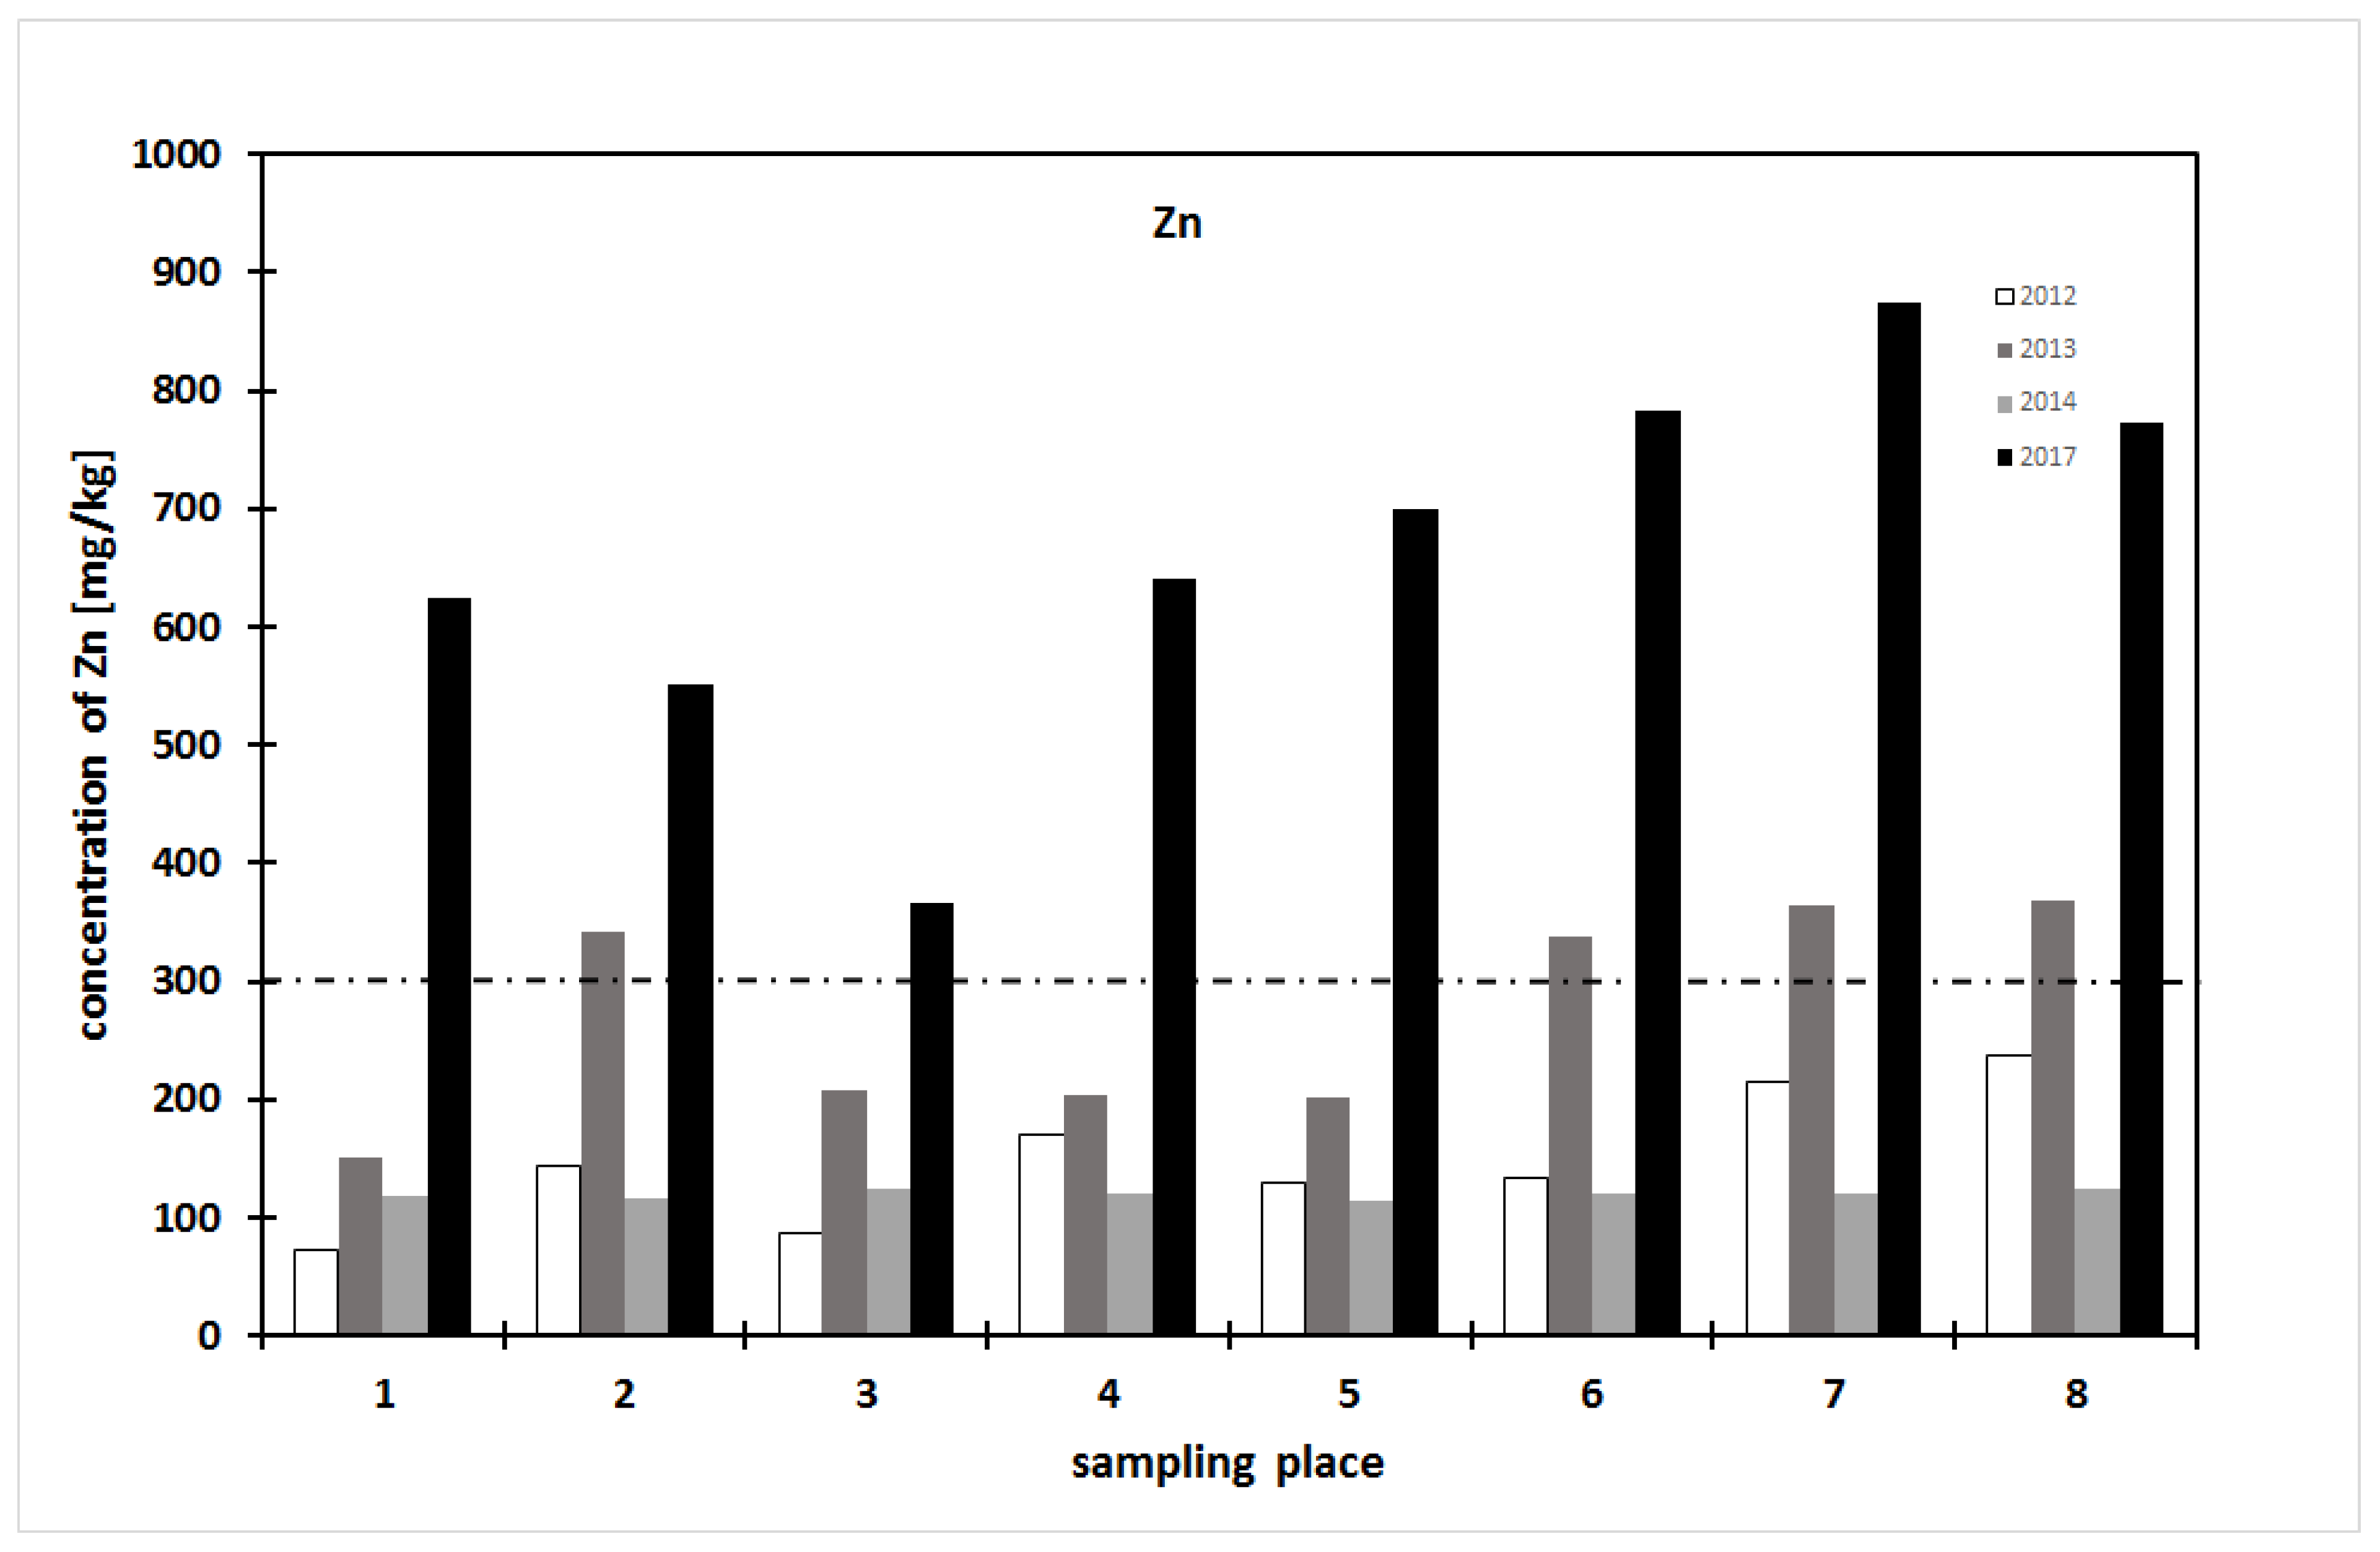
The data indicated only an exceptional reduction of the metal content caused by the flood. Reduced contents of copper were found only at sampling point 6. The reduction of nickel content during the flood was observed at sampling point 4 and the reduction of lead content was observed at sampling points 4, 6, and 7. Zinc content increased during the flood along the whole river flow. The increase in the content of the monitored elements is probably due to the churning of sediments, which occurs during floods. One year after the flood, the contents of the majority of the monitored elements decreased to pre-flood values. At sampling points 2 and 6, there was a significant decrease of the copper content compared to the content before the flood. In the case of lead, a decrease compared to the pre-flood situation was observed at sampling points 6 and 7; at sampling point 3, the content was the same as that during the flood. The zinc and nickel contents returned to pre-flood values at all sampling points one year after the flood.
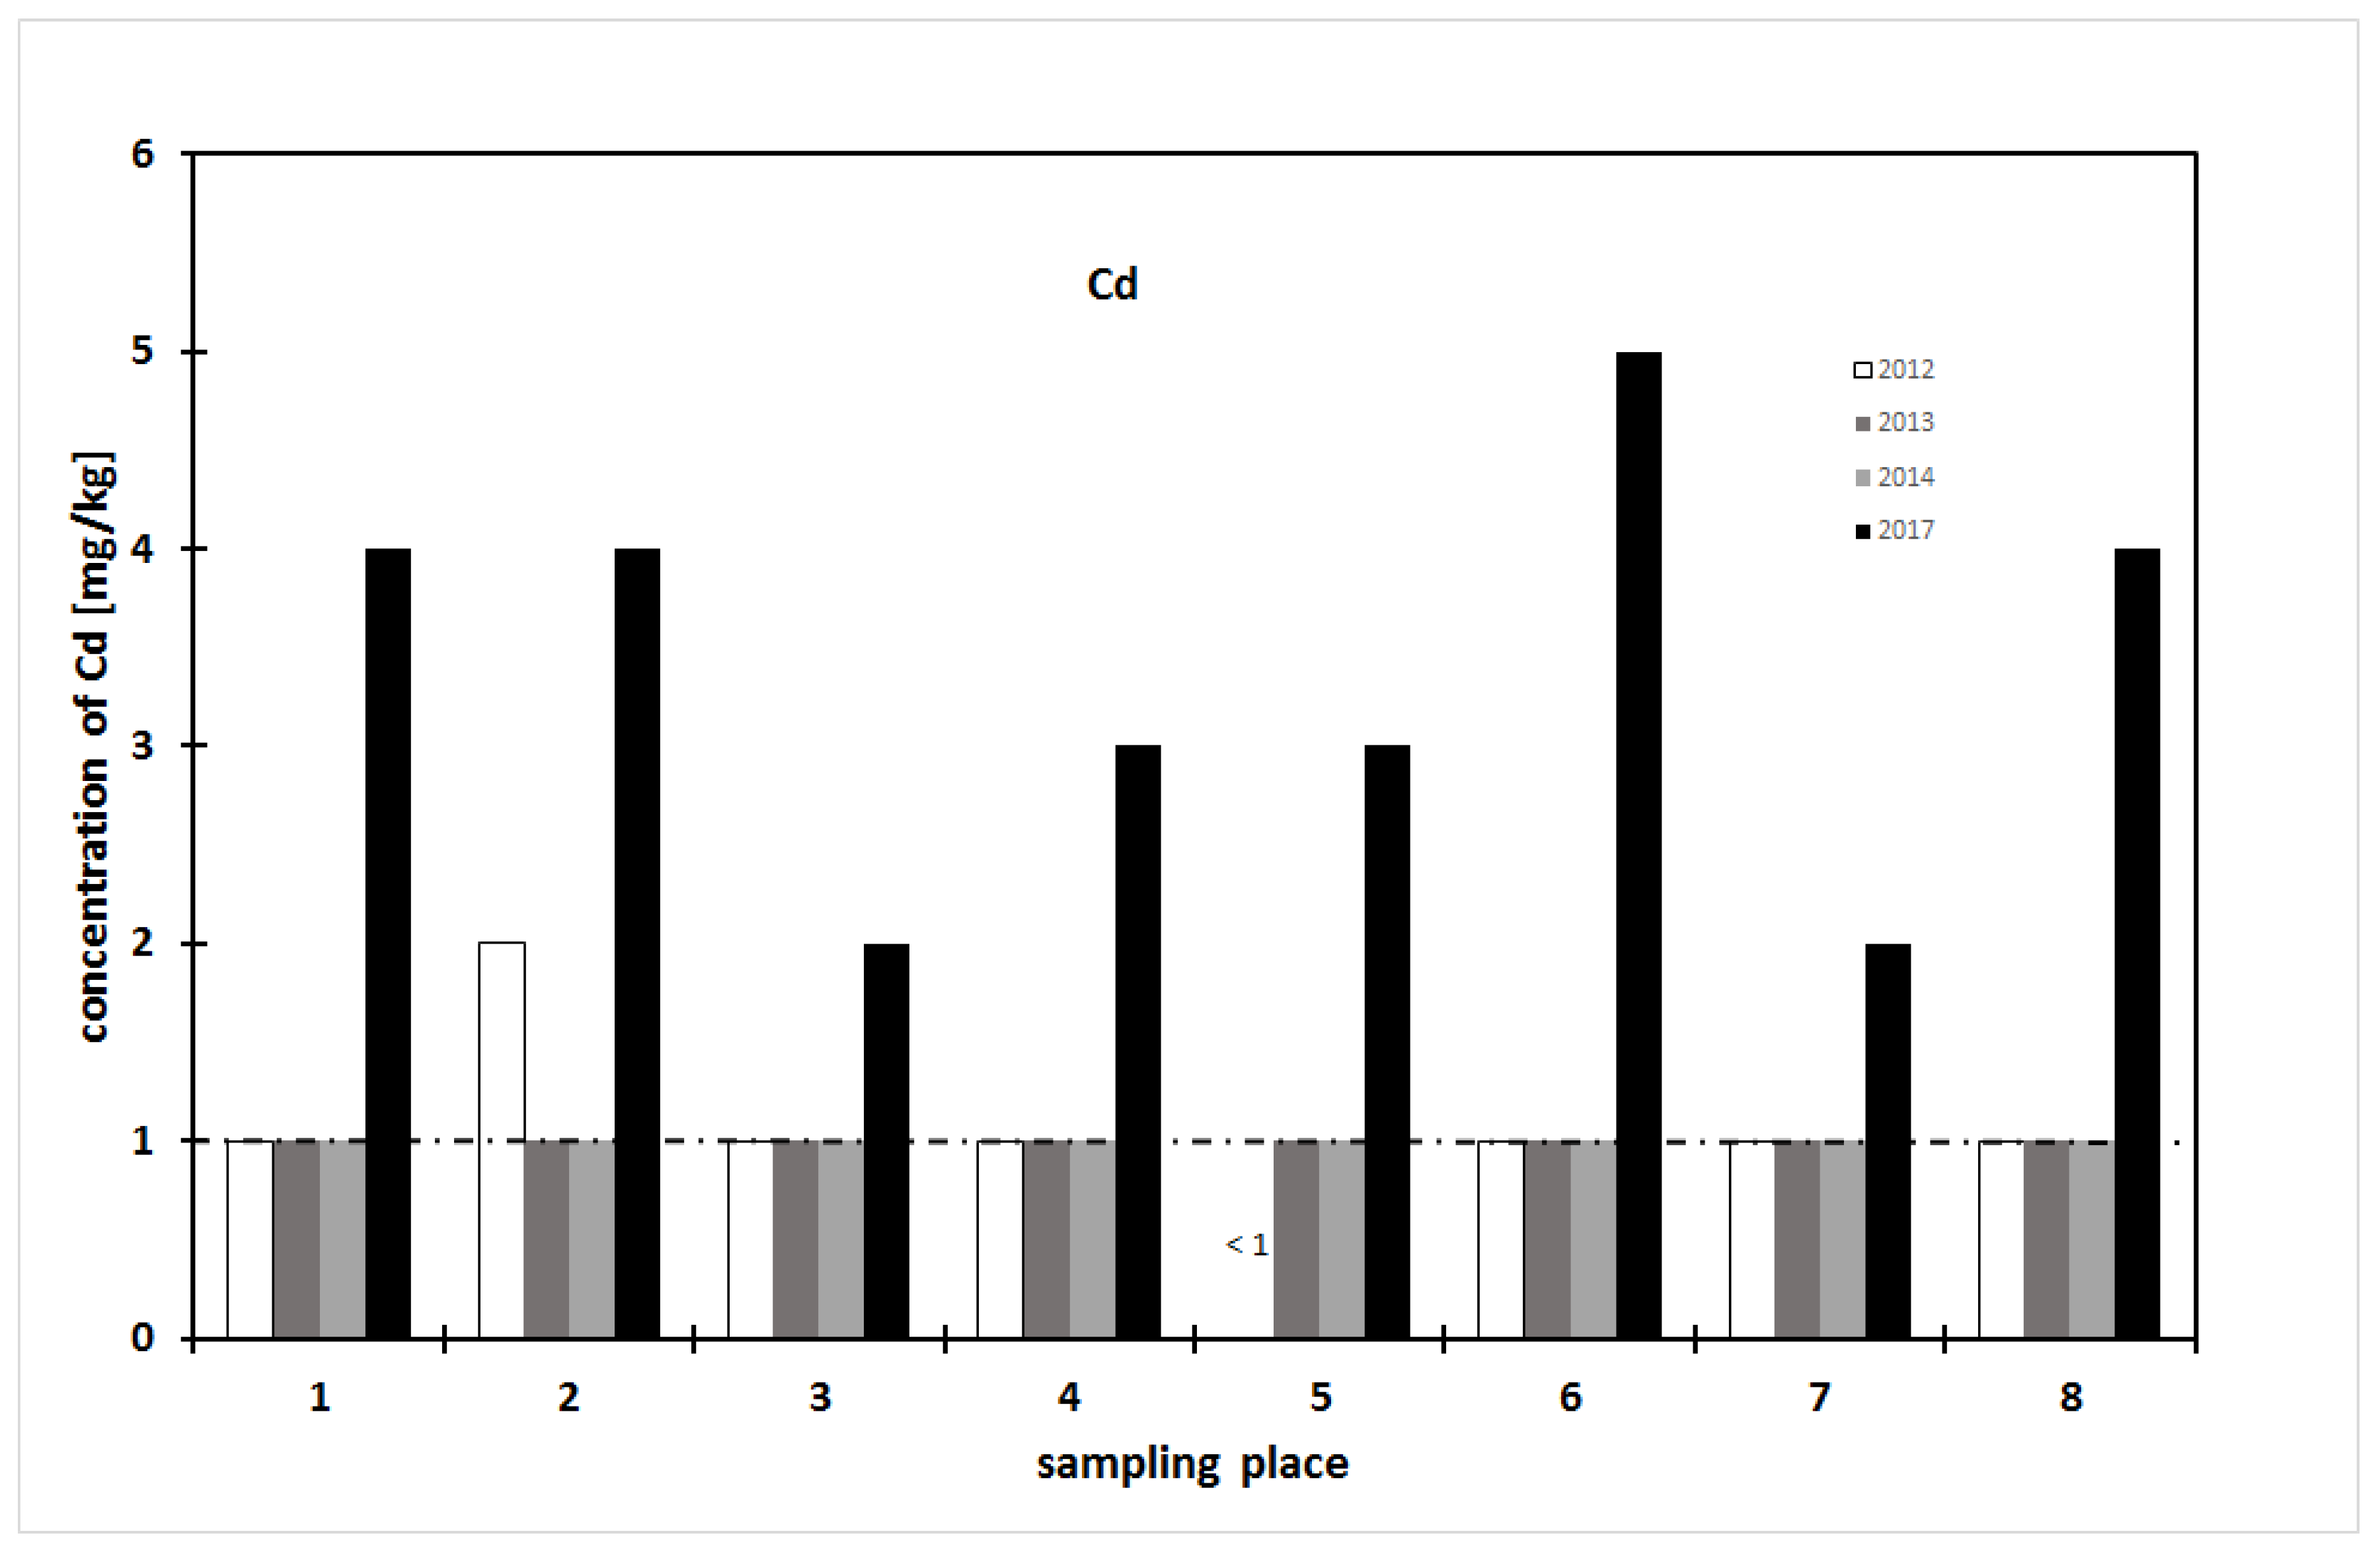
In 2017, four years after the flood, a significant increase in the content of the monitored metals was observed at all sampling points. At sampling point 1, the Cu, Zn, and Ni contents were more than eight times the contents in 2012. Also, at all other sampling points, the contents of all monitored elements were usually two to six times higher. The copper content at sampling point 5 was 11 times higher than before the flood. From this dramatic increase, it is possible that very significant anthropogenic pollution of the Bílina River occurred. This statement is supported by the correlation of the metal concentrations in sediments (Table 6). While a significantly high correlation was found between Ni, Cu, Pb, and Zn, the Cd concentrations did not correlate to the other metals. Despite the values for Cd being near to limit of quantification, these data implicate a joint source of Ni, Cu, Pb, and Zn and a different source of Cd.
The increase of metal concentrations can be partly attributed to drier recent years (lower flow rates can lead to increased sedimentation). Nevertheless, this period is also characterized by increased economic (industrial) activity after an economic crisis. Several new factories were established in the area recently, which includes, among others, the Zn-smelting. In the period, there was also an interruption of the waste-water treatment plant of the Unipetrol oil refinery. Significantly higher levels of the monitored metals were observed at the upper and lower river flows, with the exception of Ni, whose content was not increased at the lower river flow and higher levels were determined only at the upper river flow. High metal contents at the upper river flow (sampling points 1 and 2) are related to the fact that the river passes the Litvínov and Most industrial zones. Contamination at the lower Bílina river flow from sampling point 6 is related to the fact that the river enters the industrialized area around Ústí nad Labem. The lowest content of all the monitored metals was observed at sampling point 3. This sampling point is already far away from the Litvínov and Most industrial zones and there is no major polluter in its vicinity. In its middle section, the river does not flow through any industrial zone. Low metal concentrations in the middle course of the river confirm that the bonding of the monitored metals to the solid phase proceeds rapidly, and the sediment pollution rapidly decreases as the distance from its source increases. In 2017, the levels of all monitored elements increased compared to previous periods, including the pre-flood situation. The measured heavy metal contents in 2017 no longer allowed the sediments to be landfilled on the agricultural land as the limits set by Decree 257/2009 [30] were exceeded. The sediments from the middle river course did not exceed the limits for Ni and Cu, but the Zn and cadmium limits were exceeded in the sediments collected at all the sampling points. Before the flood as well as one year after the flood, the sediments meet the heavy metal limits as specified in the above-mentioned decree. Only at the time shortly after the flood, before the disturbed sediment re-settled again, did the sediments in some places not meet the limits pursuant to Decree 257/2009 [30]. Thus, the flood only had a short-term effect on the sediment quality from the point of view of the content of the monitored metals. The long-term anthropogenic pollution of the Bílina River has a much greater effect on the river.

5. Conclusions

Selected heavy metals (Cd, Cu, Ni, Pb, Zn) in water and sediments were monitored along the Bílina River before, during, and after floods in 2013. The content of metals in the river sediments was many times higher than in the river water. A slight content increase in the sediments was observed along the entire flow of the river as a result of the floods. However, after the flood, the sediment quickly re-settled and the contents of the monitored metals returned to the same values as before the flood. After a four-year period of time that was not accompanied by floods, a significant increase in the metal concentration was observed, likely due to new anthropogenic pollution, the effect of which is significantly higher than the impact of the floods.

Supplementary Materials

The following are available online at https://www.mdpi.com/2073-4441/11/3/481/s1, Table S1: Heavy metal content in sediment samples, in mg/kg, before the flood, 2012 [11], Table S2: Heavy metal content in sediment samples, in mg/kg, during the 2013 flood [9], Table S3: Heavy metal content in sediment samples, in mg/kg, after the flood, 2014, Table S4: Heavy metal content in sediment samples, in mg/kg, after the flood, 2017.

Author Contributions

Conceptualization, J.Č., T.B., M.N., A.S.S. and J.T.; methodology J.Č., T.B., M.N., M.K. and J.T.; validation, J.Č.; investigation, all; data curation, data evaluation J.P. (Jan Popelka); J.P. (Jan Pacina); writing—original draft preparation, J.Č., T.B., M.N., A.S.S. and J.T.; writing—review and editing, J.Č., T.B., M.N., A.S.S. and J.T.; visualization, J.P. (Jan Pacina); supervision, A.S.S., T.B., and M.N.; funding acquisition, J.T.

Funding

This publication is a result of the project “Development” of the UniCRE Centre (LO1606) which has been financially supported by the Ministry of Education, Youth and Sports of the Czech Republic (MEYS) under the National Sustainability Programme I. The result was achieved using the infrastructure of the project Efficient Use of Energy Resources Using Catalytic Processes (LM2015039) which has been financially supported by MEYS within the targeted support of large infrastructures. Research Infrastructure NanoEnviCz, supported by the Ministry of Education, Youth and Sports of the Czech Republic under Project No. LM2015073 contributed to chemical analyses.

Conflicts of Interest

The authors declare no conflict of interest.

References

  1. Ciszewski, D.; Grygar, T.M. A Review of Flood-Related Storage and Remobilization of Heavy Metal Pollutants in River Systems. Water Air Soil Pollut. 2016, 227. [Google Scholar] [CrossRef] [PubMed] [Green Version]
  2. Yu, K.C.; Tsai, L.J.; Chen, S.H.; Ho, S.T. Chemical binding of heavy metals in anoxic river sediments. Water Res. 2001, 35, 4086–4094. [Google Scholar] [CrossRef]
  3. Förstner, U. Contaminated Aquatic Sediments and Waste Sites as Toxic Chemical Time Bombs. Stud. Environ. Sci. 1993, 55, 259–292. [Google Scholar] [CrossRef]
  4. Peng, J.-F.; Song, Y.-H.; Yuan, P.; Cui, X.-Y.; Qiu, G.-L. The remediation of heavy metals contaminated sediment. J Hazard. Mater. 2009, 161, 633–640. [Google Scholar] [CrossRef] [PubMed]
  5. Bradley, S.B. Flood effects on the transport of heavy-metals. Int. J. Environ. Stud. 1984, 22, 225–230. [Google Scholar] [CrossRef]
  6. Ciszewski, D. Flood-related changes in heavy metal concentrations within sediments of the Biala Przemsza River. Geomorphology 2001, 40, 205–218. [Google Scholar] [CrossRef]
  7. Leenaers, H. The transport of heavy-metals during flood events in the polluted river Geul (The Netherlands). Hydrol. Proc. 1989, 3, 325–338. [Google Scholar] [CrossRef]
  8. CHMI (Czech Hydrometeorological Institute). Data from the Hydrological Station in Trmice (River Bílina) Kindly Provided by Czech Hydrometeorological Institute, Ústí nad Labem Branch; Personal communication; CHMI: Praha-Komořany, Czech Republic, 2019. [Google Scholar]
  9. Sirotkin, A.S.; Kirilina, T.V.; Sadykova, R.M.; Trogl, J.; Brovdyova, T.; Neruda, M. Quality and condition control of natural waters at the flood recovery period. Water Chem. Ecol. 2014, 9, 3–8. [Google Scholar]
  10. Neruda, M.; Kramer, D.; Tikhonova, I. Assessment of current conditions of the Bílina River in the Czech Republic. WIT Trans. Built Environ. 2012, 122, 97–108. [Google Scholar] [CrossRef]
  11. Tikhonova, I.O.; Neruda, M.; Kramer, D. Current state of river Bilina in Czech Republic. Water Chem. Ecol. 2012, 7, 89–96. [Google Scholar]
  12. Kruzikova, K.; Svobodova, Z. Assessment of mercury contamination in the Bilina River (Czech Republic) using indicator fish. Acta Vet. Brno. 2012, 81, 63–68. [Google Scholar] [CrossRef]
  13. Kruzikova, K.; Svobodova, Z.; Valentova, O.; Randak, T.; Velisek, J. Mercury and methylmercury in muscle tissue of chub from the Elbe River main tributaries. Czech J. Food Sci. 2008, 26, 65–70. [Google Scholar] [CrossRef] [Green Version]
  14. Blahova, J.; Schandlova, L.; Grabic, R.; Fedorova, G.; Randak, T.; Svobodova, Z. Assessment of polycyclic aromatic hydrocarbon contamination of the Bilina River (Czech Republic) using passive water samplers and fish biliary metabolites. Acta Vet. Brno. 2011, 80, 353–357. [Google Scholar] [CrossRef]
  15. Kohusova, K.; Havel, L.; Vlasak, P.; Tonika, J. A long-term survey of heavy metals and specific organic compounds in biofilms, sediments, and surface water in a heavily affected river in the Czech Republic. Environ. Monit. Assess. 2011, 174, 555–572. [Google Scholar] [CrossRef] [PubMed]
  16. Hradkova, P.; Pulkrabova, J.; Kalachova, K.; Hlouskova, V.; Tomaniova, M.; Poustka, J.; Hajslova, J. Occurrence of Halogenated Contaminants in Fish from Selected River Localities and Ponds in the Czech Republic. Arch. Environ. Contam. Toxicol. 2012, 62, 85–96. [Google Scholar] [CrossRef] [PubMed]
  17. Heinisch, E.; Kettrup, A.; Bergheim, W.; Martens, D.; Wenzel, S. Persistent chlorinated hydrocarbons (PCHC), source oriented monitoring in aquatic media—3. The isomers of hexachlorocyclohexane. Fresenius Environ. Bull. 2005, 14, 444–462. [Google Scholar]
  18. Heinisch, E.; Kettrup, A.; Bergheim, W.; Martens, D.; Wenzel, S. Persistent chlorinated hydrocarbons (PCHC), source-oriented monitoring in aquatic media—2. The insecticide DDT, constituents, metabolites. Fresenius Environ. Bull. 2005, 14, 69–85. [Google Scholar]
  19. Heinisch, E.; Kettrup, A.; Bergheim, W.; Wenzel, S. Persistent chlorinated hydrocarbons (PCHC), source-oriented monitoring in aquatic media—5. Polychlorinated biphenyls (PCBs). Fresenius Environ. Bull. 2006, 15, 1344–1362. [Google Scholar]
  20. Jurajda, P.; Adamek, Z.; Janac, M.; Valova, Z. Longitudinal patterns in fish and macrozoobenthos assemblages reflect degradation of water quality and physical habitat in the Bilina river basin. Czech J. Anim. Sci. 2010, 55, 123–136. [Google Scholar] [CrossRef]
  21. Matouskova, M.; Dvorak, M. Assessment of physical habitat modification in the Bilina River Basin. Limnetica 2011, 30, 293–305. [Google Scholar]
  22. Orendt, C.; Wolfram, G.; Adamek, Z.; Jurajda, P.; Schmitt-Jansen, M. The response of macroinvertebrate community taxa and functional groups to pollution along a heavily impacted river in Central Europe (Bilina River, Czech Republic). Biologia 2012, 67, 180–199. [Google Scholar] [CrossRef]
  23. Medek, J.; Hájek, P.; Král, S.; Skořepa, J.; Hönig, J.; Kokšal, J.; Neuhöfer, M.; Bednárek, J.; Janský, B.; Langhammer, J.; et al. Význam Bíliny jako historického a současného zdroje znečištění pro nakládání se sedimenty v povodí Labe –SedBiLa. 2011. Available online: http://elsa-elbe.de/massnahmen/fachstudien-neu/fachstudie-sedbila.html (accessed on 21 February 2019). (In Czech).
  24. Bryan, G.W.; Langston, W.J. Bioavailability, accumulation and effects of heavy-metals in sediments with special reference to United-Kingdom estuaries—A review. Environ. Pollut. 1992, 76, 89–131. [Google Scholar] [CrossRef]
  25. ISO (International Organization for Standardization). ISO 5667-6: Water Quality—Sampling—Part 6: Guidance on Sampling of Rivers and Streams; ISO: Geneva, Switzerland, 2014. [Google Scholar]
  26. ISO (International Organization for Standardization). ISO 5667-3: Water Quality—Sampling—Part 3: Preservation and Handling of Water Samples; ISO: Geneva, Switzerland, 2012. [Google Scholar]
  27. ISO (International Organization for Standardization). ISO 5667-12: Water Quality—Sampling—Part 12: Guidance on Sampling of Bottom Sediments from Rivers, Lakes and Estuarine Areas; ISO: Geneva, Switzerland, 1995. [Google Scholar]
  28. CEN (European Committee for Standardization). EN 13657—Characterization of Waste—Digestion for Subsequent Determination of Aqua Regia Soluble Portion of Elements; CEN: Brussels, Belgium, 2002. [Google Scholar]
  29. The Government of the Czech Republic. Nařízení vlády č. 401/2015 Sb. o ukazatelích a hodnotách přípustného znečištění povrchových vod a odpadních vod, náležitostech povolení k vypouštění odpadních vod do vod povrchových a do kanalizací a o citlivých oblastech; The Government of the Czech Republic: Praha, Czech Republic, 2015. (In Czech)
  30. The Government of the Czech Republic. Vyhláška 257/2009 o používání sedimentů na zemědělské půdě; The Government of the Czech Republic: Praha, Czech Republic, 2009. (In Czech)
  31. Anderson, M.J. A new method for non-parametric multivariate analysis of variance. Austral. Ecol. 2001, 26, 32–46. [Google Scholar] [CrossRef]
  32. Adamec, V.; Licbinsky, R.; Jandova, V.; Huzlik, J. Emission from transport, their trends and share on air pollution in The Czech Republic. In Bioklima; Proceedings of Book of Abstracts of the International Conference, Prague, Czech Republic, 7–9 Sptember 2010; Czech Bioclimatology Society: Praha, Czech Republic, 2010; pp. 3–6. [Google Scholar]
  33. Wang, Q.; Zhang, Q.H.; Dzakpasu, M.; Chang, N.N.; Wang, X.C. Transferral of HMs pollution from road-deposited sediments to stormwater runoff during transport processes. Front. Environ. Sci. Eng. 2019, 13. [Google Scholar] [CrossRef]
  34. Colvile, R.N.; Hutchinson, E.J.; Mindell, J.S.; Warren, R.F. The transport sector as a source of air pollution. Atmos. Environ. 2001, 35, 1537–1565. [Google Scholar] [CrossRef] [Green Version]
Figure 1. Map of the Bílina river with sampling sites.
Water 11 00481 g001
Figure 2. Content of Cd in sediments at individual sampling sites in 2012, 2013, 2014, and 2017. The dashed line represents the limits for risk elements according to Annex No. 1 of the Czech Decree 257/2009 Coll. [30]. Limit of quantification <1 mg/kg.
Water 11 00481 g002
Figure 3. Content of Cu in sediments at individual sampling places in 2012, 2013, 2014, and 2017. The dashed line represents the limits for risk elements according to Annex No. 1 of the Czech Decree 257/2009 Coll. [30]. Limit of quantification <1 mg/kg.
Water 11 00481 g003
Figure 4. Content of Ni in sediments at individual sampling places in 2012, 2013, 2014, and 2017. The dashed line represents the limits for risk elements according to Annex No. 1 of the Czech Decree 257/2009 Coll. [30]. Limit of quantification <0.5 mg/kg.
Water 11 00481 g004
Figure 5. Content of Pb at individual sampling places in 2012, 2013, 2014, and 2017. The dashed line represents the limits for risk elements according to Annex No. 1 of the Czech Decree 257/2009 Coll. [30]. Limit of quantification <3 mg/kg.
Water 11 00481 g005
Figure 6. Content of Zn at individual sampling places in 2012, 2013, 2014, and 2017. The dashed line represents the limits for risk elements according to Annex No. 1 of the Czech Decree 257/2009 Coll. [30]. Limit of quantification <0.5 mg/kg.
Water 11 00481 g006
Table 1. Flow rates at the sampling site Trmice hydrological station [8].
Date12 May 20113 July 201320 July.201427 July 2018
Flow rate (m3/s)6.056.842.502.91
Table 2. Sampling points with their coordinates.
IDPlaceCoordinates
1Most Lake N 50°31.74173′, E 13°37.81618′
2MostN 50°30.92012′, E 13°39.02640′
3Bílina—town centreN 50°33.10295′, E 13°46.36492′
4Chotějovice—power stationN 50°34.7466′, E 13°48.27937′
5Trmice—hydrologic stationN 50°38.81265′, E 14°0.39437′
6Trmice—confluence with Ždírnický potokN 50°39.16243′, E 14°0.40597′
7Ústí nad Labem—Západ train stationN 50°39.42853′, E 14°1.87623′
8Ústí nad Labem—confluence with Elbe River N 50°39.45648′, E 14°2.55022′
Table 3. Working conditions of the ICP-OES instrument.
ParameterValue
power (W)1300
plasma gas flow (L·min−1)8.0
auxilliary gas flow (L·min−1)0.55
carrier gas flow (L·min−1)0.20
plasma viewradial
sample flow rate (L·min−1)1.50
Table 4. Heavy metal content in water (mg/L) before the flood (2012, data from Tikhonova et. al, 2012 [11]), during the flood (2013, data from Sirotkin et al, 2013 [9]), and after the flood (2014 and 2017, original data). The < sign indicates values bellow the limit of quantification.
MetalSampling Sites
Year12345678
Cd
2012<0.01<0.01<0.01<0.01<0.01<0.01<0.01<0.01
2013<0.01<0.01<0.01<0.01<0.01<0.01<0.01<0.01
2014<0.01<0.01<0.01<0.01<0.01<0.01<0.01<0.01
2017<0.01<0.01<0.01<0.01<0.01<0.01<0.01<0.01
Cu
2012<0.02<0.02<0.02<0.02<0.02<0.02<0.02<0.02
20130.010.020.010.01<0.010.010.010.01
2014<0.01<0.01<0.01<0.01<0.01<0.010.010.01
20170.030.030.030.030.020.020.030.03
Ni
2012<0.02<0.02<0.02<0.02<0.02<0.02<0.02<0.02
20130.020.020.010.010.010.010.010.01
20140.020.020.010.010.010.010.010.01
2017<0.010.02<0.01<0.01<0.01<0.01<0.01<0.01
Pb
2012<0.1<0.1<0.1<0.1<0.1<0.1<0.1<0.1
2013<0.02<0.02<0.02<0.02<0.02<0.02<0.02<0.02
2014<0.02<0.02<0.02<0.02<0.02<0.02<0.02<0.02
2017<0.02<0.02<0.02<0.02<0.02<0.02<0.02<0.02
Zn
2012<0.005<0.005<0.005<0.005<0.005<0.005<0.005<0.005
20130.010.020.010.020.010.010.010.01
20140.020.020.010.020.020.030.050.03
20170.010.020.030.040.040.030.030.03
Table 5. PERMANOVA comparison of metal concentrations in sediments, denoted are F-criteria and their significance (** p < 0.05).
CdCuPbZnNi
Year1379.7 **636.22 **390.22 **9597.6 **1830.8 **
Locality36.218 **21.29 **43.811 **338.06 **62.924 **
Interaction40.367 **16.873 **25.837 **117.01 **70.584 **
Table 6. Correlation table of the metal contents in sediments. Bold font indicates significant correlations (p < 0.05). Bold font indicates significant correlations. The italics is just to distinguish the correlation between the variables itself.
MetalCdCuPbZnNi
Cd1
Cu−0.001
Pb0.120.911
Zn0.070.910.831
Ni0.040.870.860.821

