Impact Assessment of Distribution Network Layout on the Reliability of Water Delivery
by
 , and
, and
Dariusz Kowalski
1,*, 
Beata Kowalska
1,
Tomasz Bławucki
2,
Paweł Suchorab
1 and
and
Krzysztof Gaska
3 1
Faculty of Environmental Engineering, Lublin University of Technology, 20-618 Lublin, Poland
2
Faculty of Electrical Engineering and Computer Science, Lublin University of Technology, 20-618 Lublin, Poland
3
Institute of Water and Wastewater Engineering, Faculty of Energy and Environmental Engineering, Silesian University of Technology, 44-100 Gliwice, Poland
*
Author to whom correspondence should be addressed.
Water 2019, 11(3), 480; https://doi.org/10.3390/w11030480
Submission received: 17 January 2019
/
Revised: 28 February 2019
/
Accepted: 3 March 2019
/
Published: 7 March 2019
(This article belongs to the Section Urban Water Management)
Abstract
:The process of shaping distribution network structures is one of the most fundamental design tasks, and determines the delivery certainty of media transported by them. It is especially crucial with reference to network elements of a critical character, such as roads or water supply, sewage, or electrical networks. In urban conditions, the geometric shaping of these structures has a quasi-chaotic character that is individual for each network and city. The complexity of these networks increases significantly with the size of a city, and therefore the evaluation of water delivery certainty is also a difficult issue. Despite many years of research, there is no universal method to evaluate this certainty. The objective of this paper is to present two original approaches: the number of minimal efficiency paths from a water source to reference consumption nodes, and the relation of this number to the fractal dimension of a network’s geometric structure. The developed methods were tested in the conditions of a few real water supply networks. The obtained results indicate that the analyzed methods can be used for the preliminary and relatively rapid evaluation of water delivery certainty.
1. Introduction
According to the United Nations report, 60% of the global population is projected to live in cities by 2030 [1]. The welfare and safety of residents depends on high-performance technical infrastructure, including power distribution and water supply networks, gas grids, heat distribution networks, telecommunication networks, as well as road networks [2]. The major objectives of this infrastructure involve the supply of specific utilities to consumers. In the case of water supply infrastructure, a reliable supply of water in the right quantity, at the required pressure, and of adequate quality should be ensured. The reliability assessment of the supply covering all aspects has become a key issue in urban governance [3]. However, it turns out that this is not an easy task. Urban development has led to increased city size and higher urban infrastructure complexity. Utility network layout is specific for a given city. The large number of factors influencing the arrangement of infrastructure links gives a quasi-random character to the thus-formed geometric set. All these factors have prevented the development of a universal method for assessing the reliability of utility services supply via urban infrastructure networks. To date, undertakings in this respect have focused on two main aspects [4,5,6]: the assessment of the efficient operation of the existing networks, and the assessment of the reliability of utilities supply via networks at the network design stage.
In the first group of undertakings, the reliability theory has been employed. The assessment is based on collected performance data, mainly including the number and types of failures, and times of their occurrence and repair [7]. This allows a variety of reliability indicators related to specific components of the examined infrastructure to be identified, such as the efficiency probability of the selected network components. Additional information, such as the age of specific fragments of the examined infrastructure, the manufacturing materials, service load, structural load, weather conditions etc., allows different methods to be implemented for anticipating the potential time and area/site of a failure, estimating the risk of possible failure occurrence, limiting the overall operational costs, or the costs incurred through the repairs of network failures [8,9,10,11,12,13]. Here, the layout of the examined networks is considered to be of secondary importance. This layout can be considered by using, for example, the method of minimum efficiency paths, but then determining the probability of water supply from the source to a given recipient requires the knowledge of the efficiency probability of the particular components of the network [14,15].
The undertakings related to assessing the reliability of utilities supply while designing the infrastructure are more complex. In the absence of performance data, the probable reliability of individual components of the infrastructure is assessed using the data found in the literature [16]. The assessment of the reliability of utilities supply at subsequent stages may be conducted as in the case of the first group of undertakings. However, it is worth remembering that the use of the efficiency path method leads most often to neglecting the role of the flow resistance, of the discharge capacity, or of the demand distribution. In recent years, however, other approximate assessment methods have appeared that are primarily based on the analysis of the (geometric) layout of infrastructure networks. They assume the occurrence of one of three cases [6]: failures affecting links only, nodes only, or links and nodes at the same time. In any of the above cases, the main objective is to define the minimum efficiency or inefficiency paths (minimal cut set) between the source (s—source) and each consumer (t—sink node). A number of algorithms based on graph theory [5,14,17,18] have been developed to solve this problem. Zhibin [19] suggested the development of these methods. His method provides for determining/identifying efficiency paths, assuming that failures are likely to occur in both the nodes and links of a network. However, he has only tested his method on a model network made of four nodes and seven links. Yeh [18] developed an algorithm considering the stochastic flow via s–t network, but he limited himself to a single source network. Due to calculation limitations appearing in the above-mentioned algorithms, Kansal and Devi [20] have proposed that the reliability of utility supply be assessed only by determining the number of minimum efficiency or inefficiency paths. They tested their algorithm on a system containing 18 nodes, assuming that failures are likely to occur only along links connecting the nodes.
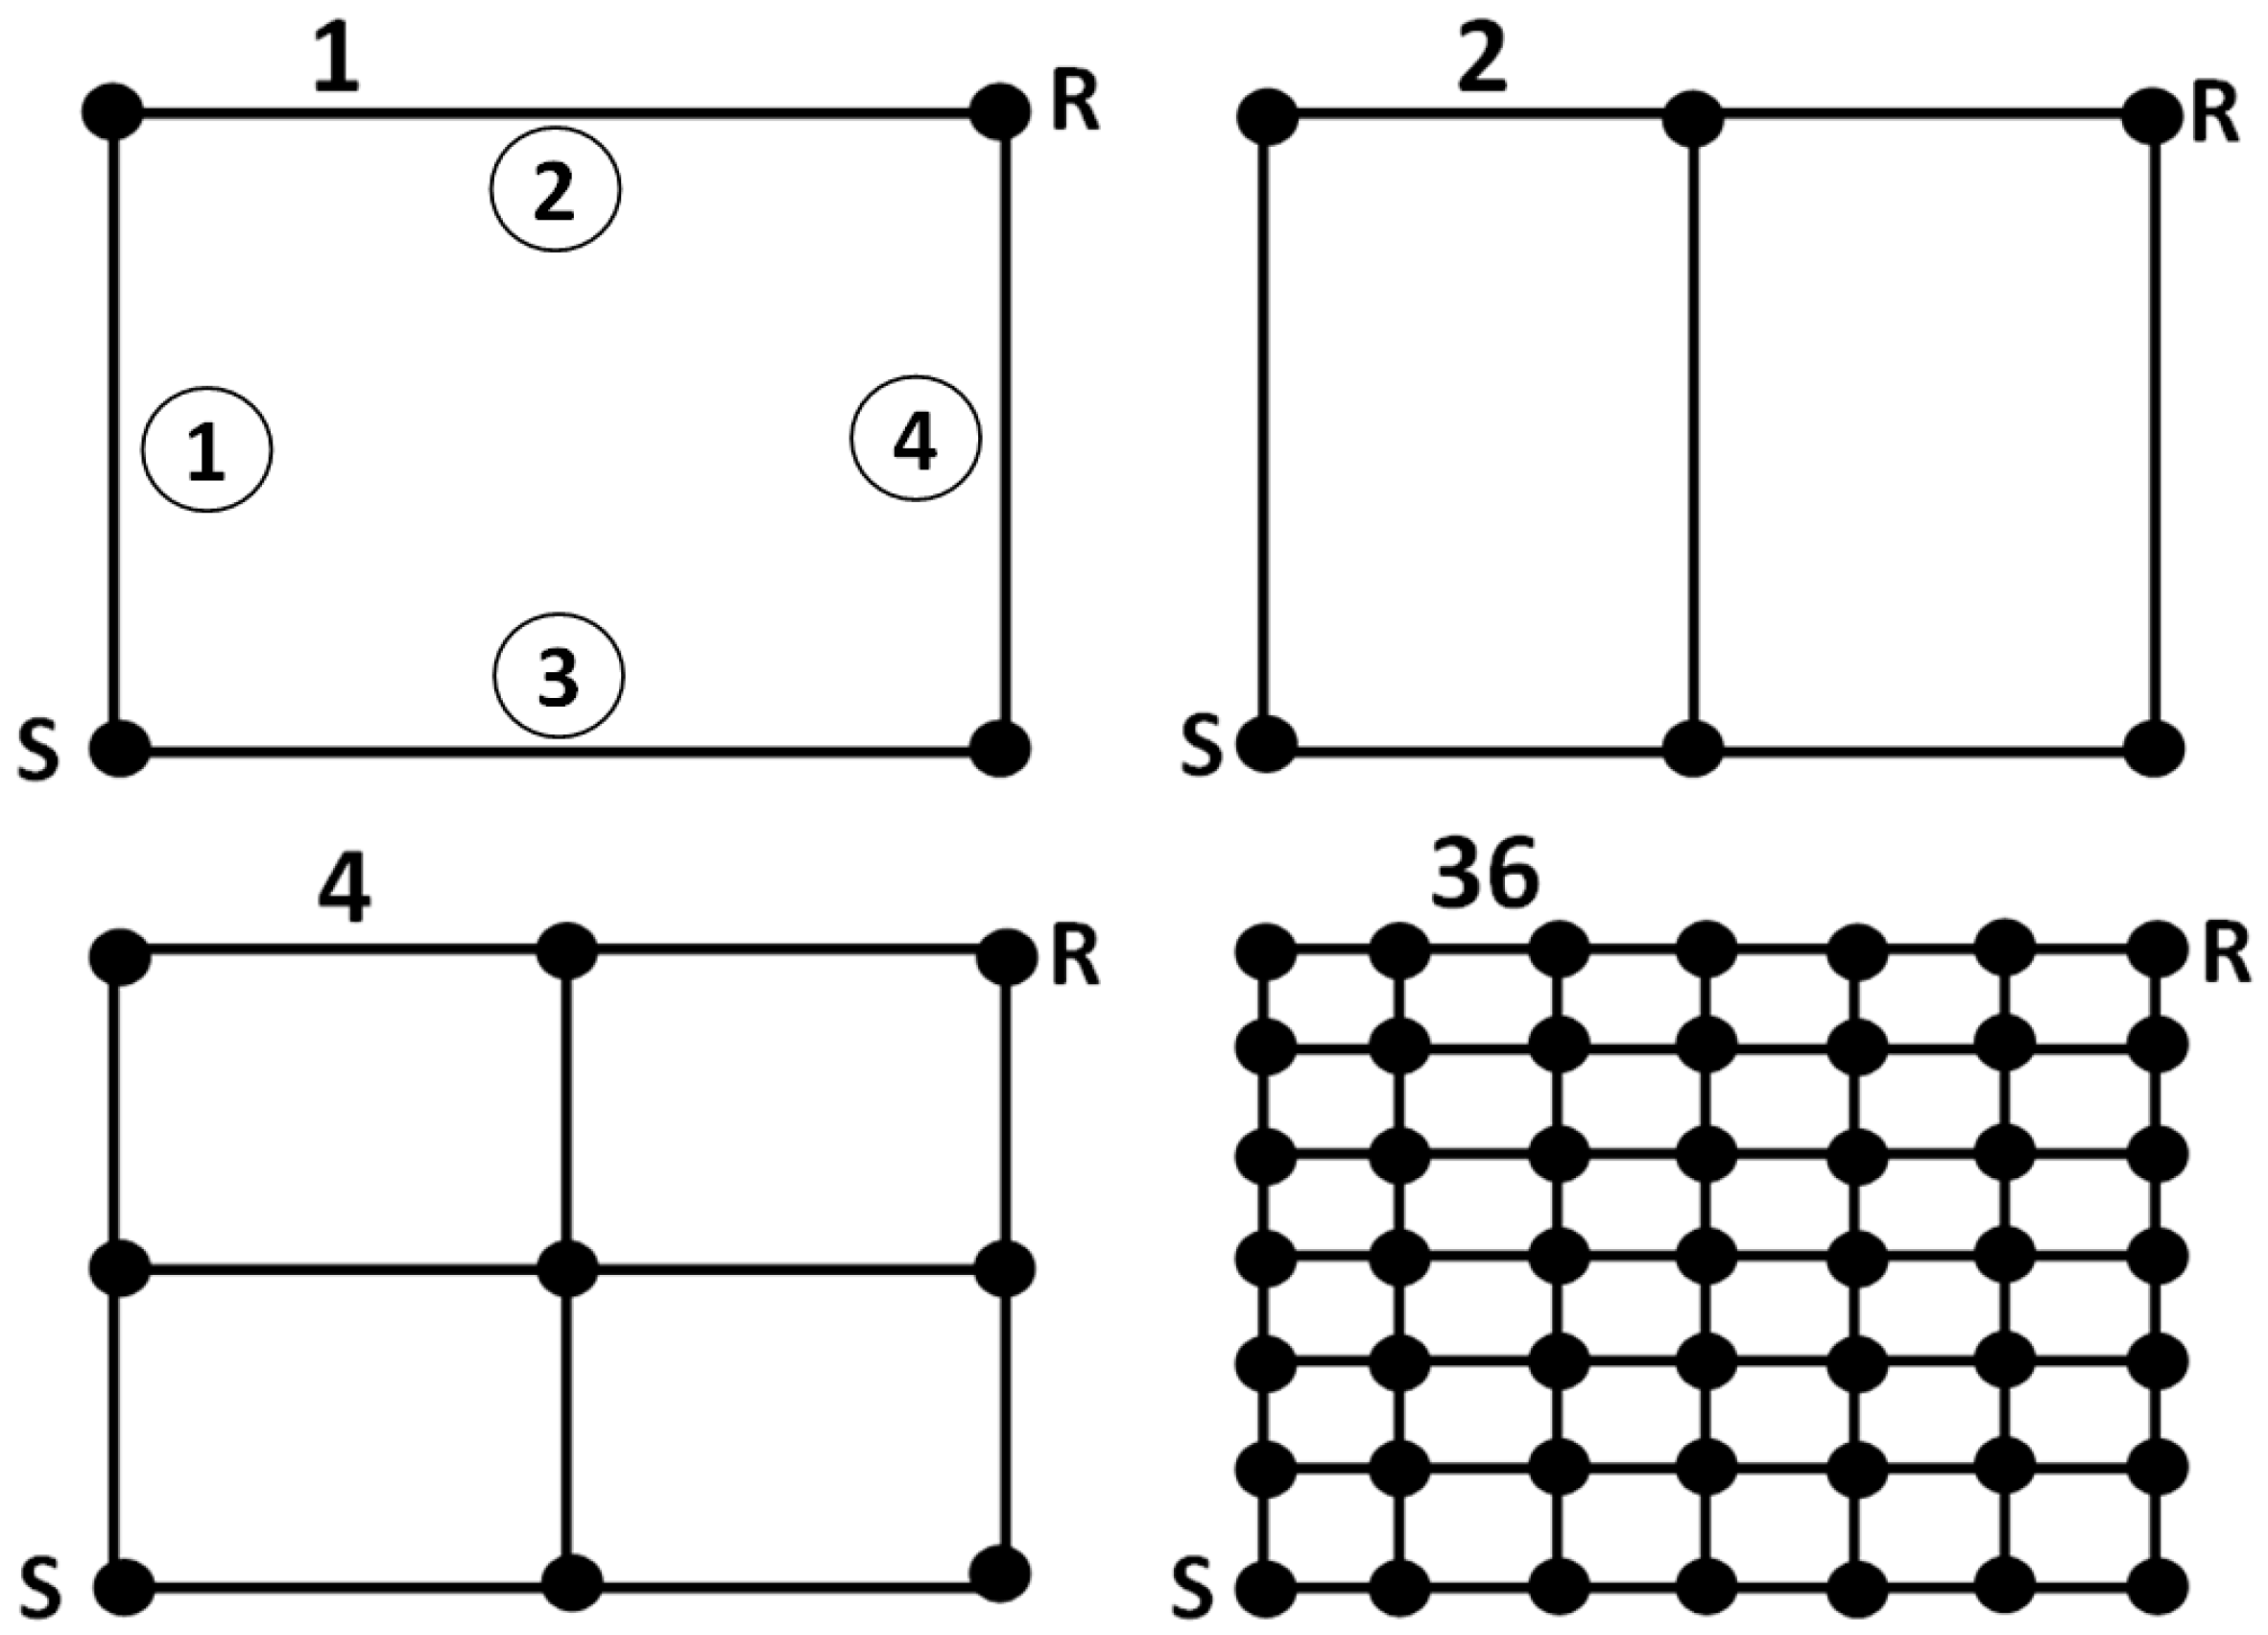
Another approach to an approximate assessment of water supply certainty was proposed by Yazdani and Jeffrey [21] based on two indicators characterizing network topology: the average node degree ratio (ANDr) and meshedness coefficient ratio (MCr). Based on these indicators, Jung and Kim [22] proposed an optimization method aiming at the system design to minimize costs and maximize topic and hydraulic reliability. This task was carried out based on a model network containing 6 × 6 nodes. Maiolo et al. [23] proposed a method of evaluation using the vulnerability measure. This task was tested, among others, at the network proposed by Ozger and Mays [24] (2 reservoirs, 13 nodes, and 21 pipes).
It should be noted, however, that the existing urban infrastructure networks have numerous nodes and links. This makes the assessment rather labor-intensive and relatively unreliable. Proper interpretation of the obtained results also poses a problem. In view of the above, it is necessary to search for new methods for assessing the reliability of utilities supply via the infrastructure networks. The paper presents two self-originated methods for assessing an approximate reliability of utilities supply via complex infrastructure networks, using the number of efficiency paths linking the source and reference service points, and the relationship between the number of paths and the fractal dimension of the geometric layout of the network. The presentation is based on a selected model and the existing water supply networks.
2. Materials and Methods
As specified in the study objectives, the paper presents two authors’ methods for assessing the reliability of water delivery to consumers via a water supply network: the reference service point method, and the method based on the fractal dimension of network layouts. The proposed methods relate only to one element of water supply reliability—supply of water, ignoring the aspects of its pressure and quality. In both methods, the assessment was based on checking the possibility of water supply from a single source to a selected customer—the most unfavorably located one in relation to the source. The assessment considered the geometrical structure of the existing links in the analyzed networks, ignoring the problems involving the resistance head in water and flow capacity.
The efficiency path method was used in the calculations. Therefore, it was necessary to know the probability of the efficiency of the links connecting the network nodes. The adopted value of probable efficiency of individual links was 0.99 [16]. In the calculations, we assumed that failures occur only in the links of the analyzed networks.
This study examined water supply networks. The layout of municipal water supply networks is very intricate (i.e., branched, looped, and mixed systems). As in the case of any other type of urban infrastructure, the layout is city-specific, and since it is additionally influenced by numerous factors, the spatial arrangement of the networks is also quasi-random [25]. The authors examined 22 model and 7 existing networks found in real cities. Model networks included:
- -
- A linear network, made of four nodes and three links (Figure 1), where water can flow in only one direction;
- -
Basic data describing the layouts of the analyzed networks operating in the selected cities are collected in Table 2.
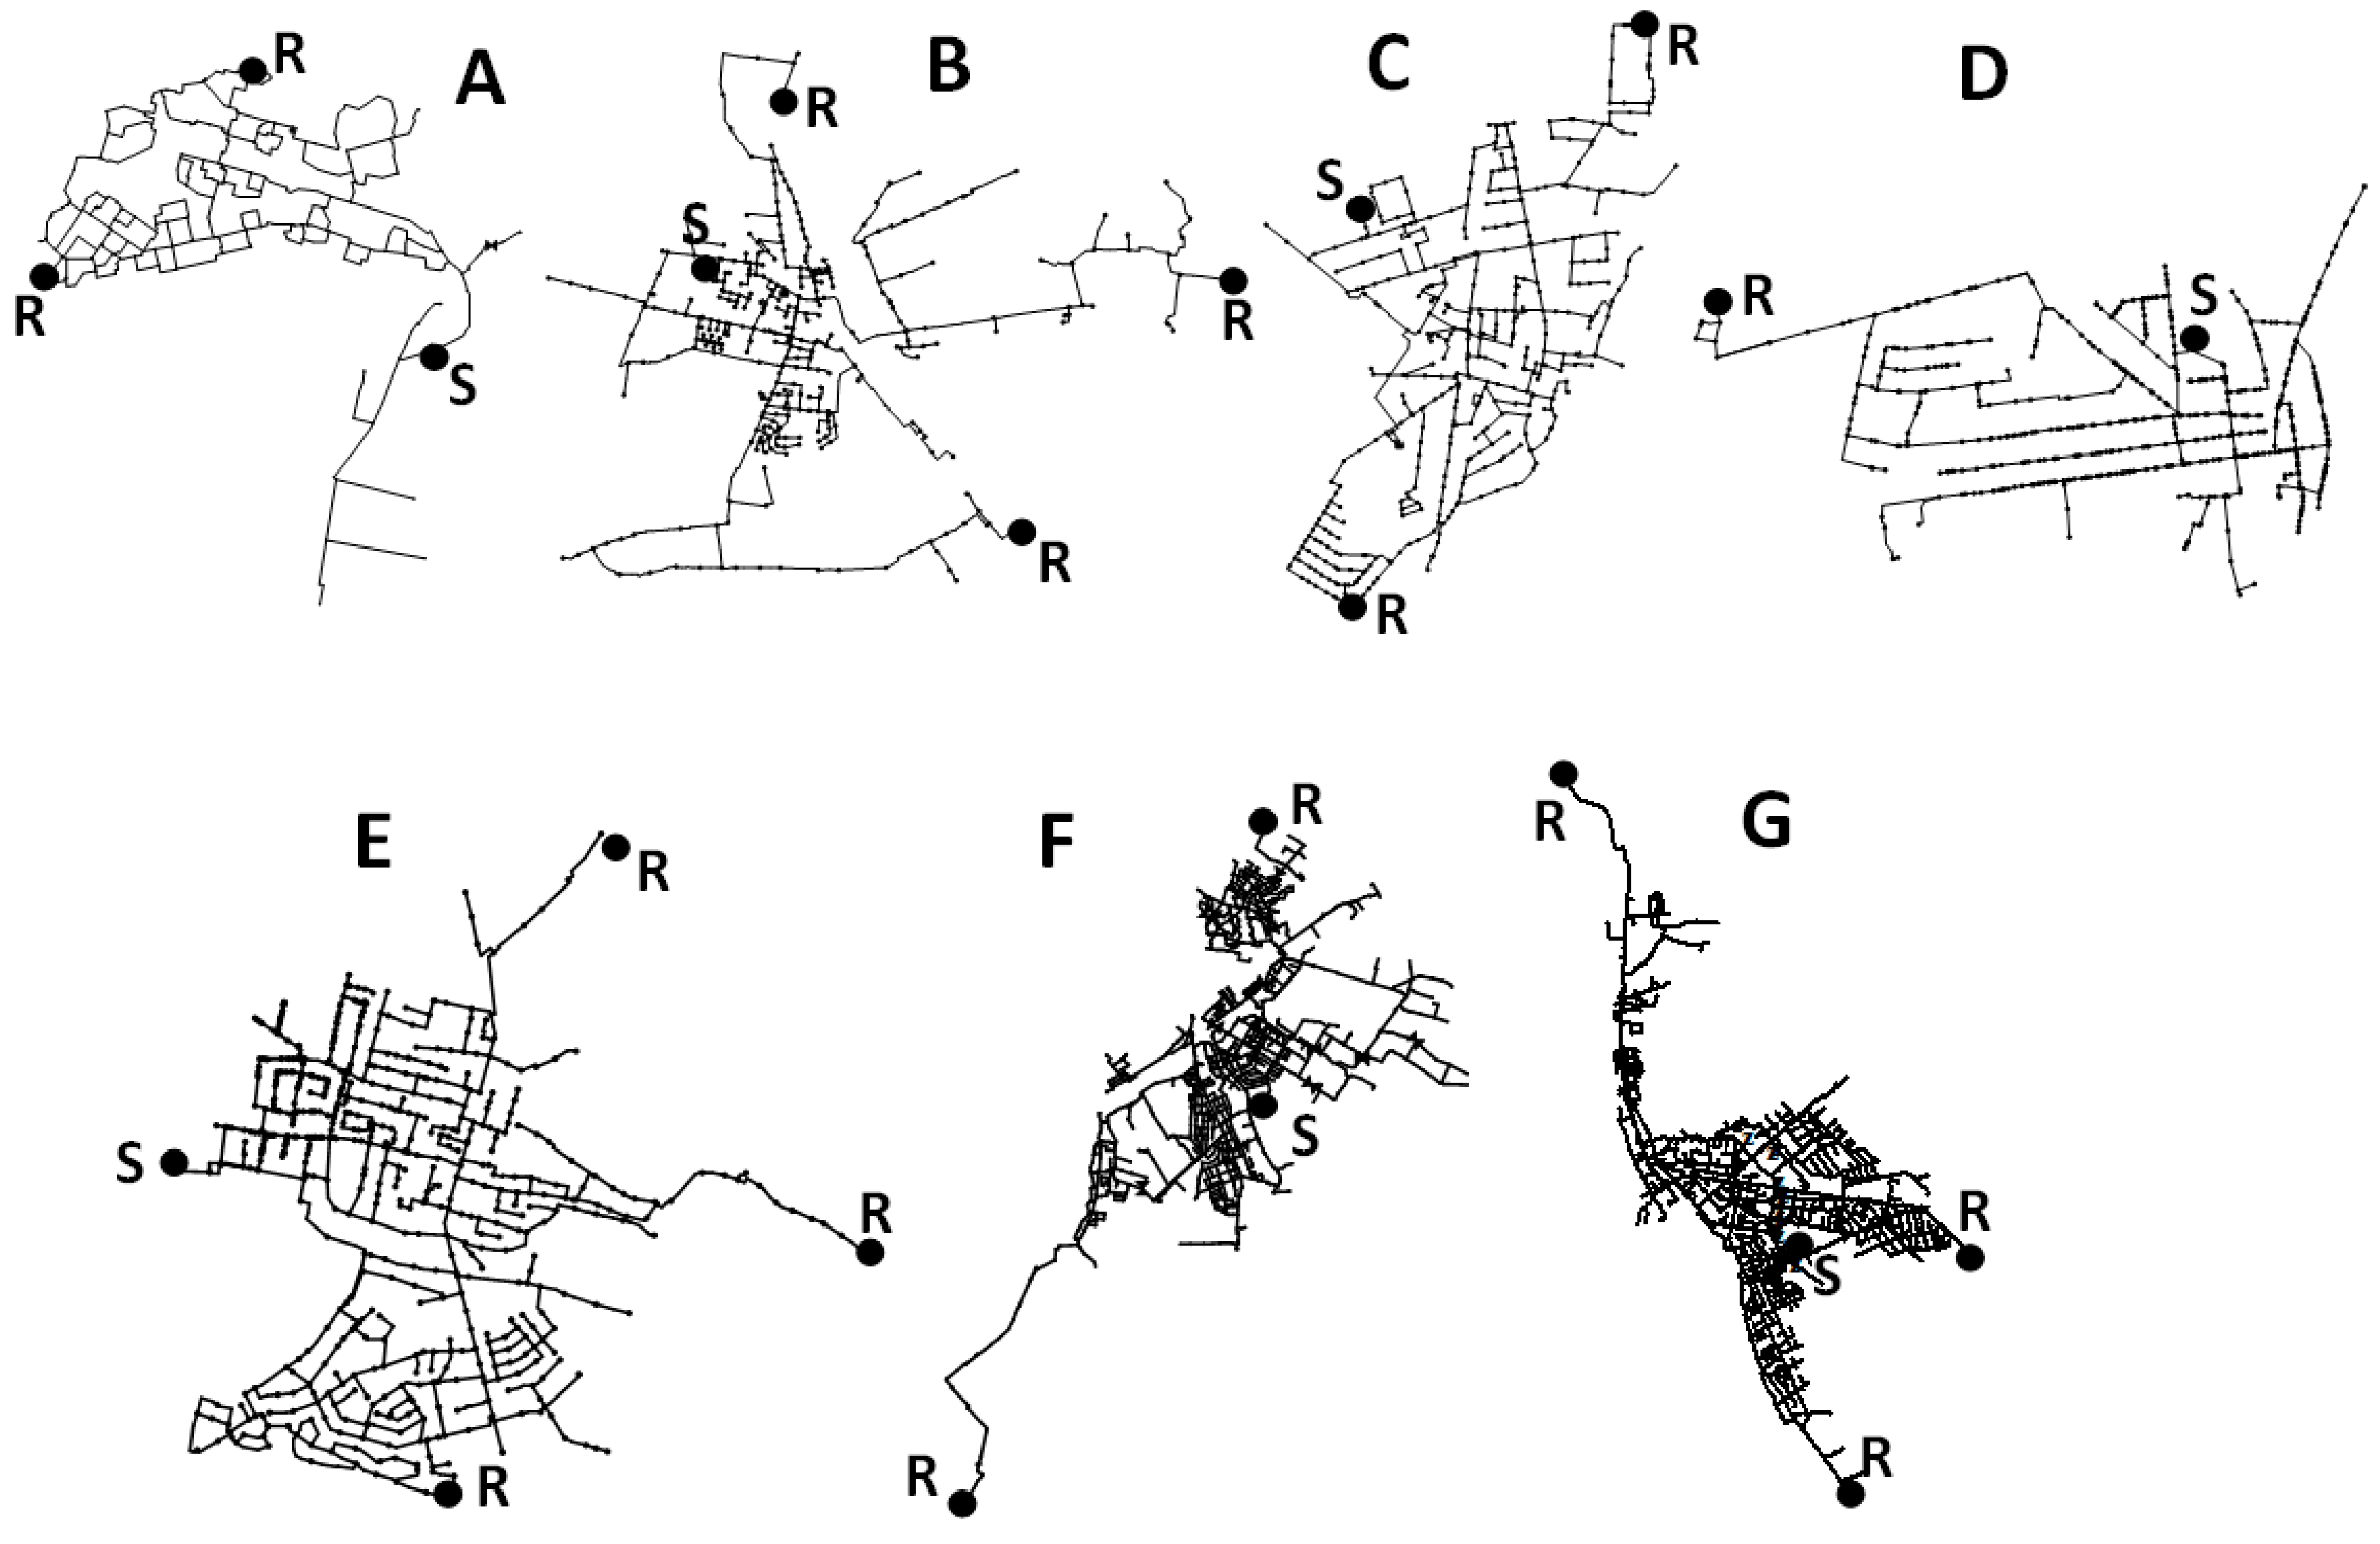
The data presented in the table demonstrate no strict dependence between the number of nodes and links and the number of residents supplied with water via specific networks. This confirms previous statements about the case-specific and quasi-random nature of water supply network layouts. The layouts are presented in Figure 3.
All examined water supply networks were mixed systems, containing numerous loops and many branches. In addition, all analyzed networks had a single source of water supply.
2.1. Reference Service Point Method
The method is based on the above-presented algorithms for determining efficiency paths linking the water source and its supply terminals. The probable efficiency of an efficiency path in time t may be determined using the formula [6,15,16]:
where Pj(t) is the probable efficiency of path j, Pi(t) is the probable efficiency of the link being a component of a determined efficiency path, j is the number of an efficiency path, i is the reference number of the link being a component of path j, and n is the number of links included in an efficiency path.
The reliability of water supply via an examined network can be calculated as the probable efficiency of at least one path from among the defined efficiency paths, using the formula [6,15,16]:
where Ps(t) is the probable efficiency of at least one of the fixed efficiency paths in time t, and k is the number of defined efficiency paths.
Table 3 presents a calculation example of the efficiency path method used to determine the probability of water delivery from point S to point R, for model network no. 1 (Figure 1).
In more complex network structures, the efficiency paths were defined using graph theory. The calculations were based on DFS (depth-first search) [26]. After importing the layouts of the examined networks into the program, the following objects were created: Graph, Node, and Edge. In order to avoid cycles, and consequently infinite loops of searching graph data structures, each encountered node could be used only once. The Graph object stored information about edge duplicates detected in the input file, and the number of defined paths once the calculations were made. During the run of graph searching algorithm, the currently used nodes and the total number of traversals between the nodes were recorded. The algorithm was additionally expected to validate the imported data, create an object-based representation of the graph based on the read out data, connect the nodes as neighbors, and recurrently traverse the graph from the determined starting node to the target node. The Node class allows the nodes to be presented as objects, whereas the Edge class represents graph edge components. Edges were used to collect information about neighboring nodes. Additionally, due to duplicates that may be found in the input file, the set of imported edges was validated for repetitions (e.g., two edges having different names determining the same neighbor relationship).
The software based on the above-presented algorithm was created using the Python 3.6 language, and Qt library [27,28], adapted to apps written in this language.
In order to reduce labor intensity and to facilitate the interpretation of the obtained results, the authors proposed to make calculations only for selected reference service points, instead of all water supply terminals as suggested—among others—by Yeh [18], Zhibin [19], or Kansal and Devie [20]. Such terminals should be located in the worst-case conditions in relation to the water source. In the case of model networks (Figure 1 and Figure 2), these are the terminals most distant from the source. While considering the existing networks, the authors propose to determine from one to three reference points (Figure 3). The most wanted solution is then the lowest value of probability calculated using Formula (2), defined for each reference point in a given network.
The use of the number of defined efficiency paths as an independent indicator is a modification of the above method. Unlike in Kansal and Devi’s method [20], instead of considering all possible links between network nodes, we suggest limiting the analysis to the paths linking water sources and reference points. As previously, the proposed solution is to adopt the lowest of the defined values for each reference point.
2.2. Method Based on Fractal Dimension
As already mentioned, the layouts formed by urban infrastructure networks, including water supply networks, are of very specific, semi-random nature. Based on the studies by Mandelbrot [29] and Falconer [30], it was found that these structures can be described using fractal geometry [25]. The degree of complexity of a given layout can therefore be defined using the fractal dimension, calculated using the formula [31]:
where dimBF is the value of the fractal dimension, and Nδ is the number of squares with sides of length δ covering a given geometric set.
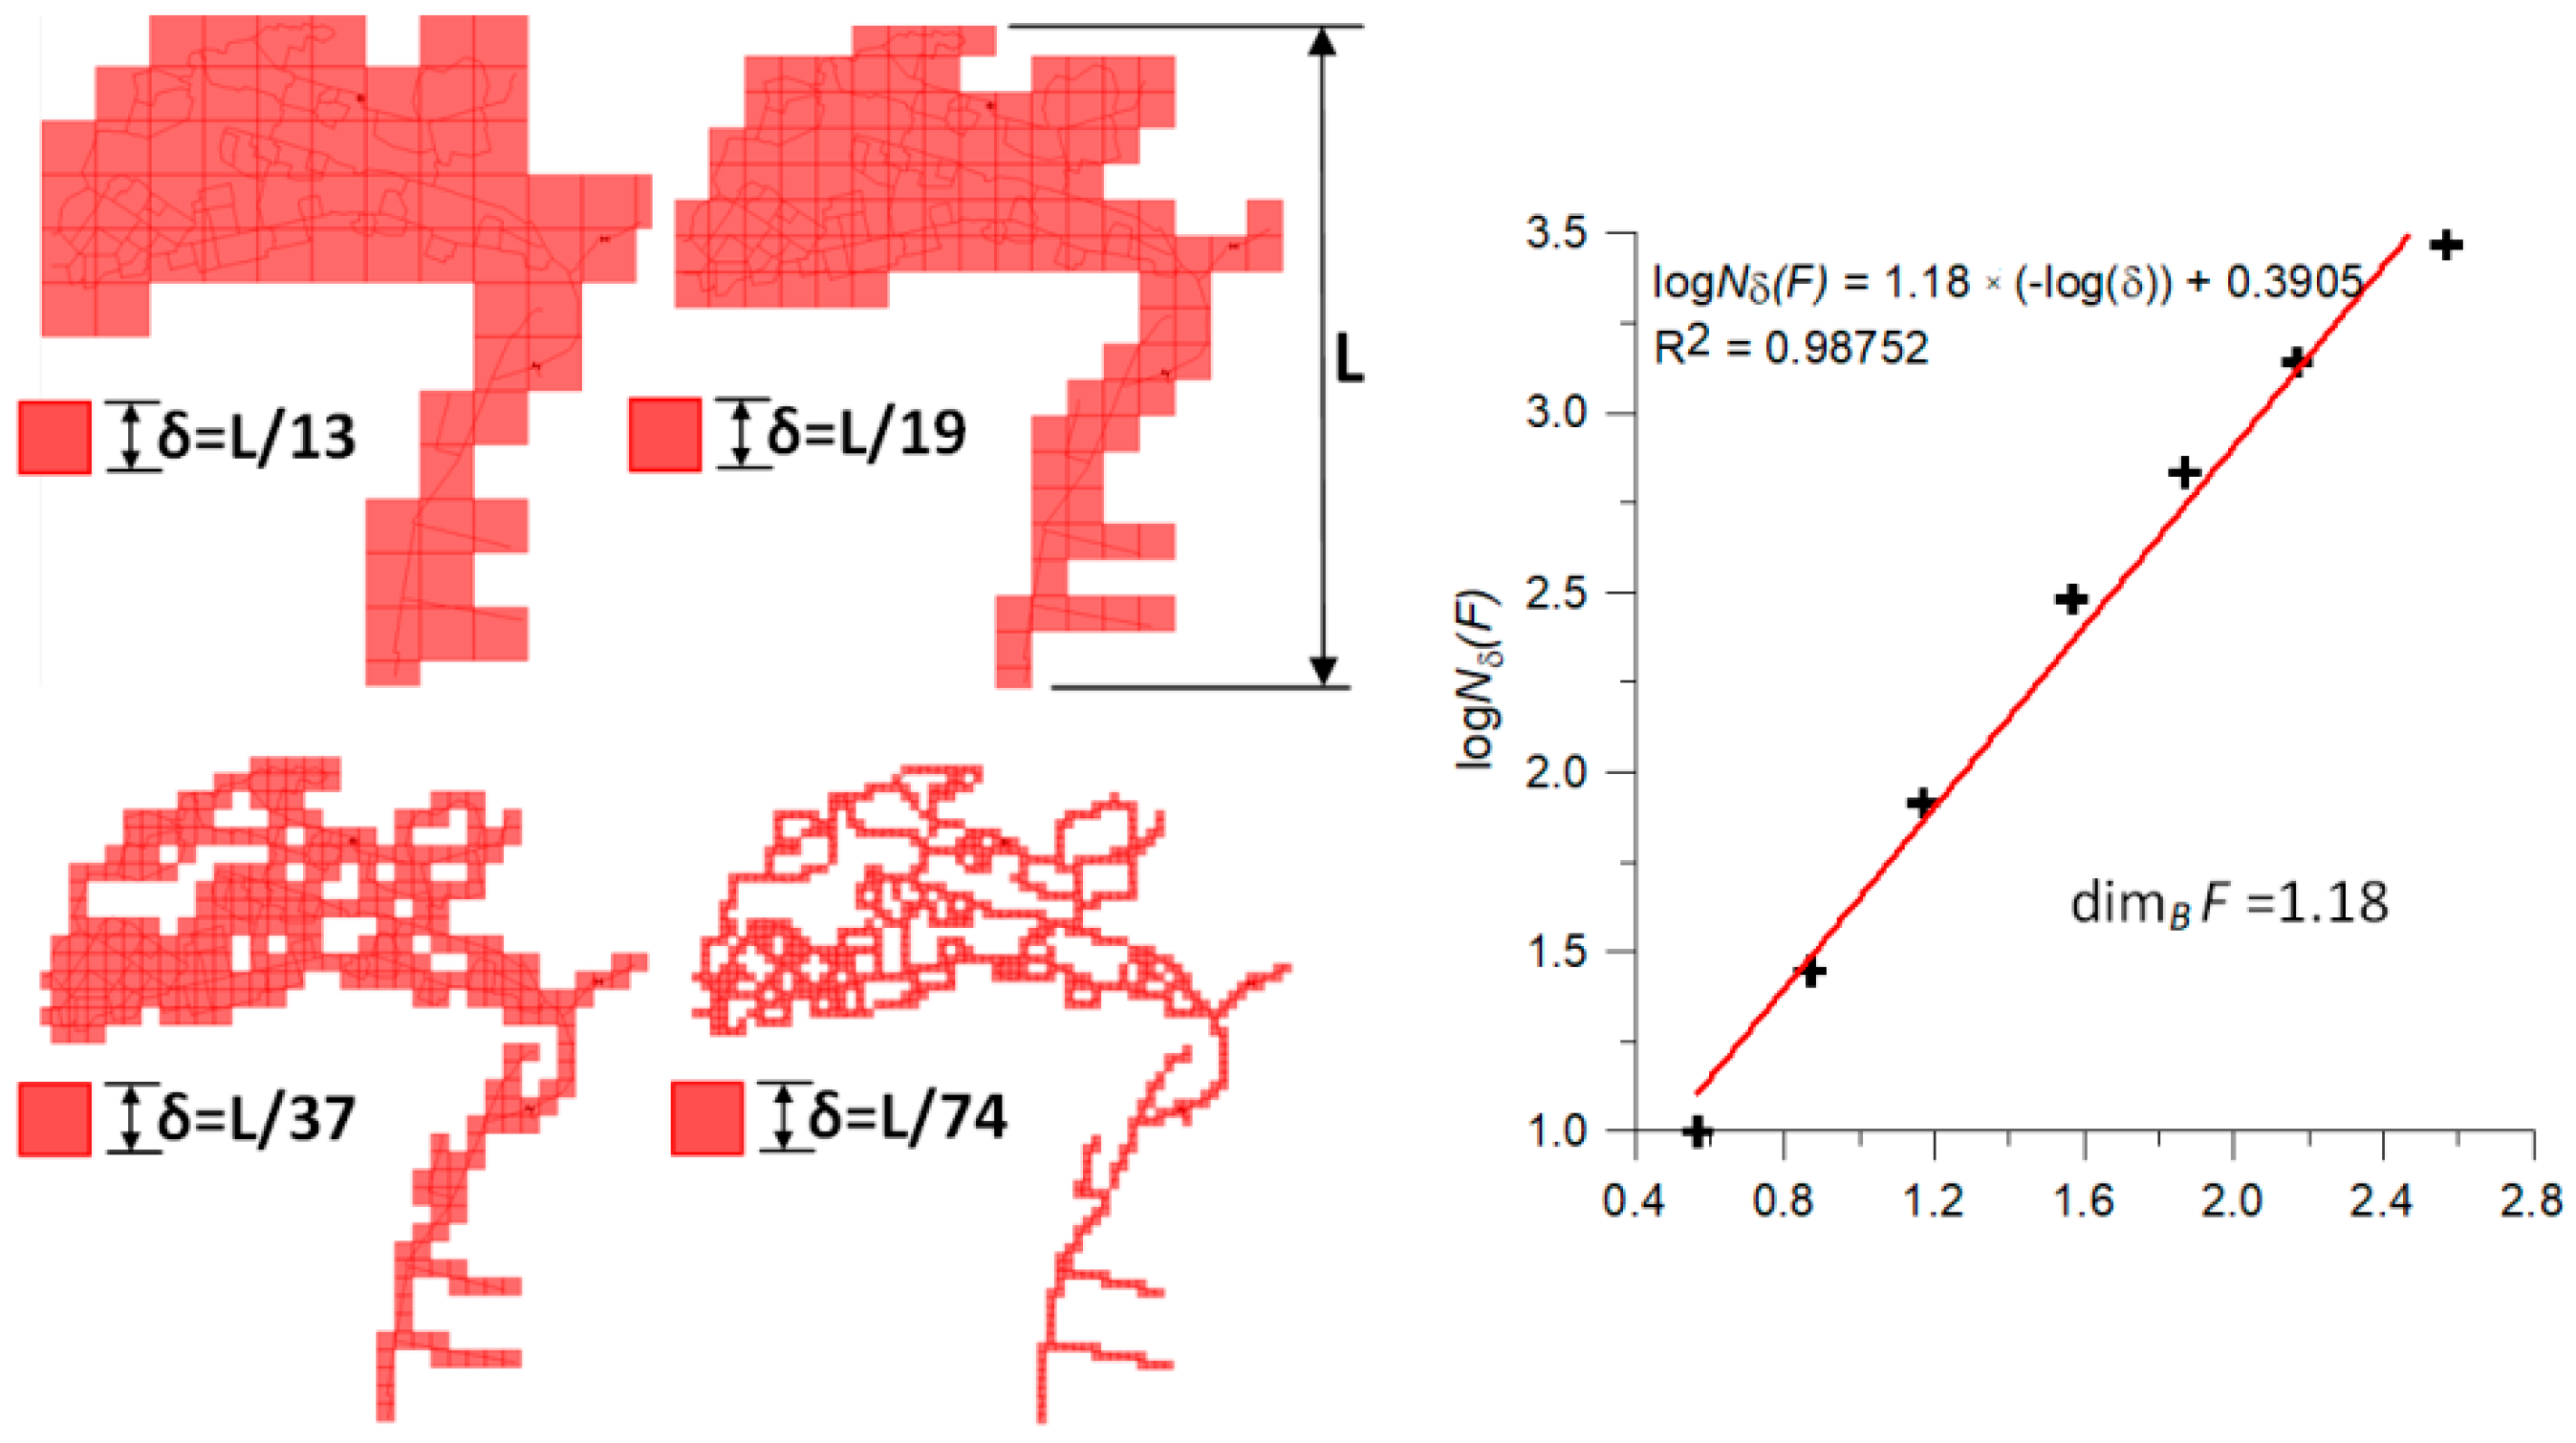
In practical issues to determine the fractal dimension, it is more convenient to use the so-called box counting method [31]. It consists of covering the considered geometric structure with squares (boxes) with increasingly smaller size and counting the minimum number of these squares necessary to cover the analyzed network structure. Subsequently, a graph of dependence on logNδ(F)–logδ is made. The directional coefficient of the regression line described on this compound corresponds to the value of the fractal dimension (Figure 4).
For each—model and existing—network examined in this study, the value of the fractal dimension was determined using the box-counting method [30,31] using the program Statistica 12.1 [32]. Then, this value was compared with the number of efficiency paths defined using the reference service point method. The study was expected to show whether the fractal dimension can constitute an independent indicator allowing the reliability of water supply via the analyzed networks to be assessed.
The obtained fractal dimension values were compared with another indicator characterizing the topology of water supply networks (i.e., the average value of the node-degree distribution). This indicator was calculated using the formula provided below [33], which was also employed, among others, by Yazdani and Jefffry [21] and Maiolo et al. [24] in its modified form:
where m is the number of links, n number of junctions in the analyzed water supply network.
Similar to the case of fractal dimension calculations, the complexity of a network does not condition the possibility of determining the average value of the node-degree distribution. It is relatively easy to calculate. In the model and existing networks presented above, the “Project Summary” option available in the EPANET 2.0 [34] software was used for that purpose.
3. Results and Discussion
3.1. Reference Service Point Method
The results of the calculations for model and real networks are presented in Table 4. Considering the results of the calculations presented in the table, it should be stated that the method of determining probable reliability of at least one path of water supply from the source to a reference point was limited to six loops. In the case of more loops, the obtained value of probability amounted to 1 due to approximation errors, which made it impossible to conduct a proper assessment.
The number of paths is a more reliable indicator, but this method also involves some limitations. In the case of model networks with 36 loops (7 × 7 nodes), the computer had to be stopped after 4.5 h of computing work. This has already been mentioned by Pollice et al. [26], who signaled the limited capabilities of making the calculations using DFS. This means that the determination of the number of efficiency paths to assess the reliability of water supply to consumers via complex existing networks also has many limitations. From among seven existing networks, the number of efficiency paths could be defined in only three cases (i.e., A, B, and D). These networks have a relatively small number of loops (Figure 3).
3.2. Method Based on Fractal Dimension
The results of the activities performed for the model and existing networks are presented in Figure 5. The authors did not include the linear network in their calculations, as it could not be described with the help of fractal geometry.
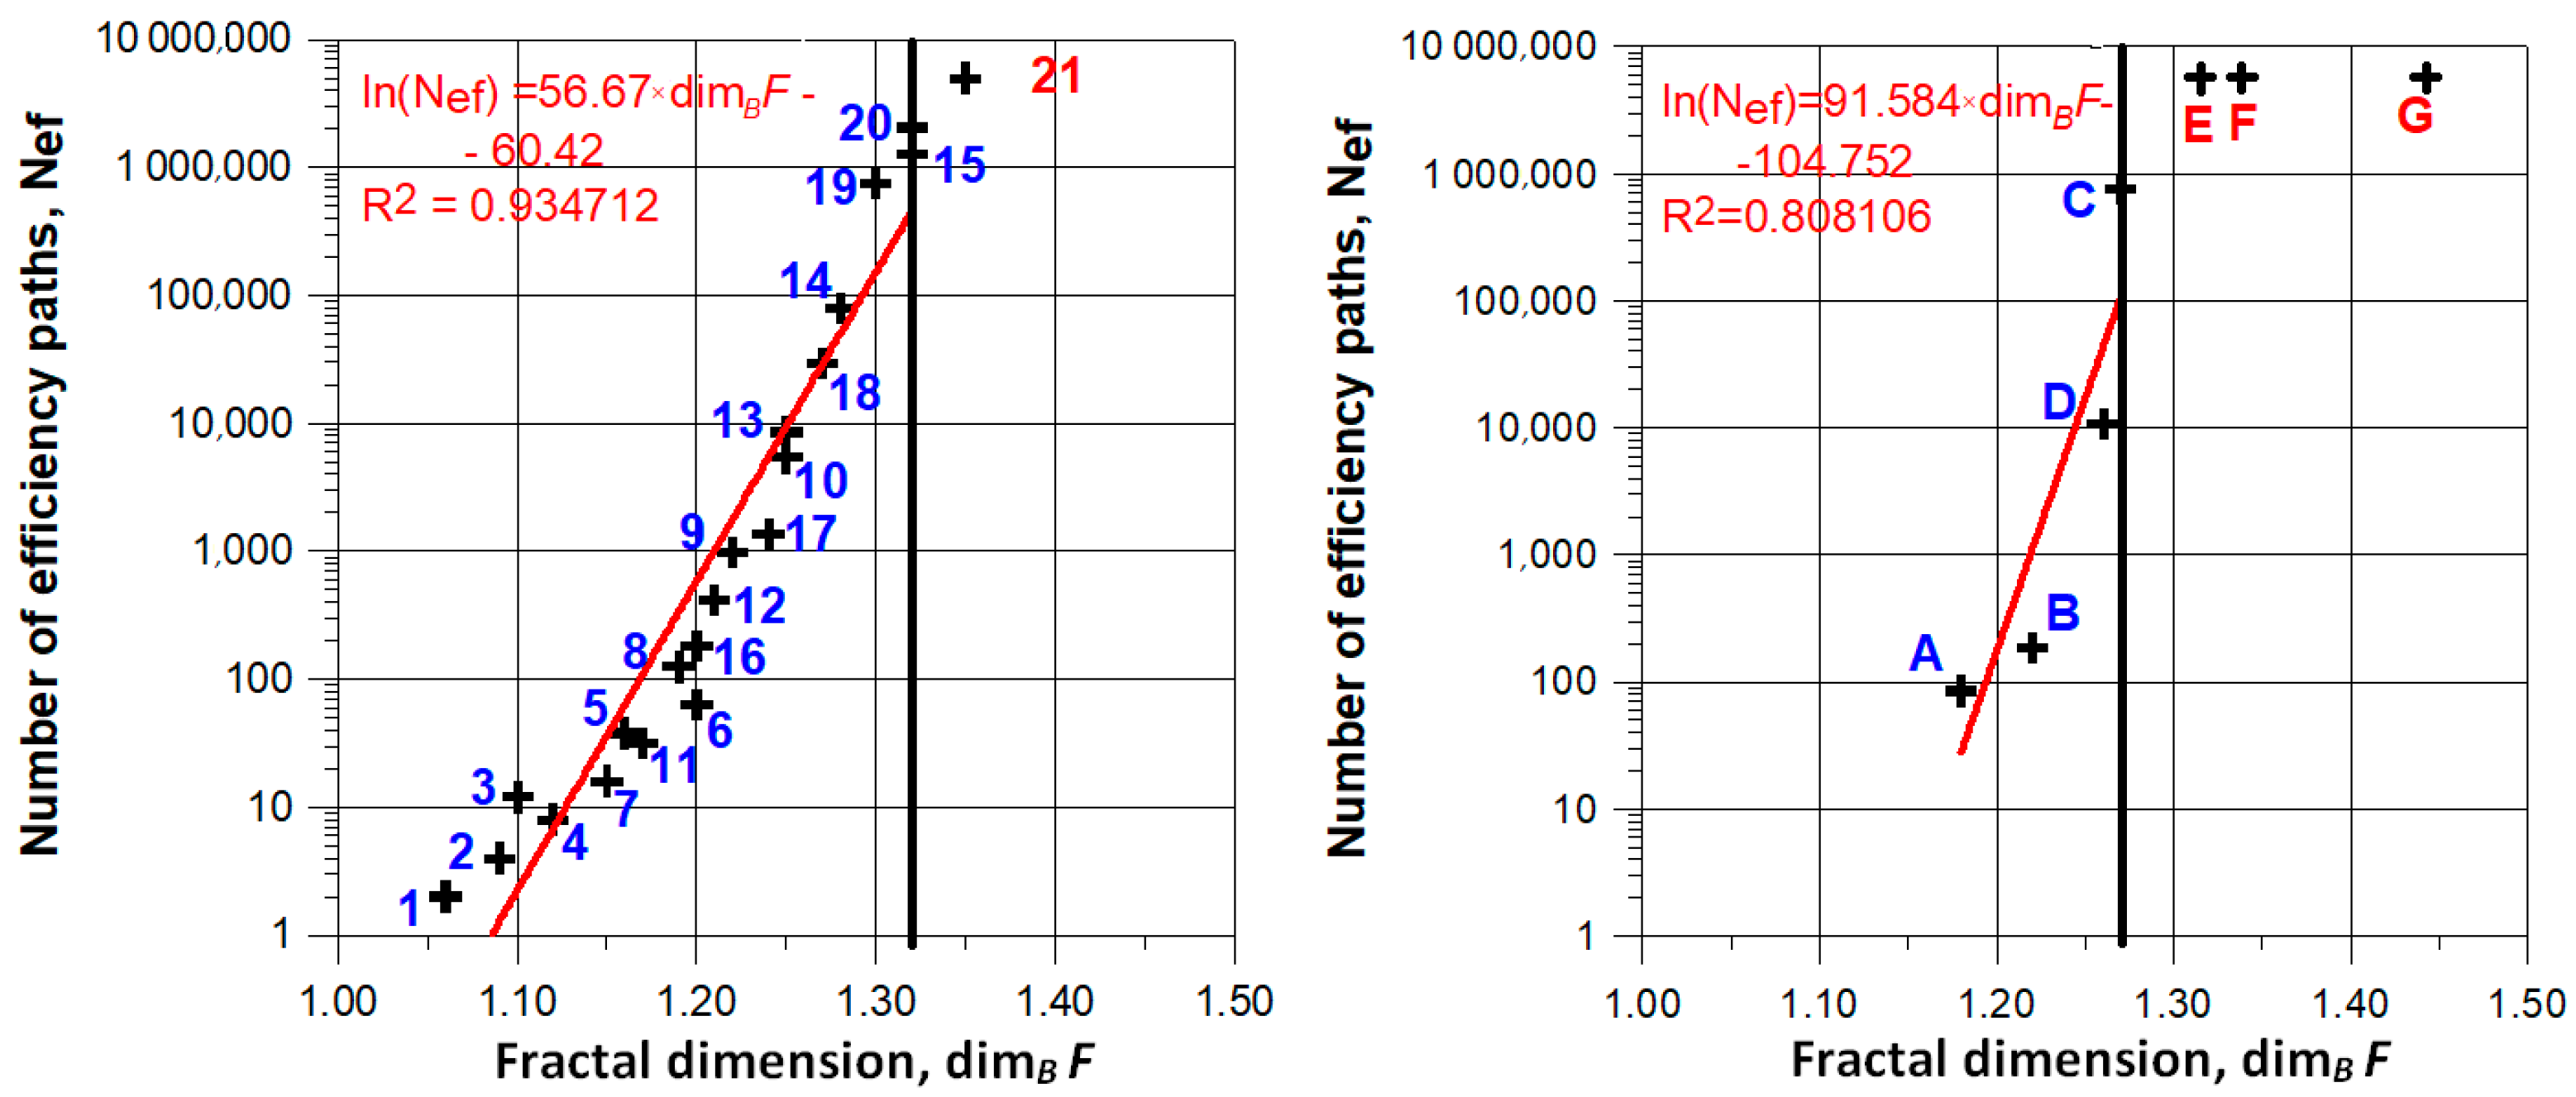
The diagrams presented in the figure show that there was a link between the fractal dimension and the number of efficiency paths between the water source and the reference water supply terminal. This complies with the intuitive understating of the dimension as a measure of the complexity of the fractal set. We managed to show this relationship up to the fractal dimension of 1.32 for model and 1.27 for existing networks. Once this value was exceeded, it was no longer possible to determine the number of efficiency paths.
The analysis of the obtained results appears to show that the fractal dimension can be used as an independent indicator in assessing the reliability of water supply via complex water distribution networks. In this case, there is no limit to the degree of network complexity that could disable the calculation of this dimension. Consequently, there is no limitation to network complexity which occurs while determining the probable reliability of at least one path from among all possible paths, or the number of all efficiency paths linking the water source with a reference service point.
The calculated fractal dimension values and average values of the node-degree distribution for the analyzed model and existing networks are presented in Table 5. The calculations omitted the model linear network (Figure 1), for which the fractal dimension was not determined.
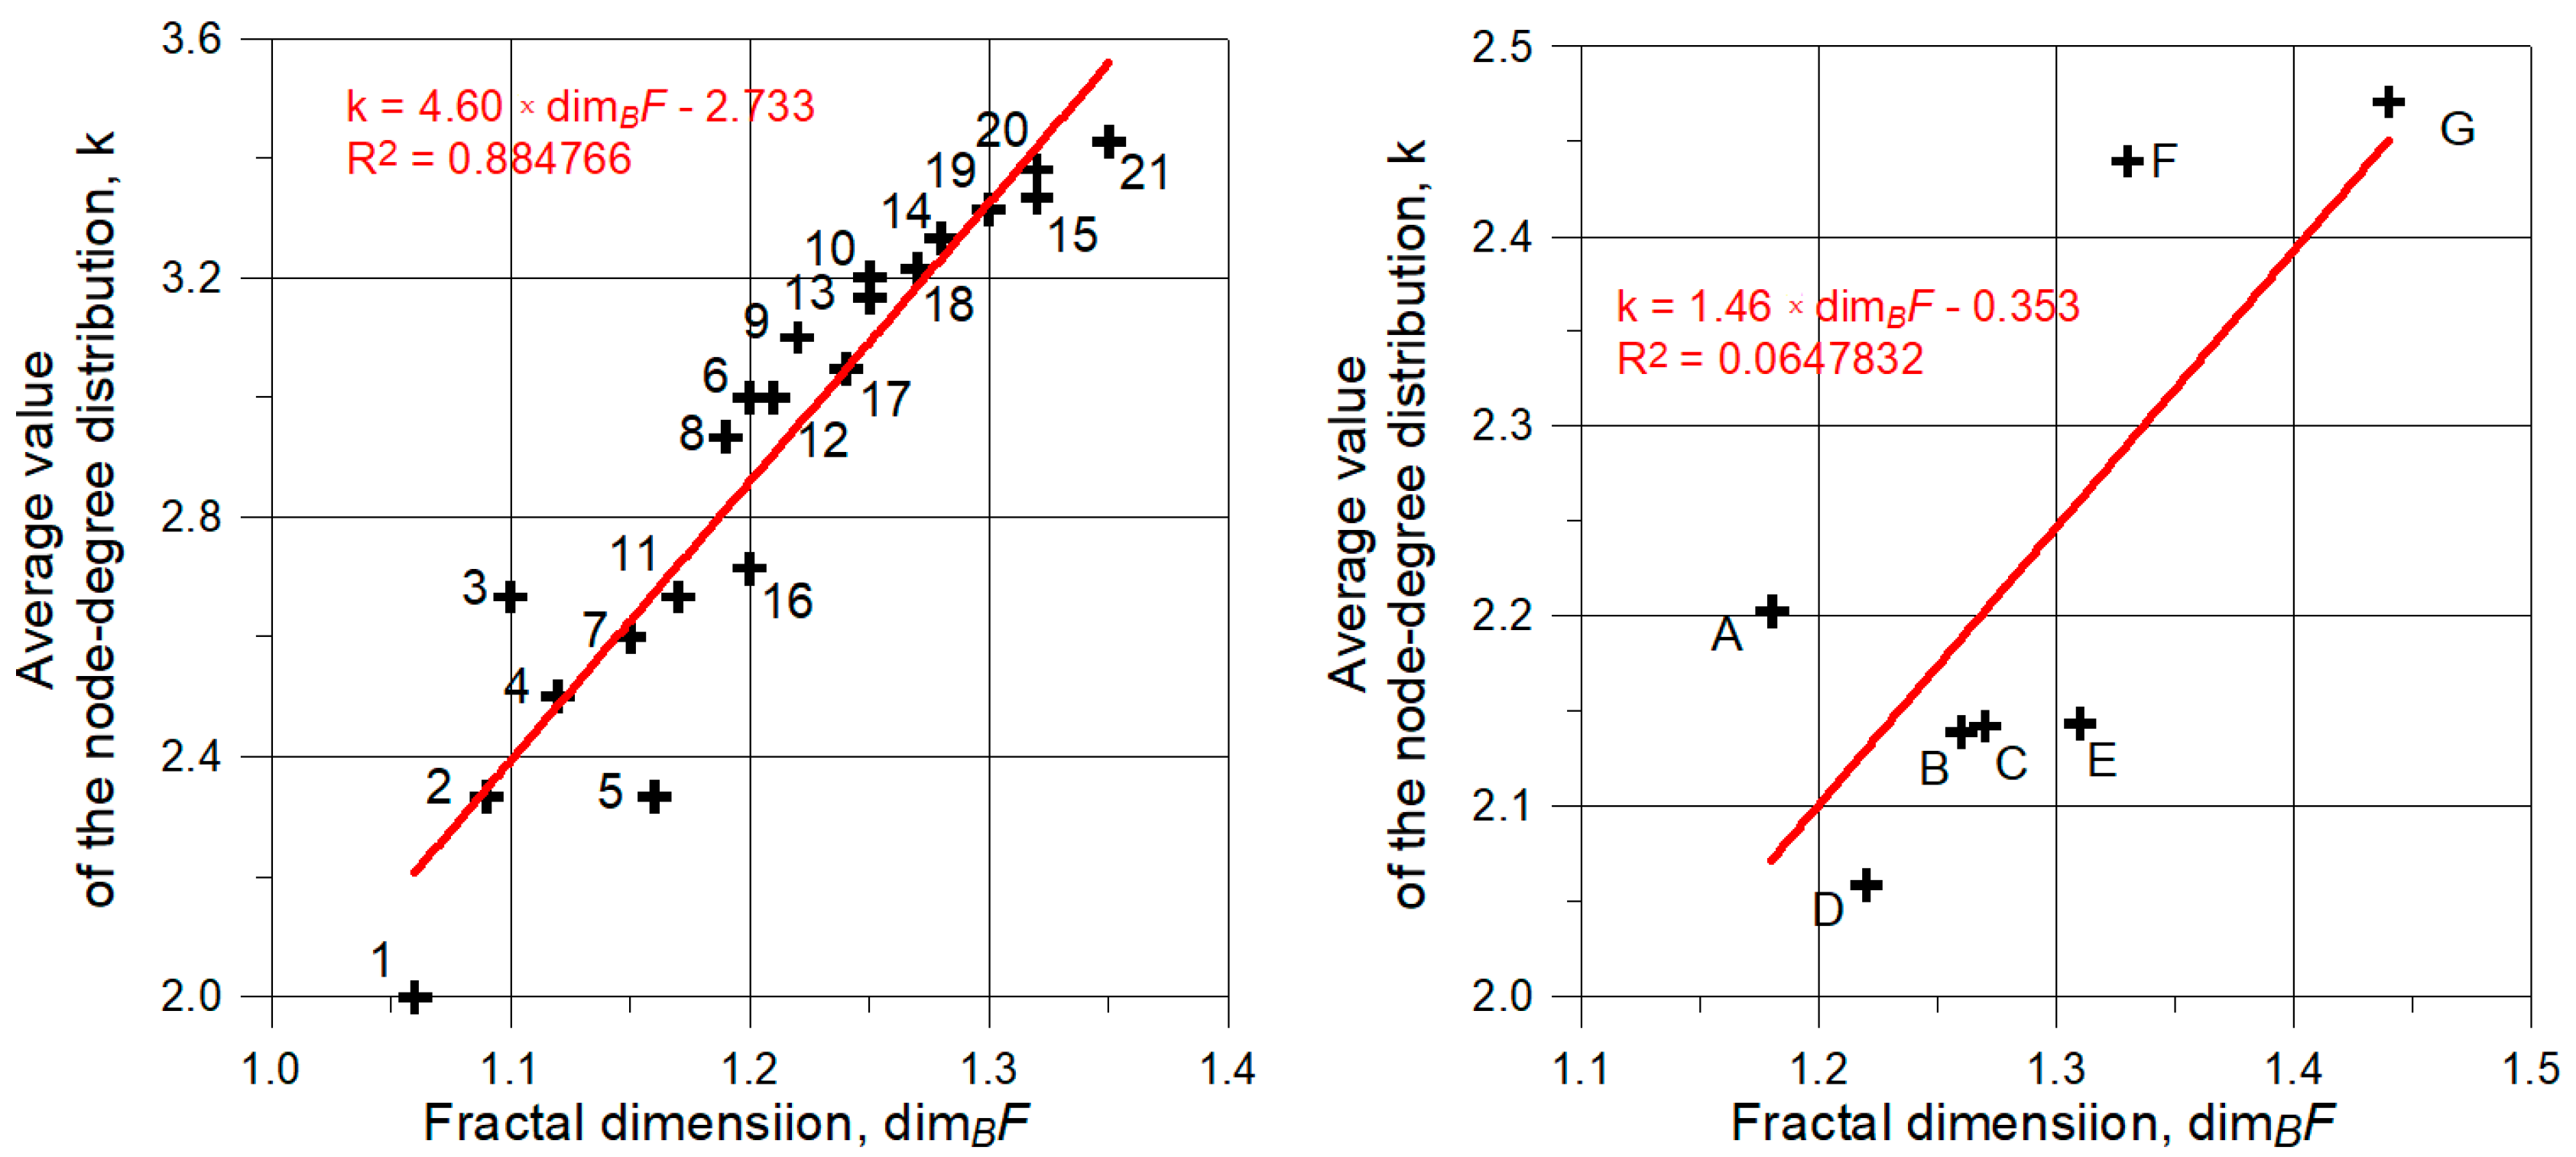
Figure 6 presents graphs showing the relation between the values of calculated fractal dimension and average value of the node-degree distribution.
In line with the expectations, in all cases, regardless of the complexity of the analyzed model networks, it was possible to determine the fractal dimension and average value of the node-degree distribution. In the case of model networks, a linear relation between fractal dimension and average value of the node-degree distribution was observed. Unfortunately, this was not confirmed for the existing networks. The determined relation was not statistically significant. This means that the compared indicators cannot be treated interchangeably.
4. Conclusions
The method of reference points based on determining the certainty of water supply from the source to the most unfavorably located recipient proposed in the paper may be employed for networks comprising up to six loops. The computations carried out for the model and existing water supply networks indicate that the calculated probability always equals 1.0 if this value is exceeded.
Using the number of efficiency paths as the sole indicator for estimating the certainty of water supply from the source to the most unfavorably located recipient turned out to be an efficient method for the networks comprising up to 36 loops.
The conducted calculations indicated that there is a relationship between the number of efficiency paths and fractal dimension. This relationship was confirmed for the maximum fractal dimension values of 1.32 and 1.27 for the model and existing networks, respectively.
Fractal dimension can be treated as a topological indicator of an approximate assessment of water supply reliability. The network complexity does not influence the possibility of its determination.
The conducted analysis of fractal dimension value with average value of the node-degree distribution indicates the existence of a linear relation between these indicators in the considered model networks. However, this relation was not confirmed in the case of the existing networks.
Author Contributions
Conceptualization, writing—original draft preparation, D.K.; methodology, writing—original draft preparation, B.K.; software, T.B., data analysis P.S.; writing—review and editing, formal analysis, K.G.
Funding
This publication was funded by Sądeckie Wodociągi Sp. z o.o., ul. W. Pola 22, 33-300 Nowy Sącz, Poland.
Acknowledgments
This research was supported by statutory activity of the Faculty of Environmental Engineering, Lublin University of Technology.
Conflicts of Interest
The authors declare no conflict of interest.
References
- United Nations Report. The United Nations Conference on Housing and Sustainable Urban Development. Quito, Ecuador, 2016. Available online: www.un.org/sustainabledevelopment/cities/ (accessed on 10 September 2018).
- Steele, W.; Legacy, C. Critical Urban Infrastructure. Urban Policy Res. 2017, 35, 1–6. [Google Scholar] [CrossRef] [Green Version]
- Arthurson, K.; Lawless, A.; Hammet, K. Urban Planning and Health: Revitalising the Alliance. Urban Policy Res. 2016, 34, 4–16. [Google Scholar] [CrossRef]
- Chung, G.; Lansey, K.; Bayraksan, G. Reliable water supply system design under uncertainty. Environ. Model. Softw. 2009, 24, 449–462. [Google Scholar] [CrossRef]
- Fard, N.S.; Lee, T.-H. Cutset enumeration of network systems with link and node failures. Reliab. Eng. Syst. Saf. 1999, 65, 141–146. [Google Scholar] [CrossRef]
- Shier, D.R. Network Reliability and Algebraic Structures; Clarendon Press: Oxford, UK, 1991. [Google Scholar]
- Anasell, J.I.; Phillips, M.J. Practical Methods for Reliability Data Analysis; Oxford University Press: Oxford, UK, 1994. [Google Scholar]
- Volta, M.; Polton, M.; Rostum, J.; Segrov, S.; Herrero, M. CARE-W Decision Suport Tools for Sustainable Water Network Management. WP-6 Testing and Validation of CAR-W Rehab Manager; SINTEF: Trondheim, Norway, 2004. [Google Scholar]
- Piegdoń, I.; Tchórzewska-Cieslak, B.; Eid, M. Managing the risk of failure of the water supply network using the mass service system. Maint. Reliab. 2018, 20, 284–291. [Google Scholar] [CrossRef]
- Kanakoudis, V.; Tsitsifli, S. Water pipe network reliability assessment using the DAC metod. Desalin. Water Treat. 2011. [Google Scholar] [CrossRef]
- Carini, M.; Maiolo, M.; Pantusa, D.; Chiaravalloti, F.; Capano, G. Modelling and optimization of least-cost water distribution networks with multiple supply sources and users. Ric. Di Mat. 2018, 67, 465–479. [Google Scholar] [CrossRef]
- Christodoulou, S.; Deligianni, A. A Neurofuzzy Decision Framework for the Management of Water Distribution Networks. Water Resour. Manag. 2010, 24, 139–156. [Google Scholar] [CrossRef]
- Christodoulou, S.; Deligianni, A.; Aslani, P.; Agathokleous, A. Risk-based asset management of water piping networks using neurofuzzy systems. Comput. Environ. Urban Syst. 2009, 33, 138–149. [Google Scholar] [CrossRef]
- Al-Ghanim, A.M. A heuristic technique for generating minimal path and cutsets of a general network. Comput. Ind. Eng. 1999, 36, 45–55. [Google Scholar] [CrossRef]
- Mays, L.W. Water Supply Systems Security; McGraw-Hill: New York, NY, USA, 2004. [Google Scholar]
- Pham, H. (Ed.) Reliability Handbook; Springer: London, UK, 2003. [Google Scholar]
- Singh, B. Enumeration of node cutsets for an s–t network. Microelectron. Reliab. 1994, 34, 559–561. [Google Scholar] [CrossRef]
- Yeh, W.C. A simple algorithm for evaluating the k-out-of-n network reliability. Reliab. Eng. Syst. Saf. 2004, 83, 93–101. [Google Scholar] [CrossRef]
- Zhibin, T. Minimal cut sets of s-t networks with k-out-of-n nodes. Reliab. Eng. Syst. Saf. 2003, 82, 49–54. [Google Scholar]
- Kansal, M.L.; Devi, S. An improved algorithm for connectivity analysis of distribution networks. Reliab. Eng. Syst. Saf. 2007, 92, 1295–1302. [Google Scholar] [CrossRef]
- Yazdani, A.; Jeffrey, P. Applying network theory to quantify the redundancy and structural robustness of water distribution systems. J. Water Resour. Plan. Manag. 2012, 138, 153–161. [Google Scholar] [CrossRef]
- Jung, D.; Kim, J.H. Water Distribution System Design to Minimize Costs and Maximize Topological and Hydraulic Reliability. J. Water Resour. Plan. Manag. 2018, 144. [Google Scholar] [CrossRef]
- Ozger, S.S.; Mays, L.W. A Semi-Pressure-Driven Approach to Reliability Assessment of Water Distribution Networks. Ph.D. Thesis, Arizona State University, Tempe, AZ, USA.
- Maiolo, M.; Pantusa, D.; Carini, M.; Capano, G.; Chiaravalloti, F.; Procopio, A. A New Vulnerability Measure for Water Distribution Network. Water 2018, 10, 1005. [Google Scholar] [CrossRef]
- Kowalski, D.; Kowalska, B.; Kwietniewski, M. Monitoring of water distribution system effectiveness using fractal geometry. Bull. Pol. Acad. Sci.-Tech. Sci. 2015, 63, 155–161. [Google Scholar] [CrossRef] [Green Version]
- Pollice, G.; Selkow, S.; Heineman, G. Algorithms in a Nutshell; O’Reilly Media: Sebastopol, CA, USA, 2009. [Google Scholar]
- Available online: https://www.qt.io/what-is-qt/ (accessed on 8 November 2018).
- Eng, L.Z. Hands-On GUI Programming with C++ and Qt5; Pact: Birmingham, UK, 2018. [Google Scholar]
- Mandelbrot, B. The Fractal Geometry of Nature; W. H. Freeman and Co: New York, NY, USA, 1982. [Google Scholar]
- Falconer, K.J. Fractal Geometry: Mathematical Foundations and Applications; John Wiley: Chichester, UK, 1990. [Google Scholar]
- Zhou, G.; Lam, N. A comparison of fractal dimension estimators based on multiple surface generation algorithms. Comput. Geosci. 2005, 31, 1260–1269. [Google Scholar] [CrossRef]
- Available online: http://www.statsoft.com/Products/STATISTICA-Features (accessed on 12 September 2018).
- Newman, M.E.J. Networks, an Introduction; Oxford University Press: New York, NY, USA, 2010. [Google Scholar]
- Rossman, I. EPANET User’s Manual; United States Environmental Protection Agency (EPA): Washington, DC, USA, 2000. [Google Scholar]
Figure 1.
Linear model network. S—water source, R—reference water service point.

Figure 2.
Looped model network. 1, 2, 4, 36—number of loops, ①, ②, ③, ④—pipe numbers for example calculation. Other markings as in Figure 1.
Figure 2.
Looped model network. 1, 2, 4, 36—number of loops, ①, ②, ③, ④—pipe numbers for example calculation. Other markings as in Figure 1.

Figure 3.
Diagrams presenting the layouts of the analyzed existing water supply networks. Subfigures A–G correspond to the “City” column in Table 2. Other symbols as in Figure 1.

Figure 4.
Example of the fractal dimension calculation for network A (Figure 3). (left) Selected steps of covering a geometric structure of the network using squares (boxes) with different side lengths. (right) The dependence of the number of squares (boxes) on the size of their side, along with the designated regression line and the value of the fractal dimension.

Figure 5.
Comparison of the number of Nef efficiency paths with the dimBF fractal dimension of the analyzed model (left) and the existing (right) networks.
Figure 5.
Comparison of the number of Nef efficiency paths with the dimBF fractal dimension of the analyzed model (left) and the existing (right) networks.

Figure 6.
Graphs showing the relation between the fractal dimension (dimBF) and average value of the node-degree distribution (k) for the model (left) and existing networks (right).
Figure 6.
Graphs showing the relation between the fractal dimension (dimBF) and average value of the node-degree distribution (k) for the model (left) and existing networks (right).


Table 1.
Number of nodes in the row and column and number of loops in the analyzed model networks.
| No. | Row | Column | Loops |
|---|---|---|---|
| 1 | 2 | 2 | 1 |
| 2 | 2 | 3 | 2 |
| 3 | 3 | 3 | 4 |
| 4 | 4 | 2 | 3 |
| 5 | 4 | 3 | 6 |
| 6 | 4 | 4 | 9 |
| 7 | 5 | 2 | 4 |
| 8 | 5 | 3 | 8 |
| 9 | 5 | 4 | 12 |
| 10 | 5 | 5 | 16 |
| 11 | 6 | 2 | 5 |
| 12 | 6 | 3 | 10 |
| 13 | 6 | 4 | 15 |
| 14 | 6 | 5 | 20 |
| 15 | 6 | 6 | 25 |
| 16 | 7 | 2 | 6 |
| 17 | 7 | 3 | 12 |
| 18 | 7 | 4 | 18 |
| 19 | 7 | 5 | 24 |
| 20 | 7 | 6 | 30 |
| 21 | 7 | 7 | 36 |
Table 2.
Number of nodes and links in water networks, and residents in the analyzed cities.
| City | Number | ||
|---|---|---|---|
| Nodes | Links | Residents | |
| A | 138 | 181 | 10,000 |
| B | 393 | 409 | 10,000 |
| C | 450 | 490 | 18,000 |
| D | 546 | 566 | 4000 |
| E | 612 | 656 | 21,000 |
| F | 1052 | 1332 | 35,000 |
| G | 2788 | 2982 | 50,000 |
Table 3.
Calculation of water delivery (from point S to point R) probability basing on Formulas (1) and (2), for model network no. 1 (Figure 1).
Table 3.
Calculation of water delivery (from point S to point R) probability basing on Formulas (1) and (2), for model network no. 1 (Figure 1).
| Path No. | Pipe Numbers | Probability of Supply |
|---|---|---|
| 1 | 1, 2 | 0.99 × 0.99 = 0.9801 |
| 2 | 3, 4 | 0.99 × 0.99 = 0.9801 |
| Final | 1 − (1 − 0.9801)(1 − 0.9801) = 0.999604 | |
Table 4.
The probability of water supply to the reference point and the number of efficiency paths for the supply.
Table 4.
The probability of water supply to the reference point and the number of efficiency paths for the supply.
| Network | Probability of Supply | Number of Paths |
|---|---|---|
| Model Networks | ||
| Linear | 0.9702990 | 1 |
| 1 | 0.9891267 | 2 |
| 2 | 0.9899964 | 4 |
| 3 | 0.9899999 | 12 |
| 4 | 0.9996961 | 8 |
| 5 | 1 − 1.13 × 10⁻²⁷ | 38 |
| 6 | 0.9999969 | 184 |
| 7 | 0.9999949 | 16 |
| 8 | 1 | 125 |
| 9 | 1 | 976 |
| 10 | 1 | 8512 |
| 11 | 0.9999999 | 32 |
| 12 | 0.9999999 | 414 |
| 13 | 1 | 5382 |
| 14 | 1 | 79,394 |
| 15 | 1 | 1,262,816 |
| 16 | 0.9999999 | 64 |
| 17 | 1 | 1369 |
| 18 | 1 | 29,739 |
| 19 | 1 | 752,061 |
| 20 | 1 | 2,056,267 |
| 21 | 1 | Blockade |
| Existing Networks | ||
| A | 0.997712 | 85 |
| B | 1 | 10,840 |
| C | 1 | 761,166 |
| D | 0.998723 | 186 |
| E | 1 | Blockade |
| F | 1 | Blockade |
| G | 1 | Blockade |
Notes: Value “1” in the “Probability of supply” column was obtained despite the use of double precision variables. This results from the presence of the approximation error. The term “Blockade” in the column “Number of paths” means that the calculations were abandoned after obtaining the value of 5 million. Usually the time of calculations exceeded 4.5–5 h. Extending this time to 48 h did not bring about any significant changes (from 5,000,000 to 5,000,100) in the number of determined paths.
Table 5.
The calculated values of fractal dimension (dimBF) and average value of the node-degree distribution (k) for the analyzed model and existing networks.
Table 5.
The calculated values of fractal dimension (dimBF) and average value of the node-degree distribution (k) for the analyzed model and existing networks.
| Network | dimBF | k |
|---|---|---|
| Model Networks | ||
| 1 | 1.06 | 2.000 |
| 2 | 1.09 | 2.333 |
| 3 | 1.10 | 2.667 |
| 4 | 1.12 | 2.500 |
| 5 | 1.16 | 2.333 |
| 6 | 1.20 | 3.000 |
| 7 | 1.15 | 2.600 |
| 8 | 1.19 | 2.933 |
| 9 | 1.22 | 3.100 |
| 10 | 1.25 | 3.200 |
| 11 | 1.17 | 2.667 |
| 12 | 1.21 | 3.000 |
| 13 | 1.25 | 3.167 |
| 14 | 1.28 | 3.267 |
| 15 | 1.32 | 3.333 |
| 16 | 1.20 | 2.714 |
| 17 | 1.24 | 3.048 |
| 18 | 1.27 | 3.214 |
| 19 | 1.30 | 3.314 |
| 20 | 1.32 | 3.381 |
| 21 | 1.35 | 3.429 |
| Existing Networks | ||
| A | 1.18 | 2.203 |
| B | 1.26 | 2.139 |
| C | 1.27 | 2.142 |
| D | 1.22 | 2.059 |
| E | 1.31 | 2.144 |
| F | 1.33 | 2.440 |
| G | 1.44 | 2.471 |
© 2019 by the authors. Licensee MDPI, Basel, Switzerland. This article is an open access article distributed under the terms and conditions of the Creative Commons Attribution (CC BY) license (http://creativecommons.org/licenses/by/4.0/).
Share and Cite
MDPI and ACS Style
Kowalski, D.; Kowalska, B.; Bławucki, T.; Suchorab, P.; Gaska, K. Impact Assessment of Distribution Network Layout on the Reliability of Water Delivery. Water 2019, 11, 480. https://doi.org/10.3390/w11030480
AMA Style
Kowalski D, Kowalska B, Bławucki T, Suchorab P, Gaska K. Impact Assessment of Distribution Network Layout on the Reliability of Water Delivery. Water. 2019; 11(3):480. https://doi.org/10.3390/w11030480
Chicago/Turabian StyleKowalski, Dariusz, Beata Kowalska, Tomasz Bławucki, Paweł Suchorab, and Krzysztof Gaska. 2019. "Impact Assessment of Distribution Network Layout on the Reliability of Water Delivery" Water 11, no. 3: 480. https://doi.org/10.3390/w11030480
Note that from the first issue of 2016, this journal uses article numbers instead of page numbers. See further details here.