Article

Behavioral Interactions and Trophic Overlap between Invasive Signal Crayfish Pacifastacus leniusculus (Decapoda, Astacidae) and Native Fishes in Iberian Rivers

1
Department of Environmental Biology, School of Sciences, University of Navarra, C/ Irunlarrea 1, E-31080 Pamplona, Spain
2
Departamento de Ciencias Médicas Básicas, Facultad de Medicina, Universidad San Pablo-CEU, CEU Universities, Campus de Montepríncipe, E-28925 Alcorcón, Madrid, Spain
3
University of Navarra, LICA, C/ Irunlarrea 1, E-31080 Pamplona, Spain
*
Author to whom correspondence should be addressed.
Water 2019, 11(3), 459; https://doi.org/10.3390/w11030459
Submission received: 24 January 2019 / Revised: 23 February 2019 / Accepted: 27 February 2019 / Published: 5 March 2019
(This article belongs to the Special Issue Effects of Species Introduction on Aquatic Communities)

Abstract

:
The signal crayfish Pacifastacus leniusculus Dana, 1852 is a successful invasive species in the Iberian Peninsula. This is of particular conservation concern, as fish fauna is highly endemic and also threatened within this ecoregion. The aim of this study was to analyze behavioral interactions and trophic overlap between signal crayfish and native fishes in Iberian rivers (northern Spain). Video cameras were used to record fish “dominance/evasion” after spatial encounters with crayfish. Diet composition and isotopic signatures (δ13C and δ15N) were compared to evaluate the niche overlap. Fish were dominant in 25% of the encounters with juvenile crayfish, whereas this percentage was only 4% with adult crayfish. Observations showed a high fish “evasion” response for Pyrenean stone loach Barbatula quignardi (Bǎcescu-Meşter, 1967) (>30%). Dietary results showed a high trophic overlap between signal crayfish with the pelagic Pyrenean minnow Phoxinus bigerri Kottelat, 2007 and the benthic loach. However, the isotopic niche overlap was low, with brown trout Salmo trutta L., 1758 showing the highest area (only 0.1 ‰2). Overall, our findings suggest that interferences may occur with native species for food (i.e., benthic invertebrates). Consequently, measures should be applied to control invasive crayfish in Iberian rivers.

1. Introduction

Biological invasions are one of the most important causes of biodiversity loss at the global scale [1,2,3]. This conservation concern is particularly relevant across inland waters of the Mediterranean region in Europe [4], where endemic freshwater fish are highly threatened by invasive species [5]. As an example, >50% of the native fish species are unique to the Iberian Peninsula (i.e., Spain and Portugal) [6,7]. Amongst the variety of aquatic introductions, non-native crayfishes are common freshwater invaders worldwide, with these being keystone species because of their significant ecological and socioeconomic impacts [4]. The signal crayfish Pacifastacus leniusculus Dana, 1852 is native to North America and was introduced into the Iberian Peninsula from Sweden in 1974 for the purpose of expanding aquaculture [8]. In this region, signal crayfish were first introduced into the North of Ebro Basin >40 years ago, where it spread hundreds of km in a few years [8]. This crayfish species is currently very common across central and northern Iberian waters, where it is a strong competitor to native fauna and is a vector for the crayfish plague Aphanomyces astaci Schikora, 1906 [8]. Indeed, signal crayfish is partly responsible for the recent extirpation of the white-clawed crayfish Austropotamobius pallipes (Lereboullet, 1858) from many Iberian streams [8].
The mechanisms by which fish and crayfish interact may be indirect through habitat alteration [9] or direct by means of predation, behavioral interference (e.g., aggression), and competition for food/space [10]. In field studies, Guan and Wiles [11] found an inverse relationship between the abundances of the introduced signal crayfish and benthic fishes, such as bullhead Cottus gobio L., 1758 and stone loach Barbatula barbatula (L., 1758), inhabiting a British lowland river. Peay et al. [12] also observed a negative association between densities of signal crayfish and juvenile brown trout Salmo trutta L., 1758 in a British stream. These findings are based on traditional comparisons of the abundances of crayfish and fish populations. Consequently, this “indirect” design does not elucidate the particular effects of invasive crayfish on native fish. To provide a better understanding of the mechanisms of interaction, observations have been carried out on signal crayfish and a variety of fish species under laboratory conditions. For example, Bubb et al. [13] assessed behavioral interactions and competition for shelter between bullhead and signal crayfish in experimental aquaria. These authors observed that signal crayfish were dominant over bullhead through aggressive approaches. In addition, a negative relationship between the densities of signal crayfish and bullhead was observed. Also, under controlled conditions, Griffiths et al. [14] observed that the proportion of Atlantic salmon Salmo salar L., 1758 sheltering was significantly lower in the presence of aggressive signal crayfish when refuge was limiting. In contrast, these authors showed that the proportion of signal crayfish sheltering was independent of the presence of Atlantic salmon.
Despite the wide field of research on crayfish ecology under captive conditions, laboratory experiments have restrictions concerning their applicability to natural ecosystems due to the limitation of space and trophic resources [15]. Particularly for crayfish, Bergman and Moore [16] found that agonistic interactions among two species of genus Orconectes (currently Faxonius, see Crandall and De Grave [17]) were shorter, less intense and less likely to end with a tail flip in nature than in the laboratory facilities. Nonetheless, very few attempts have been made to evaluate the real effects of introduced crayfish species on native fishes under natural conditions. In this respect, Almeida et al. [18] highlighted the usefulness of observations in the wild for assessing the effects of invasive species on aquatic communities. Despite the conservation concern posed by non-native crayfish, to our knowledge, no previous study has assessed the behavioral interactions between introduced crayfish and Iberian fishes under natural conditions.
As mentioned above, competition for food is another potential mechanism of interaction between invasive crayfish and fish communities [10]. Quantifying the trophic ecology in animals has traditionally focused on direct analysis (e.g., stomach content), although these methods do not adequately reflect the quantity of nutrients assimilated into tissues [19]. In recent years, ecologists have successfully employed stable isotopes of carbon (13C) and nitrogen (15N) to define the trophic niche of species [20], as this technique can reveal the consumer’s long-term feeding habits [21,22]. Specifically, the ratios of carbon and nitrogen isotopes provide a time- and space-integrated representation of the food source and trophic level, respectively (e.g., [23]). In addition, isotopic biplots of 13C and 15N are useful to assess the extent of isotopic niche overlap between species, which can show the potential for coexistence or competitive exclusion posed by invasive crayfish [24,25].
In light of the dearth of information on these biotic relationships in the Iberian Peninsula, the aim of this study was to analyze behavioral interactions and trophic overlap between signal crayfish and native fishes within this ecoregion. Specifically, we recorded the behavior after spatial encounters between signal crayfish and native fishes in Iberian rivers (northern Spain) and also compared diet composition and isotopic “signatures” between these taxa. We hypothesized that (i) signal crayfish will physically displace native fishes, especially benthic species, as previous aquarium experiments have shown (e.g., [13]) and (ii) both dietary and isotopic data will reveal a high trophic overlap between signal crayfish and native fishes (e.g., [24]).

2. Materials and Methods
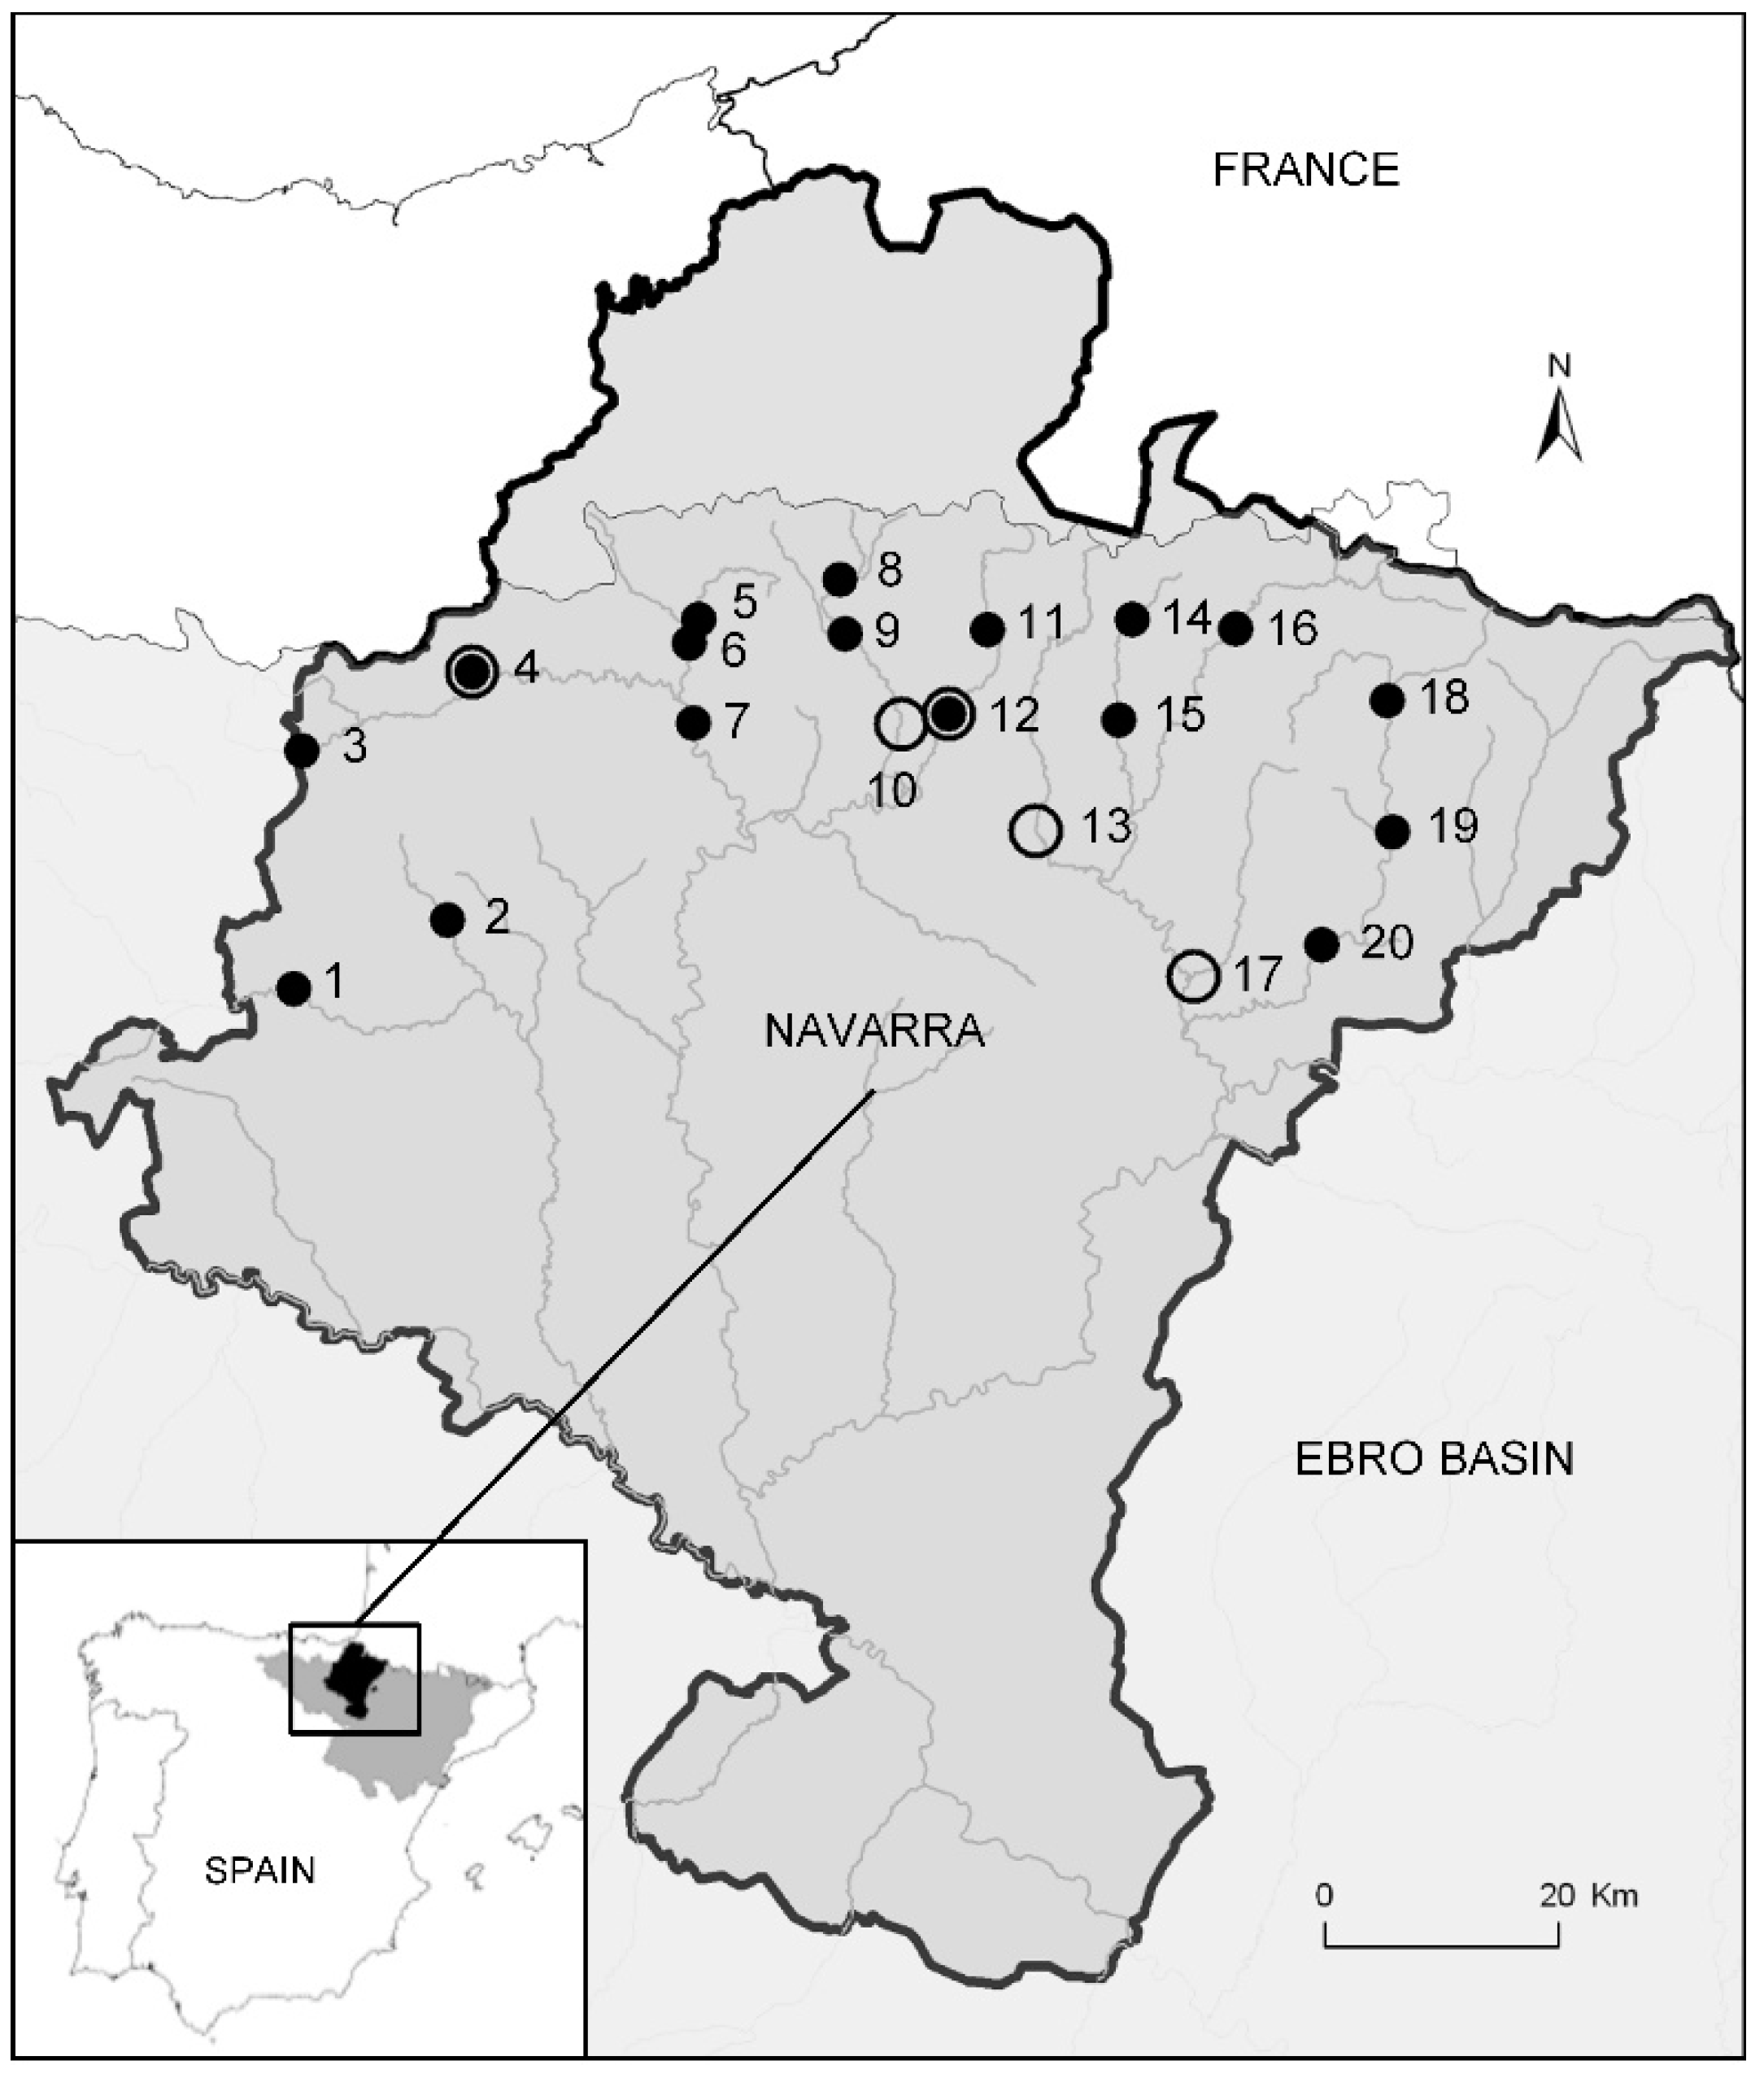
2.1. Study Area

The upper and middle reaches were surveyed in the main rivers of the Navarra region (northern Spain). Sampling sites (n = 20) were located in water courses that drain to the Ebro River, which is one of the main Iberian basins, with a catchment area of 85,362 km2 (Figure 1). Specifically, the following rivers were sampled (from West to East Navarra); Ega, Urederra, Arakil, Lizarrusti, Basaburua, Larraun, Ulzama, Arga, Erro, Urrobi, Irati, Areta, and Salazar (Figure 1). Flow regime is pluvio-nival in the study rivers and the period of greatest discharge lasts from November until April [26]. Riparian vegetation is abundant in all the rivers. In upper reaches, livestock is common in grasslands, while cereal fields are dominant in middle reaches.
In the study rivers, native fish communities consist of benthic fishes, such as Pyrenean stone loach Barbatula quignardi (Bǎcescu-Meşter, 1967), Pyrenean gudgeon Gobio lozanoi Doadrio & Madeira, 2004 and, less frequently, the northern Iberian spined-loach Cobitis calderoni Bǎcescu, 1962; bentho-pelagic fishes, such as Ebro nase Parachondrostoma miegii (Steindachner, 1866); and pelagic fishes, such as Pyrenean minnow Phoxinus bigerri Kottelat, 2007 and brown trout [27,28]. Specifically regarding brown trout, this salmonid species is considered as a native fish in the Iberian Peninsula, although it is also true that several stocking programs have been undertaken in the study area by using fish individuals from central European populations. This implies a certain degree of genetic introgression towards the “Iberian lineages” [29].

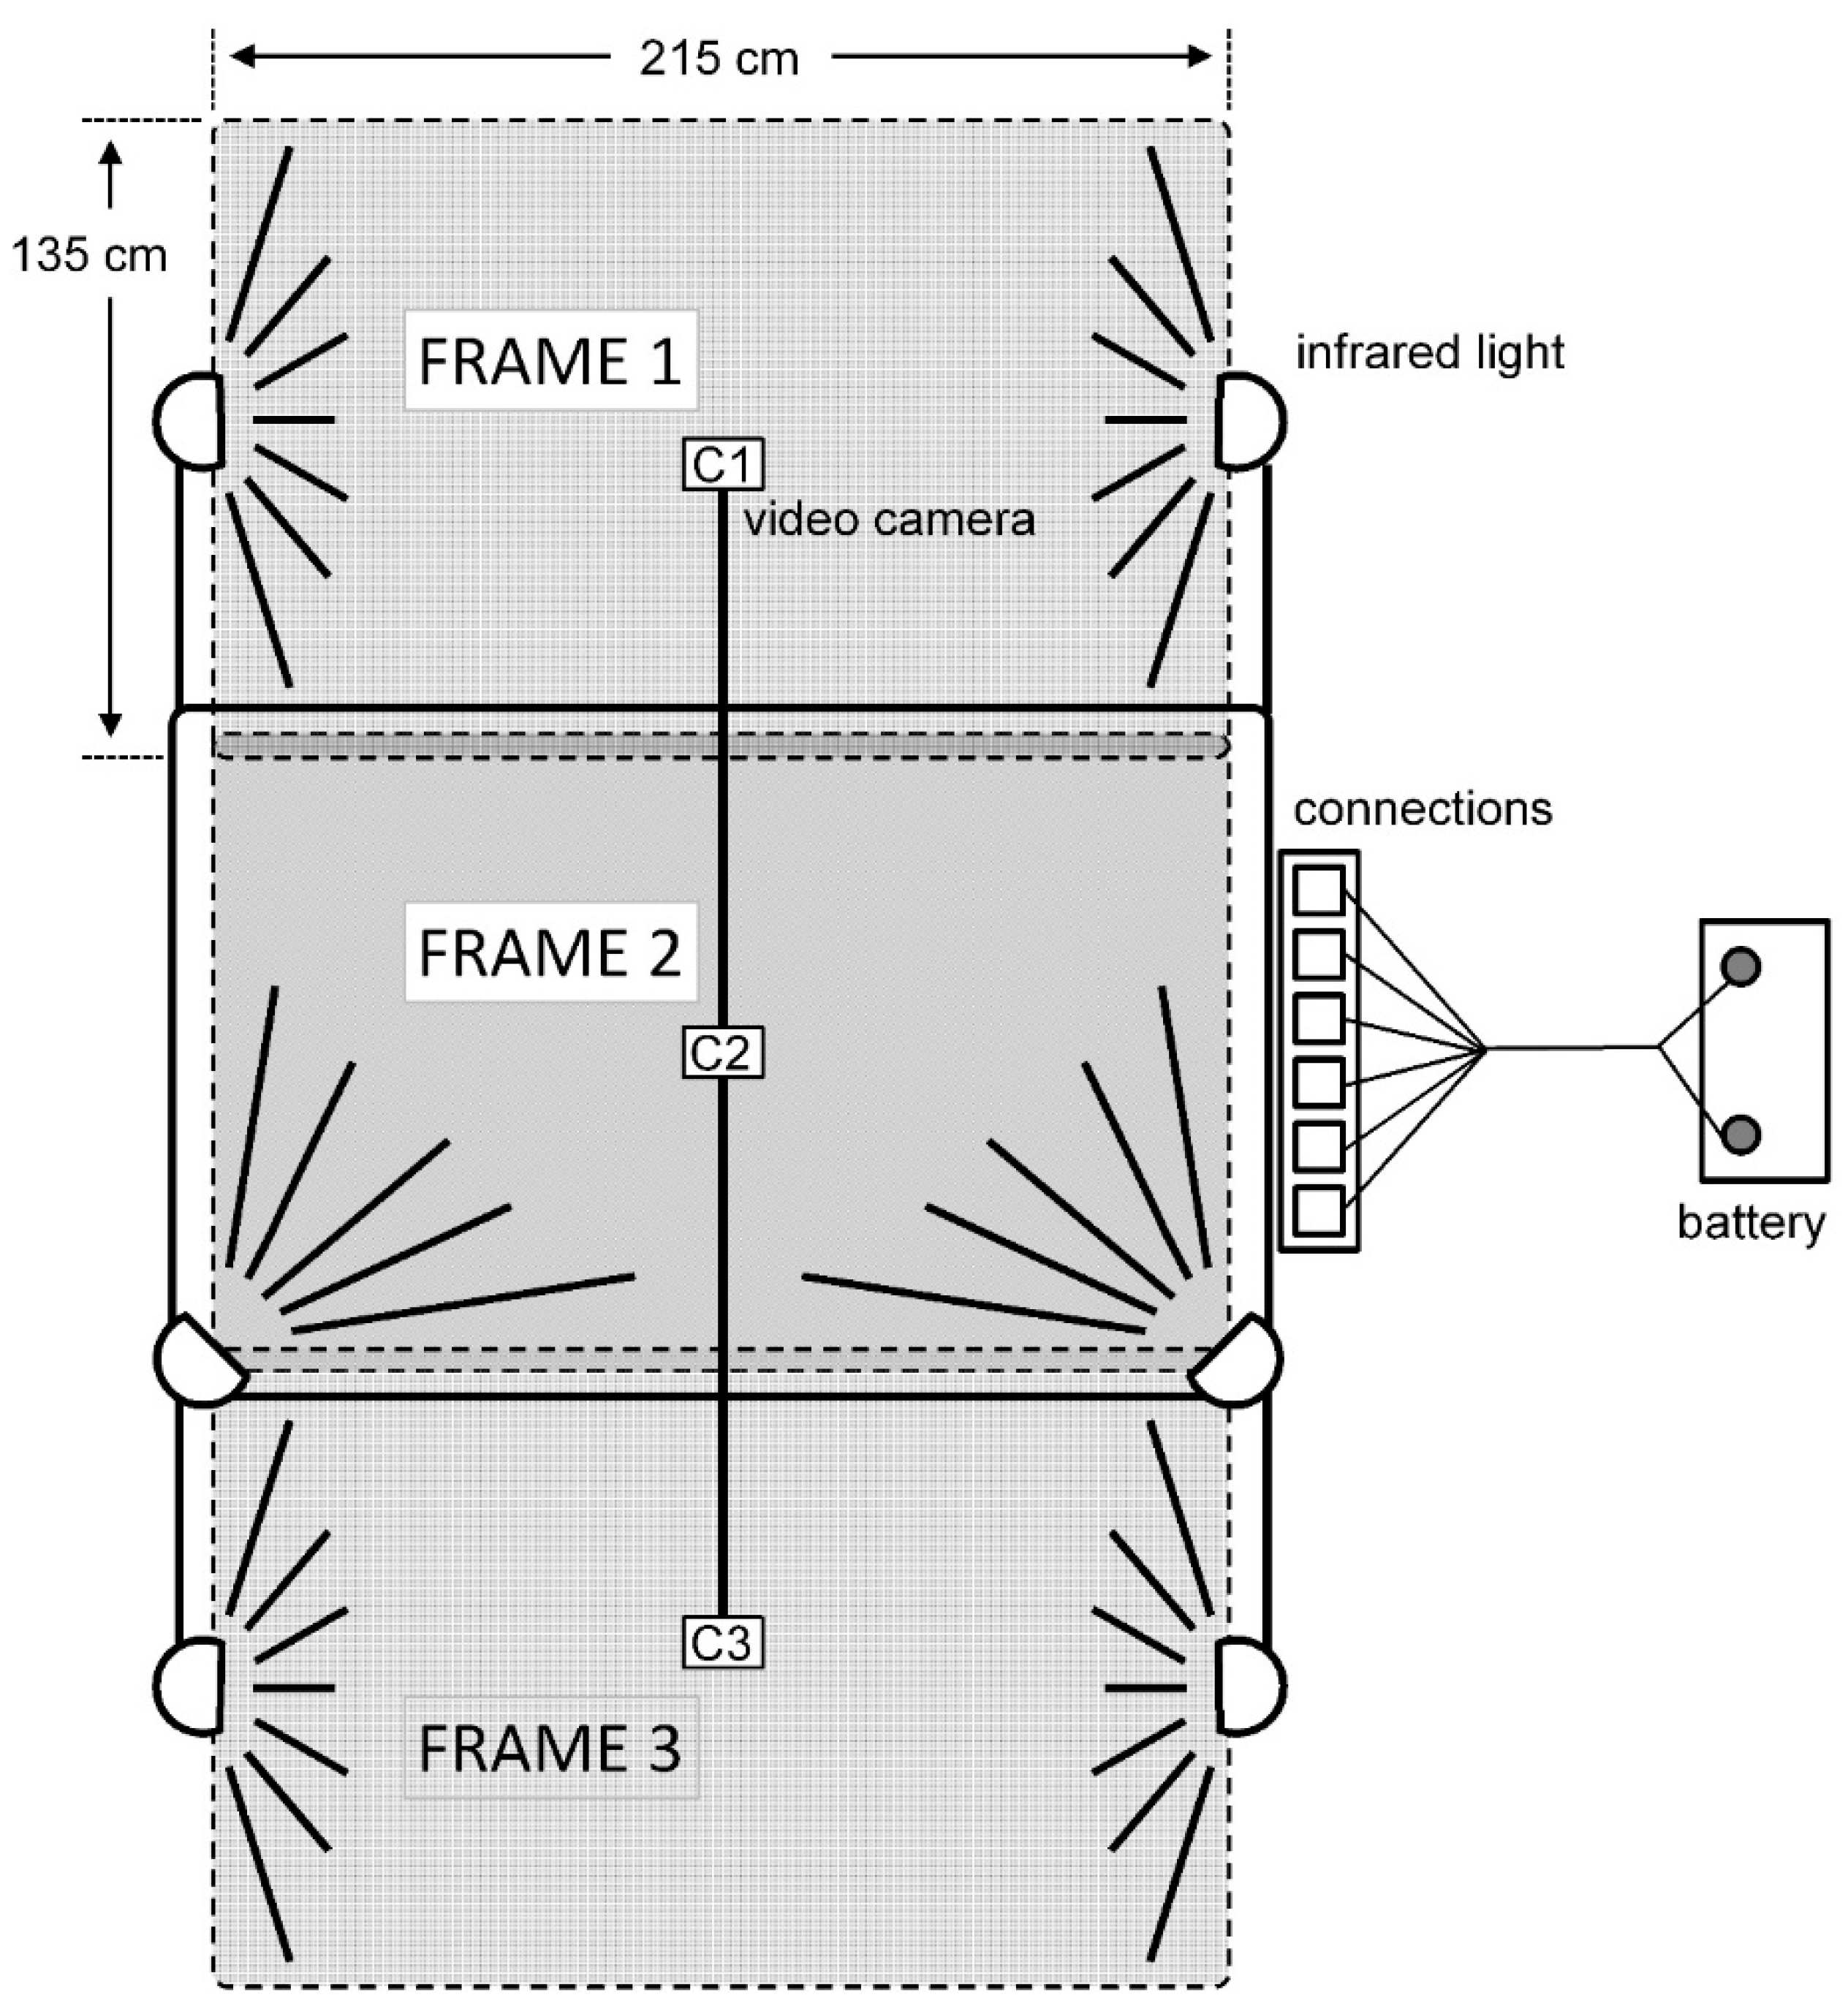
2.2. Behavioral Interactions

Observations were conducted during the months of June and July 2017 because during this period of the year the water clarity is generally good and the activity of fish and crayfish is high [30]. Recordings were carried out in five rivers located in Navarra region (northern Spain), from headwaters to middle reaches (towns and number of the sampling site in parenthesis): Lizarrusti (Lizarragabengoa, 4), Ulzama (Olave, 10), Arga (Idoi, 12), Erro (Lizoáin, 13), and Areta (Rípodas, 17) rivers (Figure 1). These sampling sites were selected because signal crayfish were highly abundant, which allows recording an elevated number of observations. Also, these five sites were distributed along the W–E axis in northern Navarra to accomplish a spatially representative data set (Figure 1).
As both signal crayfish and Pyrenean stone loach are more active at night, a total of 10 recording sessions (2 sessions per site on consecutive days) were carried out immediately after sunset. At each session, an area of ≈9 m2 of riverbed was recorded for 3.5 h. Infrared lamps were used to illuminate and to avoid disturbing the natural behavior of signal crayfish and fishes [16,31]. The recording equipment consisted of three cameras placed above the water 1 m from the riverbed in a zenith position (GoPro4 CHDHX-401-M modified for night vision, with a 2.5 mm lens, GoPro Inc., San Mateo, Califfornia, EE.UU.) and six infrared lamps (IR100, 890 nm, 2AH, 12V, Philips Electronics Nederland BV, Eindhoven, The Netherlands) installed in a fully adjustable metallic structure. A battery (80 amperes/h) provided energy to the infrared lamps (Figure 2).
The videos from the three cameras were merged with the program Adobe Premiere Pro CS6 (Adobe Inc., San Jose, California, EE.UU.) and were visualized with VLC media player (version 2.2, VideoLAN, Paris, France). The relative body size and morphological proportions (e.g., cheliped/body ratio) were used to distinguish each crayfish individual (n = 422). To avoid pseudoreplication, only the first encounter of each crayfish individual with native fish fauna was analyzed (n = 254). The encounters were defined from the point of view of fish and categorized as (adapted from [18]) (1) “fish evasion”, when only the fish individual clearly changes the direction after the encounter with the crayfish; (2) “fish dominance”, when only the crayfish individual clearly changes the direction after the encounter with the fish; and (3) “no interaction”, when neither the crayfish nor the fish change the direction after the encounter with the other. The life stage (i.e., juvenile/adult) and sex (i.e., male/female only for adult specimens) of crayfish individuals were also annotated, given that these factors can modulate behavior (e.g., [32,33]). To provide a high certainty on life stage and sex identifications, R. Miranda (from the author list) was the responsible person to visually classify these categories during video visualizations. This researcher is an experienced observer of signal crayfish from previous field surveys (R. Miranda, pers. observ.). More in detail, the approximate size ranges were 50 to 90 and 100 to 150 mm of total length (TL) for juvenile and adult crayfish, respectively. Previous measurements on particle sizes of substratum helped to establish these TL ranges during visualizations.

2.3. Trophic Overlap

Crayfish and fish were collected from 17 of the 20 sites in June–July 2017 to evaluate the trophic overlap between signal crayfish and native fishes (Figure 1). The remaining three sites (numbers 10, 13, and 17; see Figure 1) were not sampled by electrofishing to avoid disturbing the endangered populations of northern Iberian spined-loach. Given that mean depths were very low (15–80 cm) and that the water clarity was good enough, nocturnal hand sampling of crayfish with headlights was the most effective methodology in this type of river sections [34]. A total of n = 85 specimens of adult crayfish (5 per site) were collected (103–146 mm TL). Fish collection was performed by electrofishing (Hans Grassl model IG200/2D, 300–600 V, 0.2–2 A, Hans Grassl GmbH, Schönau am Königssee, Germany). According to the local abundances and conservation status, the lowest possible number of native fish specimens was collected among the sampling sites to provide a statistically representative data set from the study area. Specifically, we collected a total of n = 85 specimens for Pyrenean minnow (30–68 mm TL), n = 60 for brown trout (163–199 mm TL), n = 25 for Pyrenean gudgeon (30–110 mm TL), n = 20 for Pyrenean stone loach (50–100 mm TL), and n = 10 for Ebro nase (84–119 mm TL). All of the collected fish and crayfish were properly euthanized with low temperatures (cooler), as the use of anesthetic was not recommended for the subsequent stable isotope analysis (SIA) [35]. Crayfish and fish individuals were stored in ice during transport to the laboratory on the same date of collection (<2 h since capture). All field procedures complied with animal use and care regulations of Europe and Spain (specific licenses were granted for Scientific Field Research in Navarra). Crayfish and fish were collected by trained personnel (i.e., the holders of the licenses: I. Vedia and R. Miranda). Thus, no adverse effects were caused on the wildlife in the study habitats.
On arrival at the laboratory, crayfish and fish individuals were measured for TL (±1 mm) and weighed for total mass (TM, ±0.1 g). Crayfish sex (i.e., male/female) was also annotated. The pyloric and cardiac stomachs were extracted from each crayfish individual and were preserved in 70% ethanol until processing. Fish were not dissected to extract guts because data from previous surveys were used for the present study (see justification in “Data Analyses” below). For dietary analysis, stomachs were dissected and prey categories were identified to the lowest possible taxonomic level using available keys (e.g., [36]). The number of each prey category was counted using a dissecting microscope (magnification 40×). The presence of plant material and detritus was also annotated per crayfish individual.
For SIA, a sample from the abdominal muscle tissue of each crayfish specimen was extracted to determine the carbon and nitrogen stable isotopes [24]. A sample of white muscle tissue of each fish specimen was extracted from the dorsal area immediately behind the operculum [37]. Muscle samples were used because such tissue type exhibits less variation in the isotopic signatures (i.e., δ13C and δ15N values, see description below) than other tissues, reflecting more accurately the diet over a longer period of time [38,39]. After tissue extractions, muscle samples (≈0.2 g) were frozen (–20 °C) until processing. Muscle samples were not acidified and no debris from exoskeletons containing inorganic carbonates were included [40]. Samples were dried at 60 °C for 72 h and milled with tungsten carbide balls (Ø 3mm) in a Retsch Mixer Mill MM400 (100–240 VAC, 50/60 Hz, Retsch GmbH, Haan, Germany). The resulting homogeneous powder was then precisely weighed (1 mg) into tin cups using an electronic balance (±0.1 mg). Isotopic signatures were estimated for each crayfish and fish specimen. Firstly, total C and N proportions (% dry weight) were determined using an elemental analyzer (varioMICROCube, Elementar Analysensysteme GmbH, Langenselbold, Germany) with an analytical precision of 0.1%. Calibration was performed using sulfanilic acid. A plant reference material (algae-14th Intercomparison exercise of Organic Elemental Analysis of Reference Materials for Quality Control, MAT Control, University of Barcelona) was used to ensure that the accuracy was within 7% of the known total C and N proportions. Secondly, stable C and N isotope contents were measured using an isotope ratio mass spectrometer (Isoprime 100, Isoprime, Ltd.), operating in a continuous-flow mode. Vienna Pee Dee Belemnite (i.e., V-PDB) was the standard used as reference material for C. High-purity N2 was the standard used as reference material for N, after calibration to the atmospheric N2. Two sources were used to provide the N2 standard: IAEA-N-1 (International Atomic Energy Agency) and USGS 40 (U.S. Geological Survey). Isotope data are given as δ13C and δ15N, which are expressed per thousand (‰). These values represent the ratio between the isotopic composition of the sample and V-PDB for carbon and atmospheric N2 for nitrogen, respectively:
δ13C (‰ vs. V-PDB) = [(Rsample/Rstandard) − 1] × 1000
δ15N (‰ vs. atm-N2) = [(Rsample/Rstandard) − 1] × 1000,
where Rsample is the isotope ratio 13C/12C or 15N/14N for the muscle sample and Rstandard is the isotope ratio for the particular standard (V-PDB or atmospheric N2). Accuracy below 3% was found for δ13C and δ15N using the same reference plant material (algae AEO, see above) as a standard. The precision of the SIA was based on the relative standard deviation (RSD) of duplicated samples. RSD was found to be within 3% for isotopic signatures.

2.4. Data Analyses

Separate contingency analyses were performed using Fisher’s exact test to assess the statistical association between the categorical variables “encounter” (fish evasion/fish dominance/no interaction) with crayfish “sex” (male/female), crayfish “life stage” (juvenile/adult), and “fish species”. Standardized residuals were used to reveal significant associations between particular categories in those cells where an absolute value of this parameter is >1.5 [41].
For dietary analysis, data on crayfish were pooled, as previous results (nonparametric and chi-squared tests) showed that diet composition was similar between sites, sexes, and life stages. To analyze the trophic overlap between the invasive crayfish and the native fishes, the stomach contents of signal crayfish (n = 85) were compared with the published information for specimens of Pyrenean stone loach (n = 27, 46–97 mm TL), brown trout (n = 101, 150–219 mm TL), Pyrenean gudgeon (n = 70, 30–113 mm TL), and Pyrenean minnow (n = 333, 26–69 mm TL). Given that these native fish species are subjected to conservation measures, relevant published data on greater sample sizes (see above) of fish were obtained from previous surveys in the same study area by several coauthors of this manuscript [42,43,44,45,46,47]. Dietary data from these previous fish surveys (2000–2006) were compiled at the same period as the present study (i.e., summer months). Moreover, benthic invertebrate communities and fish diet has not significantly changed in the study sites between fish and crayfish surveys, as monitored by Oscoz et al. [48] and J. Oscoz (pers. observ.). Two overall dietary indices were calculated (omitting empty stomachs) by using data sets on crayfish (present study) and fishes (previous studies). These indices were expressed as a percentage for each prey category: (1) occurrence (frequency of stomachs/guts in which a particular prey category occurred relative to the total number of crayfish/fish individuals) and (2) abundance (frequency of the number of individuals for a particular prey category relative to the total number of individuals for all prey categories). Trophic overlap between signal crayfish and native fishes was determined by using the Schoener index (S) [49] on dietary data:
S = 1 − 0.5 × (∑ |pia − pib|),
where pia and pib are the relative proportions of each prey category i for species “a” and “b”, respectively. The index ranges from 0, which indicates no dietary overlap, to a maximum overlap of 1, when all prey items are found in equal proportions. Index values >0.6 indicate significant trophic overlap [50].
At each site, pairwise comparisons were used by means of Mann–Whitney U tests to reveal significant differences between signal crayfish and native fishes for δ13C and δ15N. This analytical approach (i.e., pairwise comparisons at each site, specifically with crayfish) was selected rather than a global analysis, as this technique did not reveal any clear pattern and results were not explanatory enough for a biological interpretation. Moreover, the isotopic baseline may differ across the study sites (e.g., [24]). The packages Stable Isotope Bayesian Ellipses and Stable Isotope Analysis in R (i.e., SIBER and SIAR, respectively) were used to estimate (1) the “size” of isotopic niche per species and (2) the trophic overlap between signal crayfish and native fishes [22,51]. SIBER and SIAR were also applied per site. The values of isotopic signatures for each individual were used to represent the isotopic niche of a particular species in a biplot, where δ13C and δ15N are the first and second axis, respectively. The size of isotope niche (i.e., a measure of trophic width) was quantified as the corrected Standard Ellipse Area (SEAc). These ellipses were estimated to minimize the bias caused by small sample sizes within a site, using the variance and covariance of bivariate isotopic signatures to contain approximately 40% of the data. Thus, these ellipses represent the cores of isotopic niches for the crayfish/fish population at each site. Given the coordinates of isotopic signatures for two species, the area of overlap (i.e., a measure of trophic overlap) was calculated between their respective SEAc per site (see methodology in [51]). Overall means were calculated for SEAc and Areas of Overlap to provide a better understanding on the global patterns of trophic niche width (per species) and trophic niche overlap (between crayfish and fishes) across the study area.
Statistical analyses were performed with SPSS 15.0 and R 3.1.3 (specific packages SIBER and SIAR were executed, see above) [52]. The level of significance was established at p = 0.05. The geographical information system software ArcGIS (version 10) was used for generating maps.

3. Results

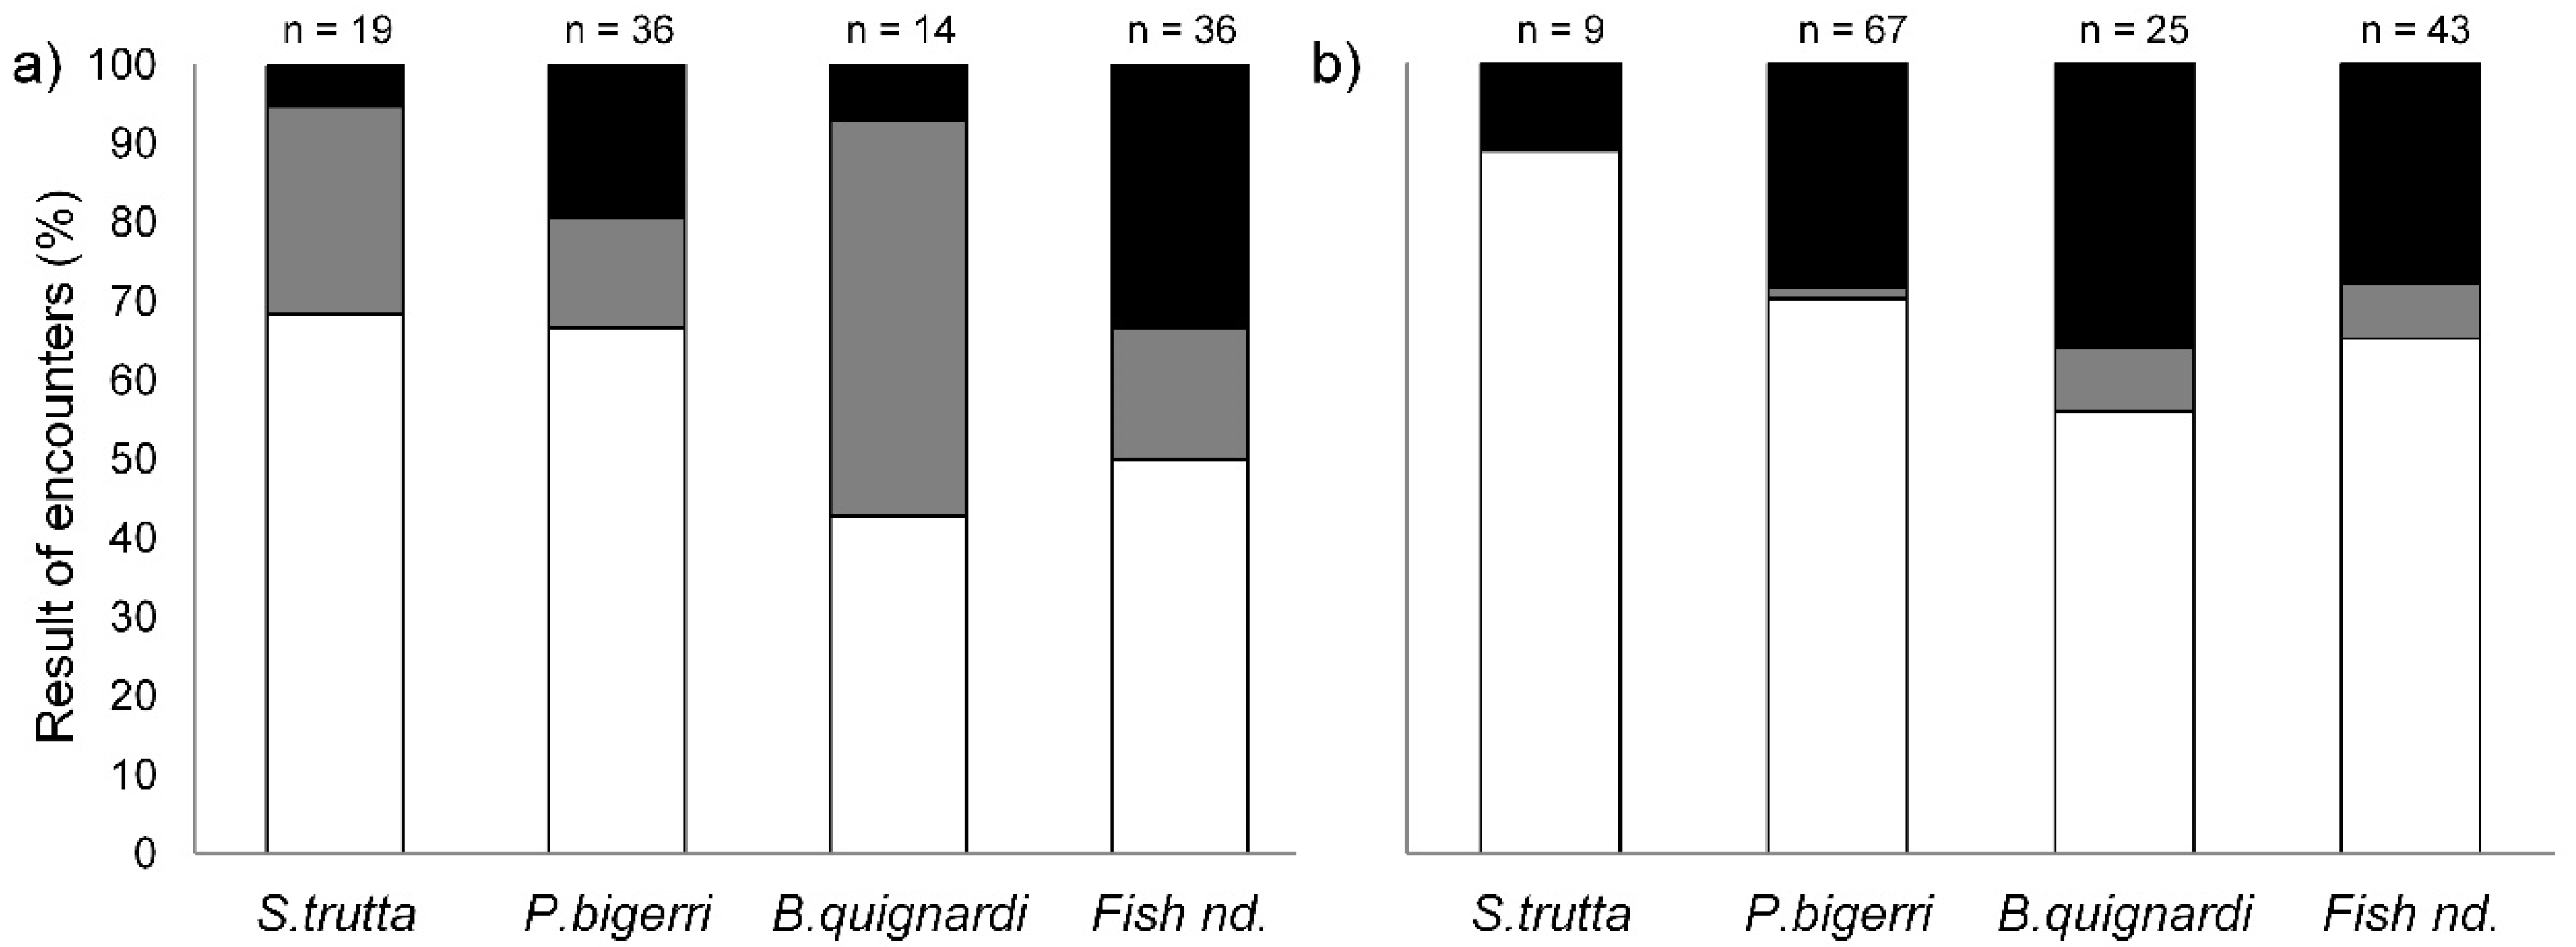
3.1. Behavioral Interactions

A total of 28 encounters were observed with brown trout (11%), 103 with Pyrenean minnow (41%), 39 with Pyrenean stone loach (15%), and 79 with undetermined fish (31%) (Figure 3). Given that only five encounters were observed with Pyrenean gudgeon (i.e., 2% of interactions), this species was not analyzed. No association was observed between the result of the encounter and crayfish sex (F = 3.41, p = 0.197). The frequency of encounter categories significantly differed between juvenile and adult crayfish (F = 24.16, p < 0.001) (Figure 3). In particular, fish individuals were dominant in 25% (13% expected) of the encounters with juvenile crayfish (standardized residual = 3.4), whereas fish were dominant in only 4% (13% expected) of the encounters with adult crayfish (standardized residual = –3). For juvenile crayfish specifically, a significant association was found between the fish species and the result of an encounter (F = 21.85, p = 0.003). In 50% of the encounters with juvenile crayfish, Pyrenean stone loach was dominant (25% expected; standardized residual = 1.9). In 33% of encounters between undetermined fish and juvenile crayfish, fish individuals displayed evasion from crayfish (19% expected; standardized residual = 1.9) (Figure 3). No association was detected between the encounter category and fish species in adult crayfish (F = 9.30, p = 0.316), although observations showed a higher fish “evasion” response for Pyrenean stone loach (>30%) (Figure 3). Regarding the behavioral category “no interaction”, our results showed that encounters between signal crayfish with pelagic fishes, especially brown trout, only triggered a fish response (either dominance or evasion) in <30% occasions (Figure 3).

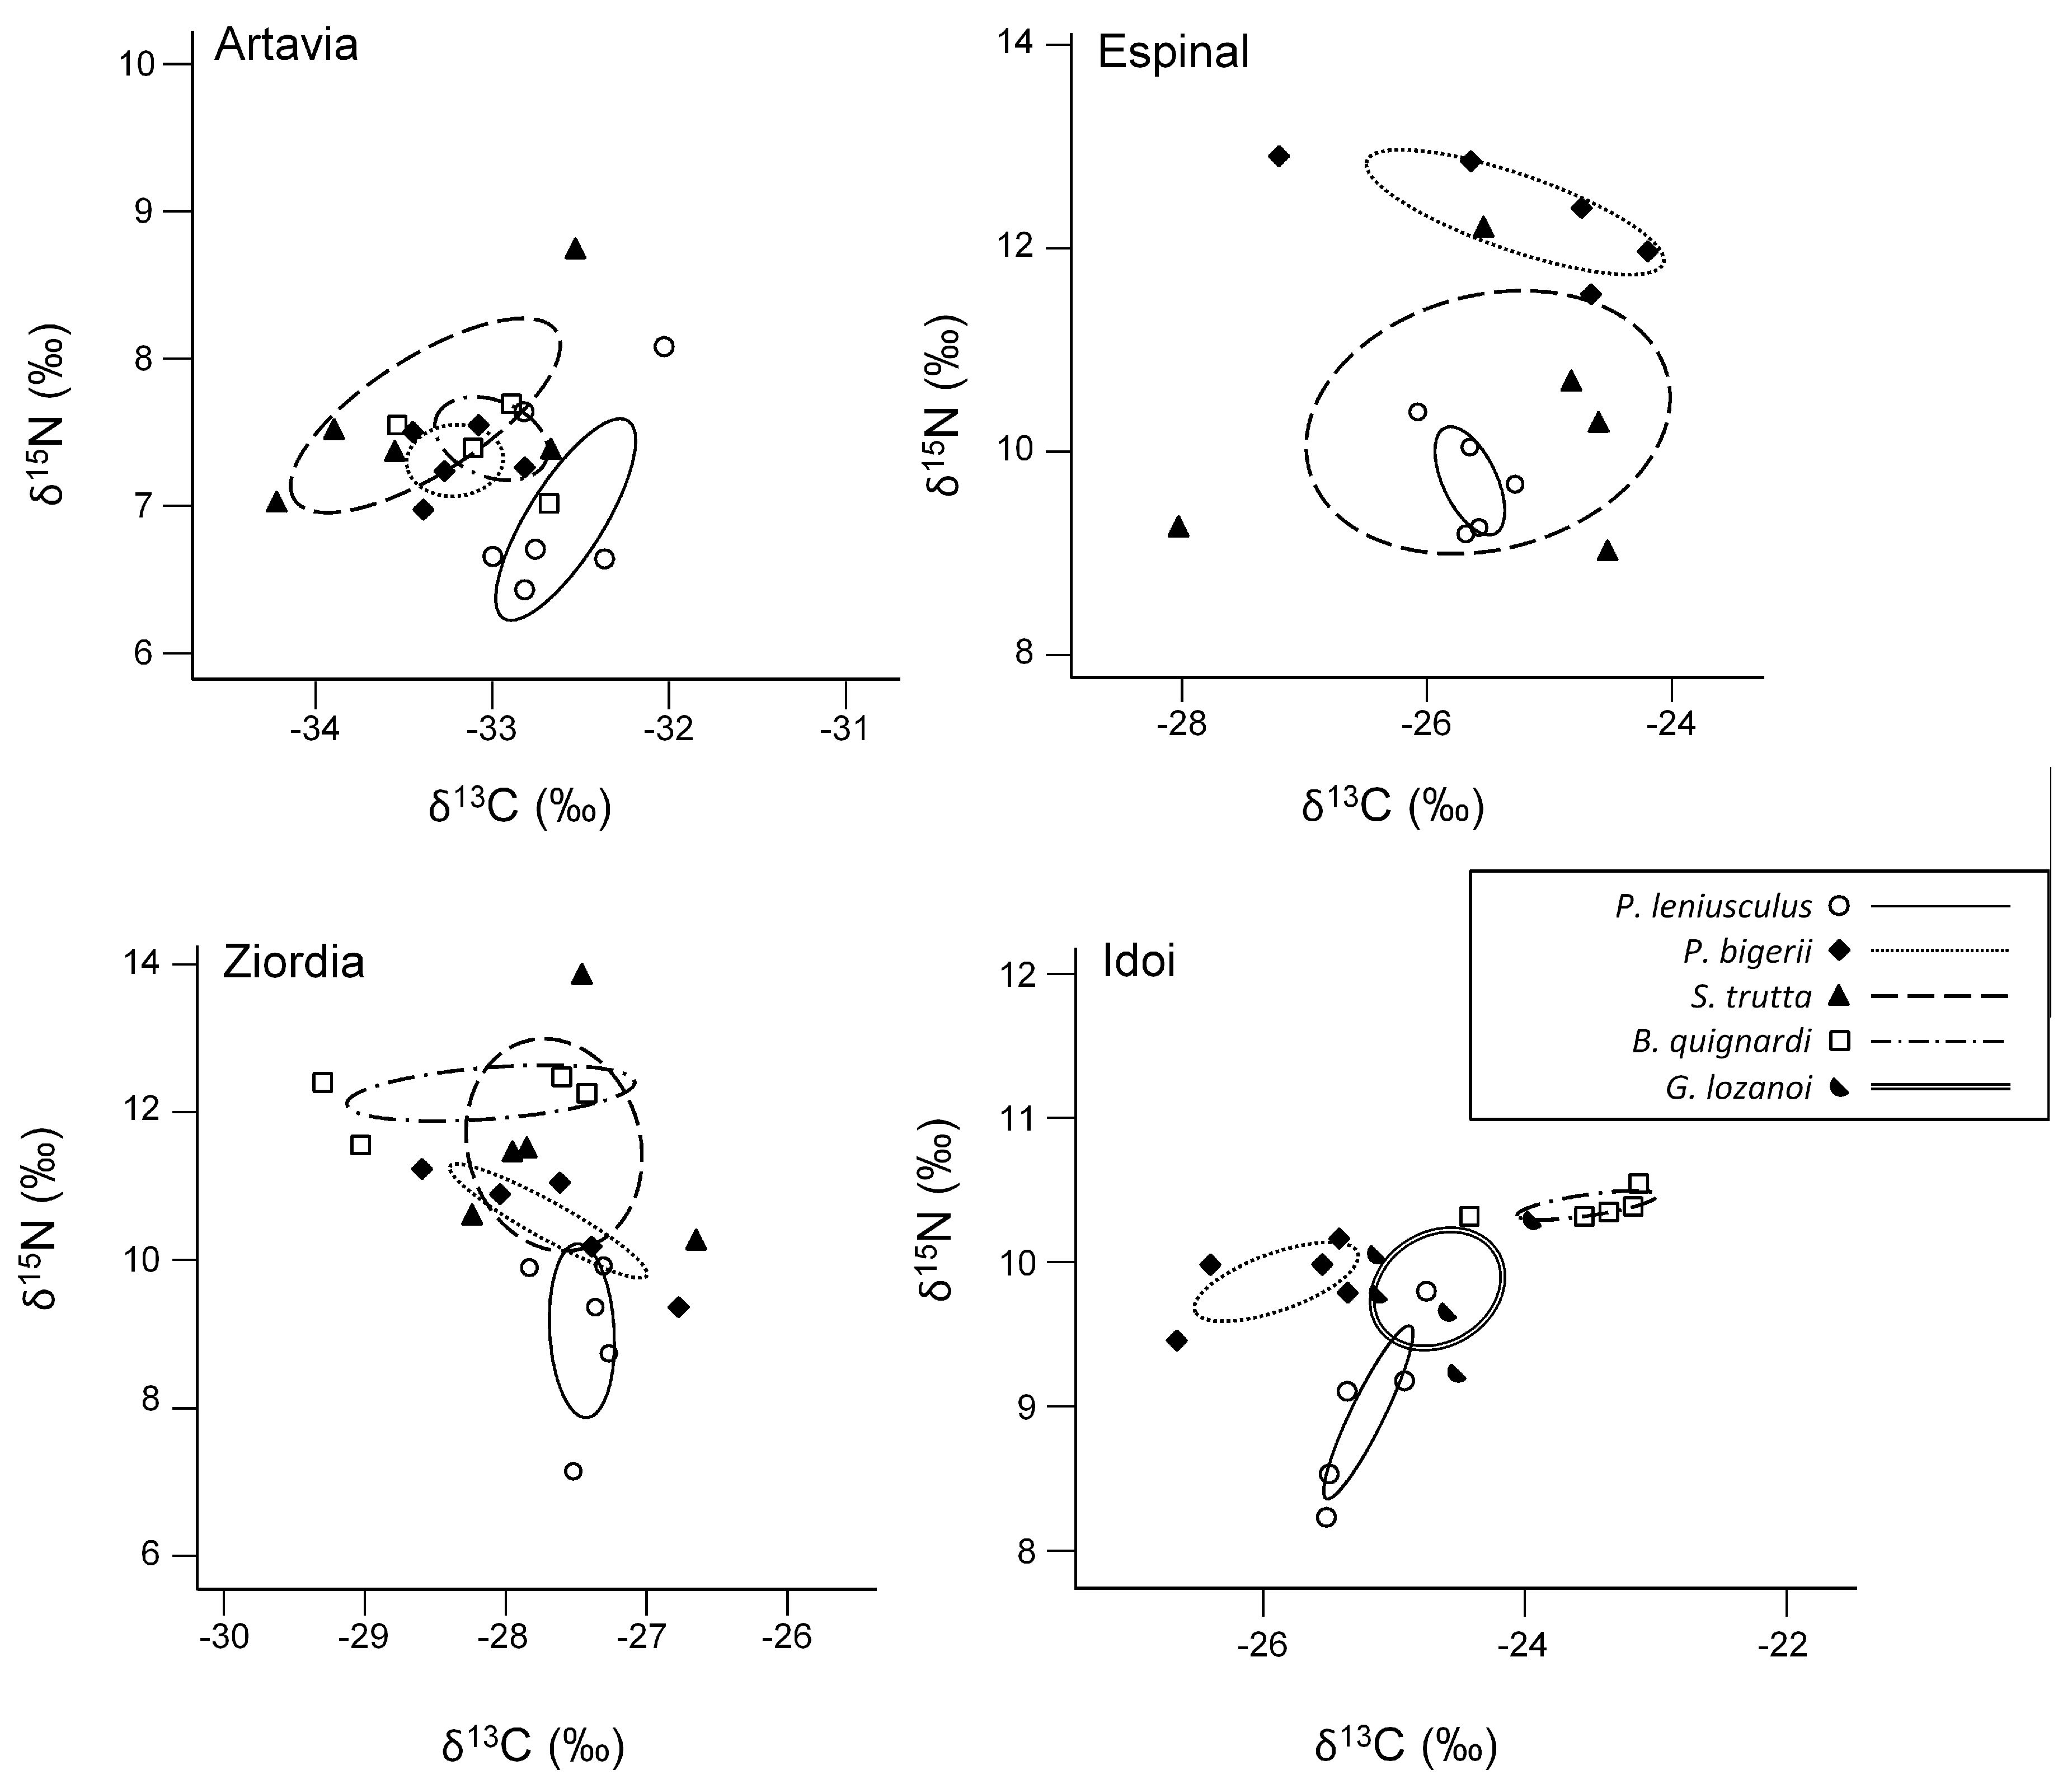
3.2. Trophic Overlap

In terms of occurrence and abundance, signal crayfish mainly preyed on Diptera, Trichoptera, and Ephemeroptera. These three prey categories were also the most important for Pyrenean stone loach, along with Crustacea, in occurrence; although Diptera larvae was clearly the most abundant prey (>75%) for this benthic fish (Table 1). Brown trout showed a diet composition highly variable, with Ephemeroptera being the most important prey in occurrence and Crustacea the most abundant. Diptera larvae were the most frequent and abundant prey for Pyrenean gudgeon and Pyrenean minnow. The Schoener index showed a significant trophic overlap between signal crayfish with Pyrenean minnow (>0.80), Pyrenean stone loach (>0.75), and Pyrenean gudgeon (≈0.70) (Table 1). Apart from prey items, a high occurrence of plant material was found in crayfish diet (>25%), such as algae and vegetation debris. Detritus was also a frequent food category (>20%).
The isotopic values of crayfish and fish species were significantly different in several sites, mainly for δ15N (Table 2; Figure 4). Particularly for this stable isotope of N, fishes always showed a higher mean value than signal crayfish (Table 2). Consequently, the isotopic niche overlap (i.e., based on the SEAc) between signal crayfish and native fish species was low (Table 3; Figure 4). According to fish results, signal crayfish had an intermediate mean SEAc value (i.e., isotopic niche). Brown trout had the widest isotopic niche (>2‰2), and only this fish species showed a certain degree of isotopic overlap with crayfish (Table 3).

4. Discussion

4.1. Behavioral Interactions

In agreement with our first hypothesis, observations showed that signal crayfish can physically displace native fishes, with >25% of encounters showing fish evasion under particular conditions, i.e., according to crayfish size and fish species. The result of an interaction between crayfish and fish is strongly influenced by the crayfish life stage (mainly the size). Thus, fishes were more dominant when interacting with juvenile crayfish, whereas adults displayed more dominance in their interactions with native fishes [53,54]. The present results also supported our expectations, as evasion was a behavioral response clearly observed in the benthic Pyrenean stone loach, after interacting with adult crayfish. This behavior may be related to the high spatial overlap in the habitat use between signal crayfish and a variety of benthic fishes [13]. As an example, Guan and Wiles [11] observed, in an artificial British stream, how signal crayfish displaced two benthic fishes (bullhead and stone loach) from shelters after displaying aggressive behaviors. Similar interferences have been also observed under natural conditions in an Iberian stream, the River Jarama (central Spain). Thus, field observations (via snorkeling) revealed physical displacement for habitat/refuge by signal crayfish on two endemic Iberian loaches, the northern Iberian spined-loach and the southern Iberian spined-loach Cobitis paludica (de Buen, 1930) (D. Almeida, pers. observ.). In North America, the benthic Paiute sculpin Cottus beldingii (Eigenmann & Eigenmann, 1891) reduced its use of refuges and pools, shifted into higher velocity microhabitats and spent more time fleeing in the presence of invasive signal crayfish [53]. However, we must consider that the degree of interference is strongly dependent on the overall availability of shelters. In this regard, previous studies suggest that shelter availability is limited under natural conditions because signal crayfish may be found at densities higher than or similar to the number of potential shelters within a particular site [53]. All these results, along with the present study, reinforce the idea that spatial interference occurs between benthic fish and signal crayfish where this species has been introduced in American and European fresh waters. Regarding pelagic fishes, such as brown trout in the study rivers, our previous results also indicate that signal crayfish can spatially interfere with salmonids, although these observations were recorded under laboratory conditions [14]. As a consequence of this potential spatial interference, the vulnerability of displaced fish to predation may be increased [55]. In particular, Rahel and Stein [56] observed that predation on the Johnny darter Etheostoma nigrum Rafinesque, 1820 was more intense by the small-mouth bass Micropterus dolomieu Lacépède, 1802 where the rusty crayfish Faxonius rusticus (Girard, 1852) was present and shelter was limiting. In our study area, signal crayfish may increase the risk of predation for benthic fishes, such as Pyrenean stone loach, by piscivorous fish (e.g., brown trout), birds (e.g., gray heron Ardea cinerea L., 1758), and mammals (e.g., Eurasian otter Lutra lutra (L., 1758)) [57,58,59].

4.2. Trophic Overlap

The present results partly supported the second hypothesis. Specifically, the analysis of stomach content showed that signal crayfish preyed on an important number of benthic invertebrates, mainly Diptera larvae (e.g., taxonomic families of Chironomidae and Simuliidae). Except for brown trout, benthic invertebrates were also the staple food resource for the study fish species (see bibliographic references on fish diet in Methods section), which was the reason for the high trophic overlap with crayfish by using dietary data. However, plant material and detritus were also common food categories for signal crayfish. These findings indicated a foraging strategy more “generalist” for crayfish (e.g., [40]), whereas fish species followed a more “predatory” feeding tactic on invertebrates. This would be related to an ecological role for signal crayfish as a wide omnivorous species, affecting different levels of the freshwater trophic web [60,61]. As it was stated in the Methods section, the present study used dietary data from different years (see above). Food resources can largely vary from year to year in Mediterranean freshwater habitats [62]. Thus, such a difference between survey periods could mean a confounding factor for results on diet composition. However, comprehensive monitoring surveys have been carried out on benthic invertebrates and fish diet (e.g., 48), which show that the prey use-availability have been relatively stable in the study area. This is important to state that such variation is unlikely to affect the present results regarding overlap.
Given that plant material was not used for calculation of the Schoener index (only prey items), this is the most likely cause for the discrepancies between dietary and stable isotope results on trophic overlap. The Schoener index is commonly calculated by using numbers of particular items, e.g., prey individuals to estimate overlap between obvious predatory species (e.g., [63]). Ingested mass of plant material and detritus should have been included in the gut content analysis for a more realistic comparison. Unfortunately, these data are not provided from the previous surveys, as fish species analyzed in the present study were mainly predatory on invertebrates (see bibliographic references on fish diet in Methods section), whereas signal crayfish was more omnivorous (see findings above). In these cases (i.e., discrepancies), SIA reveals feeding habits comprising a longer period, whereas dietary analysis only represents a “snapshot” of the whole foraging strategy [38,39]. More specifically, signal crayfish had lower δ15N values than native fishes, which may be a consequence of the increased ingestion of algae and detritus. In this respect, Rosewarne et al. [64] analyzed the gut content of adult specimens of signal crayfish in the River Stour (UK). This study revealed a wide variety of food items, including algae, macrophytes, terrestrial detritus, benthic invertebrates, and fish. As a result, signal crayfish occupied an intermediate trophic level after performing SIA, which was similar to different omnivorous species of insect nymphs [64]. Invasive species are expected to have broader ecological, and particularly, trophic niches, as they are often generalists to exploit a wide variety of environmental resources (e.g., see [65] for a comprehensive review). Nevertheless, the niche size of signal crayfish was not as elevated as expected for this bioinvasion in the present study. This finding may be at least in part due to the size of crayfish (adult only) used in the SIA, as the isotopic niche width varies according to the ontogenetic stages [40], although other authors reported no evidence of such ontogenetic changes (e.g., [66]).
Contrary to our second hypothesis, SIA showed a lack of trophic overlap between signal crayfish and benthic fishes. A possibility to explain this result consists of potential niche alterations. More in detail, if competitively inferior individuals (i.e., fish in this case) are physically displaced and forced to feed on less suitable resources, trophic niche shifts likely occur [67]. Also, a slight isotopic overlap was found between signal crayfish and brown trout only. This can be partially explained because of the high variety of diet composition for this fish species and thus, its wide isotopic niche. The broad trophic niche of brown trout may be explained by the ontogenetic stage and seasonal variations of food resources. In particular, reliance on terrestrial and aquatic resources can be very different according to the age and period of year, irrespective of the fish density [68]. Another cause for such a variable diet may be the expansion of the trophic niches in top predators with increased population density due to high intraspecific competition, which leads to a differential diet specialization among individuals [69]. Another potential reason for this overlap is that large brown trout occasionally prey on crayfish, which are omnivores, and small brown trout commonly prey on planktonic crustaceans, such as Cladocera or Copepoda, which feed on phytoplankton. These may result in a decrease of the overall δ15N level and a subsequent overlap with the isotopic crayfish niche. Other native fish species had a higher trophic level (i.e., higher δ15N value) than brown trout in several sites (e.g., Pyrenean minnow and Pyrenean stone loach). These fish species frequently fed on predatory Trichoptera larvae with larger sizes, such as the taxonomic family Rhyacophilidae [43,45], which may increase the 15N level in their body tissues.
Only dietary results on niche overlap (i.e., the Schoener index) suggested that trophic interference may occur between signal crayfish and native fishes, particularly for benthic invertebrates. Although we mentioned above that these results from dietary data must be limited at a specific moment (i.e., a snapshot), a certain degree of competition may be established between signal crayfish and benthic fishes, such as Pyrenean stone loach and Pyrenean gudgeon. Indeed, these three species (i.e., crayfish and two fishes) select similar shelter features in coarse substrata and feed virtually on the same benthic invertebrate communities [44,45]. Such a potential competition could be especially relevant when the abundance of this food resource is scarce (i.e., limiting) during some periods of the year. In particular, summer drought can be ecologically “severe” in northern rivers of the Iberian Peninsula under partly Mediterranean climate conditions [62]. Moreover, signal crayfish populations can reach high densities in the study rivers [70], with the pressure on benthic invertebrates being increased accordingly [61]. However, the relationship between competition and niche overlap is highly complex and difficult to evaluate in field studies. Thus, particular resources may not always limit populations and species could overlap their niches with no competition [71].
As a final remark and according to our results, a particular conservation concern arises in the study area. The benthic fish species northern Iberian spined-loach is catalogued as “Endangered” on the IUCN Red List, as their populations have undergone a steep decline across the Iberian Peninsula in recent years [72]. The present study did not analyze any direct impact of signal crayfish on this endemic loach species. However, and given that its distribution area widely overlaps with that of signal crayfish, conservation managers should apply urgent measures to control populations of this invasive species.

5. Conclusions

The present study is one of the few examples assessing crayfish behavior within its spatial natural context (e.g., [30,31]). Therefore, our findings are highly valuable for real impact assessment of invasive signal crayfish. In this regard, our field study appears to support the assumptions of previous laboratory experiments, which indicated that non-native crayfish could have detrimental effects on fish populations, especially benthic fish species (e.g., [11,13]). However, more data is necessary to accurately establish the level of ecological competition, both for food and space. In particular, these data should be generated from field surveys spending more than two years in the same study area, including different seasons (see [73] for a comprehensive review on river research). Thus, the precise environmental factors controlling habitat and prey availabilities will be better identified, as inherent fluctuations occur in crayfish/fish populations over time [55].

Author Contributions

Conceptualization, I.V., A.A.R., E.B., D.G., J.O., and R.M.; Methodology, I.V., D.E., J.M.S., and R.M.; Software, I.V. and P.M.L.; Formal Analysis, I.V.; Writing—Original Draft Preparation, I.V., P.M.L. and R.M.; Writing—Review & Editing, D.A. and R.M.; Supervision, Project Administration, and Funding Acquisition, R.M. All authors read and approved the final manuscript.

Funding

The authors are grateful to the “Asociación de Amigos-University of Navarra”, which awarded Iván Vedia a doctoral grant (2012–2016). This research was funded by the Research Program of the University of Navarra (PIUNA 2014–16).

Acknowledgments

Xabier Álvarez, Maite González, Antonio Vilches, and Gregorio Sánchez collaborated during the field surveys and laboratory studies. Gema Castillo-García helped with the text formatting. The authors thank the comments from three anonymous reviewers to improve the manuscript.

Conflicts of Interest

The authors declare no conflicts of interest. The manuscript was approved by all authors for publication. The funders had no role in the design of the study; in the collection, analyses, or interpretation of data; in the writing of the manuscript, or in the decision to publish the results.

References

  1. Mooney, H.A.; Hobbs, R.J. Invasive Species in a Changing World; Island Press: Washington, DC, USA, 2000. [Google Scholar]
  2. Clavero, M.; García-Berthou, E. Invasive species are a leading cause of animal extinctions. Trends Ecol. Evol. 2005, 20, 110. [Google Scholar] [CrossRef] [PubMed]
  3. Butchart, S.H.M.; Walpole, M.; Collen, B.; van Strien, A.; Scharlemann, J.P.W.; Almond, R.E.A.; Baillie, J.E.M.; Bomhard, B.; Brown, C.; Bruno, J.; et al. Global Biodiversity: Indicators of Recent Declines. Science 2010, 328, 1164–1168. [Google Scholar] [CrossRef] [PubMed]
  4. Gherardi, F. Biological invasions in inland waters: An overview. In Biological Invaders in Inland Waters: Profiles, Distribution, and Threats; Springer: Dordrecht, The Netherlands, 2007; pp. 3–25. [Google Scholar]
  5. Smith, K.G.; Darwall, W.R.T. The Status and Distribution of Freshwater Fish Endemic to the Mediterranean Basin; IUCN: Gland, Switzerland; Cambridge, UK, 2006. [Google Scholar]
  6. Reyjol, Y.; Hugueny, B.; Pont, D.; Bianco, P.G.; Beier, U.; Caiola, N.; Casals, F.; Cowx, I.; Economou, A.; Ferreira, T.; et al. Patterns in species richness and endemism of European freshwater fish. Glob. Ecol. Biogeogr. 2007, 16, 65–75. [Google Scholar] [CrossRef]
  7. Almeida, D.; Ribeiro, F.; Leunda, P.M.; Vilizzi, L.; Copp, G.H. Effectiveness of FISK, an Invasiveness Screening Tool for Non-Native Freshwater Fishes, to Perform Risk Identification Assessments in the Iberian Peninsula. Risk Anal. 2013, 33, 1404–1413. [Google Scholar] [CrossRef] [PubMed]
  8. Vedia, I.; Miranda, R. Review of the state of knowledge of crayfish species in the Iberian Peninsula. Limnetica 2013, 32, 269–286. [Google Scholar]
  9. Geiger, W.; Alcorlo, P.; Baltanás, A.; Montes, C. Impact of an introduced crustacean on the trophic webs of Mediterranean wetlands. Biol. Invasions 2005, 7, 49–73. [Google Scholar] [CrossRef]
  10. Reynolds, J.D. A review of ecological interactions between crayfish and fish, indigenous and introduced. Knowl. Manag. Aquat. Ecosyst. 2011, 401, 21. [Google Scholar] [CrossRef]
  11. Guan, R.Z.; Wiles, P.R. Ecological impact of introduced crayfish on benthic fishes in a British Lowland River. Conserv. Biol. 1997, 11, 641–647. [Google Scholar] [CrossRef]
  12. Peay, S.; Guthrie, N.; Spees, J.; Nilsson, E.; Bradley, P. The impact of signal crayfish (Pacifastacus leniusculus) on the recruitment of salmonid fish in a headwater stream in Yorkshire, England. Knowl. Manag. Aquat. Ecosyst. 2009, 12, 394–395. [Google Scholar] [CrossRef]
  13. Bubb, D.H.; O’Malley, O.J.; Gooderham, A.C.; Lucas, M.C. Relative impacts of native and non-native crayfish on shelter use by an indigenous benthic fish. Aquat. Conserv. Mar. Freshw. Ecosyst. 2009, 19, 448–455. [Google Scholar] [CrossRef]
  14. Griffiths, S.W.; Collen, P.; Armstrong, J.D. Competition for shelter among over-wintering signal crayfish and juvenile Atlantic salmon. J. Fish Biol. 2004, 65, 436–447. [Google Scholar] [CrossRef]
  15. Glon, M.G.; Larson, E.R.; Pangle, K.L. Connecting laboratory behavior to field function through stable isotope analysis. PeerJ 2016, 4, e1918. [Google Scholar] [CrossRef] [PubMed]
  16. Bergman, D.A.; Moore, P.A. Field observations of intraspecific agonistic behavior of two crayfish species, Orconectes rusticus and Orconectes virilis, in different habitats. Biol. Bull. 2003, 205, 26–35. [Google Scholar] [CrossRef] [PubMed]
  17. Crandall, K.A.; De Grave, S. An updated classification of the freshwater crayfishes (Decapoda: Astacidea) of the world, with a complete species list. J. Crustac. Biol. 2017, 37, 615–653. [Google Scholar] [CrossRef] [Green Version]
  18. Almeida, D.; Merino-Aguirre, R.; Vilizzi, L.; Copp, G.H. Interspecific Aggressive Behaviour of Invasive Pumpkinseed Lepomis gibbosus in Iberian Fresh Waters. PLoS ONE 2014, 9, e88038. [Google Scholar] [CrossRef] [PubMed]
  19. Bearhop, S.; Adams, C.E.; Waldron, S.; Fuller, R.A.; MacLeod, H. Determining trophic niche width: A novel approach using stable isotope analysis. J. Anim. Ecol. 2004, 73, 1007–1012. [Google Scholar] [CrossRef]
  20. Post, D.M. Using stable isotopes to estimate trophic position: Models, methods, and assumptions. Ecology 2002, 83, 703–718. [Google Scholar] [CrossRef]
  21. Peterson, B.J.; Fry, B. Stable Isotopes in Ecosystem Studies. Annu. Rev. Ecol. Syst. 1987, 18, 293–320. [Google Scholar] [CrossRef]
  22. Layman, C.A.; Arrington, D.A.; Montaña, C.G.; Post, D.M. Can stable isotope ratios provide for community-wide measures of trophic structure? Ecology 2007, 88, 42–48. [Google Scholar] [CrossRef]
  23. Caut, S.; Angulo, E.; Courchamp, F. Variation in discrimination factors (Δ15N and Δ13C): The effect of diet isotopic values and applications for diet reconstruction. J. Appl. Ecol. 2009, 46, 443–453. [Google Scholar] [CrossRef]
  24. Ercoli, F.; Ruokonen, T.J.; Hämäläinen, H.; Jones, R.I. Does the introduced signal crayfish occupy an equivalent trophic niche to the lost native noble crayfish in boreal lakes? Biol. Invasions 2014, 16, 2025–2036. [Google Scholar] [CrossRef]
  25. Jackson, M.C.; Evangelista, C.; Zhao, T.; Lecerf, A.; Britton, J.R.; Cucherousset, J. Between-lake variation in the trophic ecology of an invasive crayfish. Freshw. Biol. 2017, 62, 1501–1510. [Google Scholar] [CrossRef]
  26. Bejarano, M.D.; Marchamalo, M.; de Jalón, D.G.; del Tánago, M.G. Flow regime patterns and their controlling factors in the Ebro basin (Spain). J. Hydrol. 2010, 385, 323–335. [Google Scholar] [CrossRef] [Green Version]
  27. Leunda, P.; Miranda, R.; Oscoz, J. Occurrence and conservation of the threatened endemic cobitid, Cobitis calderoni, in the Erro River (Ebro Basin, Spain). Cybium 2007, 31, 13–18. [Google Scholar]
  28. Leunda, P.M.; Sistiaga, M.; Oscoz, J.; Miranda, R. Ichthyofauna of a near-natural Pyrenean river: Spatio-temporal variability and reach-scale habitat. Environ. Eng. Manag. J. 2012, 11, 1111–1124. [Google Scholar] [CrossRef]
  29. Almodóvar, A.; Nicola, G.G.; Elvira, B.; García-Marín, J.L. Introgression variability among Iberian brown trout Evolutionary Significant Units: The influence of local management and environmental features. Freshw. Biol. 2006, 51, 1175–1187. [Google Scholar] [CrossRef]
  30. Bubb, D.H.; Thom, T.J.; Lucas, M.C. Movement and dispersal of the invasive signal crayfish Pacifastacus leniusculus in upland rivers. Freshw. Biol. 2004, 49, 357–368. [Google Scholar] [CrossRef]
  31. Davis, K.; Huber, R. Activity patterns, behavioural repertoires, and agonistic interactions of crayfish: A non-manipulative field study. Behaviour 2007, 144, 229–247. [Google Scholar] [CrossRef] [Green Version]
  32. Pavey, C.R.; Fielder, D.R. The influence of size differential on agonistic behaviour in the freshwater crayfish, Cherax cuspidatus (Decapoda: Parastacidae). J. Zool. 1996, 238, 445–457. [Google Scholar] [CrossRef]
  33. Warren, A.H.; Saltzman, L.; Buckholt, M.A.; Mathews, L.M. Agonistic Interactions Differ by Sex and Season in the Crayfish Orconectes quinebaugensis. J. Crustac. Biol. 2009, 29, 484–490. [Google Scholar] [CrossRef]
  34. Reynolds, J.D.; O’Connor, W.; O’Keeffe, C.; Lynn, D. A Technical Manual for Monitoring White-Clawed Crayfish Austropotamobius pallipes in Irish Lakes; Irish Wildlife Manuals: Dublin, Ireland, 2010. [Google Scholar]
  35. Nahon, S.; Séité, S.; Kolasinski, J.; Aguirre, P.; Geurden, I. Effects of euthanasia methods on stable carbon (δ13 C value) and nitrogen (δ15 N value) isotopic compositions of fry and juvenile rainbow trout Oncorhynchus mykiss. Rapid Commun. Mass Spectrom. 2017, 31, 1742–1748. [Google Scholar] [CrossRef] [PubMed]
  36. Oscoz, J.; Galicia, D.; Miranda, R. Identification Guide of Freshwater Macroinvertebrates of Spain; Springer: Dordrecht, The Netherlands, 2011. [Google Scholar]
  37. Tronquart, N.H.; Mazeas, L.; Reuilly-Manenti, L.; Zahm, A.; Belliard, J. Fish fins as non-lethal surrogates for muscle tissues in freshwater food web studies using stable isotopes. Rapid Commun. Mass Spectrom. 2012, 26, 1603–1608. [Google Scholar] [CrossRef] [PubMed]
  38. Yokoyama, H.; Tamaki, A.; Harada, K.; Shimoda, K.; Koyama, K.; Ishihi, Y. Variability of diet-tissue isotopic fractionation in estuarine macrobenthos. Mar. Ecol. Prog. Ser. 2005, 296, 115–128. [Google Scholar] [CrossRef] [Green Version]
  39. Phillips, D.L.; Eldridge, P.M. Estimating the timing of diet shifts using stable isotopes. Oecologia 2006, 147, 195–203. [Google Scholar] [CrossRef] [PubMed]
  40. Stenroth, P.; Holmqvist, N.; Nyström, P.; Berglund, O.; Larsson, P.; Granéli, W. Stable isotopes as indicator of diet in omnivorous crayfish (Pacifastacus leniusculus): The influence of tissue, sample treatment, and season. Can. J. Fish. Aquat. Sci. 2006, 63, 821–831. [Google Scholar] [CrossRef]
  41. Agresti, A. An Introduction to Categorical Data Analysis, 2nd ed.; Wiley: Hoboken, NJ, USA, 2007. [Google Scholar]
  42. Oscoz, J.; Escala, M.C.; Campos, F. La alimentación de la trucha común (Salmo trutta L., 1758) en un río de Navarra (N. España). Limnetica 2000, 18, 29–35. [Google Scholar]
  43. Oscoz, J.; Campos, F.; Escala, M.C. Alimentación del piscardo (Phoxinus phoxinus) en un río del norte de España. Ecología 2001, 15, 285–291. [Google Scholar]
  44. Oscoz, J.; Campos, F.; Escala, M.C. Alimentación del gobio (Gobio gobio (L., 1758)) en el río Larraun (Navarra, N. España). Limnetica 2003, 22, 77–83. [Google Scholar]
  45. Oscoz, J.; Campos, F.; Escala, M.C. Notas sobre la alimentación del lobo de río (Barbatula barbatula) en Navarra. Lucas Mallada 2004, 11, 305–312. [Google Scholar]
  46. Oscoz, J.; Leunda, P.M.; Campos, F.; Escala, M.C.; Miranda, R. Diet of 0+ brown trout (Salmo trutta L., 1758) from the river Erro (Navarra, north of Spain). Limnetica 2005, 24, 319–326. [Google Scholar]
  47. Oscoz, J.; Leunda, P.M.; Escala, M.C.; Miranda, R. Summer feeding relationships of the co-occurring hatchling brown trout Salmo trutta and Gobio lozanoi (Cyprinidae) in an Iberian river. Acta Zool. Sin. 2006, 54, 418–432. [Google Scholar]
  48. Oscoz, J.; Mellado, A.; Miranda, R. Red biológica del Ebro: Análisis de Macroinvertebrados en las Redes de Vigilancia, Control Operativo y Referencia (Report); Confederación Hidrográfica del Ebro: Zaragoza, Spain, 2007. [Google Scholar]
  49. Schoener, T.W. Nonsynchronous spatial overlap of lizards in patchy habitats. Ecology 1970, 51, 408–418. [Google Scholar] [CrossRef]
  50. Wallace, R.K. An assessment of diet-overlap indexes. Trans. Am. Fish. Soc. 1981, 110, 72–76. [Google Scholar] [CrossRef]
  51. Jackson, A.L.; Inger, R.; Parnell, A.C.; Bearhop, S. Comparing isotopic niche widths among and within communities: SIBER—Stable Isotope Bayesian Ellipses in R. J. Anim. Ecol. 2011, 80, 595–602. [Google Scholar] [CrossRef] [PubMed]
  52. R Core Team. R: A Language and Environment for Statistical Computing; R Foundation for Statistical Computing: Vienna, Austria, 2017; Available online: http://www.r-project.org (accessed on 1 October 2018).
  53. Light, T. Behavioral effects of invaders: Alien crayfish and native sculpin in a California stream. Biol. Invasions 2005, 7, 353–367. [Google Scholar] [CrossRef]
  54. Moore, P.A. Agonistic behavior in freshwater crayfish. In Evolutionary Ecology of Social and Sexual Systems; Duffy, J.E., Thiel, M., Eds.; Oxford University Press: Oxford, UK, 2007; pp. 90–114. [Google Scholar]
  55. Degerman, E.; Nilsson, P.A.; Nyström, P.; Nilsson, E.; Olsson, K. Are fish populations in temperate streams affected by crayfish?—A field survey and prospects. Environ. Biol. Fishes 2007, 78, 231–239. [Google Scholar] [CrossRef]
  56. Rahel, F.J.; Stein, R.A. Complex predator-prey interactions and predator intimidation among crayfish, piscivorous fish, and small benthic fish. Oecologia 1988, 75, 94–98. [Google Scholar] [CrossRef] [PubMed] [Green Version]
  57. Adams, C.E.; Mitchell, J. The response of a grey heron Ardea cinerea breeding colony to rapid change in prey species. Bird Study 1995, 42, 44–49. [Google Scholar] [CrossRef]
  58. Nilsson, E.; Persson, A. Do instream habitat variables and the abundance of brown trout Salmo trutta (L.) affect the distribution and growth of stone loach, Barbatula barbatula (L.)? Ecol. Freshw. Fish 2005, 14, 40–49. [Google Scholar] [CrossRef]
  59. Remonti, L.; Prigioni, C.; Balestrieri, A.; Sgrosso, S.; Priore, G. Eurasian otter (Lutra lutra) prey selection in response to a variation of fish abundance. Ital. J. Zool. 2010, 77, 331–338. [Google Scholar] [CrossRef]
  60. Doherty-Bone, T.M.; Dunn, A.M.; Liddell, C.; Brown, L.E. Transformation of detritus by a European native and two invasive alien freshwater decapods. Biol. Invasions 2018, 20, 1799–1808. [Google Scholar] [CrossRef] [Green Version]
  61. Mathers, K.L.; Rice, S.P.; Wood, P.J. Temporal variability in lotic macroinvertebrate communities associated with invasive signal crayfish (Pacifastacus leniusculus) activity levels and substrate character. Biol. Invasions 2018, 20, 567–582. [Google Scholar] [CrossRef]
  62. Gasith, A.; Resh, V.H. Streams in Mediterranean Climate Regions: Abiotic Influences and Biotic Responses to Predictable Seasonal Events. Annu. Rev. Ecol. Syst. 1999, 30, 51–81. [Google Scholar] [CrossRef]
  63. Kempf, A.; Dingsør, G.E.; Huse, G.; Vinther, M.; Floeter, J.; Temming, A. The importance of predator-prey overlap: Predicting North Sea cod recovery with a multispecies assessment model. ICES J. Mar. Sci. 2010, 67, 1989–1997. [Google Scholar] [CrossRef]
  64. Rosewarne, P.J.; Mortimer, R.J.G.; Newton, R.J.; Grocock, C.; Wing, C.D.; Dunn, A.M. Feeding behaviour, predatory functional responses and trophic interactions of the invasive Chinese mitten crab (Eriocheir sinensis) and signal crayfish (Pacifastacus leniusculus). Freshw. Biol. 2016, 61, 426–443. [Google Scholar] [CrossRef]
  65. Sakai, A.K.; Allendorf, F.W.; Holt, J.S.; Lodge, D.M.; Molofsky, J.; With, K.A.; Baughman, S.; Cabin, R.J.; Cohen, J.E.; Ellstrand, N.C.; et al. The Population Biology of Invasive Species. Annu. Rev. Ecol. Syst. 2001, 32, 305–332. [Google Scholar] [CrossRef]
  66. Bondar, C.A.; Bottriel, K.; Zeron, K.; Richardson, J.S. Does trophic position of the omnivorous signal crayfish (Pacifastacus leniusculus) in a stream food web vary with life history stage or density? Can. J. Fish. Aquat. Sci. 2005, 62, 2632–2639. [Google Scholar] [CrossRef]
  67. Zanden, M.J.V.; Casselman, J.M.; Rasmussen, J.B. Stable isotope evidence for the food web consequences of species invasions in lakes. Nature 1999, 401, 464–467. [Google Scholar] [CrossRef]
  68. Milardi, M.; Thomas, S.M.; Kahilainen, K.K. Reliance of brown trout on terrestrial prey varies with season but not fish density. Freshw. Biol. 2016, 61, 1143–1156. [Google Scholar] [CrossRef]
  69. Svanbäck, R.; Persson, L. Individual diet specialization, niche width and population dynamics: Implications for trophic polymorphisms. J. Anim. Ecol. 2004, 73, 973–982. [Google Scholar] [CrossRef]
  70. Vedia, I.; Galicia, D.; Baquero, E.; Oscoz, J.; Miranda, R. Environmental factors influencing the distribution and abundance of the introduced signal crayfish in the north of Iberian Peninsula. Mar. Freshw. Res. 2017, 68, 900–908. [Google Scholar] [CrossRef]
  71. Holt, R.D. On the Relation between Niche Overlap and Competition: The Effect of Incommensurable Niche Dimensions. Oikos 1987, 48, 110–114. [Google Scholar] [CrossRef]
  72. Crivelli, A.J. Cobitis calderoni. The IUCN Red List of Threatened Species 2006, e.T5027A11108148. Available online: http://dx.doi.org/10.2305/IUCN.UK.2006.RLTS.T5027A11108148.en (accessed on 7 January 2019).
  73. Fausch, K.D.; Torgersen, C.E.; Baxter, C.V.; Li, H.W. Landscapes to Riverscapes: Bridging the Gap between Research and Conservation of Stream Fishes. BioScience 2002, 52, 483–498. [Google Scholar] [CrossRef]
Figure 1. Distribution map of the n = 20 sampling sites for this study in Navarra region (northern Spain). Black circumferences show the n = 5 sites where behavioral interactions were recorded (see Methods section for the names of towns and rivers). Black circles show the n = 17 sites where crayfish and native fishes were sampled to evaluate their trophic overlap from both dietary and isotopic data (see Table 2 for the names of towns and rivers). Two sites (numbers 4 and 12) were used for the two approaches (i.e., behavioral interactions and trophic overlap), which are marked with both black circumferences and circles.
Water 11 00459 g001
Figure 2. Recording system showing the distribution of three video cameras adapted for night vision in the zenith position and six infrared lights connected to a battery. Dimensions of the structure are also showed.
Water 11 00459 g002
Figure 3. Percentages of encounter categories between native fishes and juvenile (a) or adult (b) signal crayfish Pacifastacus leniusculus. No interaction (white), fish dominance (gray), and fish evasion (black). n = number of encounters; Fish nd. = fish species not determined.
Water 11 00459 g003
Figure 4. Biplots of isotopic signatures δ13C and δ15N for signal crayfish Pacifastacus leniusculus and native fishes at four representative sampling sites (see Figure 1 and Table 2 for details). Corrected standard ellipse areas (SEAc) are showed per species. See Table 3 for overall means of SEAc and areas of overlap.
Water 11 00459 g004
Table 1. Diet composition of signal crayfish Pacifastacus leniusculus (PL), Pyrenean stone loach Barbatula quignardi (BQ), brown trout Salmo trutta (ST), Pyrenean gudgeon Gobio lozanoi (GL), and Pyrenean minnow Phoxinus bigerri (PB). Percentages of occurrences and abundances are presented. Trophic overlap values between signal crayfish and native fishes are presented by using the Schoener index.
Prey category% occurrence% abundance
PLBQSTGLPBPLBQSTGLPB
Turbellaria1<1
Nematoda397271<1
Oligochaeta8<1
Gastropoda48761<1<12
Hydracarina93543<1<1<1
Crustacea 112323935106646172
Crayfish18<1<1
Ephemeroptera 22764711523131026<15
Plecoptera 214132<1<1<1<1<1<1
Heteroptera adults1<1
Megaloptera larvae1<1
Trichoptera larvae295639484522615728
Diptera larvae3084249870537626651
Coleoptera larvae2422<1<1<1<1
Terrestrial Arthropoda 381622633511279
Fish2<1
Schoener Index 0.770.390.690.84
1 Cladocera, Copepoda, Ostracoda; 2 Nymphs and just emerged adults; 3 Adult winged insects (e.g., wasps and bees), ants, and spiders. – No data.
Table 2. Results on δ13C and δ15N for signal crayfish Pacifastacus leniusculus and native fishes. The numbers in parenthesis indicate the sampling sites represented in Figure 1. Significant differences (Mann–Whitney U test, p < 0.05) between signal crayfish and native fishes are marked with an asterisk (*) within each site. Results are means ± SD.
TownRiverSpeciesnδ13Cδ15N
Zuñiga (1)EgaP. leniusculus5−28.9 ± 0.39.9 ± 0.6
P. bigerri5−29.7 ± 0.3 *10.5 ± 0.5 *
S. trutta5−29.7 ± 0.711.5 ± 0.7 *
G. lozanoi5−28.9 ± 0.711.1 ± 0.2 *
Artavia (2)UrederraP. leniusculus5−32.6 ± 0.46.9 ± 0.7
P. bigerri5−33.2 ± 0.3 *7.3 ± 0.2
S. trutta5−33.4 ± 0.77.6 ± 0.7
B. quignardi5−33.0 ± 0.37.5 ± 0.3
Ziordia (3)EgaP. leniusculus5−27.5 ± 0.29.0 ± 1.1
P. bigerri5−27.7 ± 0.710.5 ± 0.8 *
S. trutta5−27.6 ± 0.611.5 ± 1.4 *
B. quignardi5−28.1 ± 1.012.2 ± 0.4 *
Lizarragabengoa (4)LizarrustiP. leniusculus5−26.6 ± 0.33.4 ± 1.0
P. bigerri5−27.4 ± 0.86.0 ± 1.4 *
S. trutta5−29.2 ± 0.7 *5.4 ± 0.5 *
Udabe (5)BasaburuaP. leniusculus5−26.6 ± 0.57.5 ± 0.5
P. bigerri5−27.9 ± 0.7 *8.7 ± 0.5 *
S. trutta5−27.9 ± 0.6 *8.8 ± 0.5 *
Latasa (6)LarraunP. leniusculus5−26.0 ± 0.19.8 ± 0.5
P. bigerri5−26.2 ± 0.610.8 ± 0.4 *
G. lozanoi5−25.6 ± 0.510.4 ± 0.1
S. trutta5−26.3 ± 0.510.6 ± 0.2 *
P. miegii5−24.8 ± 0.5 *9.4 ± 0.1
Oskia (7)ArakilP. leniusculus5−26.8 ± 0.312.0 ± 0.7
P. bigerri5−28.2 ± 0.9 *13.9 ± 0.7 *
P. miegii5−26.7 ± 1.113.2 ± 0.3 *
Iraizoz (8)UlzamaP. leniusculus5−24.0 ± 0.38.0 ± 0.4
P. bigerri5−24.0 ± 0.610.4 ± 0.4 *
S. trutta5−23.7 ± 0.510.4 ± 0.7 *
Latasa (9)UlzamaP. leniusculus5−25.0 ± 0.110.6 ± 0.5
P. bigerri5−25.2 ± 0.413.8 ± 1.6 *
S. trutta5−25.7 ± 0.3 *10.7 ± 1.0
Urtasun (11)ArgaP. leniusculus5−27.8 ± 0.47.1 ± 1.0
P. bigerri5−23.9 ± 0.3 *8.1 ± 0.3
S. trutta5−24.8 ± 1.7 *7.5 ± 0.2
Idoi (12)ArgaP. leniusculus5−25.2 ± 0.38.9 ± 0.6
P. bigerri5−25.9 ± 0.69.8 ± 0.3 *
G. lozanoi5−24.7 ± 0.59.8 ± 0.4
B. quignardi5−23.5 ± 0.5 *10.4 ± 0.1 *
Espinal (14)UrrobiP. leniusculus5−25.7 ± 0.39.7 ± 0.5
P. bigerri5−25.3 ± 1.212.3 ± 0.6 *
S. trutta5−25.5 ± 1.510.3 ± 1.3
Uriz (15)UrrobiP. leniusculus5−25.2 ± 0.66.9 ± 0.4
P. bigerri5−23.8 ± 1.1 *10.3 ± 0.7 *
Aribe (16)IratiP. leniusculus5−25.6 ± 0.35.6 ± 0.5
P. bigerri5−25.3 ± 1.06.8 ± 0.3 *
S. trutta5−27.4 ± 1.3 * 6.3 ± 0.5
B. quignardi5−26.5 ± 0.5 *6.5 ± 0.4 *
Ezcaroz (18)SalazarP. leniusculus5−25.8 ± 0.28.5 ± 0.4
P. bigerri5−26.5 ± 0.710.8 ± 0.3 *
S. trutta5−26.9 ± 0.7 *10.8 ± 1.0 *
Guesa (19)SalazarP. leniusculus5−26.3 ± 0.79.0 ± 0.8
P. bigerri5−27.5 ± 0.710.2 ± 0.5 *
G. lozanoi5−25.9 ± 0.810.7 ± 0.4 *
Aspurz (20)SalazarP. leniusculus5−28.4 ± 1.08.2 ± 0.8
P. bigerri5−28.3 ± 0.59.4 ± 0.4 *
G. lozanoi5−27.3 ± 0.59.6 ± 0.4 *
Table 3. Corrected standard ellipse areas (SEAc) for each species and areas of overlap between signal crayfish Pacifastacus leniusculus and native fishes. Results are overall means ± SD.
SpeciesSEAc (‰2)Area of Overlap (‰2)
P. leniusculus0.80 ± 0.49
B. quignardi0.68 ± 0.55(2.7 ± 5.4) × 10−4
G. lozanoi0.62 ± 0.25(1.3 ± 2.6) × 10−2
P. bigerri1.05 ± 0.67(2.8 ± 3.2) × 1018
P. miegii0.55 ± 0.65(4.8 ± 6.7) × 1018
S. trutta2.01 ± 2.000.1 ± 0.2

