Use of Drones for the Topo-Bathymetric Monitoring of the Reservoirs of the Segura River Basin
by
 , , ,
, , ,
Manuel Erena
1,* ,
,
Joaquín F. Atenza
1 ,
,
Sandra García-Galiano
2,
José A. Domínguez
3 and
José M. Bernabé
4 1
GIS and Remote Sensing, Instituto Murciano de Investigación y Desarrollo Agrario y Alimentario (IMIDA), C/ Mayor s/n, La Alberca, 30150 Murcia, Spain
2
Department of Mining and Civil Engineering, Universidad Politécnica de Cartagena, 30202 Murcia, Spain
3
Crop Research Institute, (VURV), 161 06 Prague, Czech Republic
4
Hydrological Planning Office, SRB. Plaza Fontes, 30001 Murcia, Spain
*
Author to whom correspondence should be addressed.
Water 2019, 11(3), 445; https://doi.org/10.3390/w11030445
Submission received: 27 December 2018
/
Revised: 20 February 2019
/
Accepted: 24 February 2019
/
Published: 2 March 2019
(This article belongs to the Special Issue Water Management Using Drones and Satellites in Agriculture)
Abstract
:The Segura River Basin (SRB), located in the South East of Spain, has the lowest percentage of renewable water resources of all the Spanish basins. Therefore, knowledge of the annual rate of water reservoir sedimentation is an important issue to be resolved in one of the most water-stressed regions in the western Mediterranean basin. This paper describes the sensors developed in collaboration with technology-based enterprises (aerial drone, floating drone, and underwater drone), and the methodology for integration of the different types of data acquired to monitor the reservoirs of the SRB. The proposed solution was applied to 21 reservoirs of the SRB. The proposed methodology is based on the use of unmanned aerial vehicles (UAV) for photogrammetry of the reservoir surface area. For each reservoir, two flights were completed, with 20 cm and 5 cm resolution, respectively. Then, a triangular irregular network mesh was generated by GIS techniques. Surface water vehicles (USV) and underwater remote-operated vehicles (ROV) were used to undertake bathymetric surveys. In addition, water quality measurements were made with an ROV device. The main results consist of topographic and bathymetric measurements for each reservoir, obtained by using equipment based on OpenSource technology. According to the results, the annual rate of storage capacity loss of water resources in the SRB´s reservoirs is 0.33%.
1. Introduction
The reservoirs in Spain began to be built in the time of the Romans, although most were of small size. During 19th century in Spain, relevant hydraulic infrastructures were built and changing of the water management with new institutions, such as the Isabel II Channel. However, it was in the middle of the 20th century that the boom in the construction of the Spanish reservoirs began. At present, there are more than 1200 reservoirs in Spain, with a capacity of 5.6 × 10⁹ m3. Many of them already have a certain age (more than 400 were built prior to 1960); therefore, important efforts are necessary to update their bathymetry.
Bathymetry is the measurement of water depth: the distance from bottom to water surface (sounding). Sounding line consists of taking points with heavy weights and building the isobars; this methodology was used for over than 2000 years, until the first half of the 20th century. The technological advances allowed for the development of an echo-sounder or fathometer, an instrument based on the reflection of sound signals [1]. Sound Navigation and Ranging is a method to improve the precision of the echo-sounder. In the second half of the 20th century, many types of acoustic instruments were developed, including: GLORIA (Geological Long-range Inclined Acoustical instrument), Sea MARC (Sea Mapping and Remote Characterization), and Multi-beam echo sounder. They were installed behind ships to provide very detailed bathymetric strip maps [2]. Vertical Beam Echo-sounding (VBES) is an improved multi-beam echo sounder, because its coverage is better than that of lead-lines [3]. The studies developed in the last decades of the 20th century have allowed for the development of new technology in the 21st century, where interferometry sonar is used, as well as airborne laser scanning technology to address both inland and coastal waters in a single approach [4] and multispectral data [5].
During the second half of the 20th century, the Public Affairs and Experimentation Center (CEDEX, Centro de Estudios y Experimentación de Obras Públicas), belonging to the Public Affairs Ministry of Spain, was responsible for updating the information on reservoirs (including the bathymetry). However, during the last decade of the 20th century, these studies were stopped and the works were not concluded. More recently, the Spanish water agencies demanded solutions to the absence of these datasets, through the use of more modern and cheaper methodologies. In recent decades, the use of remote sensing was not possible because all the reservoirs present a large depletion zone. Nevertheless, the emergence of cutting-edge technologies, such as sensorized drones, has facilitated their application for the study and determination of depth in water bodies (e.g., reservoirs).
The sedimentation processes in water reservoirs are a challenging worldwide problem, with a great impact on their storage capacity and therefore on their flooding lamination ability. Every reservoir loses storage to sedimentation, although the rate at which this happens varies widely; despite the decades of research, sedimentation is still probably the most serious technical problem faced by the water supply industry [6].
According to the CEDEX center, the average loss of reservoir capacity in Spain due to sedimentation is around 0.5% per year. Soil erosion and torrential rainfall favor the transport of large amounts of sediment in the Mediterranean river basins, especially in the Segura River Basin (SRB), increasing the clogging of their reservoirs. In addition, Spain is one of the European countries with higher numbers of environmental problems related to water scarcity and droughts [7]. The SRB, located in the South East of Spain, has the lowest percentage of renewable water resources of all the Spanish basins. The water exploitation index (237.2%) of the SRB, estimated from the mean annual runoff and mean annual total demand, is the highest of all the Spanish basins [8]. Therefore, the SRB is considered one of the most water-stressed regions in the western Mediterranean basin [9]. These environmental problems are exacerbated by climate change impacts in the head basins of the SRB. Climate change has generated an intensification of the hydrological cycle in the last few decades, through increases in the length and severity of droughts in the head basins of the SRB [10].
New technologies, such as unmanned aerial vehicles (UAV), surface water vehicles (USV), and underwater remote-operated vehicles (ROV), are being considered as new allies to increase our knowledge on the characteristics of basins and water bodies. The UAV, USV, and ROV technologies are becoming increasingly popular for research applications, with drones being developed for water sampling [11], measurement of the water level in water bodies [12], and water resource management [13]. The coupling of sonar technology with a USV platform has several advantages over traditional sludge measurement techniques (e.g., light meters/infrared meters, which include an emitter and detector at the end of a length of rope [14]), such as: (i) it requires less manual labor; (ii) it reduces the safety risks; (iii) it reduces the operating costs in bathymetric and photogrammetric work; (iv) it reduces the subjectivity of measurements; and (v) it increases the measuring efficiency.
Therefore, the main objective of the present work is to produce updated capacity curves for the reservoirs of the SRB, and from them calculate the volumes of sedimented materials, using cutting-edge technologies such as sensorized drones based on OpenSource technology. To this end, the Instituto Murciano de Investigaciones y Desarrollo Agrario y Alimentario (IMIDA) has collaborated with five technology-based enterprises (Inntelia Soluciones Tecnológicas S.L., Droning, Habitat, Dronica, and Nido Robotics S.L.) in the development of three types of unmanned vehicle based on the open source autopilot ArduPilot [15,16], capable of controlling UAV [17,18], USV [19], and ROV [20]. This type of technology can also be used to measure the physical and chemical parameters of water bodies—such as the dissolved oxygen (DO), electrical conductivity (EC), oxidation-reduction potential (ORP), relative amounts of free hydrogen and hydroxyl ions in logarithmic units (pH), and the temperature of the water [11,21]—or can be installed in an airborne sensor platform [22,23].
2. Materials and Methods
2.1. Case Study Site
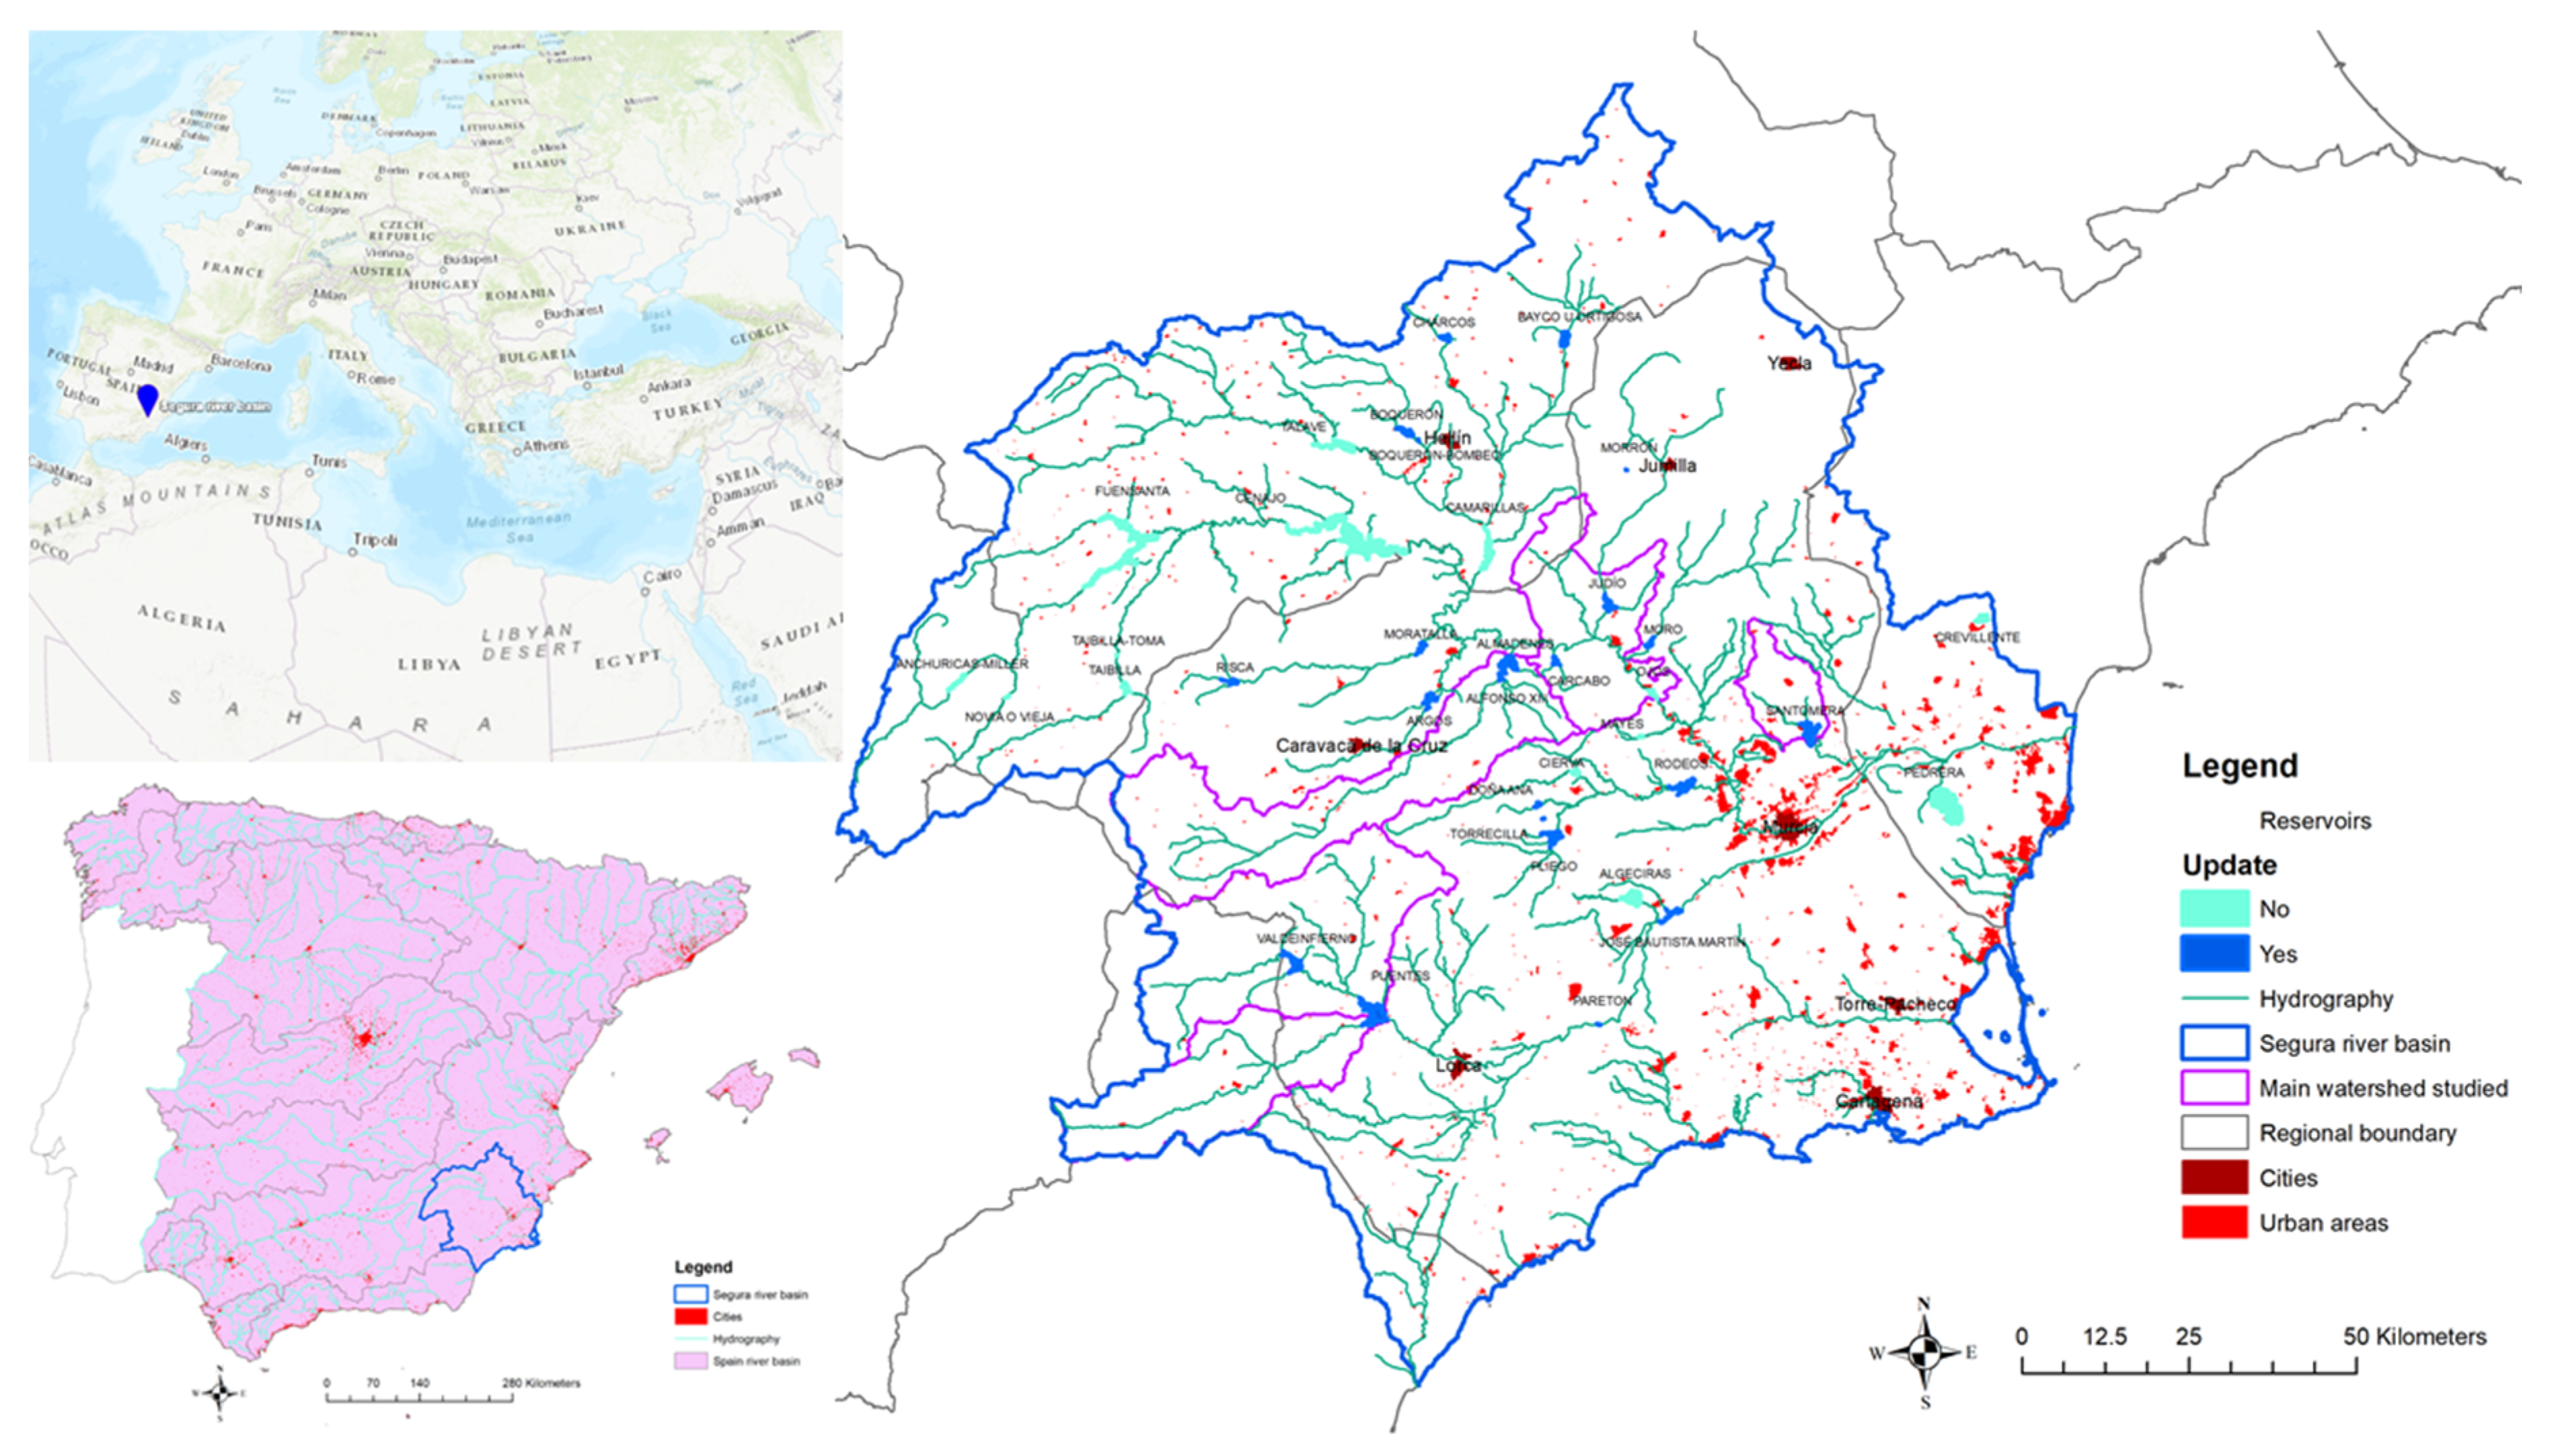
The SRB (Figure 1) has an area of 19,025 km2 and a population of 1,948,453 inhabitants (in 2017). It is characterized by a strongly negative atmospheric water balance (average precipitation below 300 mm year−1, potential evaporation above 1200 mm year−1), limited groundwater resources, shallow soils, and recurrent droughts, leading to a highly vulnerable natural water resources system. The 36 reservoirs of the SRB currently have a regulation capacity of 1.141 × 10⁹ m3 and occupy 7334 ha. The estimated total water demand in the SRB for 2015 [24] was 1.726 × 10⁹ m3, agricultural activity accounting for 86.15%, followed by urban demand (10.95%), environmental uses (1.74%), services (0.64%), and industry (0.52%).
The Table 1 presents some characteristics of the reservoirs (primary use, area, first year of operation, and reservoir volume in 106 m3) of the SRB.
The Table 2 presents some characteristics of the selected basins (area and maximum altitude above sea level) and reservoirs (coronation height and reservoir surface area) of the SRB. The criteria used to select the study reservoirs were mainly based on their ages (Alfonso XIII was built in 1916, and Valdeinfierno in 1806), but also considered the needs of the water agency; for instance, when there is not a valid bathymetry because the reservoir is very recent (e.g., Cárcabo and Puentes).
2.2. Unmanned Aerial Vehicle (UAV) for Photogrammetry
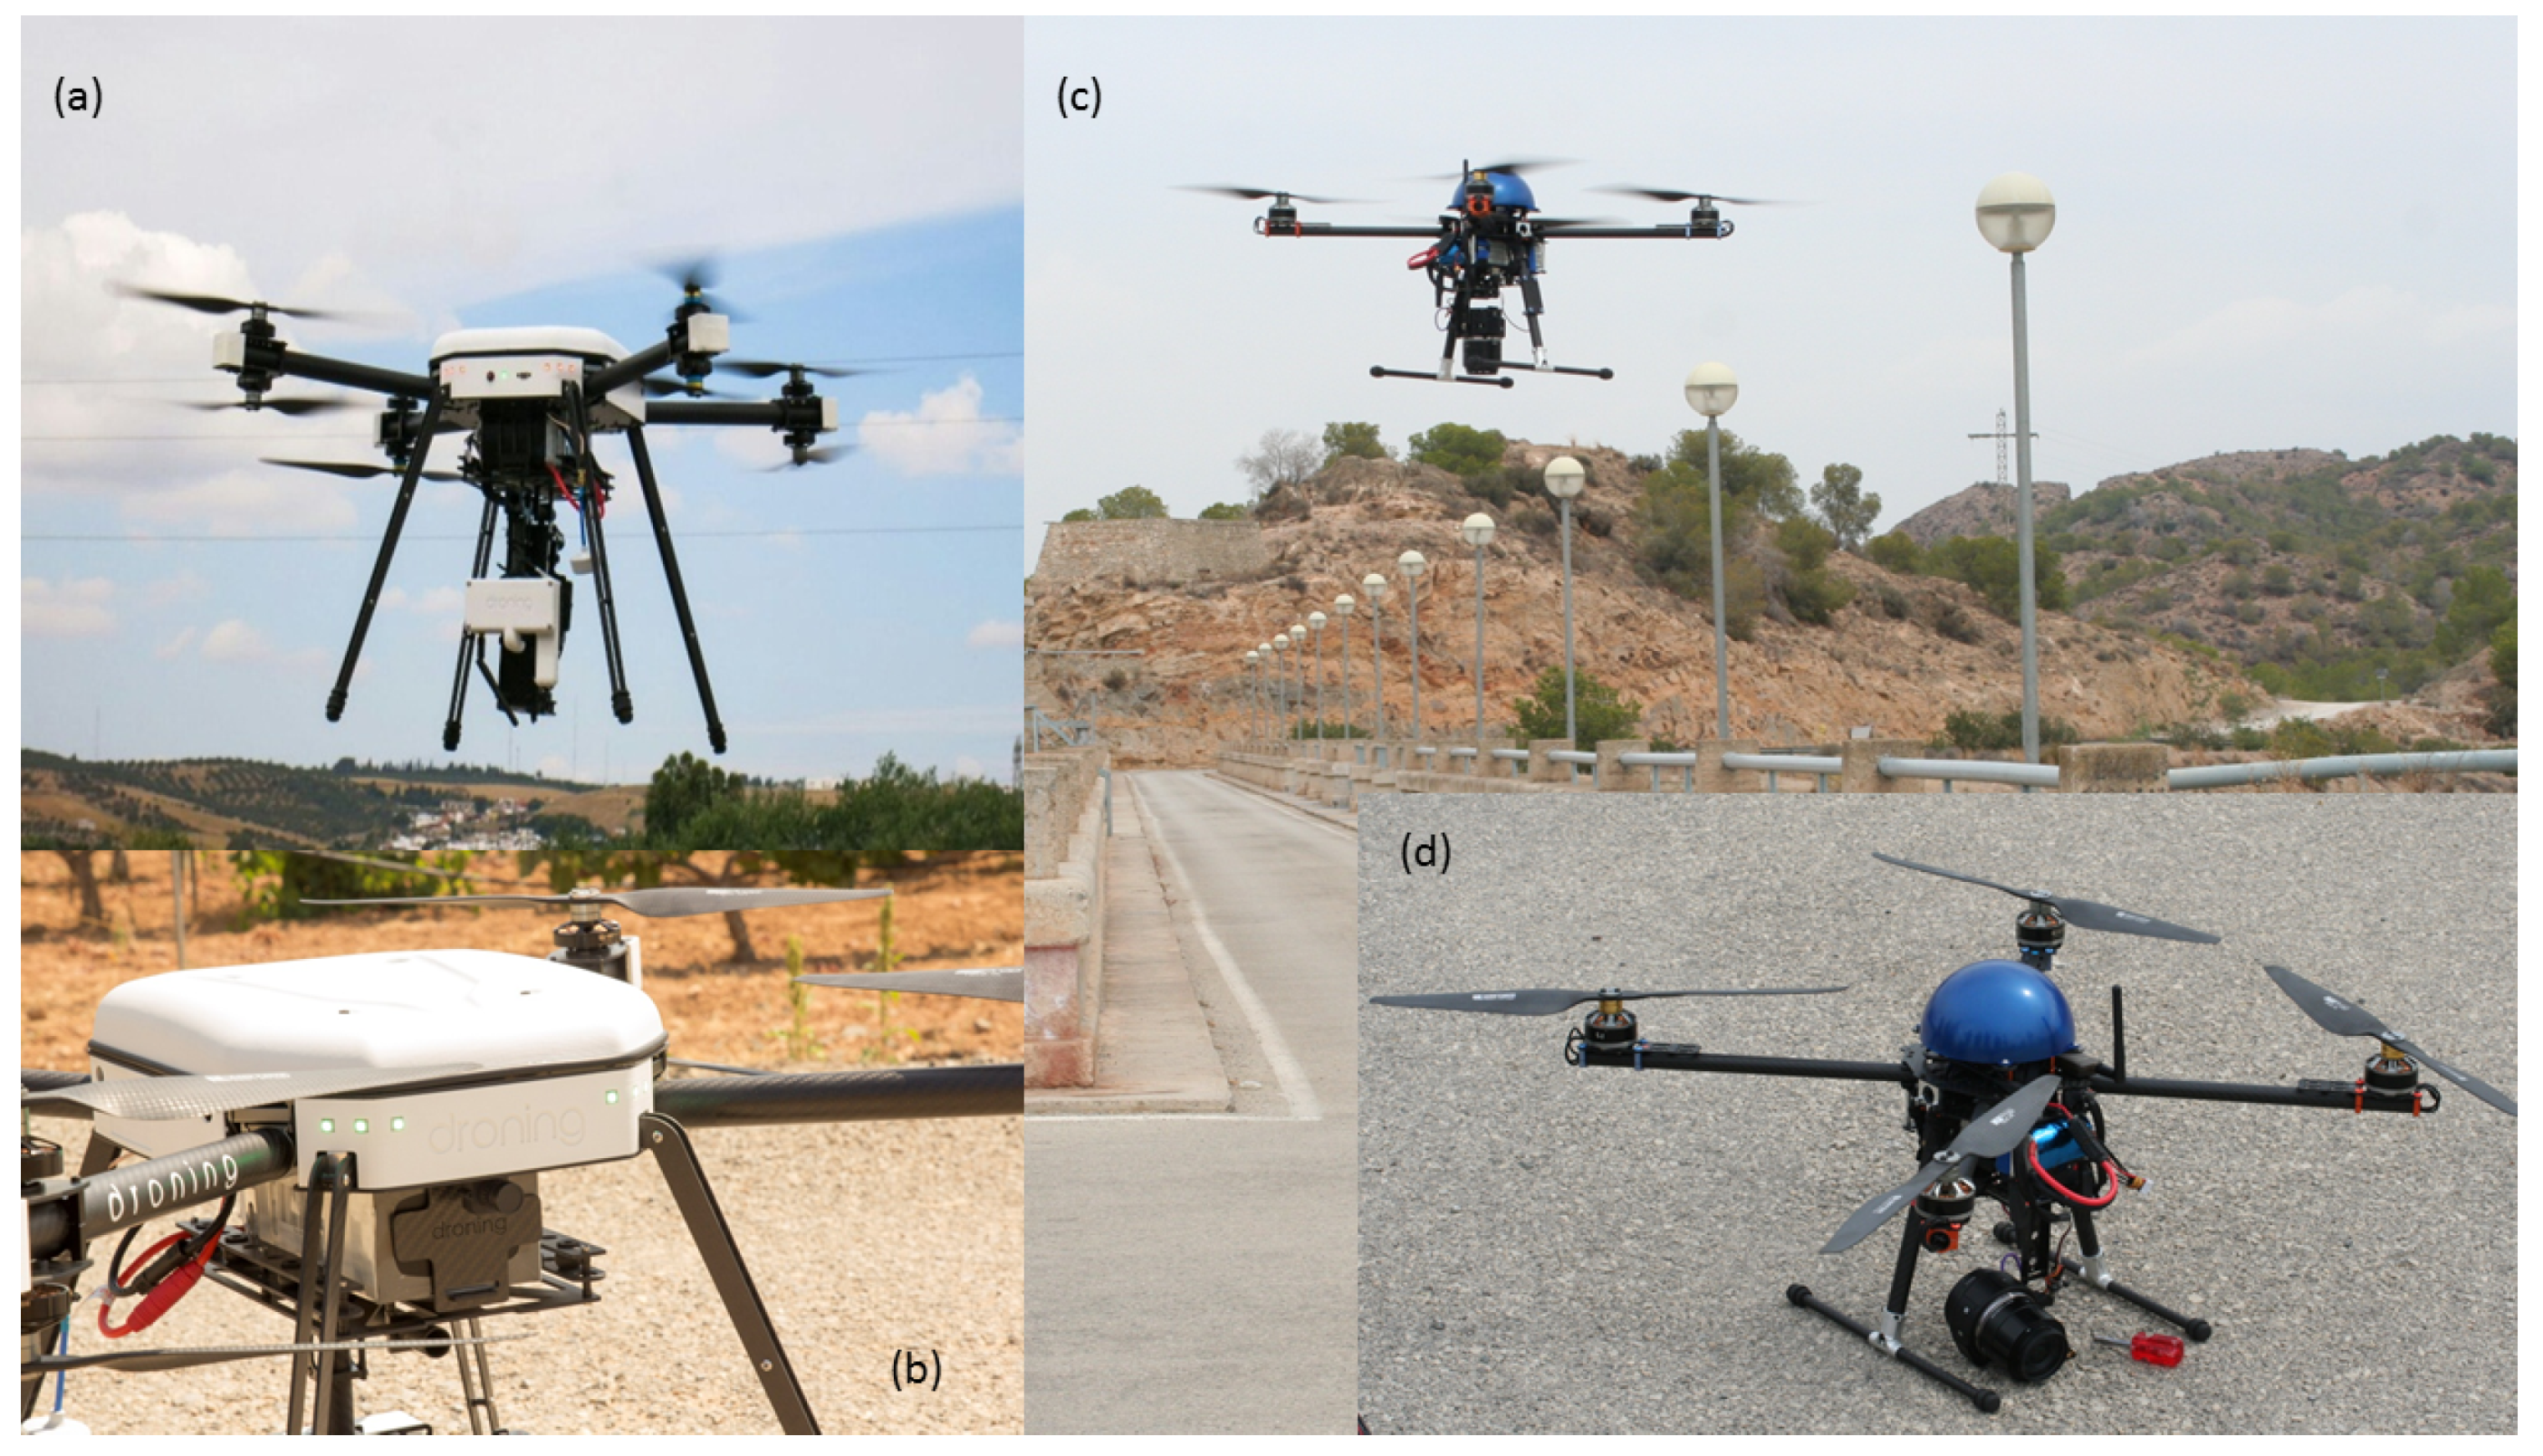
For the analysis of the surface area, a Sony QX1 photogrammetric camera controlled by an Autopilot in a Droning D-650 and D-820 multirotor drone (Figure 2) was chosen. It was developed by Droning (Droning, Seville, Spain). To obtain a high-resolution photogrammetric flight, the camera was installed on a Cessna 150 aerobat aircraft (flying at 200 m above ground level for a resolution of 20 cm), then a digital model of the surfaces was developed with high precision. The main components of the UAV were a frame, motors, propellers, electronic speed controllers, a flight controller (Pixhawk, 3DR Robotics, Berkeley, CA, USA), a Global Positioning System (GPS) receiver (Ublox, Zurich, Switzerland), a telemetry radio transmitter (3DR Robotics, Berkeley, CA, USA), and a power supply (Tattu, Dublin, CA, USA). Mission Planner software was used to specify the flight boundary, waypoints, and autonomous navigation details, and to configure integrated sensors/actuators. The Sony QX1 camera acquires 20.1-megapixel images (red, R; Green, G; and Blue, B, bands) with 8-bit radiometric resolution and is equipped with a 16–50 mm zoom lens. Table 3 presents the specifications of the UAV components.
For inclusion in the photogrammetric process, the collected images were assessed for their quality and spatial coverage. Blurred and distorted frames were excluded from the generation of the standard geomatic products (i.e., orthoimage, digital terrain model (DTM), and point cloud) via Photoscan Pro version 1.1.6 (Agisoft LC, St. Petersburg, Russia) or Drone2Map for ArcGiS version 1.3.2 (ESRI, Redlands, CA, USA).
The photogrammetric process requires all the frames to be georeferenced (i.e., scaled, translated, and rotated) into a target Geodetic System (i.e., the World Geodetic System, WGS84), using the ground control points (GCPs) coordinates to minimize geometric distortion. The co-registration errors in X, Y, and Z were automatically derived by Photoscan Agisoft (Agisoft LC, St., Petersburg, Russia) as the difference between the positions of the GCP centroids measured through Real Time Kinematic (RTK) GPS and the coordinates derived from the imagery. The coordinates of the GCPs were acquired through a traditional technique by means of a Leica-Geosystems Station TPS1200 (Leica Geosystems AG, Hauptsitz, Heerbrugg, Switzerland).
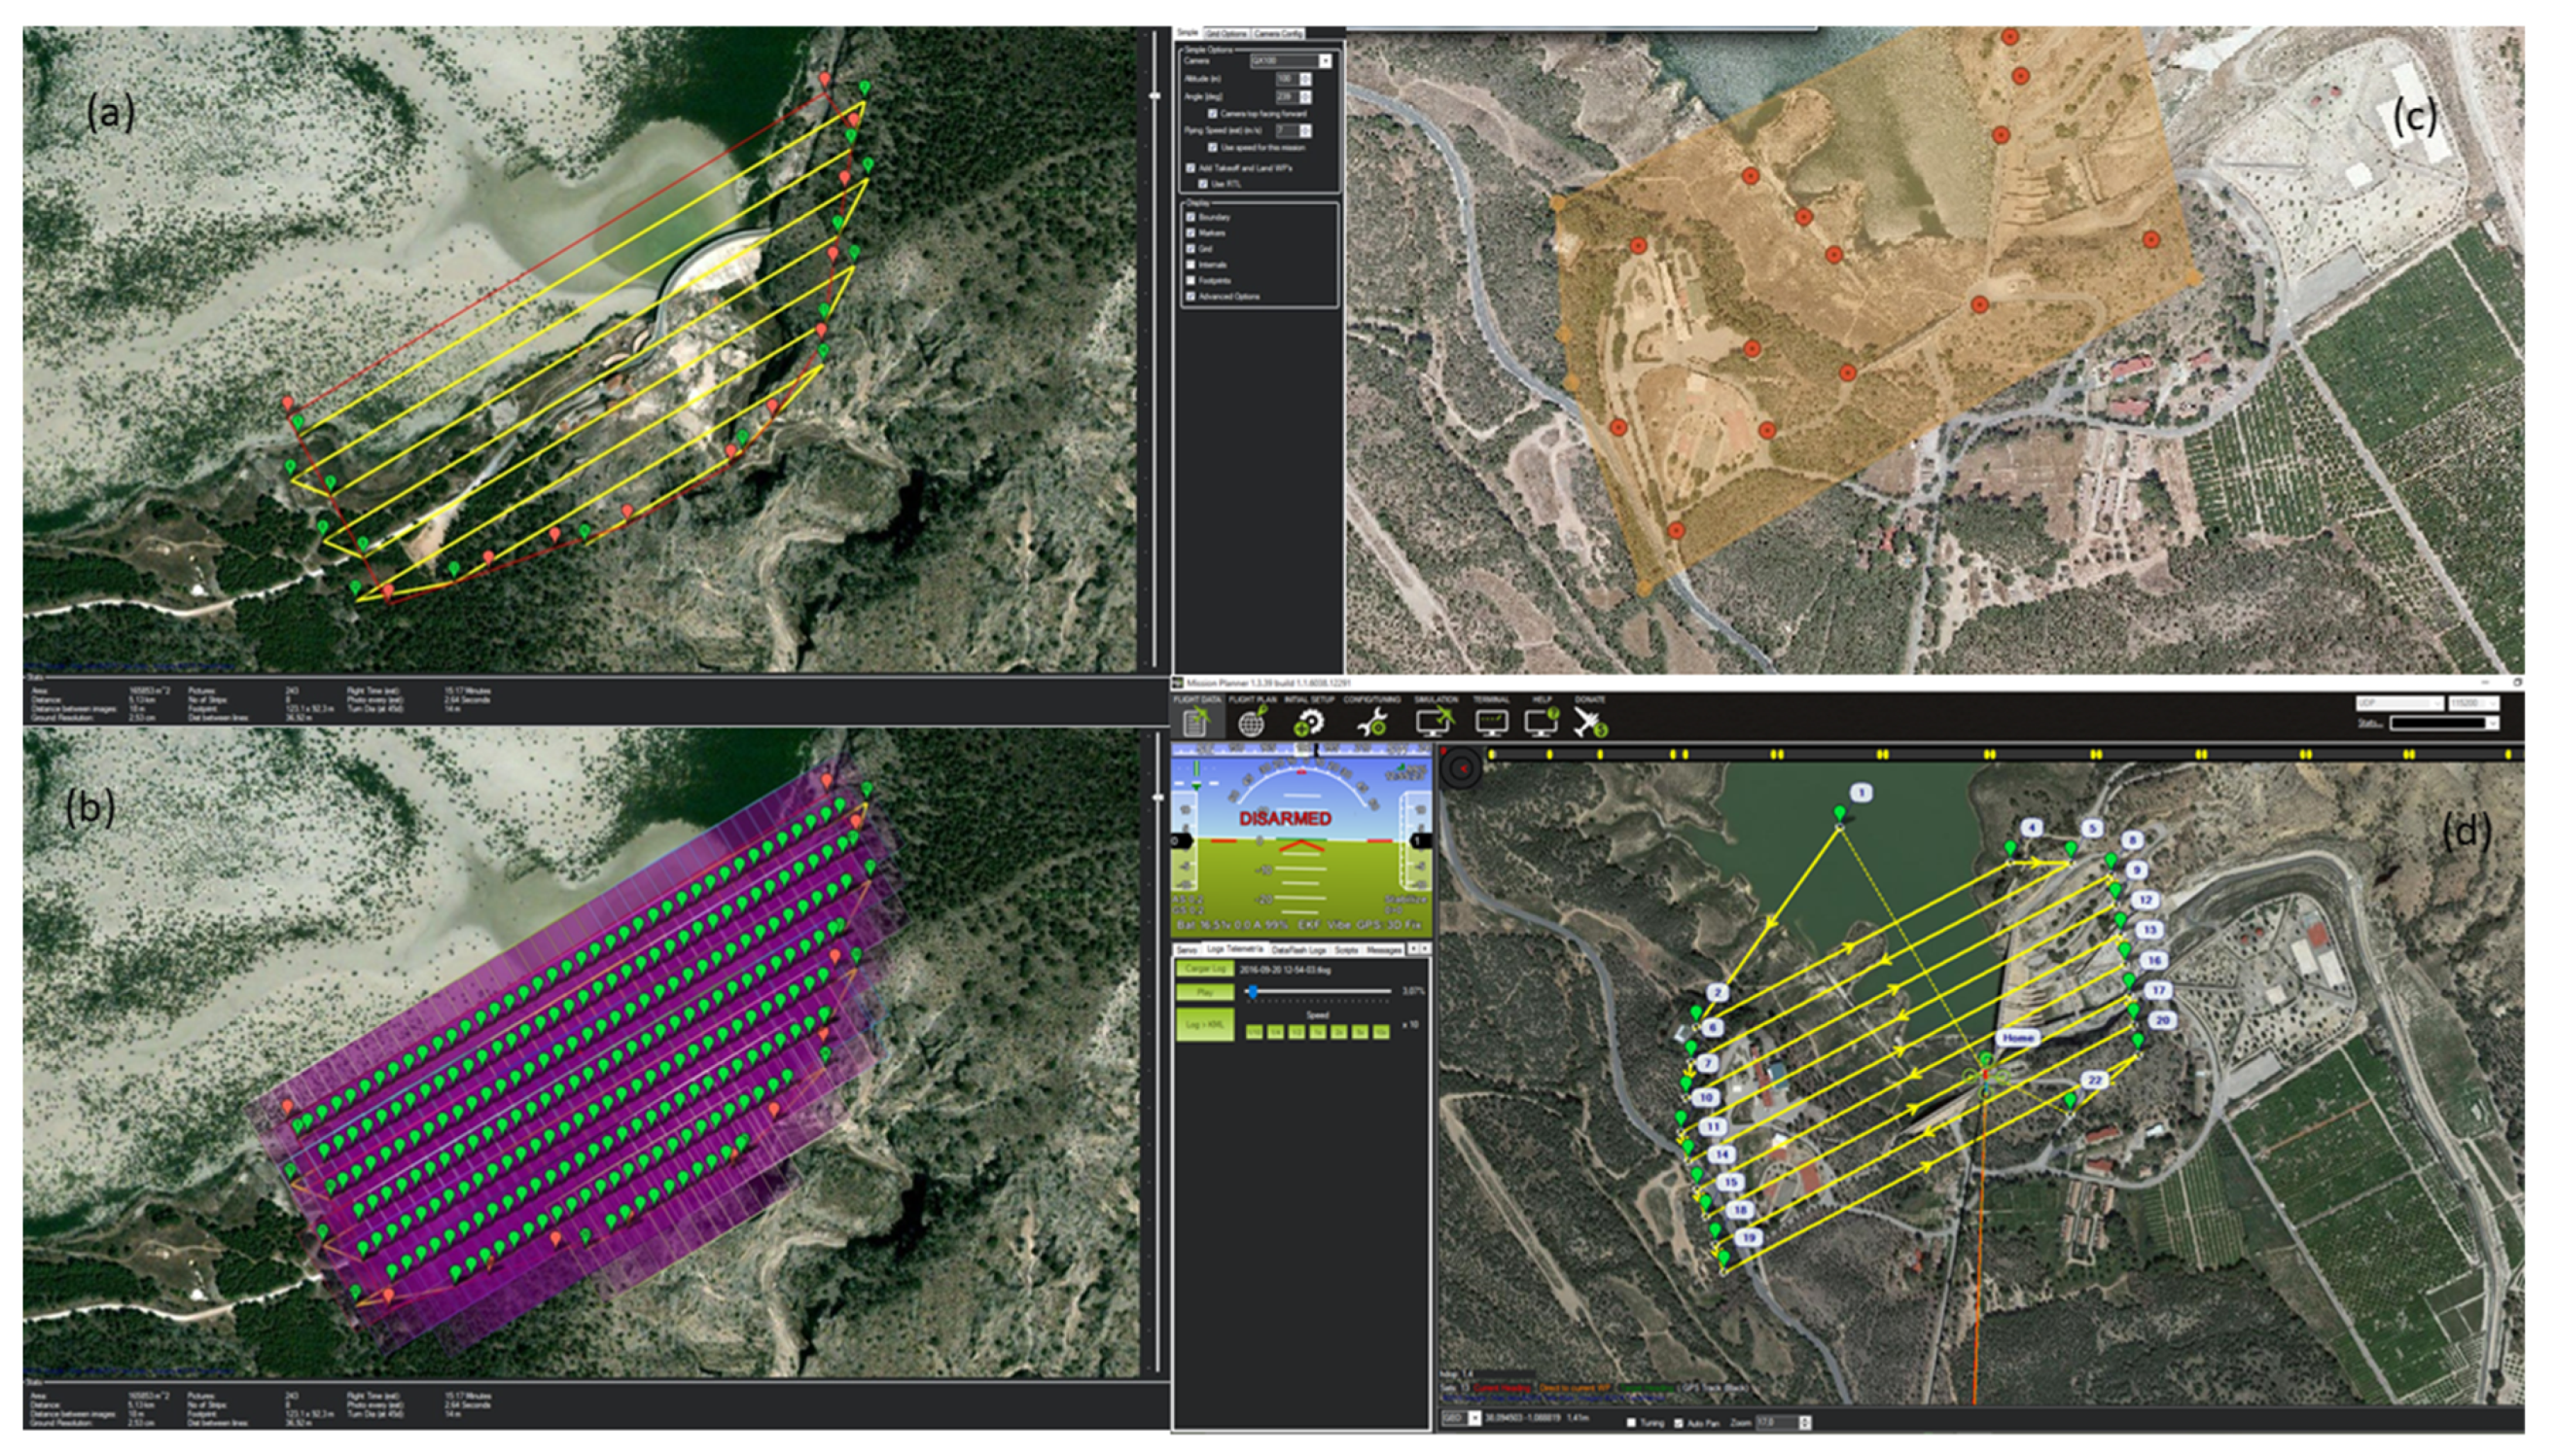
For each reservoir, two flights were made, with 20 and 5 cm resolution, respectively. Figure 3 presents the methodology used to define the waypoints for Santomera reservoir, considering the two different resolutions.
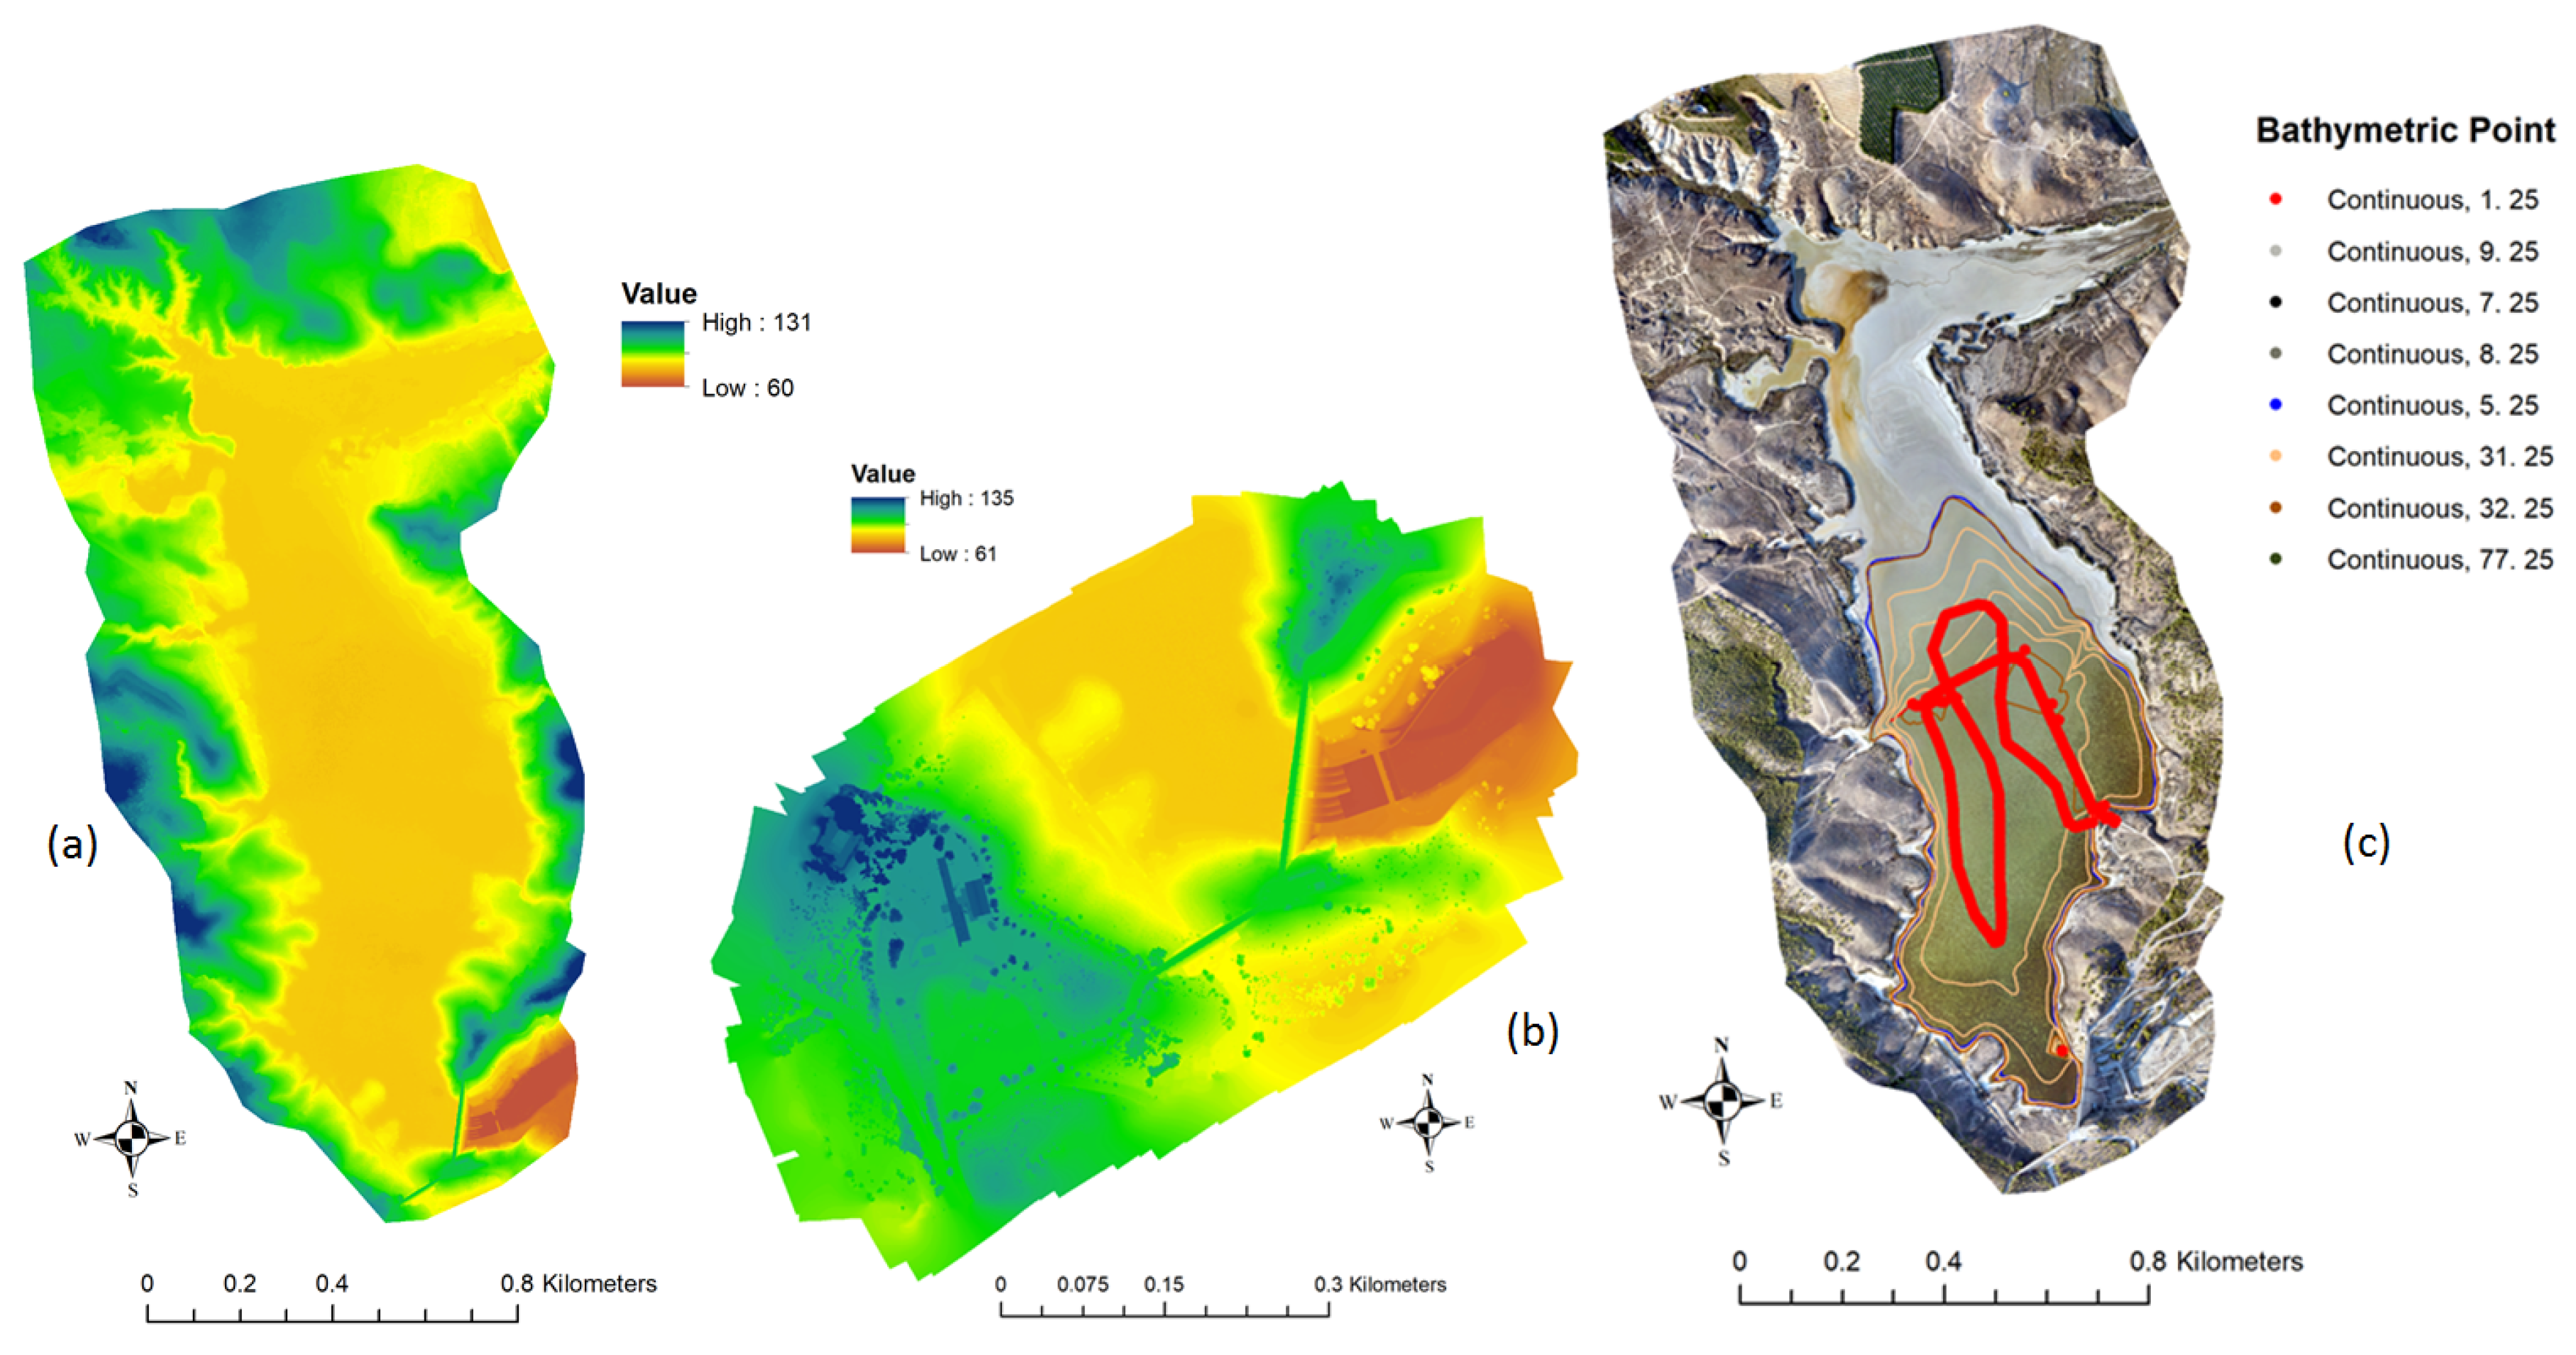
The digital terrain model (DTM) was derived by triangulation from the spatial resolutions of 20 cm and 5 cm (Figure 4). Considering the closest vertex of the National Geodetic Network to each reservoir, supporting points were taken with bi-frequency GPS. The images were obtained with an overlap of over 70% [27] and were processed with Agisoft PhotoScan photogrammetric software. Subsequently, the point cloud with known X, Y, Z coordinates was calculated in the official terrestrial space reference system (ETRS89) and in the official vertical spatial reference system in Spain (EVRS89) based on the Earth Gravitational Model (EGM2008) by the National Geospatial-Intelligence Agency (NGA) EGM Development Team [28]. Subsequently, a Triangular Irregular Network (TIN) mesh was generated using ArcGiS 10.5 (ESRI, Redlands, CA, USA) and this was used to calculate the volume of the reservoir [29].
2.3. Surface Water Vehicles (USV) for Bathymetric Surveys
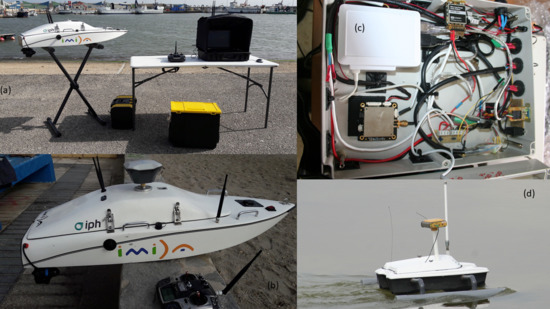
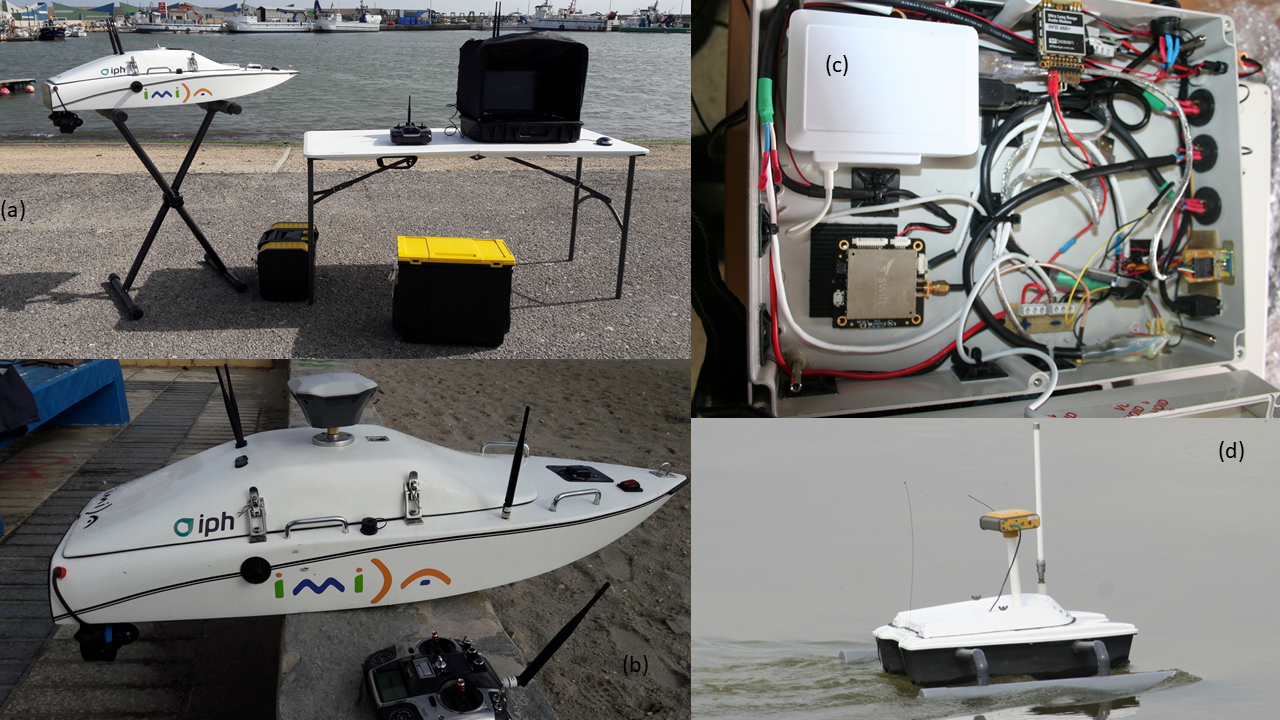
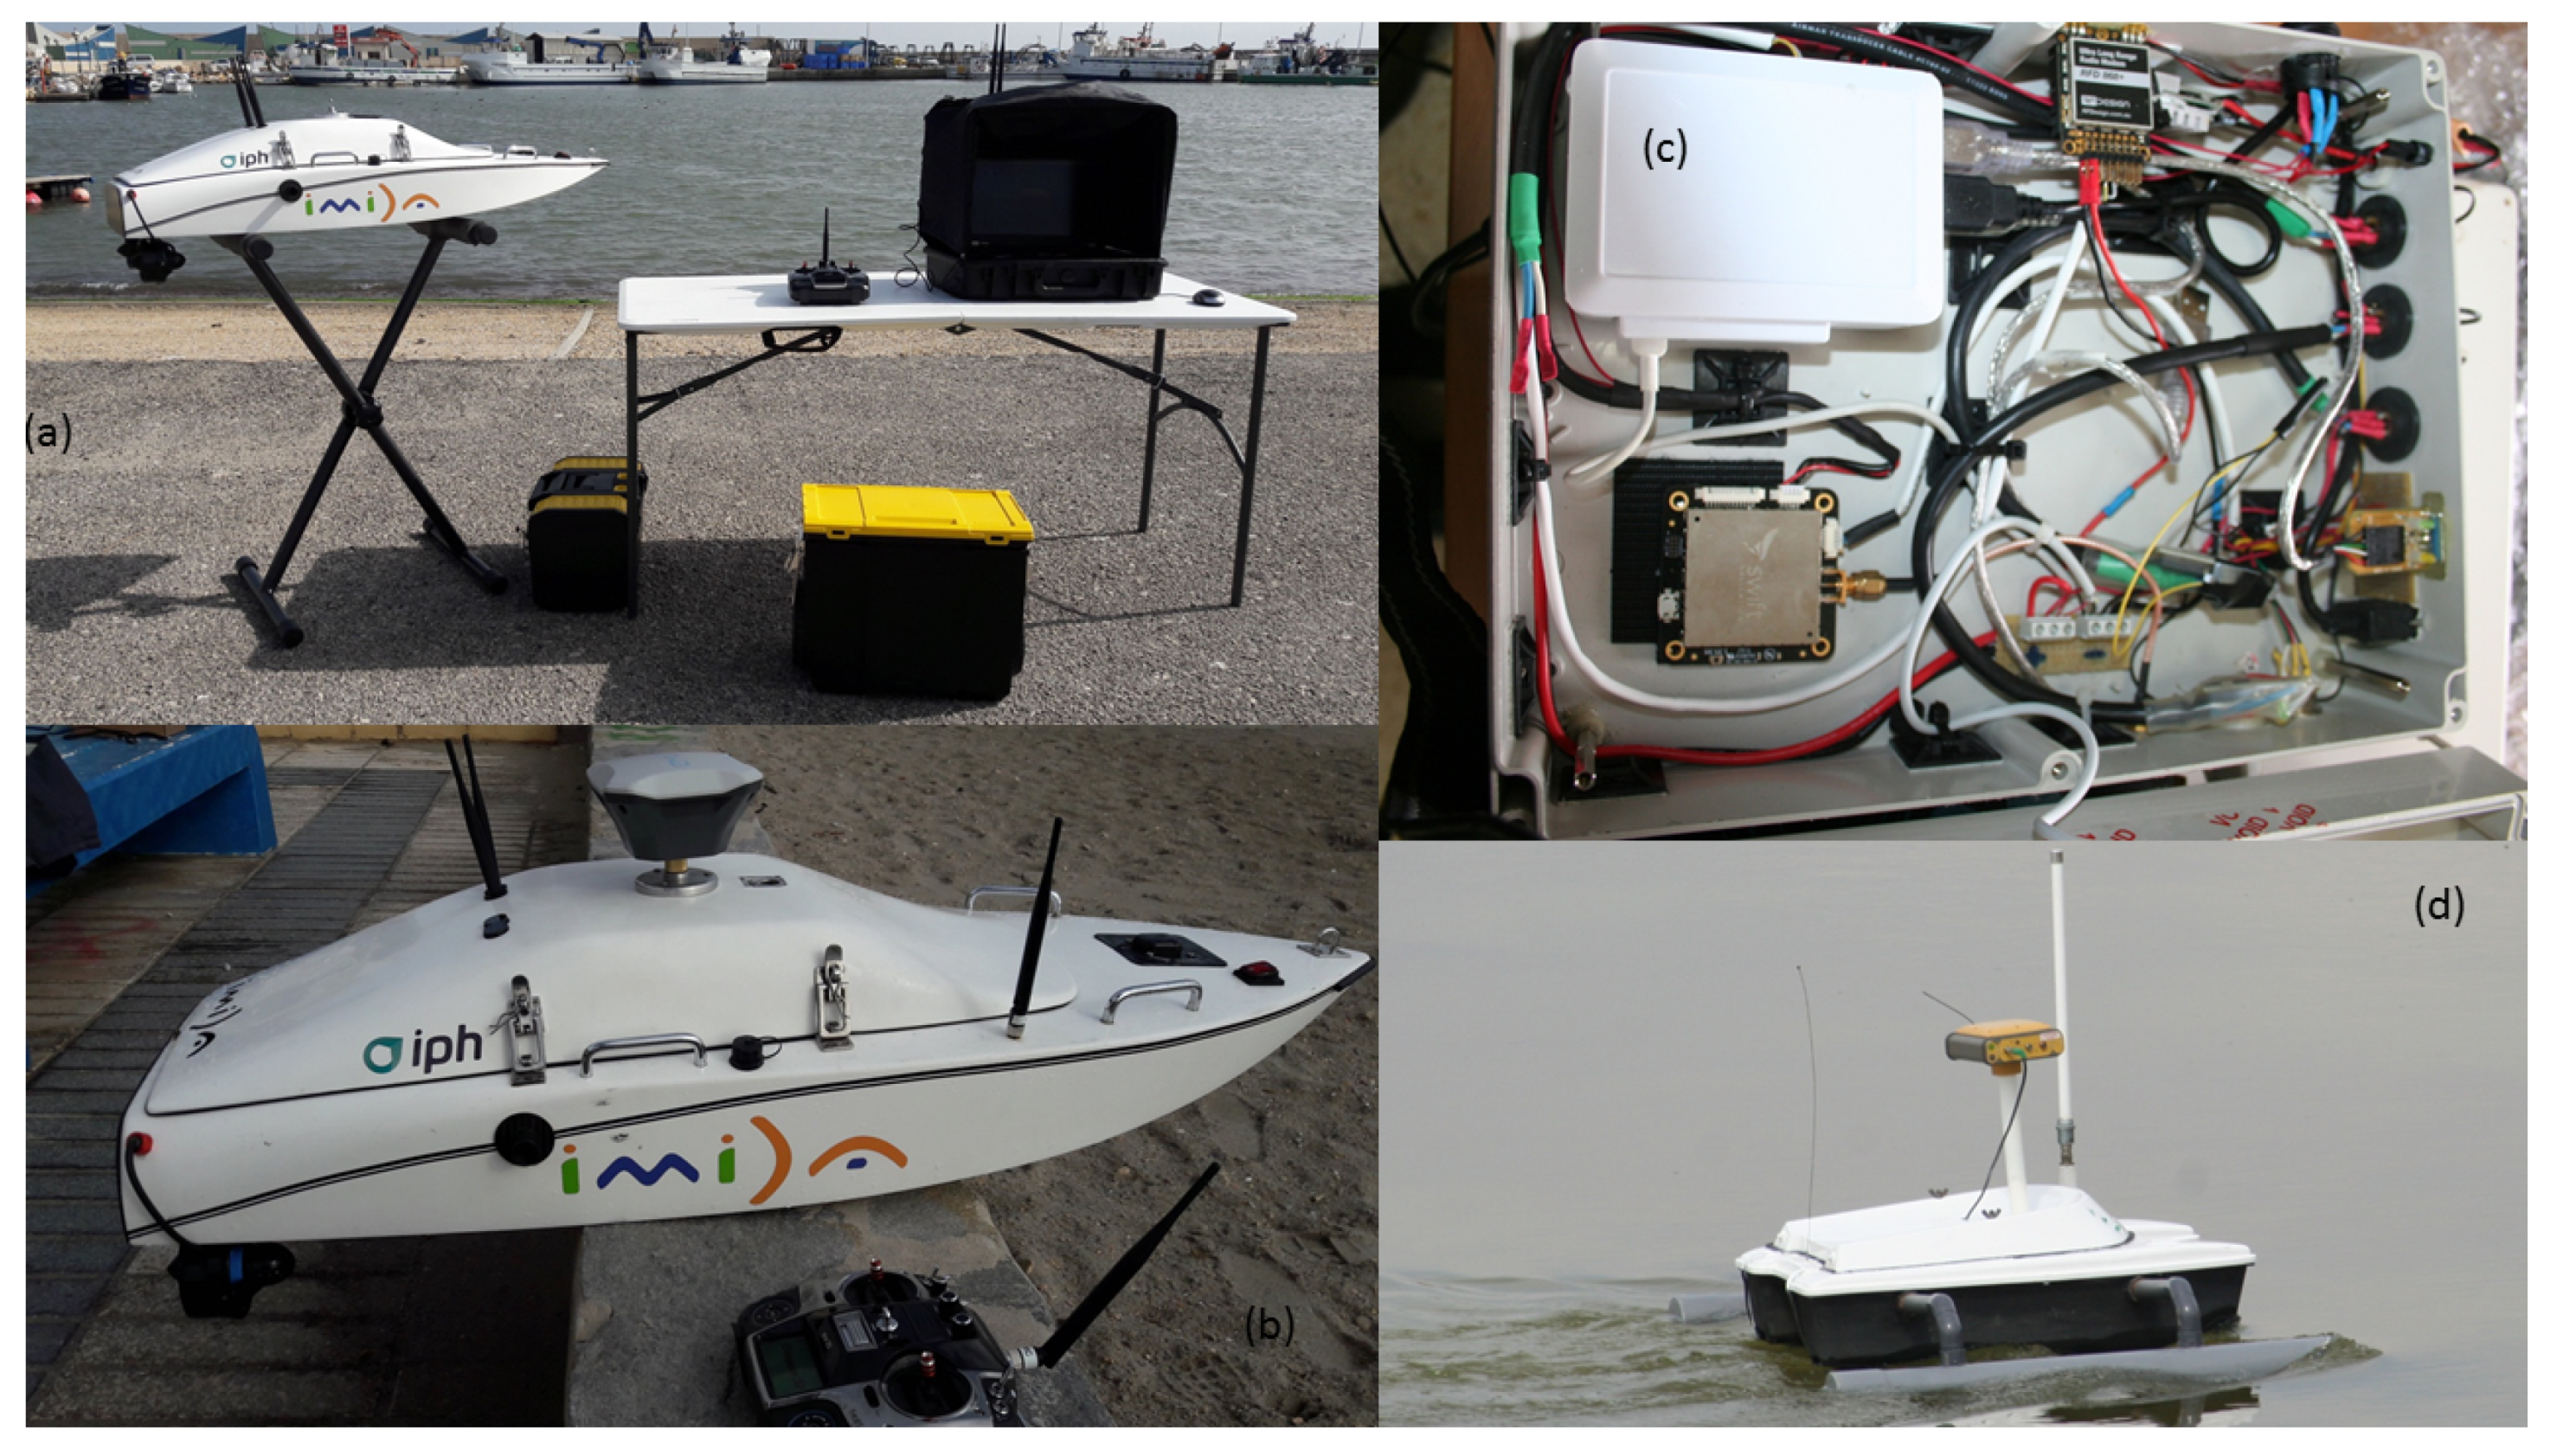
Figure 5 shows the USV used in the field experiment; a depthometer and a Global Navigation Satellite System (GNSS) receiver are mounted and synchronously collect water depth and position data with high accuracy. The depthometer is an Airmar 50/200 kHz (Airmar Technology Corporation, Milford, Connecticut, USA). The measuring range is 0.5 m to 100 m and the accuracy is ±10 mm. The GNSS receiver is an Emlid Reach RS (Emlid Ltd, Hong Kong, China), the horizontal positioning accuracy (in the Real Time Kinematic, RTK model) is about 10 mm, and the vertical positioning accuracy is about 20 mm. It was developed by Inntelia (IPH Ltd, Huelva, Spain). The specifications are shown in Table 4.
The bathymetric survey consisted of obtaining the coordinates (x, y, z) of a large number of elevation points of the floor of the reservoir (depth), by using an echo sounder or sonar installed in a floating drone, in a submerged drone, or on a semi-rigid boat [13]. The absolute position was simultaneously obtained with the GNSS RTK receiver. The drone carries a GNSS receiver and antenna, an autopilot based on ArduPilot, a microcomputer (based on a Raspberry Pi) to store the recorded data, and a Radio Modem UHF system. In this way, all the data can be integrated and a depth value can be calculated with respect to the mean sea level in Alicante according to INSPIRE Infrastructure for Spatial Information in Europe; for this, a geodetic vertex was used as support. The maximum speed of navigation of the drone or the boat was 2 m/s to obtain a precise synchronization of the echo sounder data with the GNSS receiver, thus permitting the transformation of the heights into depths with respect to the reference geodetic vertex.
2.4. Remote Operated Vehicle (ROV) for Bathymetric Surveys and Water Quality Measurements
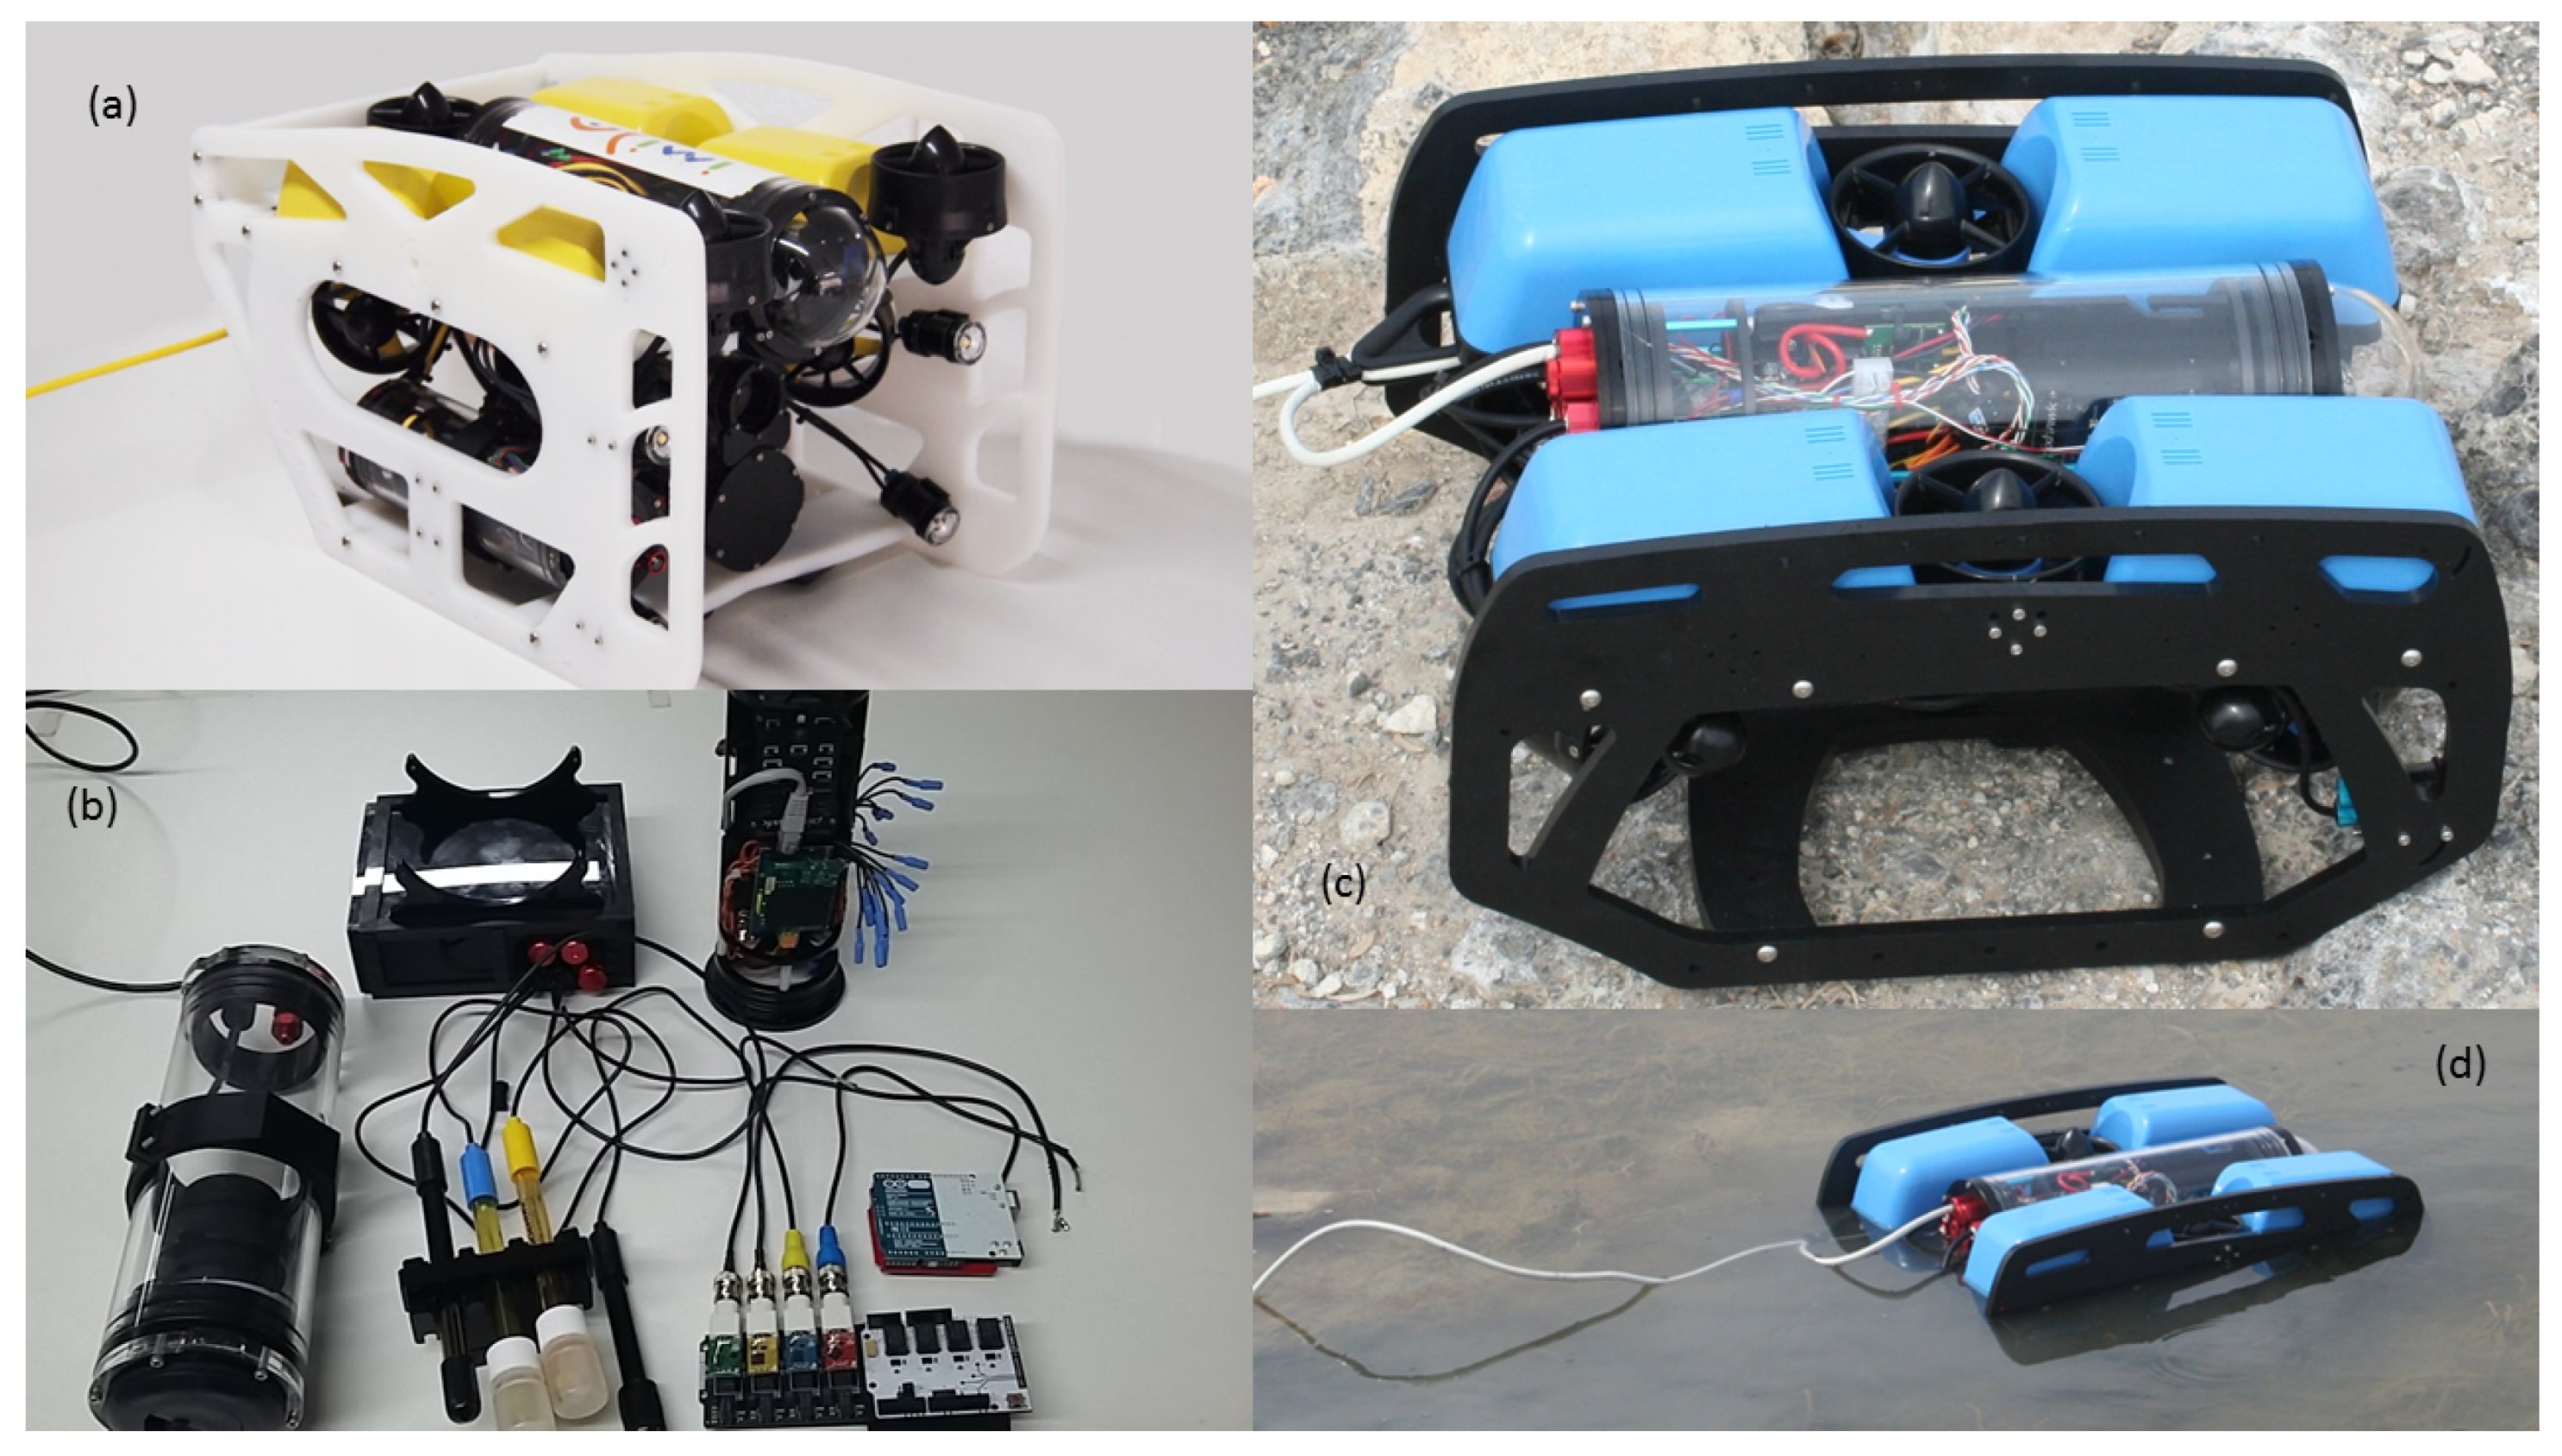
Figure 6 shows the remote operated vehicle-ROV used in the field experiment; a depthometer and a GNSS receiver (Emlid Ltd, Hong Kong, China) are mounted and synchronously collect water depth and position data of high accuracy. The depthometer is an Airmar DST 700 (Technology Corporation, Milford, Connecticut, USA). The measuring range is 0.5 m to 100 m. The GNSS receiver is a 3DR model. The specifications are shown in Table 5.
The bathymetric survey consisted of obtaining the coordinates (x, y, z) of a large number of elevation points of the submerged surface of the reservoir, by using an echo sounder or sonar installed in the ROV [13].
The echo sounder device is an Airmar DST 700 (Airmar Technology Corporation, Milford, CA, USA), the drone carries a GNSS receiver and antenna, an autopilot based on ArduPilot, and a microcomputer (based on a Raspberry Pi) to store the recorded data, and the control is carried out by means of a joystick connected with a polyethylene cable covered with kevlar. The measurement process consists of recording the depth with the echo sounder and, simultaneously, the absolute position with the GNSS receiver. In this work, the ROV was equipped with an open-source electronic sensors platform to measure the temperature, electrical conductivity (EC), dissolved oxygen (DO), oxidation reduction potential (ORP), temperature (Tª) and pH of the water (Atlas Scientific, New York, NY, USA). The open-source electronic sensors platform (Arduino Mega 2560, Ivrea, Italy) was developed by Nido Robotics SL. (Nido Robotics SL, Murcia, Spain), based on the model BlueRov2 (Blue Robotics In., Torrance, CA, USA).
2.5. LiDAR Data
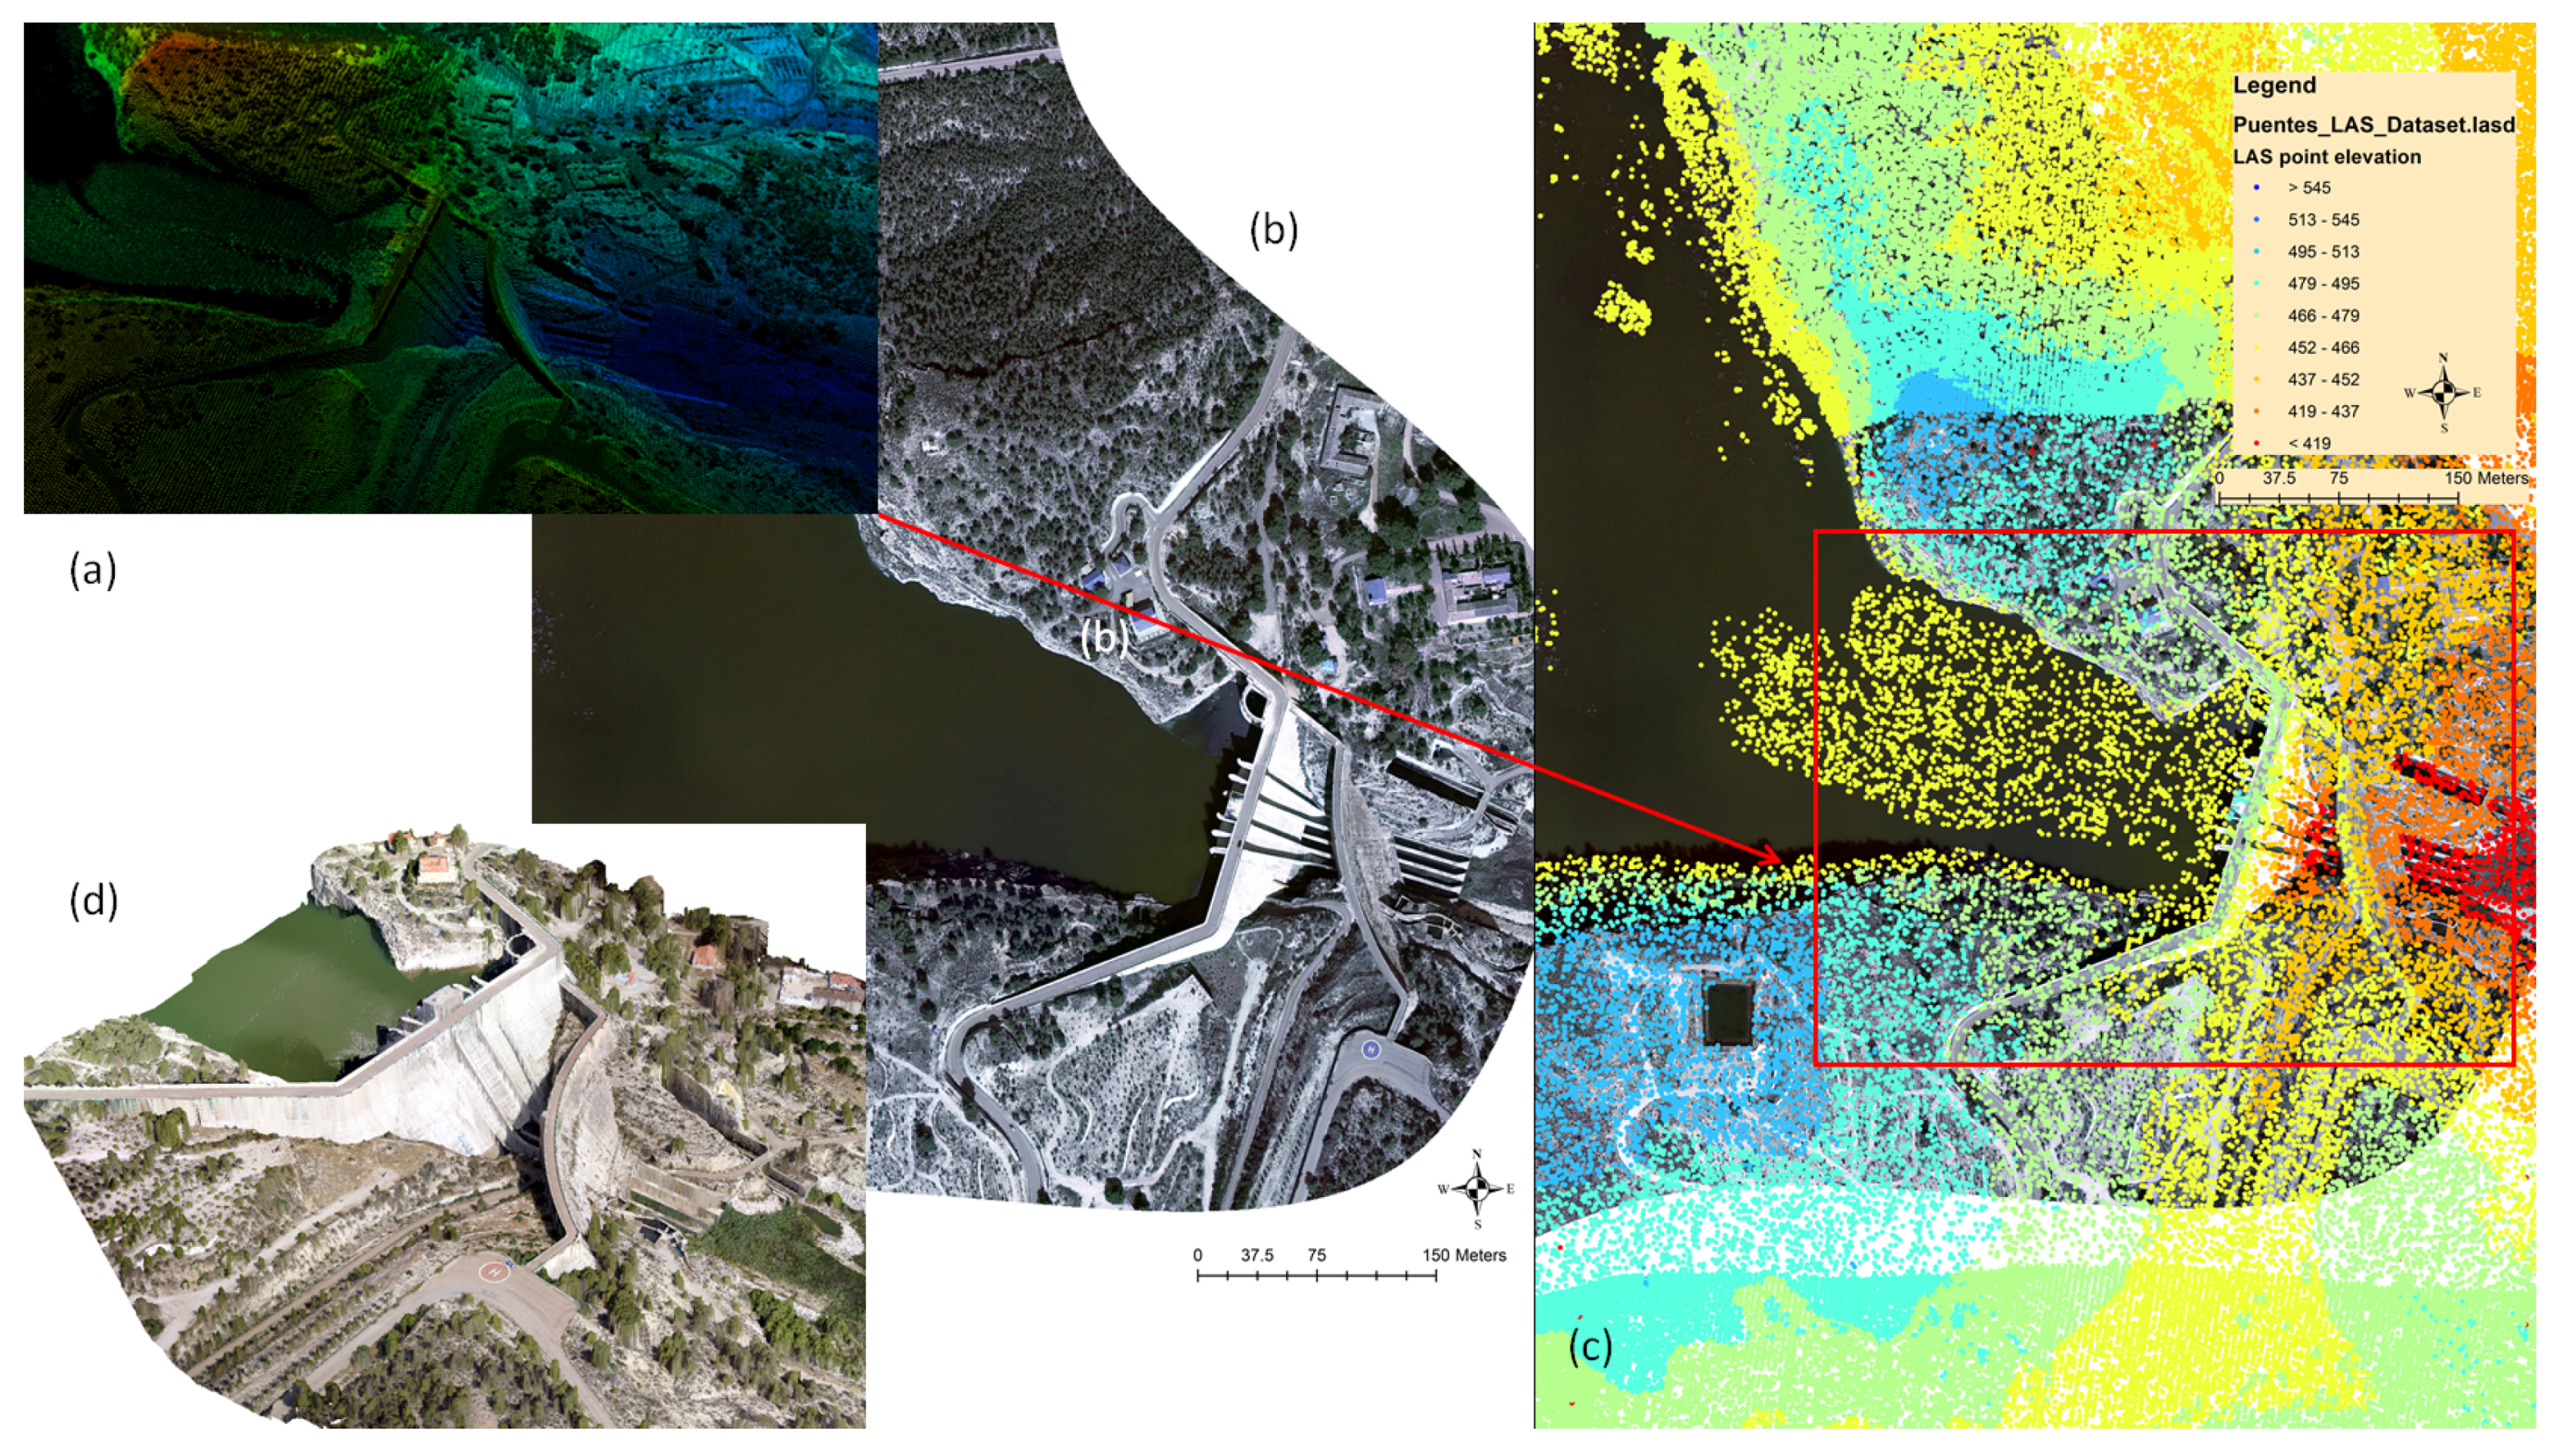
The airborne laser imaging detection and ranging data (LiDAR) correspond to the National Plan of Aerial Orthophotography—Plan Nacional de Ortofotografía Aérea (PNOA)—of 2009, for the Spanish National Geographic Institute (IGN) model ALS50 (Leica Geosystems AG, Heerbrugg, Switzerland), with a low point density of 0.5 points/m² but with total coverage throughout the SRB. Even considering its low resolution, a digital surface model (DSM) was obtained by triangulation at a spatial resolution of 1 meter. The LiDAR data were processed with LAStools (Rapidlasso GmbH, Gilching, Germany) and ArcGiS 10.5 software (ESRI, Redlands, CA, USA) (Figure 7).
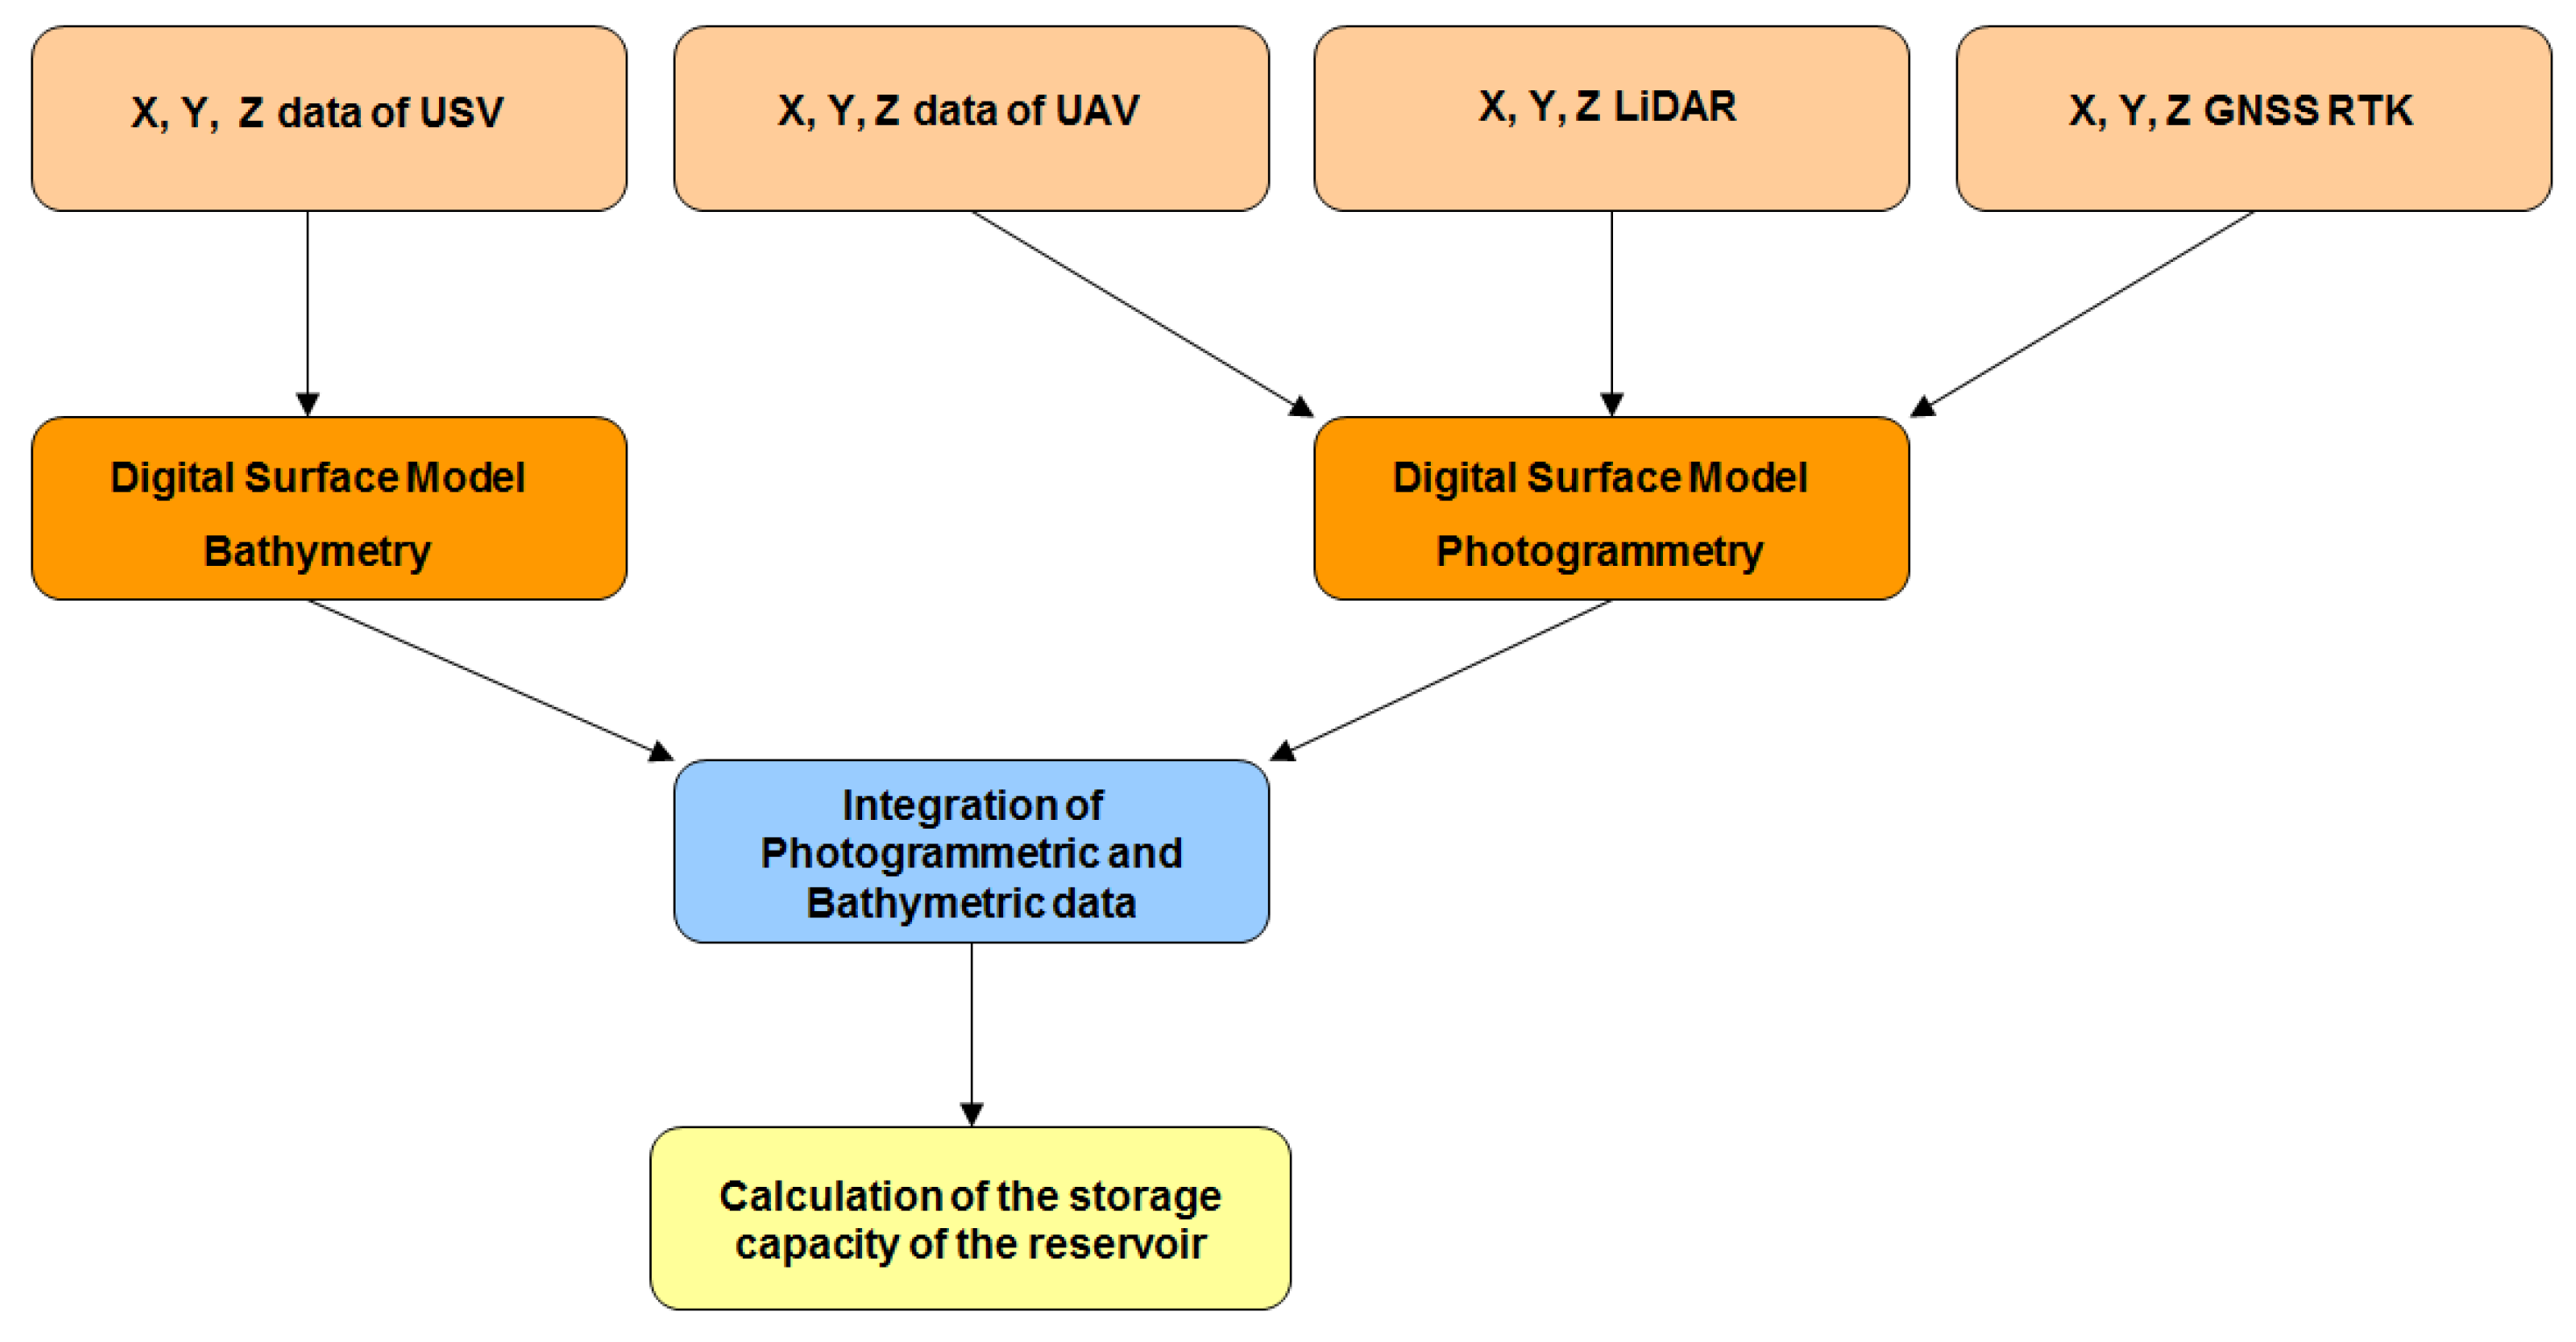
2.6. Methodology for the Integration of Altimetry Data
The photogrammetric and bathymetric data were integrated in an ArcGiS 10.5 geodatabase containing the LiDAR data of each reservoir. Using all the data, a digital elevation model was generated with a spatial resolution of 1 m, to perform the cubing for each isobath (m) and thus to compute the volume (m3) for each reservoir. The volume between each isobath was calculated, starting at the deepest level and finishing at the isobath corresponding to the maximum level of the reservoir. The final result corresponds to the height–volume relationship that is the current capacity curve. The applied methodology is represented in the flowchart of Figure 8.
The surface area enclosed by the curve of each level was estimated to obtain the storage capacity of the reservoir. To obtain the updated capacity of the reservoir, the volume between the curves of consecutive levels was calculated by applying Equation (1). Once all the points had been numbered, the network was adjusted planimetrically to the National Geodesic Network and altimetrically to the data of the reservoir. Therefore, the capacity curves of the reservoir were obtained, and the volumes of sedimentary materials were estimated.
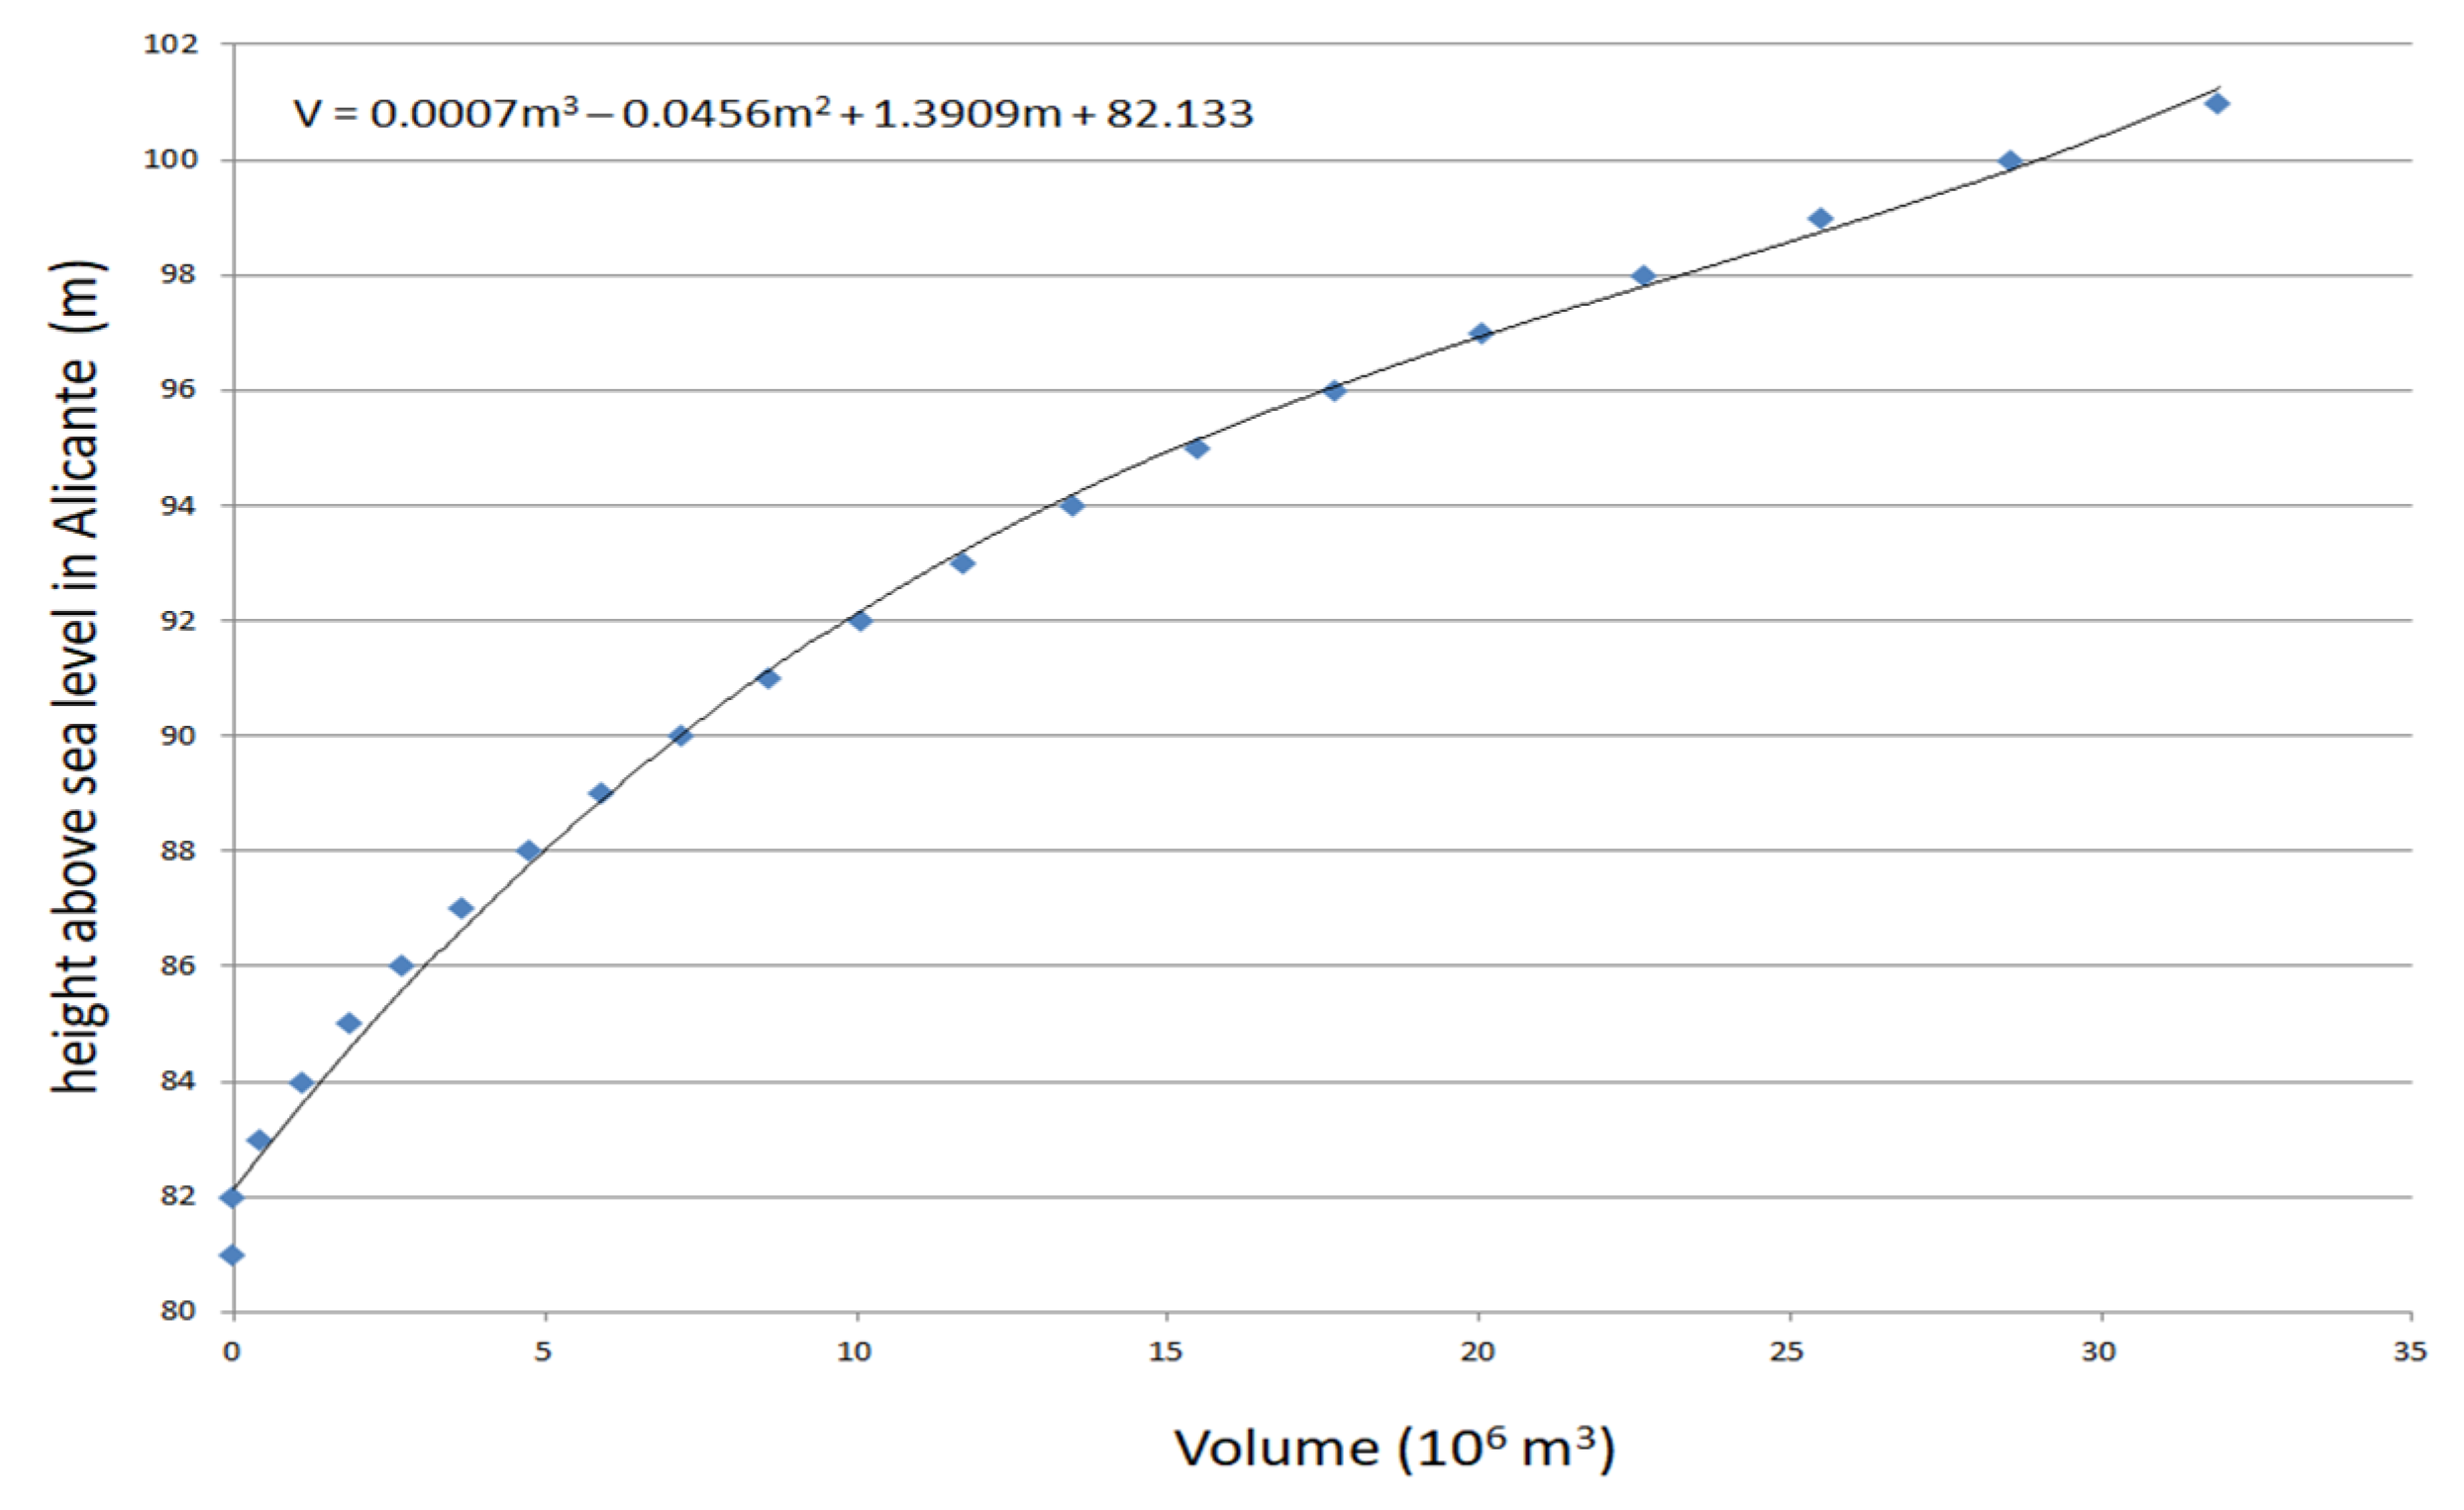
Filtered data were entered into ArcGIS 10.5, to create a triangulated irregular network (TIN) which is a representation of a continuous surface consisting entirely of triangular facets for the visualization and calculation of volume using a Python script developed with the ArcGiS 10.5 model builder. An example of a height–volume curve in the Santomera reservoir is shown in Figure 9.
The following Equation (1) relates depth with volume [25]. If this equation is applied considering two different bathymetries (old and recent), the loss of storage capacity of the reservoirs can be estimated.
where Vi = volume between elevations i and i + 1; h = distance between consecutive elevation curves (m); Si = area delimited by the elevation curve i; and Si+1 = area delimited by the elevation curve i + 1.
The total volume will be (Figure 9):
where V = current volume in the reservoir (m3); Vi = volume in the elevation i; a = height of the deepest curve (m); and m = height of the maximum level of the reservoir (m).
3. Results and Discussion
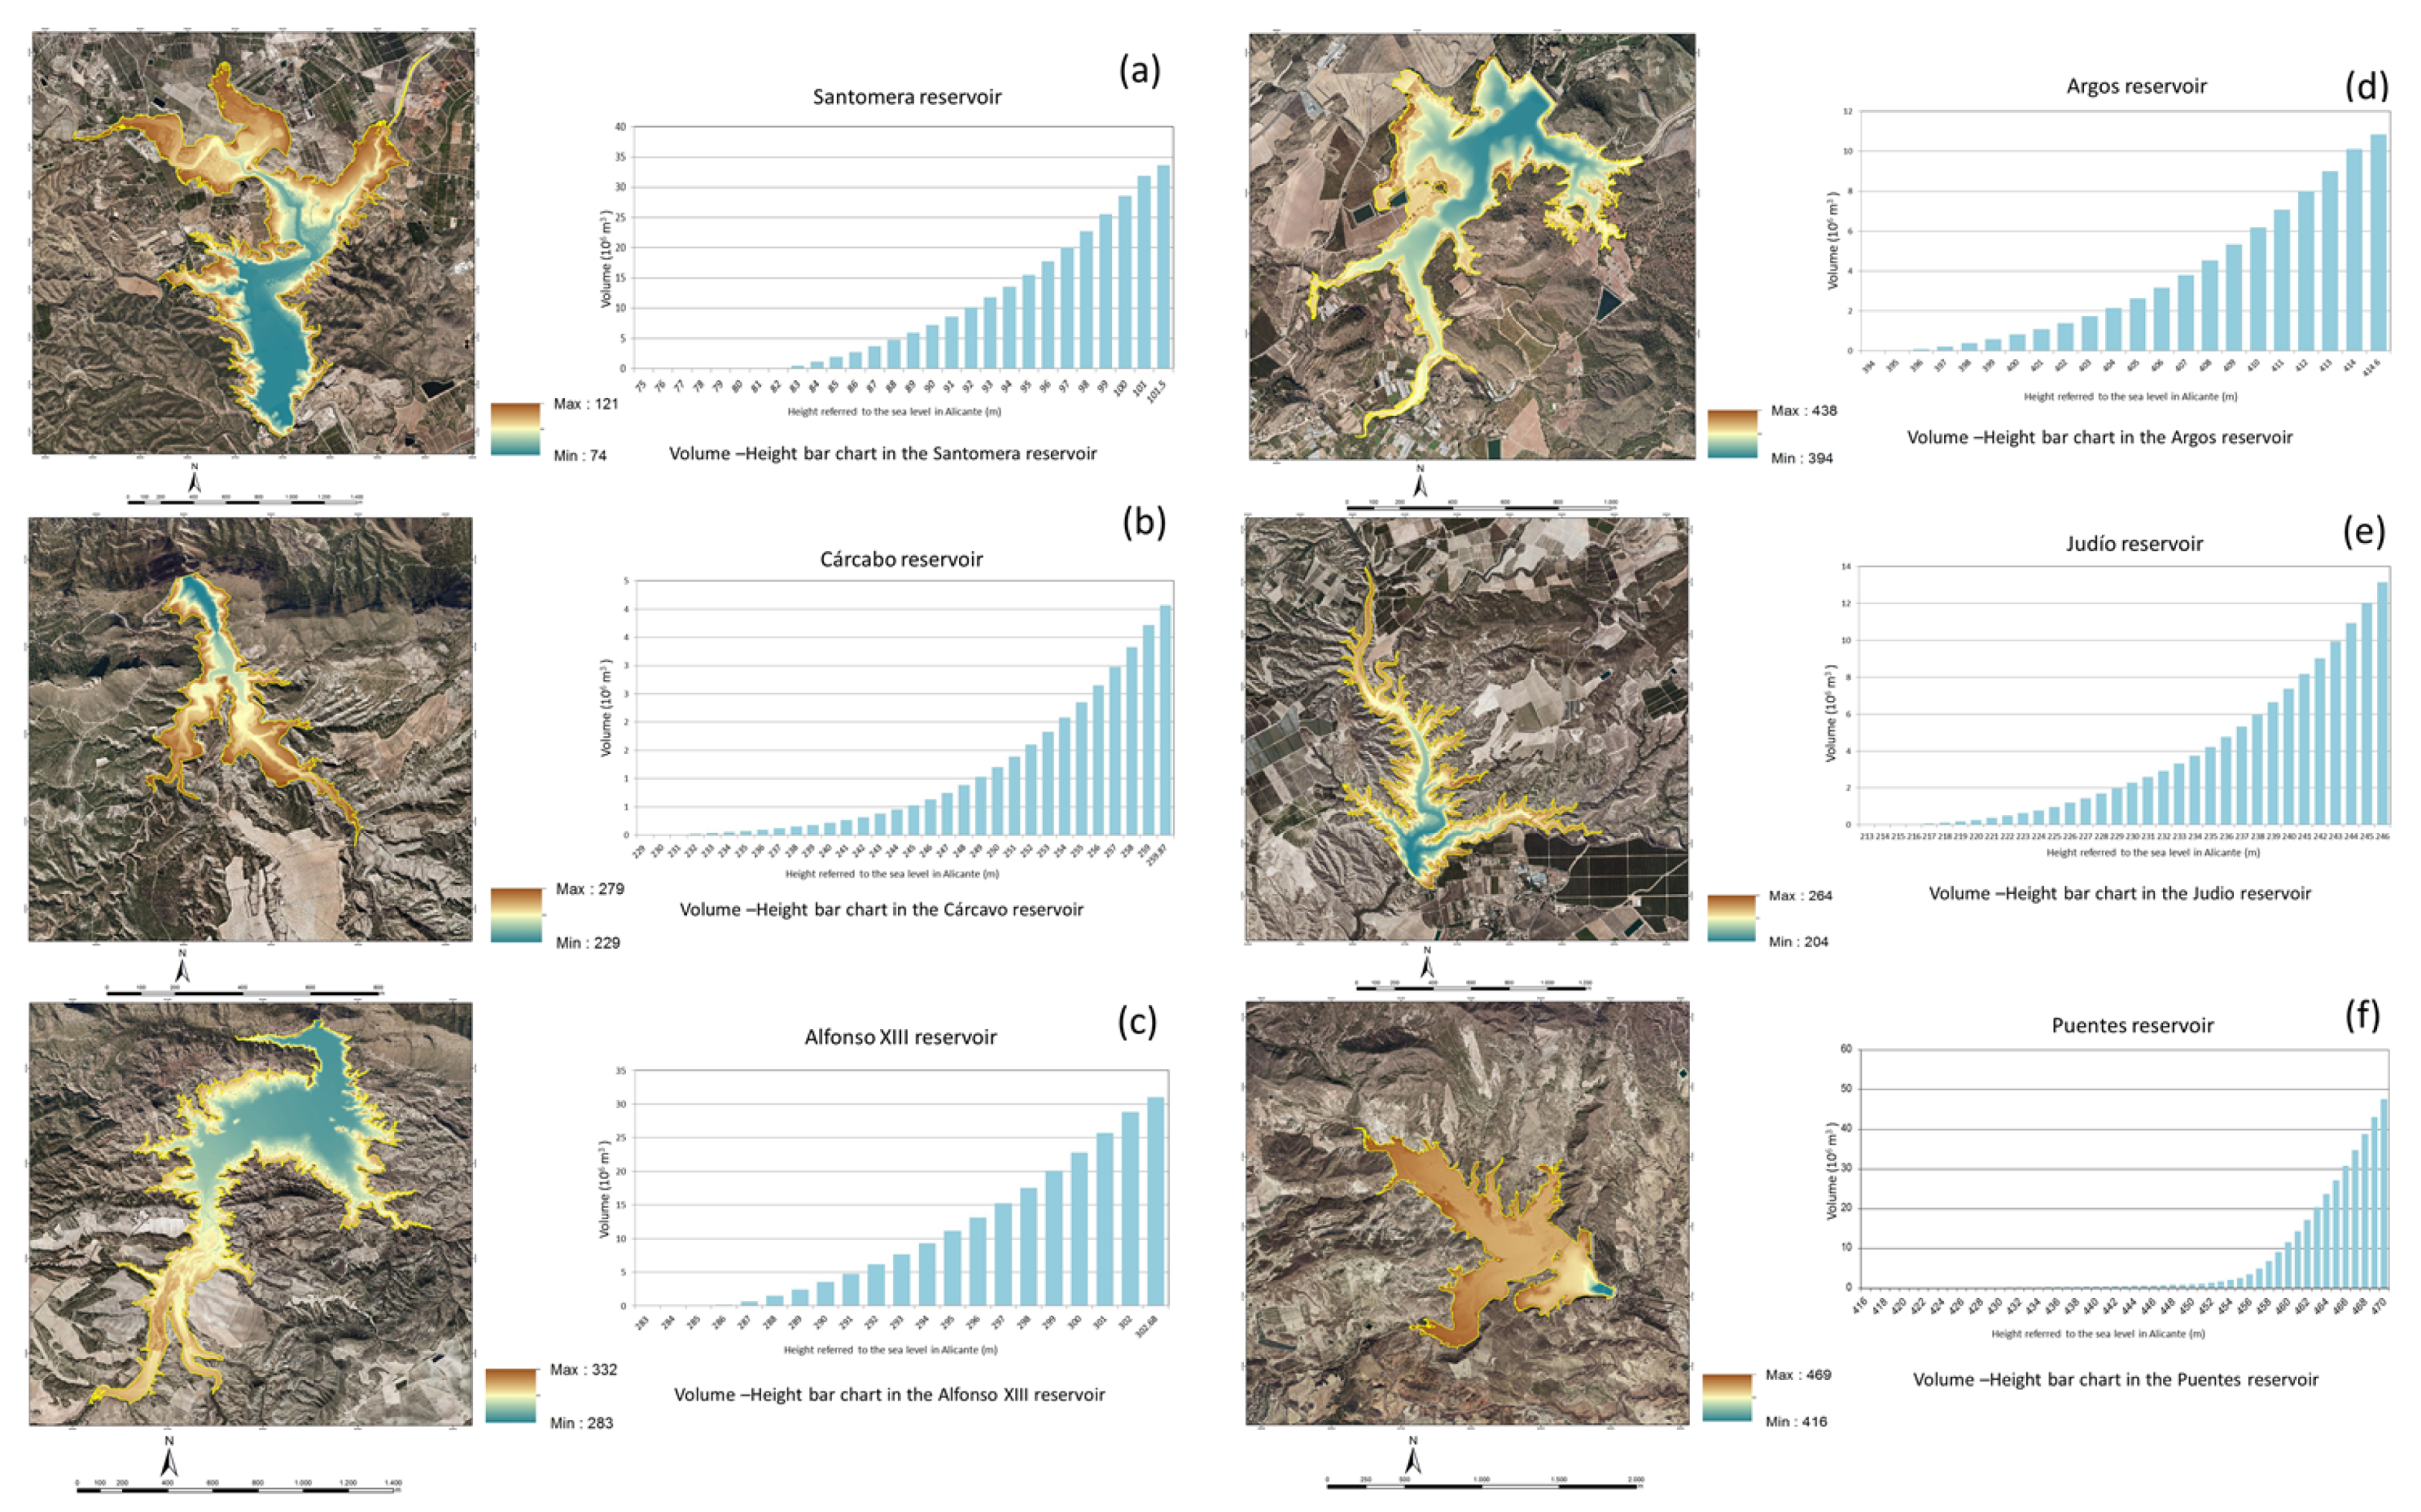
The 36 reservoirs of the SRB currently have a regulation capacity of 1.141 × 10⁹ m3 and occupy 7334 ha (Table 6). Considering these reservoirs, the bathymetries of 21 of them have been updated, which represents an updated topo-bathymetric surface of 2432 ha and a modeled storage volume of 1.6068 × 10⁸ m3, accounting for 33% of the total water surface area of the reservoirs in the SRB. The results show that there is a very close relationship between the age of the constructions and the accumulated loss of capacity. As an example, the digital models of the elevations obtained in six reservoirs, updated using USV, are shown in Figure 10.
During this work, three new types of low-cost equipment (based on open hardware technology) were developed in collaboration with three Spanish technology-based companies.
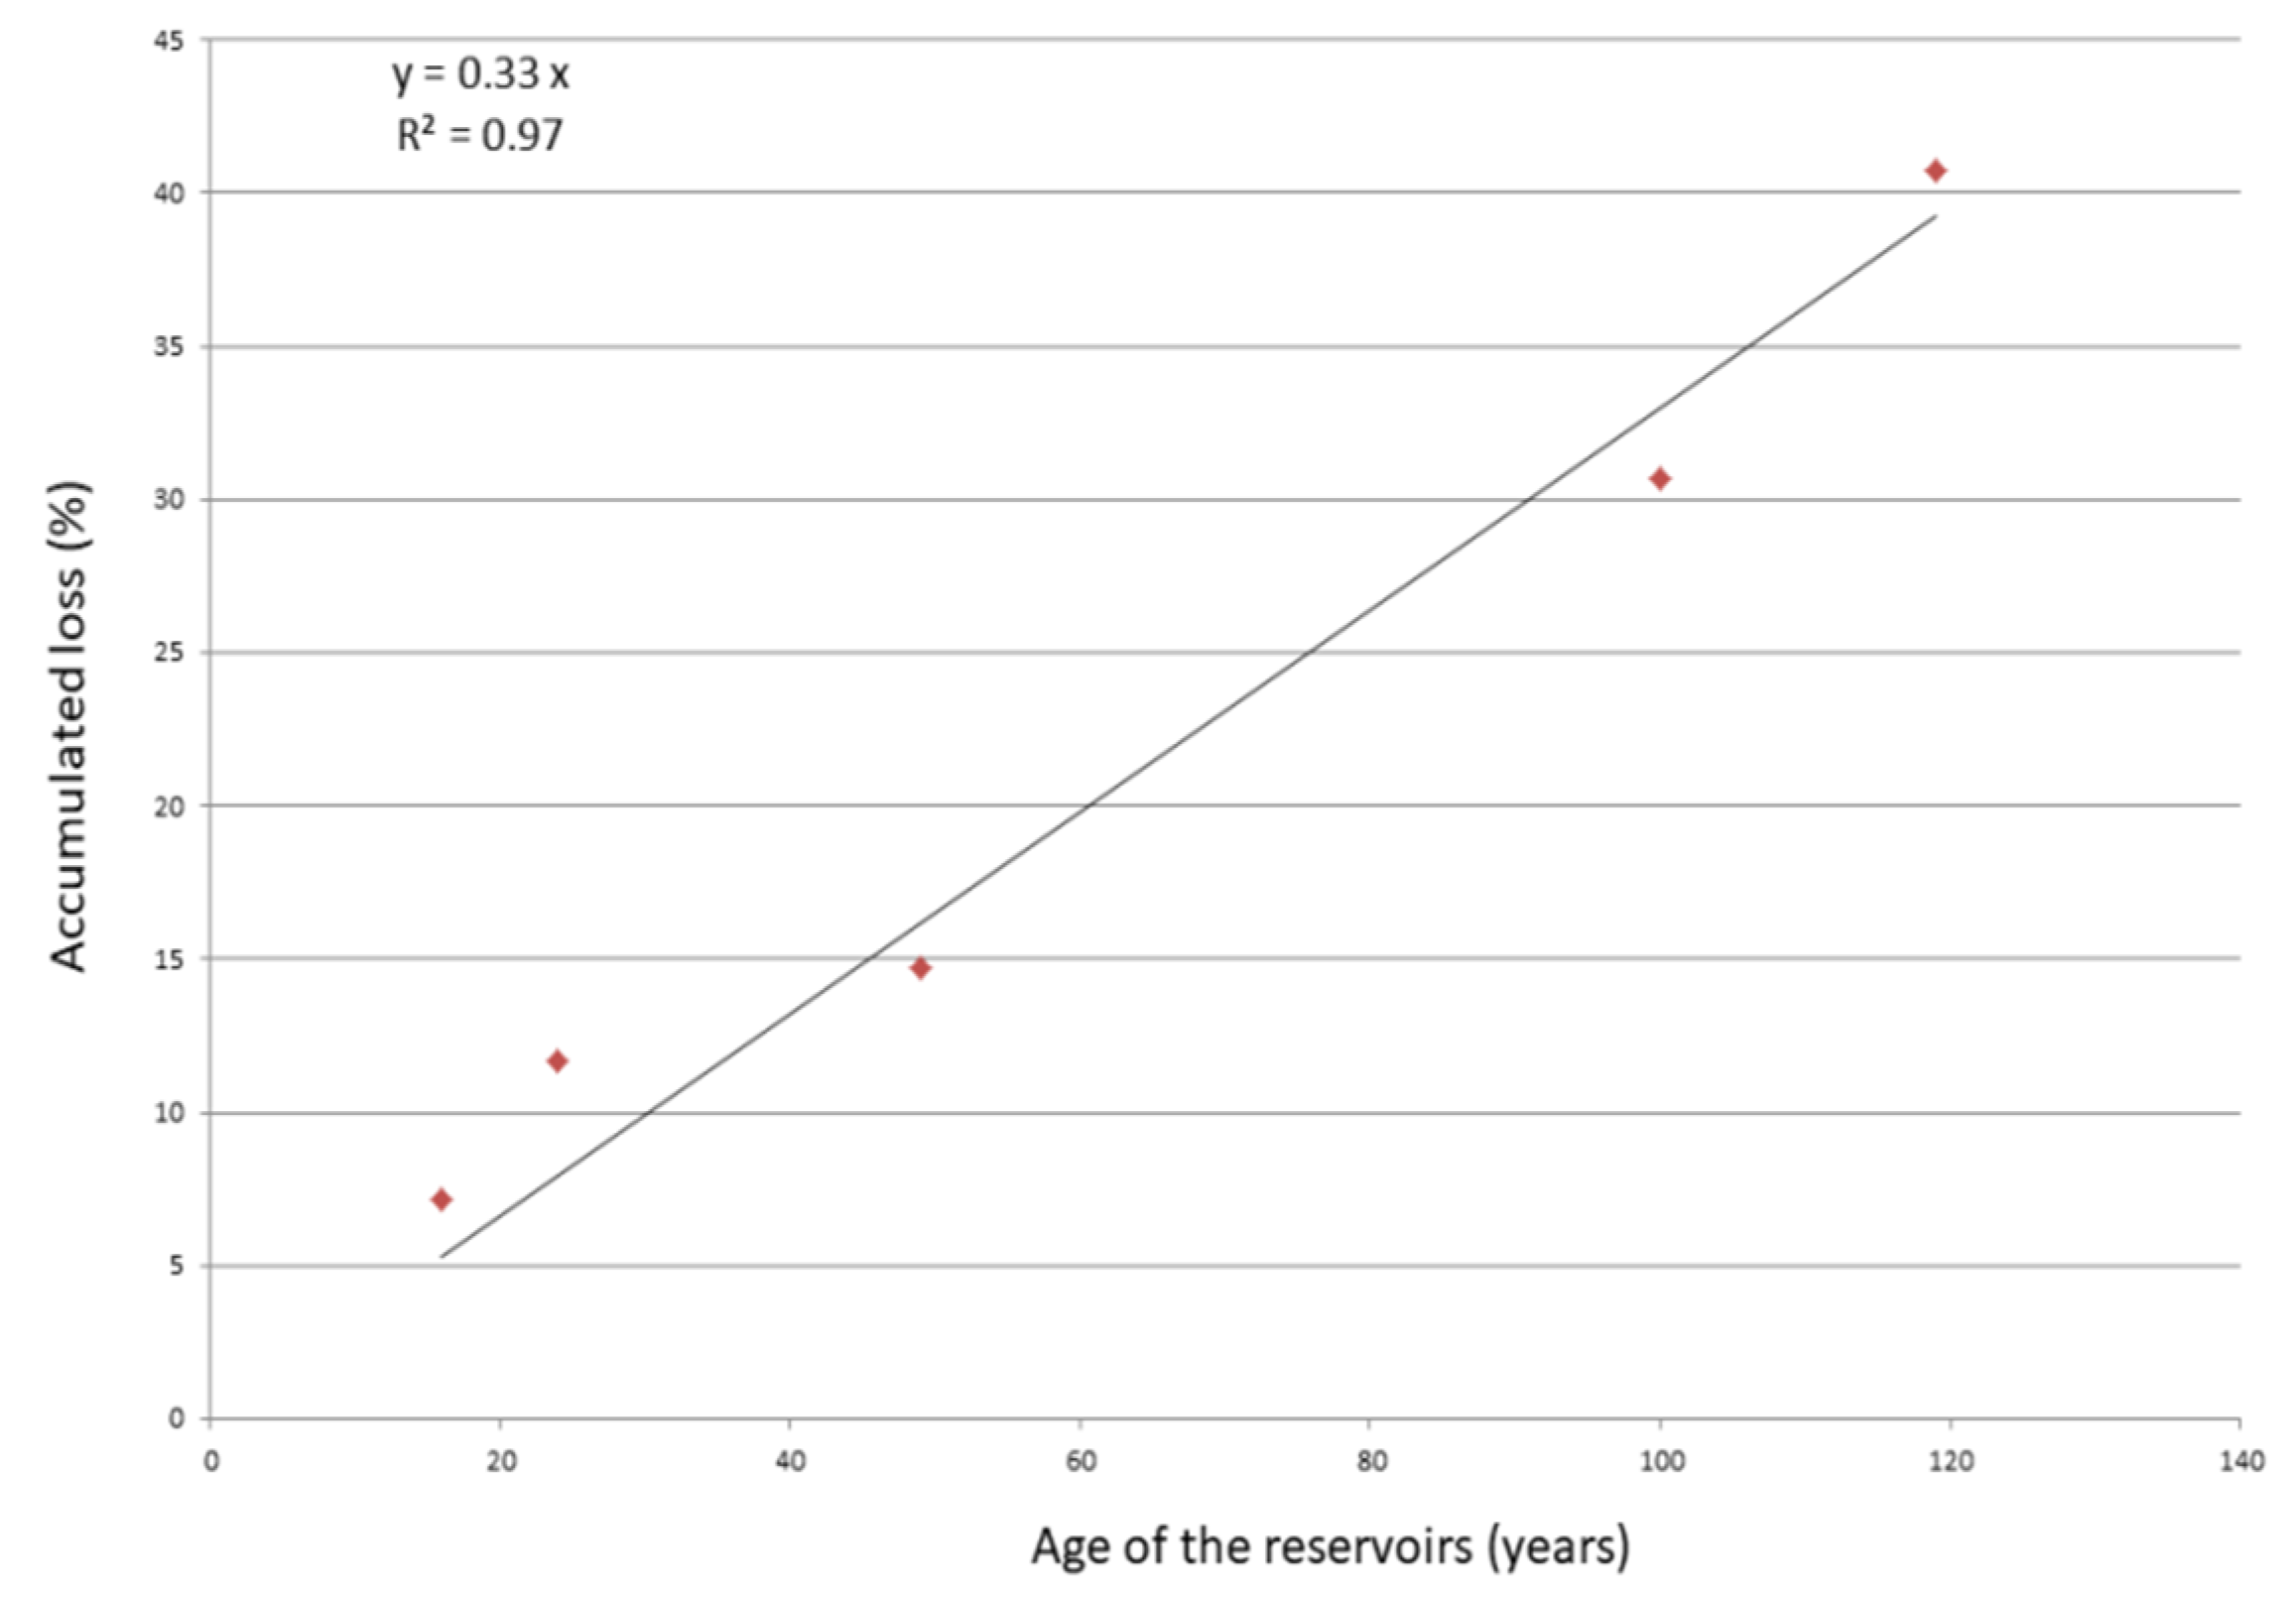
Five water reservoirs of different ages were selected, and the determination coefficient between the age and the annual loss rate was assessed (Figure 11). The main results from this research are: (a) reservoir silting has a relevant impact on water availability in the SRB; and (b) field surveys of five basins showed an average annual reservoir storage capacity reduction of 0.33%, equivalent to the average annual rate obtained for the most representative reservoirs in this area (Figure 11), although in some reservoirs surrounded by marly soils, these values were higher, exceeding 1%.
The accumulated storage capacity loss data of the most representative reservoirs of the basin as a whole are summarized in Table 7. Cárcabo had the highest annual rate of storage capacity loss (0.49%), although it is not the oldest reservoir. Valdeinfierno reservoir (119 years old) exhibited the highest accumulated storage capacity loss (40.77%), with an annual loss rate of 0.34%. Figure 11 presents the relationship between the accumulated loss and the age of the five representative reservoirs (included in Table 7).
4. Conclusions
The sensorized drones based on OpenSource technology are a very valuable tool that can provide digital models of reservoir surfaces with a high spatial and altimetric resolution. The LiDAR data provided by the National Plan of Aerial Orthophotography of the Spanish National Geographic Institute are a good improvement for digital terrain model analysis. The proposed methodology represents a novel approach in comparison with topographical techniques (a manned vessel with GPS and a depth gauge). Therefore, with lower costs and less human effort, updated digital models of reservoir surfaces are obtained with high precision.
The development of systems based on Ardupilot has proven to be very versatile, with low costs of development and operation, high-quality performance, and high effectiveness in the performance of topo-bathymetric work in reservoirs and coastal areas.
The cost of the design and manufacture of the Sony QX1 camera and its integration in the UAV designed by Droning (D-820) was 14,500 euros. The cost of the design and manufacture of the Airmar bathymetric probe and its integration in the USV designed by Intelia (Mambo) was 12,500 euros. The design and manufacture of the Airmar bathymetric probe and its integration in the ROV designed by Nido Robotics (Sibiu) cost 9500 euros. The amounted to of obtaining the photogrammetric products (orthoimage and digital terrain model) with a resolution of 5 cm for each reservoir, using a UAV at a height of 120 m, was 60 euros/ha and the throwput was 50 ha/day; the time needed for the whole process was five days. The cost of obtaining the photogrammetric products (orthoimage and digital terrain model) with a resolution of 20 cm, using a plane with APM software at a height of 200 m, was 20 euros/ha and the yield was 500 ha/day for the reservoir vessel; the time needed for the process was 10 days. The cost of obtaining the bathymetric products (digital terrain model) with a resolution of 1 m, using a USV, was 40 euros/ha and the yield was 50 ha/day; the time needed for the process was five days. The costs of these bathymetric techniques using drones are 75% lower than for traditional bathymetry.
The results obtained show that the sedimentation processes occurring in reservoirs have produced a considerable reduction in their storage capacity. The erosion rate in the SRB has been estimated according to the volume of the reservoirs and has been compared with data obtained using other methods [26]; the measurement of a 137Cs profile for the sediment in the Puentes reservoir made it possible to establish that, in the last 40 years, about 3 m of sediment have been deposited therein. The sediment accumulation rate during the period 1954–1994 was determined using sedimentological criteria [30]. Table 8 presents the accumulated storage capacity loss estimated from the bathymetries of three reservoirs, performed in 1976.
These technologies can be complemented by other emerging technologies, although they have lower altimetric precision, such as those based on high-resolution optical remote sensing satellite images and USV sounding data [31,32,33].
In conclusion, a novel methodology has been presented that improves on the traditional methods used to update the characterization of water reservoirs (bathymetry and surface area). Improvements in the understanding and monitoring of the processes that produce an important storage capacity loss in the water reservoirs of semiarid basins, such as the SRB, will allow the implementation of correction measures. Measures such as hydrological forest restoration dams could be beneficial for semiarid basins of the southern Mediterranean region with high rates of erosion. The present work provides the methodology to reach this challenging aim.
Author Contributions
The co-authors contributed in similar proportions to the work. The main author (M.E.) developed the concept and methodology and contributed to all sections of the work; J.A.D. and S.G.-G. contributed to the writing, review, and editing; J.F.A. contributed to the design of the experiments and the formal analysis; J.M.B. contributed to the acquisition of funding and the formal analysis.
Funding
This research was co-funded (80%) by the European Regional Development Fund (ERDF), through grant number FEDER 14-20-15.
Acknowledgments
To the General Secretary of the Segura River Basin (for promoting the framework agreement of collaboration that has financed the bathymetric work in the reservoirs of the Segura River Basin), Habitat, Droning, Inntelia-IPH, and Nido Robotics.
Conflicts of Interest
Declare conflicts of interest or state
References
- Moreno-Amich, R.; Garcia-Berthou, E. A new bathymetric map based on echo-sounding and morphometrical characterization of the Lake of Banyoles (NE-Spain). Hydrobiologia 1989, 185, 83–90. [Google Scholar] [CrossRef]
- Gavrilov, A.N.; Siwabessy, P.J.W.; Parnum, I. Multibeam echo sounder backscatter analysis Cooperative Research Centre for Coastal Zone Estuary and Waterway Management. Coop. Res. Cent. Coast. Zone Estuary Waterw. Manag. 2005, 3, 32. [Google Scholar]
- Sánchez-Carnero, N.; Aceña, S.; Rodríguez-Pérez, D.; Couñago, E.; Fraile, P.; Freire, J. Fast and low-cost method for VBES bathymetry generation in coastal areas. Estuar. Coast. Shelf Sci. 2012, 114, 175–182. [Google Scholar] [CrossRef] [Green Version]
- Cavalli, M.; Tarolli, P. Applicazione Della Tecnologia LIDAR Per Lo Studio Dei Corsi D’acqua. Ital. J. Eng. Geol. Environ. 2011, 2011, 33–44. [Google Scholar] [CrossRef]
- Sánchez-Carnero, N.; Ojeda-Zujar, J.; Rodríguez-Pérez, D.; Marquez-Perez, J. Assessment of different models for bathymetry calculation using SPOT multispectral images in a high-turbidity area: The mouth of the Guadiana Estuary. Int. J. Remote Sens. 2014, 35, 493–514. [Google Scholar] [CrossRef]
- McCully, P. Silenced Rivers: The Ecology and Politics of Large Dams; Zed Books: New York, NY, USA, 2001. [Google Scholar]
- Osorio, J.D.G.; García-Galiano, S.G. Assessing uncertainties in the building of ensemble RCMs over Spain based on dry spell lengths probability density functions. Clim. Dyn. 2013, 40, 1271–1290. [Google Scholar] [CrossRef]
- Estrela, T.; Pérez-Martin, M.A.; Vargas, E. Impacts of climate change on water resources in Spain. Hydrol. Sci. J. 2012, 57, 1154–1167. [Google Scholar] [CrossRef] [Green Version]
- Giménez, P.O.; García-Galiano, S.G. Assessing Regional Climate Models (RCMs) Ensemble-driven reference evapotranspiration over Spain. Water 2018, 10, 1181. [Google Scholar] [CrossRef]
- Garcia-Galiano, S.G.; Gimenez, P.O.; Giraldo-Osorio, J.D. Assessing nonstationary spatial patterns of extreme droughts from long-term high-resolution observational dataset on a semiarid basin (Spain). Water 2015, 7, 5458–5473. [Google Scholar] [CrossRef]
- Koparan, C.; Koc, A.B.; Privette, C.V.; Sawyer, C.B. In situ water quality measurements using an unmanned aerial vehicle (UAV) system. Water 2018, 10, 264. [Google Scholar] [CrossRef]
- Ridolfi, E.; Manciola, P. Water level measurements from drones: A Pilot case study at a dam site. Water 2018, 10, 297. [Google Scholar] [CrossRef]
- Coggins, L.X. An Integrated Approach to Improving Waste Stabilisation Pond Performance. Ph.D. Thesis, University of Western Australia, Perth, Australia, 2017. [Google Scholar]
- Morgan, D. Application of Sonar for the Measurement of Sludge Heights in Wastewater Stabilisation Ponds. Ph.D. Thesis, University of Western Australia, Perth, Australia, 2010. [Google Scholar] [CrossRef]
- ArduPilot. Downloading and Analyzing Data Logs in Mission Planner—Copter Documentation. 2016. Available online: http://ardupilot.org/copter/docs/common-downloading-and-analyzing-data-logs-in-mission-planner.html (accessed on 6 December 2018).
- Arifianto, O.; Farhood, M. Development and Modeling of a Low-Cost Unmanned Aerial Vehicle Research Platform. J. Intell. Robot. Syst. Theory Appl. 2015, 80, 139–164. [Google Scholar] [CrossRef]
- González-Jorge, H.; Martínez-Sánchez, J.; Bueno, M.; Arias, P. Unmanned Aerial Systems for Civil Applications: A Review. Drones 2017, 1, 2. [Google Scholar] [CrossRef]
- Watanabe, Y.; Kawahara, Y. UAV Photogrammetry for Monitoring Changes in River Topography and Vegetation. Procedia Eng. 2016, 154, 317–325. [Google Scholar] [CrossRef] [Green Version]
- Turner, I.L.; Harley, M.D.; Drummond, C.D. UAVs for coastal surveying. Coast. Eng. 2016, 114, 19–24. [Google Scholar] [CrossRef]
- Burroughes, J.E. The Synthesis of Estuarine Bathymetry from Sparse Sounding Data. Ph.D. Thesis, University of Plymouth, Plymouth, UK, 2001. [Google Scholar]
- Koparan, C.; Koc, A.B.; Privette, C.V.; Sawyer, C.B.; Sharp, J.L. Evaluation of a UAV-assisted autonomous water sampling. Water 2018, 10, 655. [Google Scholar] [CrossRef]
- Huang, Y.; Hoffmann, C.; Fritz, B.; Lan, Y. Development of an unmanned aerial vehicle-based spray system for highly accurate site-specific application. In Proceedings of the American Society of Agricultural and Biological Engineers Annual International Meeting 2008, ASABE 2008, Providence, RI, USA, 29 June–2 July 2008; Volume 4, pp. 2483–2496. [Google Scholar]
- Sørensen, L.Y.; Jacobsen, L.T.; Hansen, J.P. Low cost and flexible UAV deployment of sensors. Sensors 2017, 17, 154. [Google Scholar] [CrossRef] [PubMed]
- SRB. Plan Hidrológico de la Cuenca del Segura. 2015–2021; Confederación Hidrográfica del Segura, Minist. Medioambiente: Madrid, Spain, 2015; p. 226. [Google Scholar]
- CEDEX. Batimetrías. Available online: http://ceh-flumen64.cedex.es/LabH/Batimetrías.htm (accessed on 6 December 2018).
- López, F.; Gutiérrez, J.D. Estimación de la erosión y aterramientos de embalses en la cuenca hidrográfica del Río Segura. Cuad. Investig. Geográfica 1982, 8, 3–18. [Google Scholar] [CrossRef]
- Esteban, J.R.; Aguilar, V.; Serra, J.; Medina, J. Levantamientos topo-batimétricos en ingenieria. Ingeniería del Agua 1995, 2, 181–200. [Google Scholar]
- Pavlis, N.K.; Holmes, S.A.; Kenyon, S.C.; Factor, J.K. The development and evaluation of the Earth Gravitational Model 2008 (EGM2008). J. Geophys. Res. Solid Earth 2012, 117. [Google Scholar] [CrossRef] [Green Version]
- Skulstad, R.; Syversen, C.L.; Merz, M.; Sokolova, N.; Fossen, T.I.; Johansen, T.A. Net recovery of UAV with single-frequency RTK GPS. In Proceedings of the 2015 IEEE Aerospace Conference, Big Sky, MT, USA, 7–14 March 2015. [Google Scholar]
- Cobo Rayan, R.; Sanz Montero, E.; Gomez Monta a, J.L.; Avenda o Salas, C.; Plata Bedmar, A. Influence of the Puentes reservoir operation procedure on the sediment accumulation rate between 1954–1994. In Transactions of the International Congress on Large Dams; Comission International des Grandes Barrages: Forence, Italy, 1997; Volume 3, pp. 835–848. Available online: https://www.researchgate.net/publication/258488467 (accessed on 6 December 2018).
- Liang, J.; Zhang, J.; Ma, Y.; Zhang, C.-Y. Derivation of Bathymetry from High-resolution Optical Satellite Imagery and USV Sounding Data. Mar. Geod. 2017, 40, 466–479. [Google Scholar] [CrossRef]
- Castillo-López, E.; Domínguez, J.A.; Pereda, R.; de Luis, J.M.; Pérez, R.; Piña, F. The importance of atmospheric correction for airborne hyperspectral remote sensing of shallow waters: Application to depth estimation. Atmos. Meas. Tech. 2017, 10, 3919–3929. [Google Scholar] [CrossRef]
- Eugenio, F.; Marcello, J.; Martin, J.; Rodríguez-Esparragón, D. Benthic Habitat Mapping Using Multispectral High-Resolution Imagery: Evaluation of Shallow Water Atmospheric Correction Techniques. Sensors 2017, 17, 2639. [Google Scholar] [CrossRef] [PubMed]
Figure 1.
Location of the studied reservoirs in the Segura River Basin (SRB), southeastern Spain.

Figure 2.
OpenSource equipment developed by Droning to carry out the photogrammetric work: (a,b) Droning D-820; (c,d) initial design based on Droning D-650.
Figure 2.
OpenSource equipment developed by Droning to carry out the photogrammetric work: (a,b) Droning D-820; (c,d) initial design based on Droning D-650.

Figure 3.
Waypoints definition, using Mission Planner software, in the Valdeinfierno reservoir (a) and the Santomera reservoir (d), ground control points in the Santomera reservoir (c) and centers ortofo in the Valdeinfierno reservoir (b).
Figure 3.
Waypoints definition, using Mission Planner software, in the Valdeinfierno reservoir (a) and the Santomera reservoir (d), ground control points in the Santomera reservoir (c) and centers ortofo in the Valdeinfierno reservoir (b).

Figure 4.
(a) Digital terrain model for a spatial resolution of 20 cm, (b) Digital terrain model for a spatial resolution of 5 cm, and (c) a bathymetric survey in Santomera reservoir at a spatial resolution of 1 m. The height is referred to the sea level in Alicante.
Figure 4.
(a) Digital terrain model for a spatial resolution of 20 cm, (b) Digital terrain model for a spatial resolution of 5 cm, and (c) a bathymetric survey in Santomera reservoir at a spatial resolution of 1 m. The height is referred to the sea level in Alicante.

Figure 5.
OpenSource equipment developed by Inntelia Soluciones Tecnológicas S.L. (IPH) for the topo-bathymetric work: (a–c) Mambo-IMIDA; and (d) the initial design based on Mambo-IPH.
Figure 5.
OpenSource equipment developed by Inntelia Soluciones Tecnológicas S.L. (IPH) for the topo-bathymetric work: (a–c) Mambo-IMIDA; and (d) the initial design based on Mambo-IPH.

Figure 6.
OpenSource equipment developed by Nido Robotics S.L. for the topo-bathymetric work: (a,b) SIBIU-IMIDA; and (c,d) initial design based on BlueRov2 (Blue Robotics In., Torrance, CA, USA).
Figure 6.
OpenSource equipment developed by Nido Robotics S.L. for the topo-bathymetric work: (a,b) SIBIU-IMIDA; and (c,d) initial design based on BlueRov2 (Blue Robotics In., Torrance, CA, USA).

Figure 7.
LiDAR data (a), orthophotography (b), bathymetric and LiDAR data (c), and 3D model (d) of the Puentes reservoir. The height is referred to the sea level in Alicante.
Figure 7.
LiDAR data (a), orthophotography (b), bathymetric and LiDAR data (c), and 3D model (d) of the Puentes reservoir. The height is referred to the sea level in Alicante.

Figure 8.
Flowchart showing the integration of photogrammetric and bathymetric data.

Figure 9.
Height–volume curves in the Santomera reservoir. The height is referred to the sea level in Alicante.
Figure 9.
Height–volume curves in the Santomera reservoir. The height is referred to the sea level in Alicante.

Figure 10.
Digital terrain model and height–volume bar graphics for the Santomera (a), Cárcabo (b), Alfonso XIII (c), Argos (d), Judío (e) and Puentes (f) reservoirs. The height is referred to the sea level in Alicante.
Figure 10.
Digital terrain model and height–volume bar graphics for the Santomera (a), Cárcabo (b), Alfonso XIII (c), Argos (d), Judío (e) and Puentes (f) reservoirs. The height is referred to the sea level in Alicante.

Figure 11.
Relationship between the age of the reservoir in years (x axis) and the percentage of capacity lost since the year of construction (y axis), for the five representative reservoirs.
Figure 11.
Relationship between the age of the reservoir in years (x axis) and the percentage of capacity lost since the year of construction (y axis), for the five representative reservoirs.


Table 1.
Reservoirs in the Segura River Basin [24].
Table 1.
Reservoirs in the Segura River Basin [24].
| Name | Primary Use | Area (m2) | First Year of Operation | Volume (106 m3) |
|---|---|---|---|---|
| Alfonso XIII | irrigation/flood defense | 2,736,167 | 1916 | 22.0 |
| Algeciras | irrigation/flood defense | 2,337,181 | 1995 | 45.0 |
| Almadenes | hydroelectric | 16,307 | 1925 | 0.2 |
| Anchuricas | hydroelectric | 542,358 | 1955 | 6.0 |
| Argos | irrigation/flood defense | 929,776 | 1974 | 10.0 |
| Bayco | flood defense | 1,798,916 | 1997 | 9.0 |
| Boquerón | flood defense | 1,091,567 | 1999 | 13.0 |
| Boquerón-Bombeo | flood defense | 17,211 | 1999 | 0.1 |
| Camarillas | irrigation/flood defense | 2,577,069 | 1960 | 36.0 |
| Cárcabo | flood defense | 369,436 | 1992 | 3.0 |
| Cenajo | irrigation/flood defense | 17,283,221 | 1960 | 437.0 |
| Charcos (Los) | flood defense | 501,719 | 2001 | 4.0 |
| Cierva (La) | irrigation/flood defense | 357,991 | 1929 | 7.0 |
| Crevillente | irrigation | 814,261 | 1985 | 13.0 |
| Doña Ana | flood defense | 238,776 | 1993 | 3.0 |
| Fuensanta | irrigation/flood defense | 8,850,706 | 1933 | 210.0 |
| José Bautista | flood defense | 858,819 | 1999 | 6.0 |
| Judío (Del) | flood defense | 848,344 | 1992 | 9.0 |
| Mayés | irrigation | 128,607 | 1980 | 2.0 |
| Moratalla | flood defense | 571,464 | 2002 | 5.0 |
| Moro | flood defense | 395,834 | 1989 | 63.0 |
| Morrón (Del) | flood defense | 15,050 | 1987 | 0.1 |
| Novia (La) | hydroelectric | 60,280 | 1955 | 1.0 |
| Ojós | irrigation | 446,651 | 1978 | 1.0 |
| Pareton | flood defense | 36,186 | 1713 | 0.1 |
| Pedrera | irrigation | 12,268,805 | 1985 | 246.0 |
| Pliego | flood defense | 1,228,837 | 1993 | 10.0 |
| Puentes (Nueva) | irrigation/flood defense | 5,617,707 | 2000 | 26.0 |
| Risca (La) | flood defense | 460,573 | 2002 | 2.0 |
| Rodeos (Los) | flood defense | 1,655,862 | 2000 | 14.0 |
| Santomera | flood defense | 2,829,711 | 1967 | 26.0 |
| Taibilla | water supply | 700,719 | 1979 | 9.0 |
| Taibilla- Toma | water supply | 17,963 | 1955 | 1.0 |
| Talave | irrigation/flood defense | 2,610,571 | 1918 | 35.0 |
| Torrecilla (La) | flood defense | 23,930 | - | 0.1 |
| Valdeinfierno | irrigation/flood defense | 2,101,634 | 1806 | 13.0 |
Table 2.
The sub-basins and reservoirs selected in the SRB [24].
Table 2.
The sub-basins and reservoirs selected in the SRB [24].
| Watershed Reservoir | Catchment Area (km2) | Coronation Height of the Reservoir (m) 1 | Maximum Altitude of the Catchment Area (m) 1 | Reservoir Surface Area (ha) |
|---|---|---|---|---|
| Valdeinfierno | 429 | 700.40 | 2045 | 199 |
| Puentes | 1425 | 474.00 | 2045 | 366 |
| Santomera | 348 | 101.50 | 1372 | 263 |
| Alfonso XIII | 834 | 302.68 | 2081 | 223 |
| Cárcabo | 36 | 259.87 | 849 | 8 |
1 Meters above the sea level in Alicante.
Table 3.
Specifications of unmanned aerial vehicle (UAV) components (Droning D-820).
| Part Name | Model/Number | Specifications | Function |
|---|---|---|---|
| Chassis | Droning/D-820 | Carbon fiber | Structure |
| Motors | T-Motor/Air 40A | KV700 | Main actuator |
| Propellers | T-Motor/16x5.4 | Carbon fiber | Propulsion |
| Microcontroller | Pixhawk 3.2.1 | Open hardware | Flight control |
| Battery (LiPo) | Tattu 22.5V | 25C 22,000 mAh | Power supply |
| Radio receiver | 3DR | 433 MHz 100 Mw | Radio command |
| GPS | Ublox M8N | Magnetometer 3D | GPS antenna |
| Taranis X 9D | FR-Sky | 2.4 Ghz | Control station |
| Software | APM | 3.2 | Mission planner |
| Sony | QX1 | 20.1 MP | Camera |
Table 4.
Specifications of unmanned surface vehicle (USV) components (Mambo-IMIDA).
| Part Name | Model/Number | Specifications | Function |
|---|---|---|---|
| Boat hull | Inntelia | Fiberglass | Navigation |
| Motors | BlueRobotics | Thruster-R1 | Main actuator |
| Propellers | T-200 | 350 W | Propulsion |
| Microcontroller | Pixhawk 3.2.1 | Open hardware | Navigation control |
| Battery (LiPo) | Tattu 22.2V | 15C 4500 mAh | Power supply |
| Radio receiver | UHF | 1 watt (−30 dB) | Radio command |
| GNSS | EMLID | NMEA 0183 | GPS antenna |
| Graupner | 12 ch. PCM | 2.4 Ghz | Control station |
| Software | APM | 3.2 | Mission planner |
| Echo sounder | Airmar/DST 700 | 50/200 kHz | Echo sounder |
Table 5.
Specifications of remote operated vehicle components (SIBIU-IMIDA).
| Part Name | Model/Number | Specifications | Function |
|---|---|---|---|
| Chassis | Nido Robotic/Sibiu | HDPE | Navigation |
| Motors | BlueRobotics | Thruster-R1 | Main actuator |
| Propellers | T-200/8 | 350 W | Propulsion |
| Microcontroller | Pixhawk 3.2.1 | Open hardware | Navigation control |
| Battery (LiPo) | Tattu 16 V | 4S 10,000 mAh | Power supply |
| Interface | Blue Robotics | Fathom-S | Control command |
| Microcomputer | Raspberry Pi/3 | 64 bit quad core | Processing |
| GPS | 3DR | NMEA | GPS antenna |
| Joystick/cable | Polyethylene/kevlar | 100 m | Control station |
| Software | QGroundControl | 3.2.4 | Mission planner |
| Echo sounder | Airmar/DST 700 | 50/200 kHz | Bathymetry |
| Camera | 700 TVL | 5 MP | Inspection |
| AtlasScientific | ENV-SDS | DO, EC, pH, ORP and Tª | Water quality |
Table 6.
Reservoirs of the SRB with their updated volumes.
| Reservoir Name | Height of the Coronation 1 (m) | Updated Volumen (106 m3) | Date of Updating | Updating Method |
|---|---|---|---|---|
| Alfonso XIII | 303 | 15.24 | 10/22/16 | LiDAR + USV + UAV |
| Argos | 415 | 7.21 | 10/22/16 | LiDAR + USV + UAV |
| Bayco | 697 | 12.55 | 11/16/09 | LiDAR |
| Boquerón | 606 | 14.24 | 11/16/09 | LiDAR |
| Boquerón-Bombeo | 538 | 0.02 | 11/16/09 | LiDAR |
| Cárcabo | 260 | 2.65 | 10/22/16 | LiDAR + USV + UAV |
| Del Morrón | 596 | 0.05 | 11/18/09 | LiDAR |
| Doña Ana | 379 | 1.64 | 10/25/09 | LiDAR |
| Embalse de Pliego | 362 | 8.13 | 10/23/09 | LiDAR |
| José Bautista Martín | 139 | 5.79 | 11/18/09 | LiDAR |
| Judío | 246 | 8.17 | 10/22/16 | LiDAR + USV + UAV |
| La Risca | 1080 | 2.31 | 12/04/09 | LiDAR |
| La Torrecilla | 369 | 0.10 | 10/25/09 | LiDAR |
| Los Charcos | 746 | 1.21 | 11/16/09 | LiDAR |
| Los Rodeos | 135 | 14.01 | 10/25/09 | LiDAR |
| Moratalla | 350 | 5.35 | 11/22/09 | LiDAR |
| Presa del Paretón | 216 | 0.01 | 11/10/09 | LiDAR |
| Puentes | 474 | 27.19 | 09/06/16 | LiDAR + USV + UAV |
| Rambla del Moro | 235 | 4.43 | 11/22/09 | LiDAR |
| Santomera | 102 | 22.69 | 10/22/16 | LiDAR + USV + UAV |
| Valdeinfierno | 700 | 7.70 | 09/06/16 | LiDAR + UAV |
1 Updated reservoirs bathymetries of the Segura River Basin. The height is referred to the sea level in Alicante.
Table 7.
Accumulated storage capacity loss of five representative reservoirs of the SRB.
| Reservoir Name | Year of Construction | Age (years to 2016) | Design Volume (106 m3) | Current Volumen (106 m3) | Accumulated Los (%) | Annual Loss Rate (%) |
|---|---|---|---|---|---|---|
| Valdeinfierno | 1897 | 119 | 13.00 | 7.70 | 40.77 | 0.34 |
| Puentes | 2000 | 16 | 29.30 | 27.19 | 7.20 | 0.45 |
| Santomera | 1967 | 49 | 26.62 | 22.69 | 14.76 | 0.30 |
| Alfonso XIII | 1916 | 100 | 22.00 | 15.24 | 30.72 | 0.31 |
| Cárcabo | 1992 | 24 | 3.00 | 2.65 | 11.67 | 0.49 |
Table 8.
Accumulated capacity loss in three reservoirs (1976) [26].
Table 8.
Accumulated capacity loss in three reservoirs (1976) [26].
| Reservoir Name | Year of Construction | Age (years) | Design Volume (106 m3) | Volume in 1976 (106 m3) | Accumulated Loss 1 (%) | Annual Loss Rate (%) | Erosion in Basin Mg/ha/year |
|---|---|---|---|---|---|---|---|
| Valdeinfierno | 1897 | 79 | 25.00 | 14.19 | 43.24 | 0.14 | 11.0 |
| Puentes | 1884 | 92 | 31.56 | 13.88 | 56.02 | 0.33 | 6.0 |
| Alfonso XIII | 1916 | 60 | 42.00 | 21.65 | 48.45 | 0.34 | 10.2 |
© 2019 by the authors. Licensee MDPI, Basel, Switzerland. This article is an open access article distributed under the terms and conditions of the Creative Commons Attribution (CC BY) license (http://creativecommons.org/licenses/by/4.0/).
Share and Cite
MDPI and ACS Style
Erena, M.; Atenza, J.F.; García-Galiano, S.; Domínguez, J.A.; Bernabé, J.M. Use of Drones for the Topo-Bathymetric Monitoring of the Reservoirs of the Segura River Basin. Water 2019, 11, 445. https://doi.org/10.3390/w11030445
AMA Style
Erena M, Atenza JF, García-Galiano S, Domínguez JA, Bernabé JM. Use of Drones for the Topo-Bathymetric Monitoring of the Reservoirs of the Segura River Basin. Water. 2019; 11(3):445. https://doi.org/10.3390/w11030445
Chicago/Turabian StyleErena, Manuel, Joaquín F. Atenza, Sandra García-Galiano, José A. Domínguez, and José M. Bernabé. 2019. "Use of Drones for the Topo-Bathymetric Monitoring of the Reservoirs of the Segura River Basin" Water 11, no. 3: 445. https://doi.org/10.3390/w11030445
Note that from the first issue of 2016, this journal uses article numbers instead of page numbers. See further details here.