A Simple Early Warning System for Flash Floods in an Ungauged Catchment and Application in the Loess Plateau, China


1
School of Environmental Science and Engineering, Chang’an University, Xi’an 710054, China
2
Key Laboratory of Subsurface Hydrology and Ecological Effect in Arid Region of Ministry of Education, Xi’an 710054, China
3
Department of Biological and Agricultural Engineering & Zachry Department of Civil Engineering, Texas A&M University 400 Bizzell St, College Station, TX 77843, USA
4
College of Environment and Resources, Inner Mongolia University, Hohhot 010021, China
*
Author to whom correspondence should be addressed.
Water 2019, 11(3), 426; https://doi.org/10.3390/w11030426
Submission received: 14 January 2019
/
Revised: 13 February 2019
/
Accepted: 22 February 2019
/
Published: 27 February 2019
(This article belongs to the Special Issue Water Related Disaster and Water Environment Management)
Abstract
:Under climate change, flash floods have become more frequent and severe, and are posing a danger to society, especially in the ungauged catchments. The objective of this paper, is to construct a simple and early warning system, serving for flash floods risk management in the ungauged catchments of the Loess Plateau in China, and offer a reference for flash flood warning in other areas in the world. Considering the absence of hydrological data in the ungauged catchments, the early warning system for flash floods is established by combining the regional or watershed isograms of hydrological parameters and local empirical formulas. Therein, rainfall and water stage/flow are used as warning indices for real-time risk estimation of flash flood. For early warning, the disaster water stage was first determined according to the protected objects (e.g., residents and buildings), namely the critical water stage. The critical flow (flow threshold), was calculated based on the water stage, and the established relationship between water stage and flow using the cross-sectional measured data. Then, according to the flow frequency curve of the design flood, the frequency of critical flow was ascertained. Assuming that the rainfall and the flood have the same frequency, the critical rainfall threshold was calculated through the design rainstorm with the same frequency of the design flood. Due to the critical rainfall threshold being sensitive with different soil conditions, the design flood and frequency curve of flood flow were calculated under different soil conditions, and thus the rainfall threshold was given under different soil condition for early warning of the flash flood disaster. Taking two sections in Zichang County (within the Loess Plateau) as an example, we set the rainfall and water stage/flow thresholds to trigger immediate or preparation signals for the migration of the population along the river. The application of this method to the 7.26 flood events in 2017 in China, shows that the early warning system is feasible. It is expected that this simple early warning system can provide early warnings of flash floods in ungauged catchments in the Loess Plateau and other similar areas.
1. Introduction
Flash flooding is a hydrological phenomenon that easily occurs in catchments of several hundred square kilometers, and has a short response time of a few hours or less [1,2,3]. A flash flood disaster refers to a natural disaster, such as flooding, debris flow or landslides, caused by heavy rains with a short duration in steep mountainous areas, which are mainly affected by the underlying surface conditions (e.g., poor vegetation cover), hydrological conditions, frequency of rainfall events, and human activities [4,5,6,7]. In recent years, flash flood disaster events have led to serious death and economic losses [8]. For example, the flash flood events of Lynmouth caused 34 deaths in the UK in 1952 [9], and the Aude Flood in France was responsible for the deaths of 35 people in 1999 [10]. In China, flash flood disasters are serious, because mountainous and hilly areas account for two thirds of the land and, in 2017 alone, the disaster in Yulin City led to the deaths of 12 people and hundreds of livestock with direct economic losses of 1.03 billion USD, agricultural losses of 91.6 million USD, industrial and mining losses of 0.185 billion USD, infrastructure losses of 0.402 billion USD, public welfare facilities losses of 94.9 million USD, and family property losses of 0.254 billion USD [11]. Therefore, it is of utmost importance to provide early warnings for flash floods to avoid, or to reduce their negative impacts.
The definition of a flash flood is not uniform worldwide. Some researchers believe that flash floods include floods, landslides, and debris flow, and others consider a rainfall-induced flash flood as a flash flood [12,13]. For the purpose of this research, only rainfall-induced flash floods in a small catchment were considered in this study. It is well known that a short-time concentration and a small catchment size create difficulties for flash flood forecasting and early warning systems [5]. The goal of early warnings for flash floods is to determine whether a flood caused by heavy rainfall will lead to disaster in a catchment. Therefore, the starting point of effective early warnings for flash floods is an accurate threshold (rainfall or water stage/flow) that triggers the determination of the disaster with a useful lead-time. To date, many early warning systems or methods for flash flood have been proposed, such as ALERT (Automated Local Evaluation in Real Time) in Australia, FFG (Flash Flood Guidance) or GFFG (Gridded FFG) in Northern America, and EFFS (European Flood Forecasting System) in Europe, which is well known around the world [14]. In fact, these systems or methods have basically been developed with modifications and development into two basic methods, i.e., flow comparison methods (FCMs), such as the distributed hydrologic model and frequency-based method in ALERT, and rainfall comparison methods (RCMs), such as FFG and EFFS, which are used to determine whether rainfall events are expected to cause a flash flood disaster [12,14,15,16,17]. The flow comparison method is divided into direct flow comparison and flow frequency comparison methods. The direct flow comparison method compares the modeled flow value with the observed flow threshold [12] to determine whether to publish the warning. The flow frequency comparison method is more complex than the direct method. The first step collects the historical rainfall and flood data in the catchment, obtaining a series of peak flow values that are modeled and based on the historical rainfall data [15], and plots a unique flow frequency curve of the flood peak flow. The real-time rainfall data is subsequently input into the rainfall-runoff model, in order to obtain the flood peak flow and the corresponding frequency value. These values are compared with the frequency threshold determined based on local knowledge and historical flood data [15] to decide whether the warning signal should be issued in the flash flood risk areas. The rainfall comparison method is primarily applied to convert the disaster flow into critical rainfall via the relationship between rainfall and runoff, which is ascertained by hydrological model simulation [18,19]. Furthermore, this method compares the real-time or forecasted rainfall with the critical rainfall to judge whether a flash flood disaster occurs, and to determine whether the early warning signal is issued. Taken together, it is found that a reliable flow forecasting model, or rainfall-runoff model is needed in the two methods mentioned above, in order to simulate the relationship between rainfall and runoff.
A literature review reveals that the flow forecasting models are divided into data-driven [20,21] and lumped/distributed hydrological models [22,23]. A data-driven forecasting model is based on the statistical relationship between rainfall and runoff. This type of model, including the neural network (NN) model or numerical weather prediction (NWP) model, is easier to set up and obtains better simulation results [12]. However, the data-driven model has some weaknesses. The main weakness is a limit on the length of the historical data, and the need for a long series to calibrate and verify the model. Unfortunately, this approach encounters difficulty in early warnings for flash floods because data are usually unavailable in the area where the flash flood occurs, and the relationship between rainfall and runoff is difficult to obtain using the data-driven model.
Lumped hydrological models are often applied in flow forecasting due to their high computational efficiency and low data requirement. For example, the Sacramento soil moisture accounting model (SCA-SMA) was applied to flash flood guidance by the National Weather Service (USA) [24], and the HBV model (Hydrologiska Byråns Vattenbalansavdelning model) was used to forecast flash floods in Slovenia [22]. Additionally, scholars proposed a lumped hydrological model that combined isohyetal rainfall maps, kinematic waves, and rational methods to forecast flash floods [23]. Of course, the lumped hydrological model also contains drawbacks when it is used in flash flood forecasting, including coarse resolution, the need for long-term historical data to calibrate, and the inapplicability to ungauged catchments [12]. For this reason, certain distributed hydrological models were proposed to overcome the weaknesses of the lumped hydrological model.
Scholars presented a distributed hydrological model known as MARINE (model of anticipation of runoff and inundations for extreme events), which is suitable for real-time forecasting and can be adjusted based on the needs of the forecaster [25]. England et al. proposed the TREX model (two-dimensional, runoff, erosion, and export), which can produce a better result with limited data [26]. However, the distributed hydrological model displays shortcomings when used to forecast flash floods, such as low computational efficiency and notably large requirements for higher quality data of the catchment (DEM, land use, soil characteristics, etc.) [27]. Overall, most of the hydrological models (including lumped and distributed hydrological models) perform well in flash flood forecasting, especially in humid areas, but often fail in arid and semiarid areas where complex hydrological and climatic processes make forecasting difficult and impact the simulation effect [12].
The Loess Plateau in China is a high-incidence area for flash floods. However, the applicability of the presented methods for flash flood forecasting and risk management is limited in quite a few catchments due to the lack of runoff data. In this paper, we combined the FCM and the RCM approaches to ascertain the thresholds of rainfall and flow based on the frequency of critical flow and the empirical formula and isograms of hydrological parameters in the study area. Specially, the disaster water stage was firstly determined according to the protected objects (e.g., residents and buildings), namely critical water stage, and the critical flow (flow threshold) was calculated based on the water stage and the established relationship between water stage and flow, using the cross-sectional measured data. Then, according to the flow frequency curve of the design flood, the frequency of critical flow was ascertained. Assuming that the rainfall and flood have the same frequency, the critical rainfall threshold was calculated through the design rainstorm with the same frequency of the design flood. Therein, the design rainstorm with different frequencies (1%, 2%, 5%, 10%, 20%) can be obtained throughout the regional isohyetal rainfall maps and local empirical calculation approach of design rainstorm. Accordingly, the design floods with different frequencies were calculated based on the design rainstorm by using the instantaneous unit hydrograph method and empirical formulas developed by professionals. Considering the concentration-time and composition of floods, the flow corresponding to the peak rainfall may not be the peak flow value on a section when certain emergency events occur. This requires that we should not only employ the flow or rainfall threshold as an early warning index for resident migration, but also consider them together in the early warning system. Besides, in order to reserve more time to migrate, another set of rainfall and flow indices are required to serve as the preparation for migration warnings. Thus, two sets of thresholds (immediate migration and preparation for migration) have been constructed in this study for the early warning of flash floods. The values of critical rainfall and water stage/flow threshold were set as the index for immediate migration. The flow/water stage index for the preparation for migration was set as a value corresponding to half an hour before the occurrence of the flow/water stage threshold. And the rainfall index for the preparation for migration can be calculated based on the preparation index for migration in flow. The early warning signal for preparation for migration was issued when the rainfall or water stage/flow at the gauging section reaches the threshold. In summary, we constructed an early warning system of flash floods for the preparation and immediate migration based on the early warning indices of rainfall and water stage/flow. Considering that the critical rainfall value is highly sensitive to different wet and dry soil conditions [28,29], the early warning indices of rainfall in different soil-water conditions were calculated, which makes the early warning system more reasonable and applicable.
In this paper, an early warning system for flash flood disasters is proposed and established by selecting Zichang County in Shaanxi Province as a study area. The 7.26 floods in Yulin City, Shaanxi Province in 2017 were simulated as test events to determine the effectiveness of this early warning system for flash floods in the Loess Plateau in China.
2. Study Area
The Loess Plateau is characterized by dryness [30,31] and low rainfall [32], where the soil water content is usually low, and rainfall events frequently have short duration and high intensity [33,34]. The distribution of rainfall is spatially and temporally uneven [35]. The rainfall with less than 60 min duration accounts for 50% of the total rainfall events, and the rainfall with less than 180 min duration accounts for 74.6% [33], and the duration of runoff production does not exceed six hours. The Loess Plateau consists of diverse landforms (i.e., hilly and gully areas in the north, broken highlands in the east and a highland area in the south), which have deep soil layers and poor vegetation. Thus, the groundwater is buried deep in these areas, and the zone of aeration cannot reach saturation. The mode of runoff generation mechanism is infiltration-excess runoff [32].
Zichang County (109°11′–110°01′ E, 36°59′–37°30′ N) is located in the middle of the Loess Plateau, with a semi-arid continental and monsoonal climate that has low annual rainfall and obvious seasonal changes [36]. The average annual precipitation is 489.5 mm, the maximum annual precipitation is 769.6 mm, and the minimum precipitation is 279.6 mm. The precipitation primarily occurs in the wet season from July to September, and the cumulative precipitation is 297.9 mm in the wet season, accounting for 60.9% of the average annual precipitation. The rivers in this county belong to the Yellow River water system, which includes the Qingjian River, Wuding River, and Yan River, and the total catchment area is 2395.36 km2. Among the catchment areas, the Qingjian River covers 1631.1 km2, the Wuding River covers 759 km2, and the Yanhe River covers 5.26 km2. These rivers in Zichang County are fed by both precipitation and groundwater discharge throughout the year in which precipitation dominates. Affected by the typical topographical features in the Loess Plateau, e.g., large slopes and serious loss of topsoil, natural disasters such as flash floods and debris flows are easily formed with the occurrence of a high-intensity rainstorm.
Flash flood disasters have occurred several times (1986, 1989, 1990 and 2002) in Zichang County, causing dozens of deaths and large economic losses. The flash flood disaster caused by the rainstorm in Yulin from 25 to 26 July 2017, led to the death of 12 people and hundreds of livestock [11]. A relatively high peak flow occurred in Zichang County, but did not create a disaster because the center of the rainstorm was located over Suide County, Yulin. This flash flood event supplied a good foundation for the verification of this early warning system. The early warning system for flash floods was applied to this flood event. In this study, the early warning system for flash floods was tested with two disaster prevention objects (Anding village and Qiangjiawan village) distributed along the rivers in Zichang County. The prevention object distribution is shown in Figure 1.
Anding village is located along the Qingjian River. The longitude and latitude of the gauging section are 109°30′15″ E and 37°10′33″ N, respectively. The catchment area of the gauging section upstream is 495.6 km2, with the main channel length of 39.65 km and a slope of 4.9‰.
Qiangjiawan village is located along the Qingjian River. The longitude and latitude of the gauging section is 109°35′32″ E, 37°09′55″ N. The catchment area of the upstream gauging section is 627.64 km2, with the main channel length of 47.90 km and a slope of 4.1‰.
3. Early Warning System for Flash Flood Disasters
3.1. Key Concepts
3.1.1. Water Stage of a Disaster
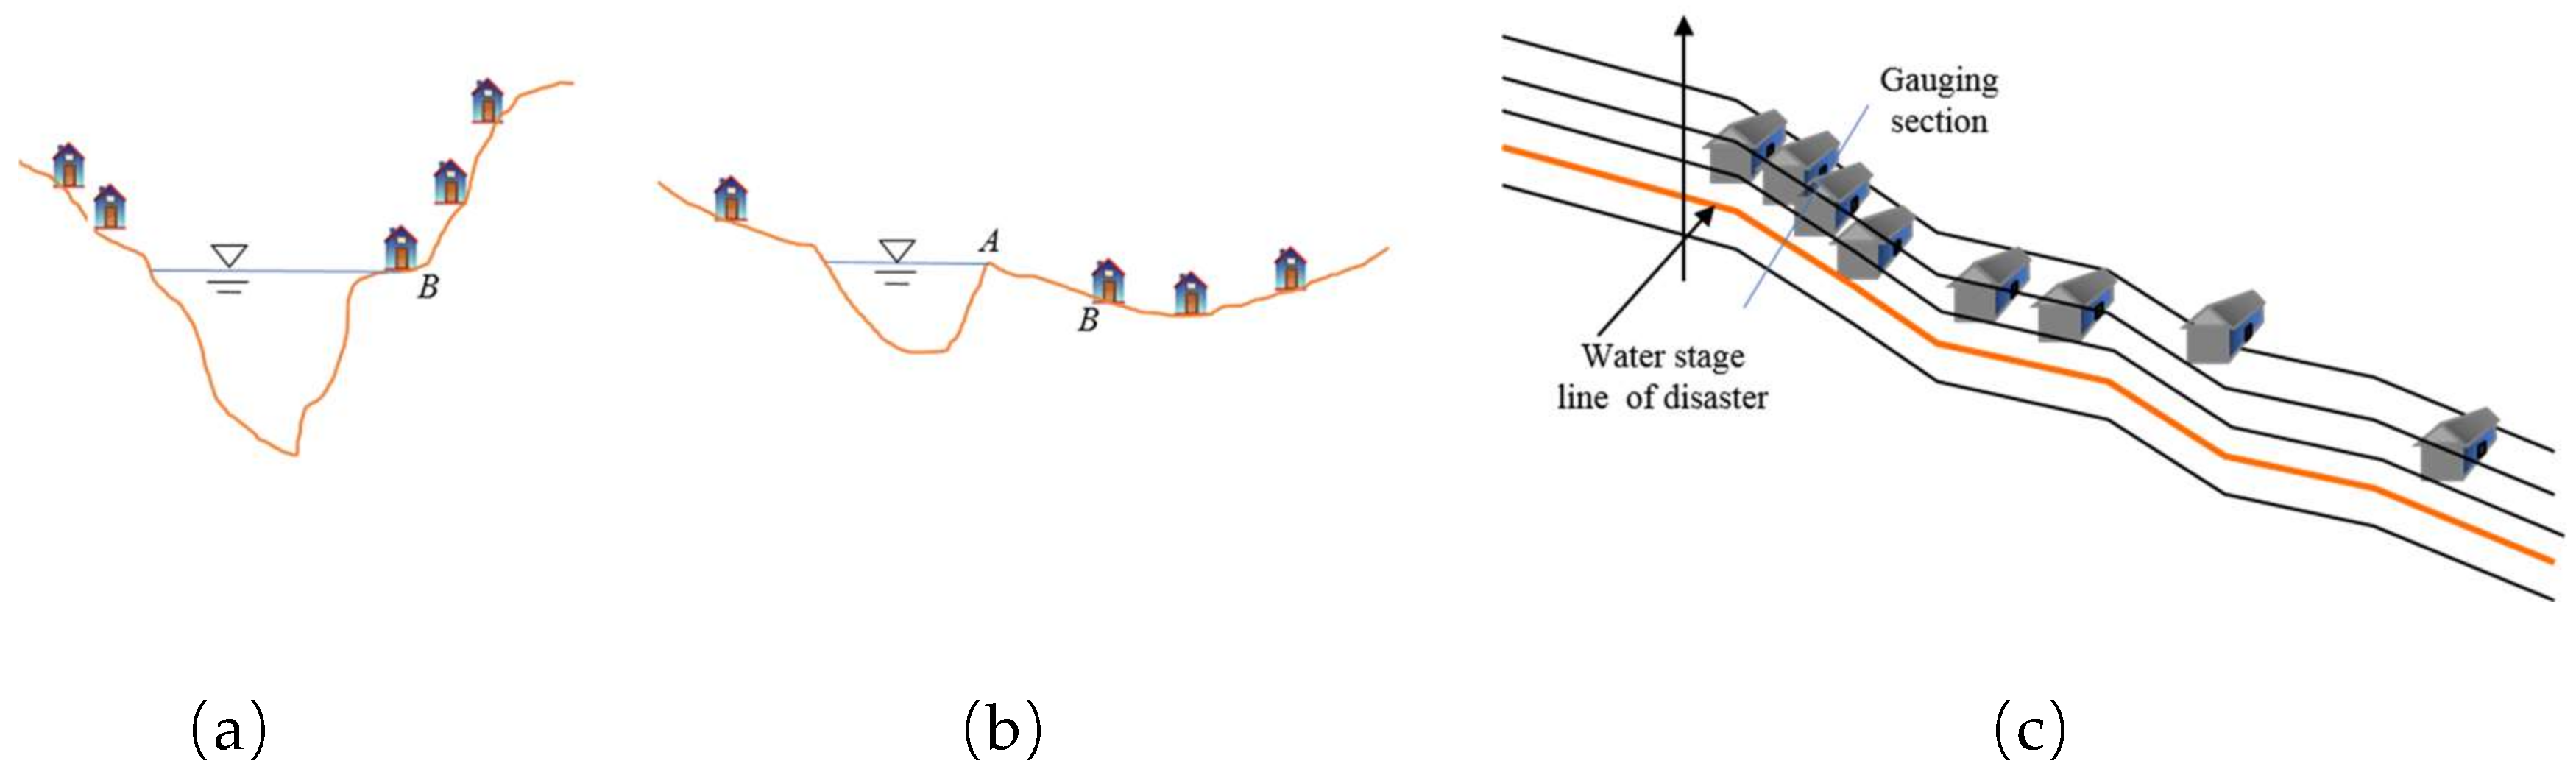
The water stage of a disaster refers to the highest stage that a flood can reach without a disaster occurring. This critical water stage was determined based on the topographical conditions, locations, elevations of protected objects (e.g., residents and buildings), and historical flash flood data. The determination of the critical water stage can be divided into two scenarios. One scenario is shown in Figure 2a, where the floor elevation of house B is treated as the water stage of a disaster. The other scenario is shown in Figure 2b, where the water stage of a disaster cannot be set to the floor elevation of house B, because the disaster occurs when the water stage exceeds the elevation of point A. Therefore, the elevation of point A is the water stage of a disaster in this case. The selection of the critical cross-section and the determination of the critical water stage must consider all of the protected objects along the river, and relies on the flooded line along the longitudinal profile of the river (Figure 2c) to the design water stage.
3.1.2. Critical Water Stage/Flow
The critical water stage/flow is an early warning index. The value of the critical water stage is equal to the water stage of the disaster. Once the water stage reaches the critical water stage, residents should migrate immediately to avoid the risk of flash flooding. The calculation of critical rainfall requires the value of the critical flow, and the critical flow can be identified based on the value of the critical water stage and relationship between the water stage and flow at the gauging section.
3.1.3. Critical Rainfall
The critical rainfall is also an early warning index, which is designed to correspond to the critical water stage/flow at the gauging section under the hypothesis of the same frequency of rainfall and flood flow. In other words, the frequency of flooding corresponding to the critical water stage at the gauging section, is calculated via the flood frequency curve, and the critical rainfall value can be obtained from the rainfall frequency, which is equal to the flooding according to the hypothesis above. Also, critical rainfall values with different durations should be computed separately, because the patterns of rainstorm occurrence might be distinct in a given catchment. Considering the local characteristics of flash flooding in Zichang County, we selected various scenarios with different durations (20 min, 1 h, 2 h, and 3 h).
3.2. Design Flood Calculation
In the ungauged catchment, the design flood is generally calculated via the design rainstorm, due to the scarcity of observed data.
3.2.1. Design Rainstorm Calculation
3.2.2. Design Flood
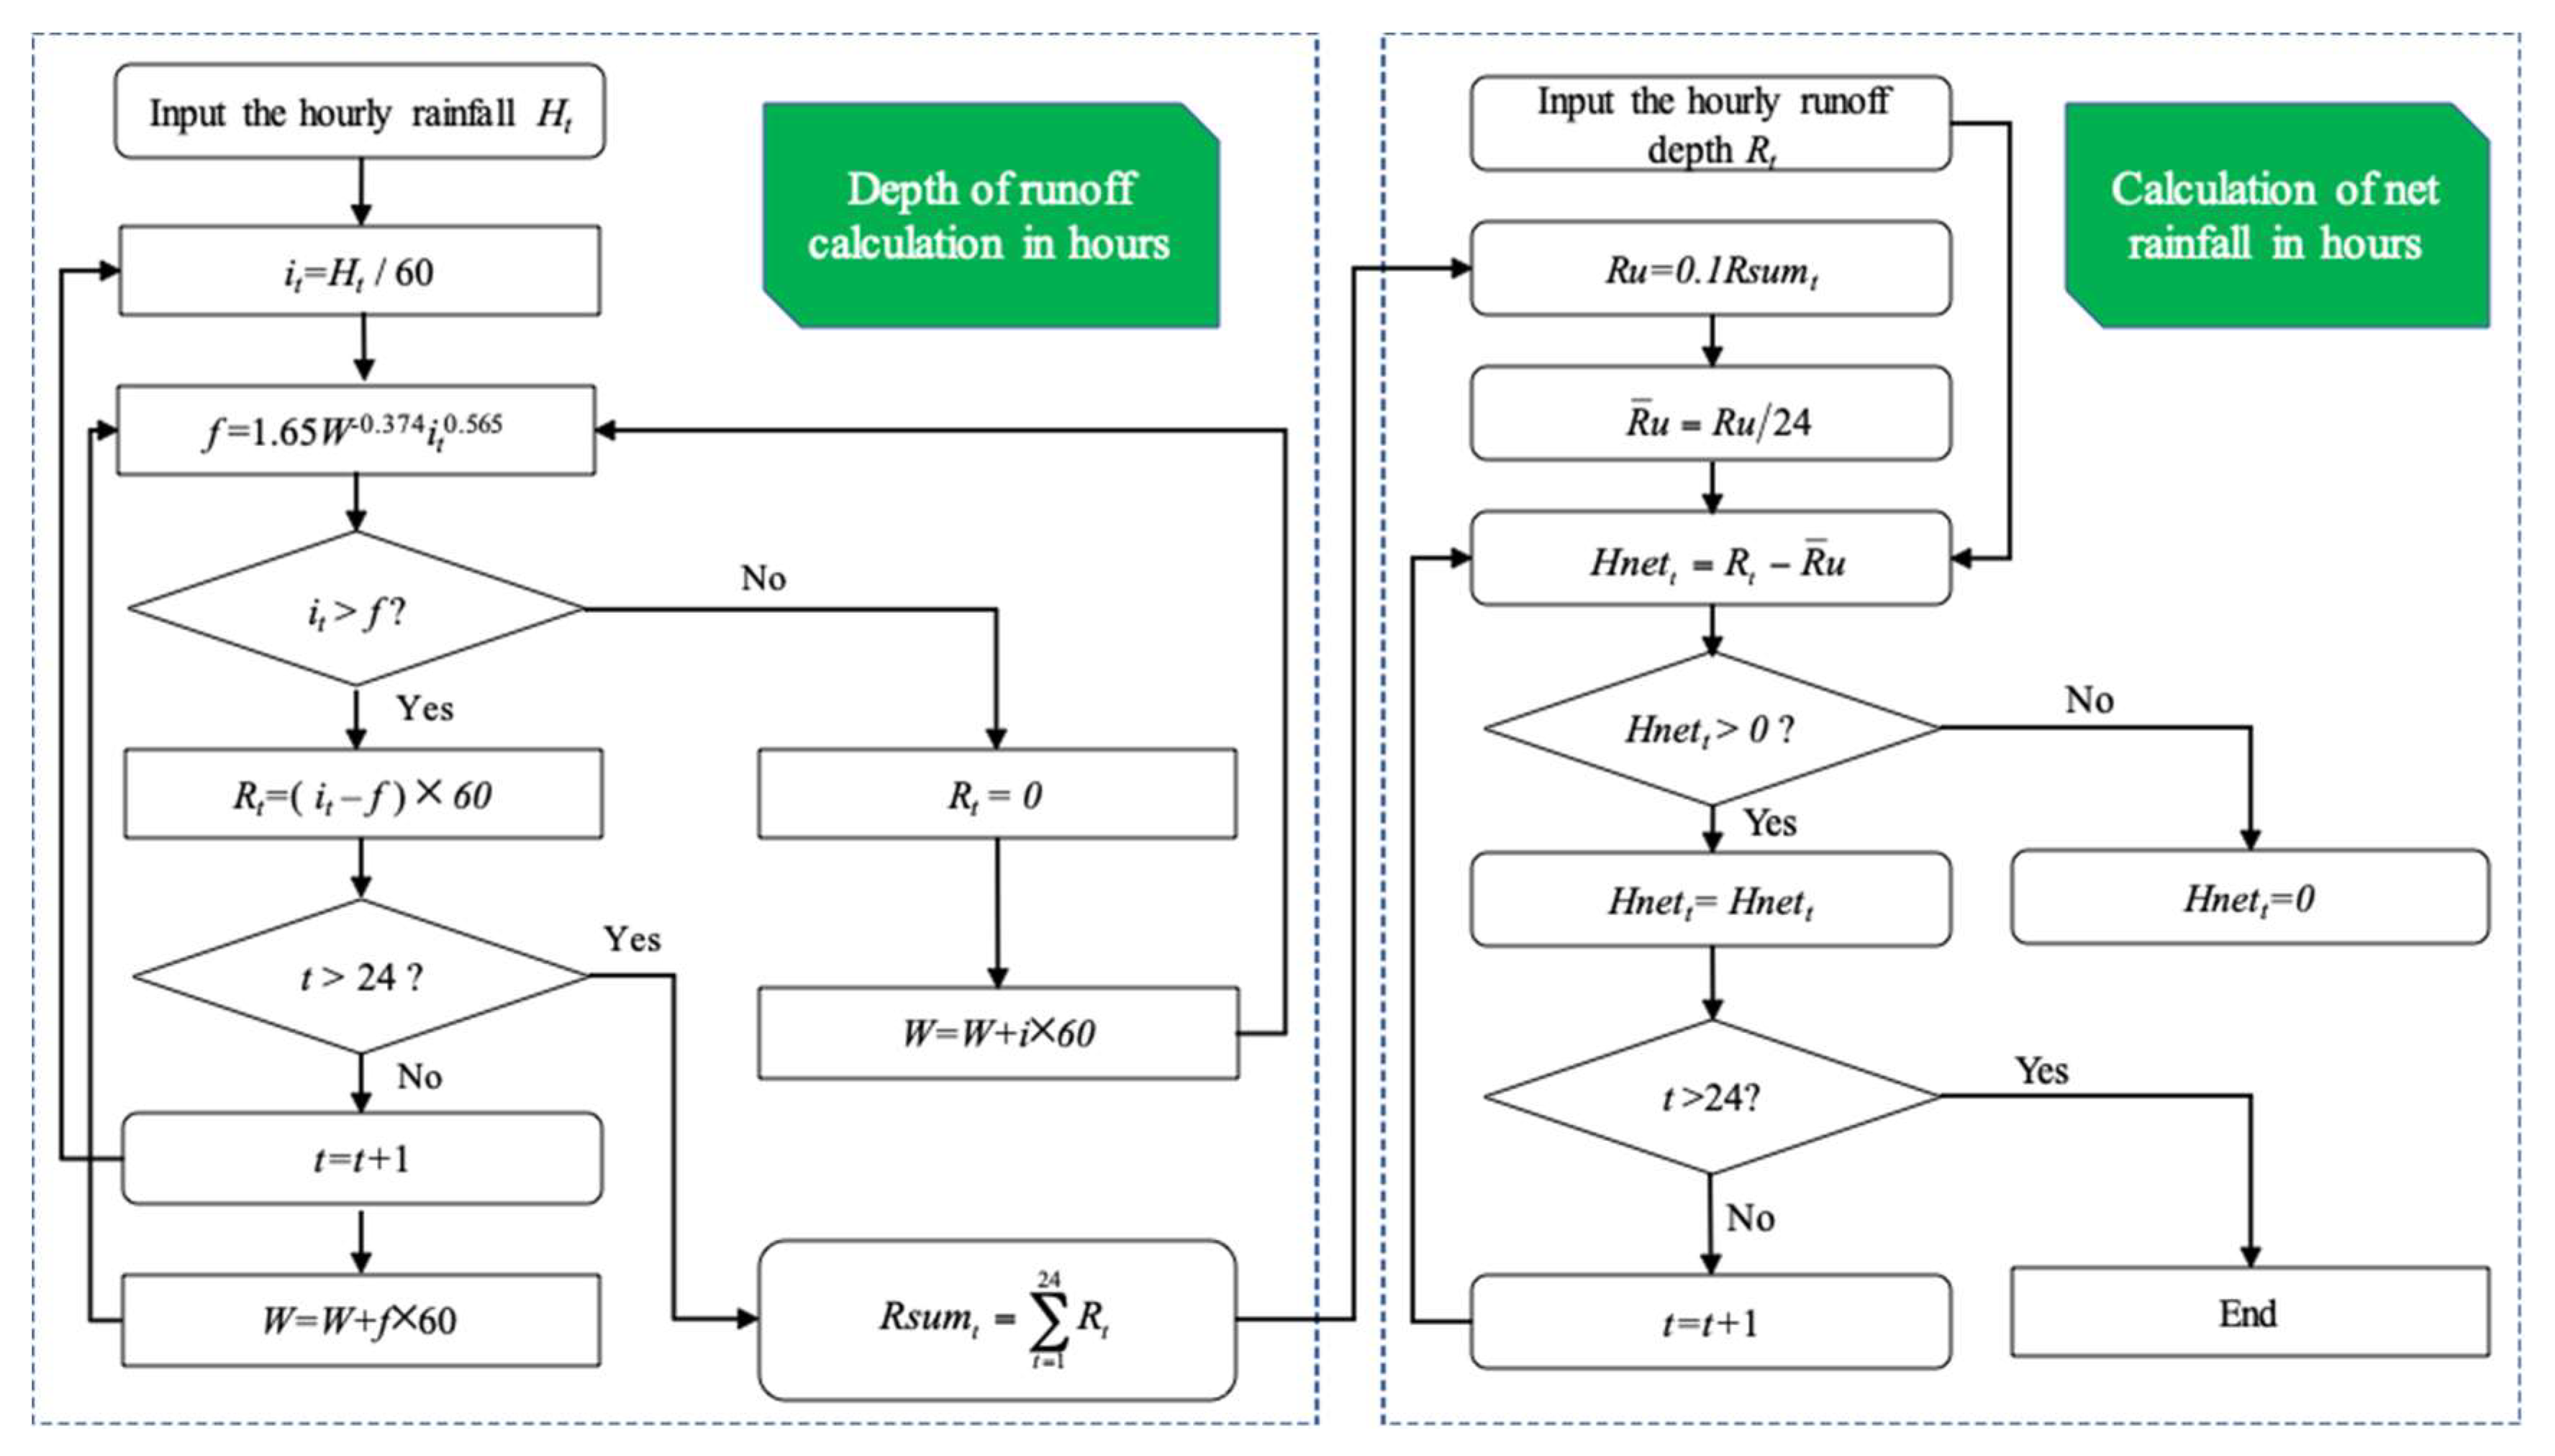
Calculation of the design flood in the ungauged catchment is usually implemented based on the design rainstorm. From the practical hydrological handbook in Yan’an city, China, it is known that design flood can be calculated using different methods, depending on drainage area size in this region. The instantaneous unit hydrograph method is recommended to calculate the design flood in this paper, because the area of the studied catchment is less than 1000 km2. Because the instantaneous unit hydrograph method requires net rainfall, the method for the design net rainfall calculation is first proposed, according to the handbook, as shown in Figure 4.
As shown in Figure 4, we compared the rainfall intensity and infiltration rate per minute to determine runoff production. The depth of runoff per minute is the positive difference when the rainfall intensity is greater than the infiltration rate, on the contrary, the surface runoff was not produced. The net rainfall per hour is equal to the difference between the runoff depth and the hourly underflow depth. The daily underflow is estimated by 0.1 times the total depth of runoff depending on regional empirical knowledge presented in the handbook, and the hourly underflow depth can be obtained by dividing the daily underflow depth into 24 h.
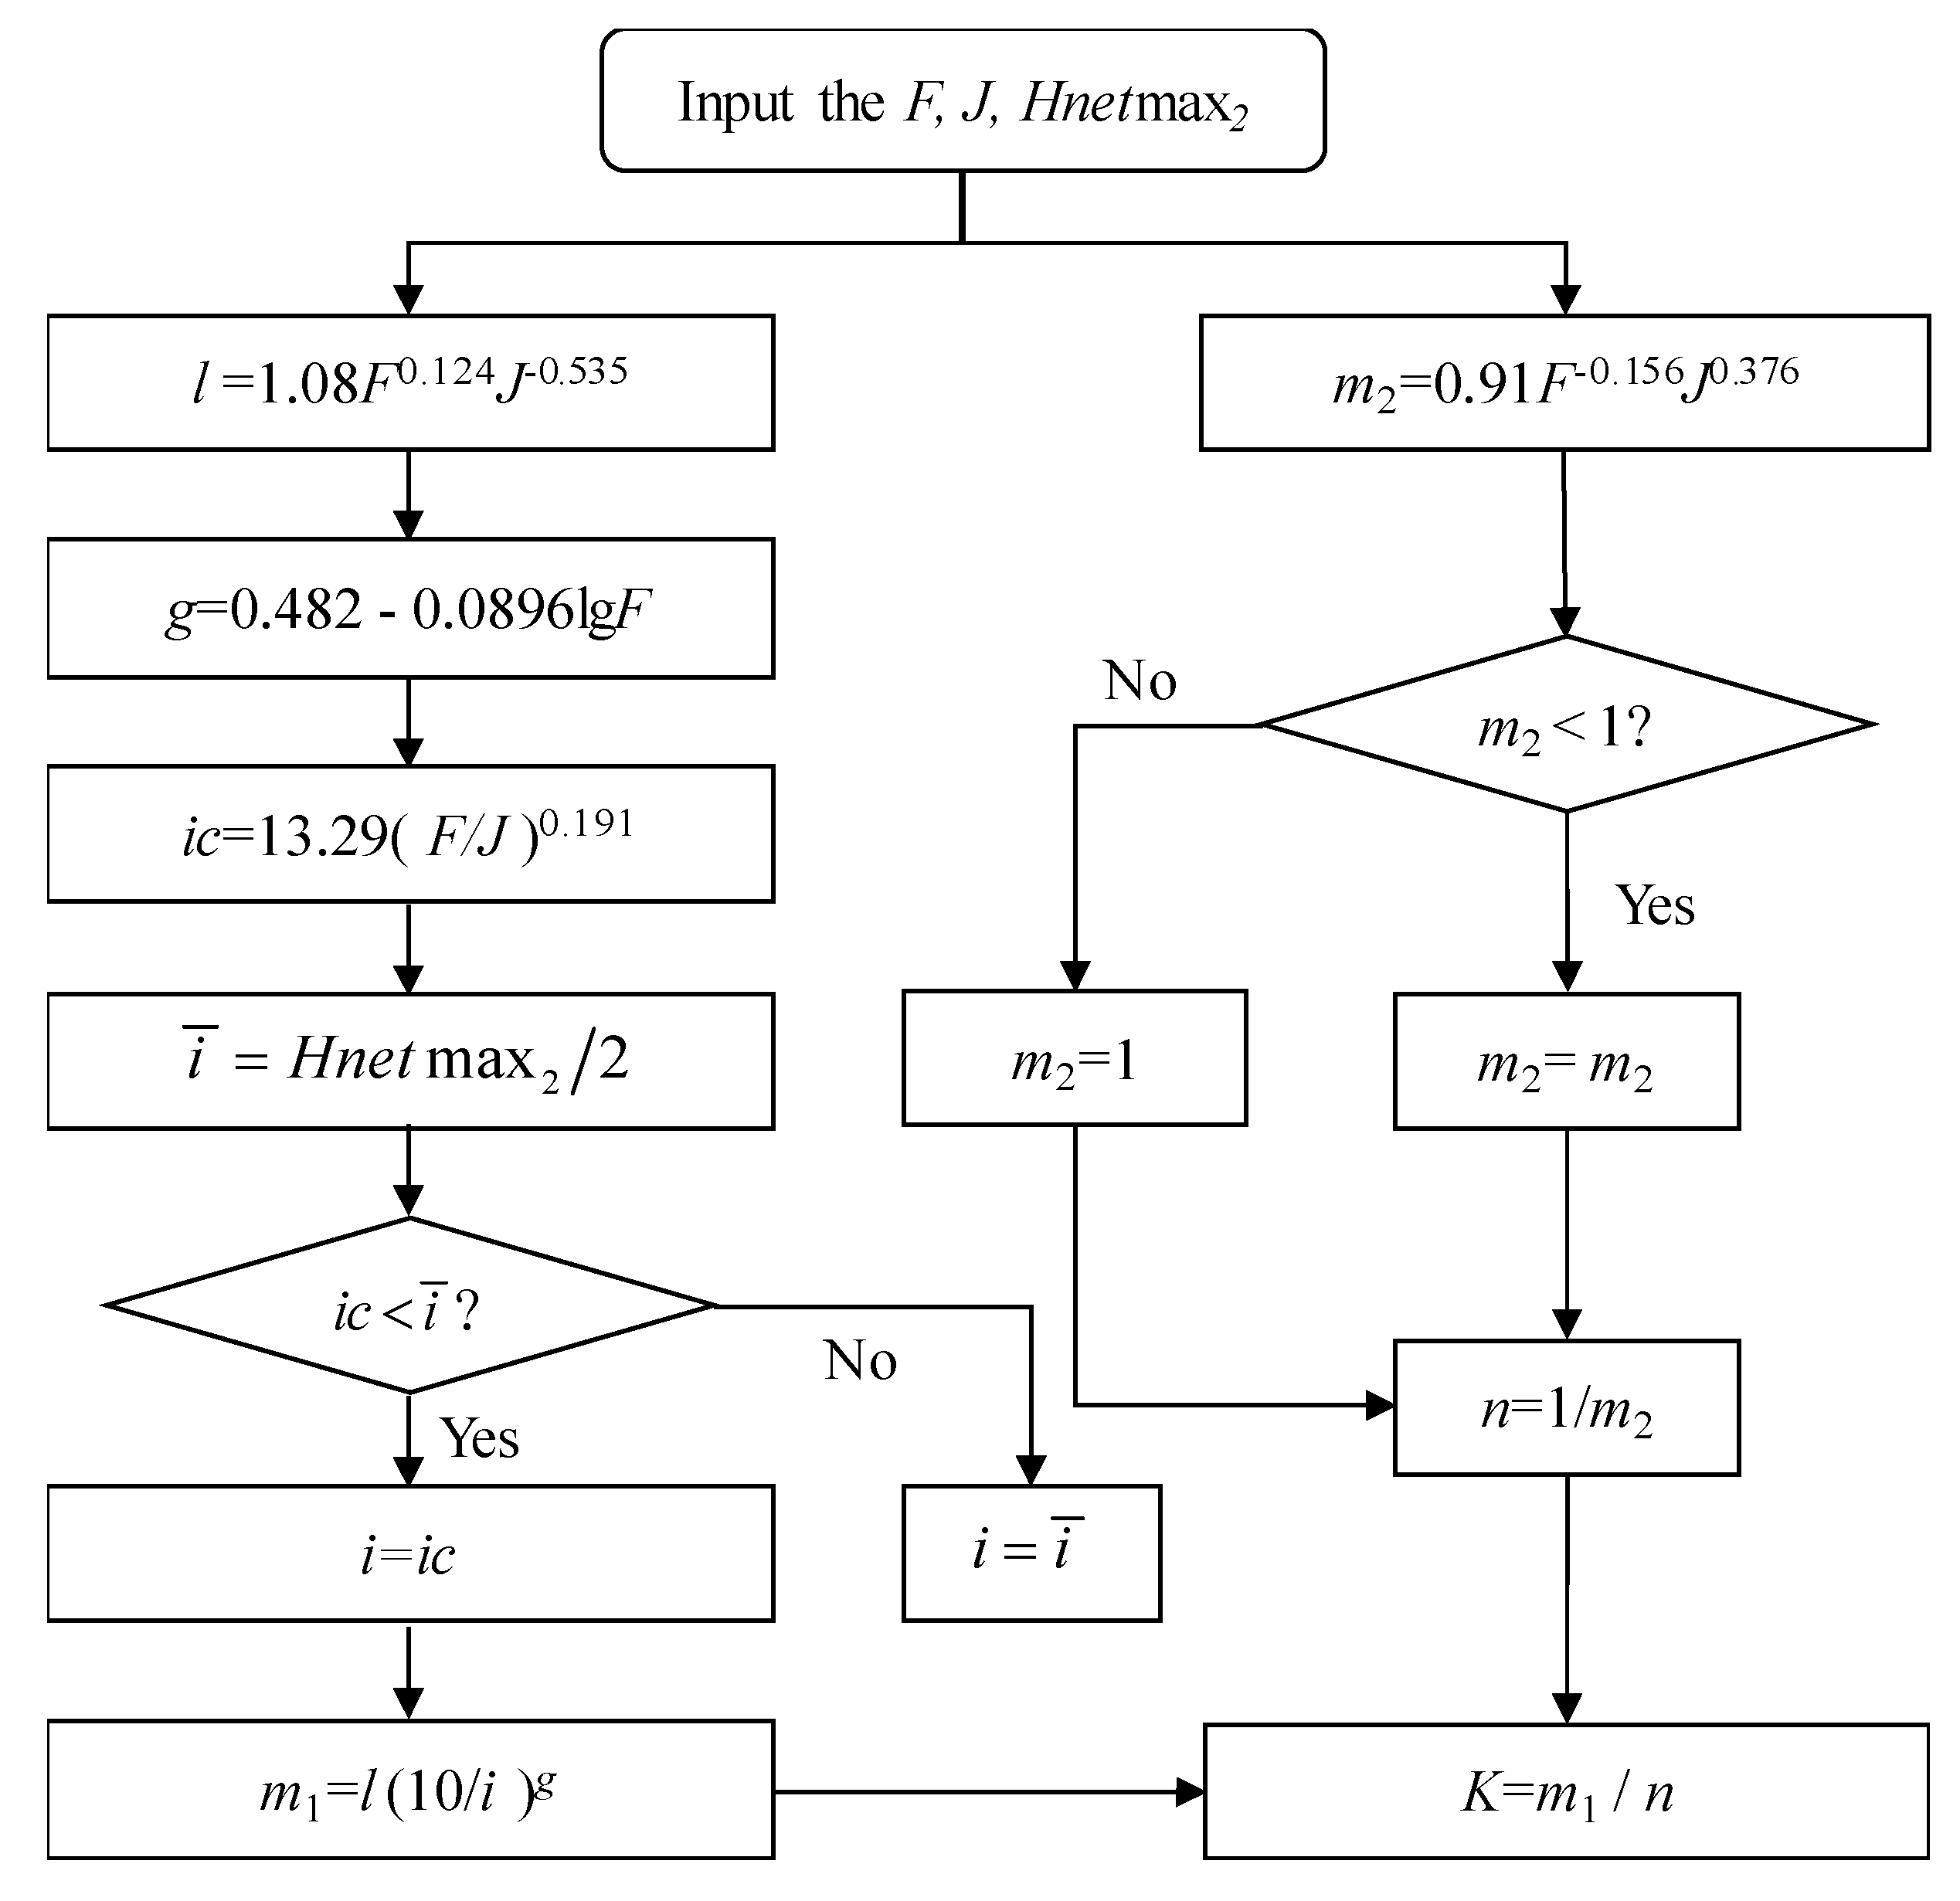
In the instantaneous unit hydrograph method, the instantaneous unit curve S(t) is required, which is checked from the S(t) curve table in the practical hydrological handbook in Yan’an city based on the parameters n and K (n is the parameter (number of linear reservoirs) in calculating the instantaneous unit hydrograph, the K is the parameter about the time of concentration). Therefore, parameters (n and K) should be calculated before drawing the curve. The practical hydrological handbook in Yan’an city gives the calculation process for n and K, shown in Figure 5.
The S(t) curve was obtained by looking up the S(t) table recorded in the practical hydrological handbook of Yan’an city based on parameters n and K. Then, shifting the S(t) curve backward with a time step of △t, we calculated the vertical difference between these two S(t) curves. The result is the unit hydrograph with a time step of △t.
where Δt represents the time step of calculation (we selected Δt with a value of 1 h) and S(t−Δt) represents an instantaneous unit hydrograph with a backward time step Δt. The net rainfall of each hour is multiplied by the values of the unit hydrograph, and the sum of net rainfall in each h (Hnetsumt) for the runoff production can be calculated. The specific method is shown in Table 2.
u (t, △t) = (1/△t) × [S(t)−S(t−△t)]
The runoff in each hour is calculated according to the following formula:
where Q(t) represents the flow in the hour t, m3/s; Hnetsumt represents the sum of net rainfall in t hour, mm; and F represents the catchment area, km2.
Q(t) = Hnetsumt × F × 103/3600
The design floods should be supplemented with the underflow. The formula used to calculate the maximum underflow is given as follows:
where Ru represents the underflow depth, mm; Qmaxu represents the maximum underflow, m3/s; Tu represents the duration of the underflow, hour; and T represents the duration of runoff, hour.
Qmaxu = 0.56(Ru × F)/Tu
Tu = 2T
The formula to calculate the underflow (Qu(t), m3/s) in time t is shown as follows:
Qu(t) = Qmaxu × t/T
Then, the hygrograph or process line of the design flood can be obtained by adding the underflow Qu(t) to the runoff process Q(t), where the maximum value is the peak flow of the flood.
3.3. Critical Rainfall Calculation by Rating Curve
3.3.1. The Rating Curve
The Manning formula is generally used to establish the relationship between the water stage and flow at a cross section [37]. It can reflect the relationship among the averaged river velocity, riverbed roughness coefficient, and channel geometry [37,38].
Considering the velocities of flow variation in the compound cross-section, the section is generally divided into selected subsections, and the area values of the cross-section, wetted perimeter, and hydraulic radius of each subsection are measured. The formula for the calculation of the gauging-section flow, is dependant on the hypothesis that the hydraulic gradient of each subsection is the same [39] is shown as follows:
where Q represents the flow, m3/s; J represents the slope; Ai represents the area of the ith subsection, m2; λi represents the hydraulic radius of the ith subsection, m; and ri represents the coefficient of roughness of the ith cross-section.
At this point, the rating curve can be plotted to represent the relationship between water stage and flow at the gauging section.
3.3.2. Calculation Method for Critical Rainfall
The hybrid approach that combines flow comparison methods (FCM) and rainfall comparison method (RCM) was adopted to calculate the critical rainfall with consideration of the complex condition of the underlying surface and the mechanism of runoff production. According to the hypothesis mentioned above, when the frequency of critical rainfall is equal to the frequency of the critical flow, the value of the critical rainfall can be calculated. The procedure can be summarized as follows:
- a. Critical flow calculation. The water stage of a disaster (critical water stage, Ec) in the gauging section is converted into the critical flow (Qc) based on the rating curve representing the relationship of the water stage-flow in the gauging section.
- b. Design flood calculation. The design flood is obtained with different frequencies (1%, 2%, 5%, 10% and 20%) via the method mentioned in Section 3.2., and the peak flow of the flood with different frequencies can be obtained.
- c. Setup the relationship between frequency and flow (Q~P). The curve of flow frequency (Q~P) is drawn, based on the peak flow of the design flood with different frequencies.
- d. Frequency calculation of critical rainfall. The frequency of the critical rainfall can be calculated through the critical flow and the frequency curve, based on the hypothesis that the frequency of critical rainfall is equal to the frequency of critical flow.
- e. Critical rainfall calculation with a given duration (one hour). The method of calculation of critical rainfall with the duration of one hour, is the same as the design point rainstorm. After lookup, the Kp value based on the frequency of critical rainfall and the value of Cv1, the critical rainfall value with 1-hour duration can be calculated with the following formula:
ip = Kp·Hmax1
- f. Critical rainfall calculation with different durations:
xd = ip d1−β
The antecedent precipitation (Pa) refers to the soil condition (wet and dry) before the rainfall occurrence. The value of Pa affects the infiltration intensity, which affects the process of runoff production, resulting in the same rainfall producing different runoff values under different soil conditions [29]. The critical rainfall value also changes accordingly. Therefore, the antecedent precipitation is generally set as three conditions (Pa = 0.2 Wm, Pa = 0.5 Wm, and Pa = 0.8 Wm; Wm is the maximum storage capacity of the watershed) to calculate the critical rainfall, and three sets of critical rainfall are obtained with different antecedent precipitation. The value of the maximum storage capacity is 100 mm in this study by considering the underlying surface conditions of Zichang County.
3.4. Early Warning Index in Water Stage/Flow
The water stage/flow is an important early warning index in this system, in which two thresholds were set for preparation and immediate migration. The preparation index for migration was set to supply residents with sufficient preparation time for migration. The preparation time was generally determined by considering the location of temporary resettlement sites and the transfer routes. Half an hour was set in this study. The index for immediate migration was proposed to warn residents to migrate immediately, in order to avoid the risk of flash flooding once the water stage reaches the critical water stage. Therefore, the value of the immediate migration index in water stage is the same as that of the critical water stage, and the immediate migration index in flow can be looked up via the rating curve. The flow index for preparation for migration is the flow for half an hour before critical flow occurrence at the gauging section, and the water stage of preparation for migration is obtained by the interpolation from the curve.
3.5. Early Warning Index in Rainfall
The other important index in the early warning system is rainfall, and two types of thresholds were similarly set: Preparation for migration and immediate migration. Here, the immediate migration index in rainfall is numerically considered as the critical rainfall, and can be calculated through the critical flood flow and flood frequency curve based on the same frequency hypothesis of rainfall and flood flow. The method of calculation of the index in rainfall of preparation for the migration is similar as that of the immediate migration index in rainfall, but the critical flood flow should be replaced in the calculation by the preparation for migration index in flow.
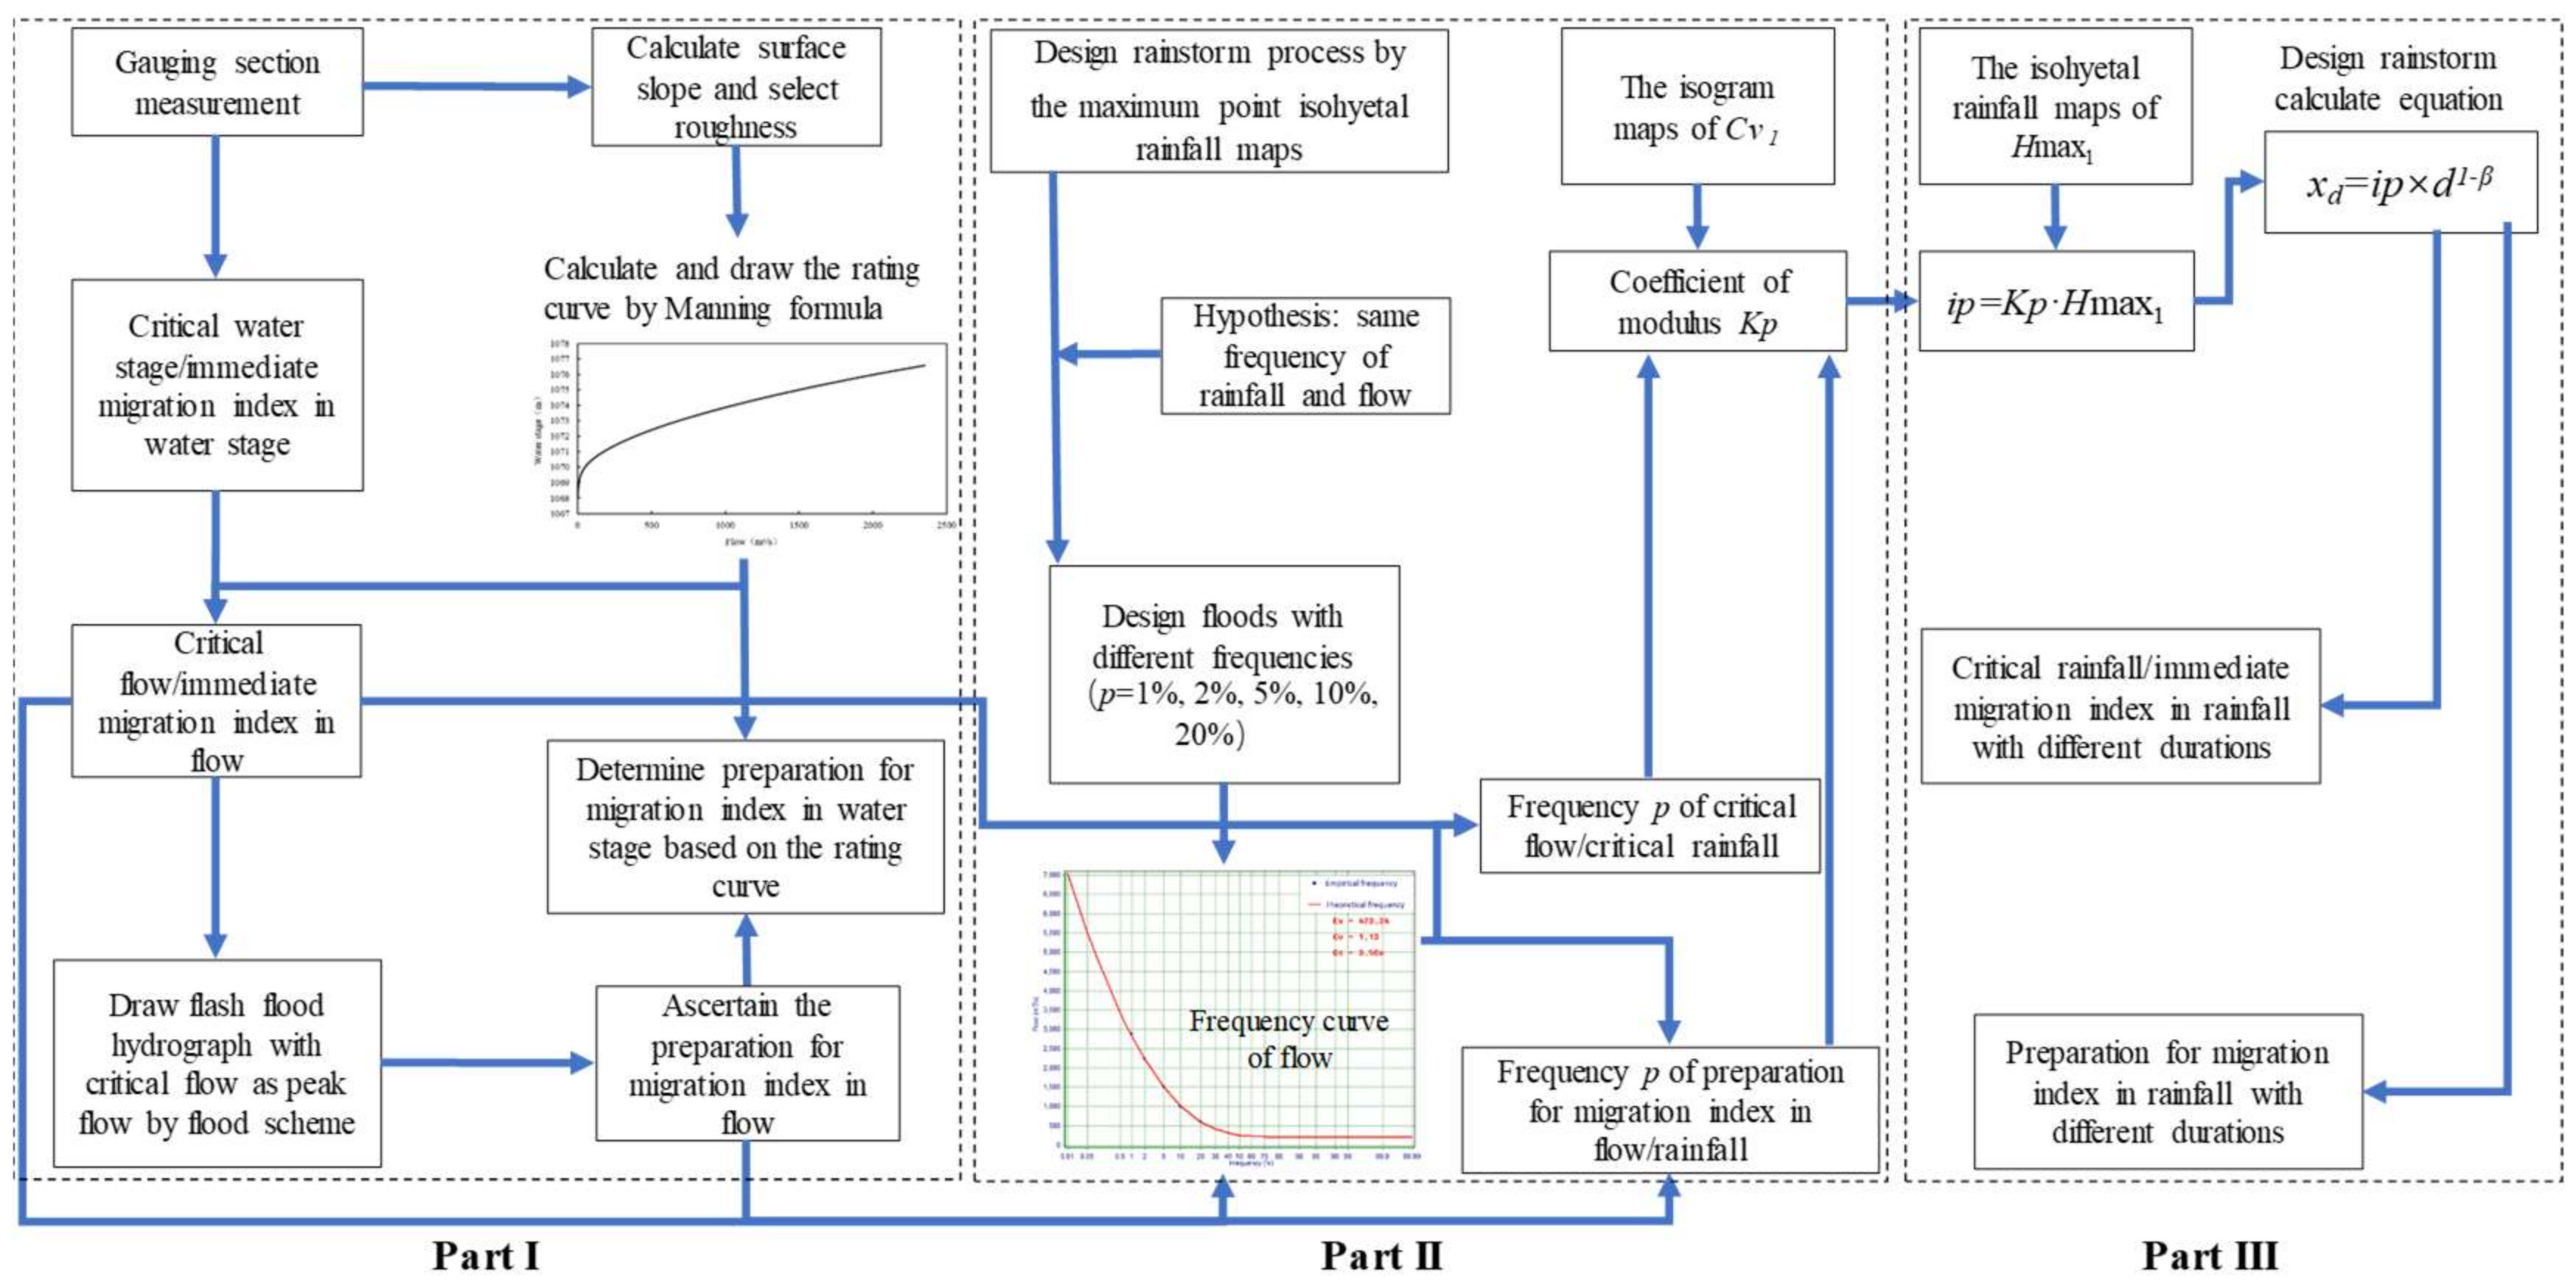
3.6. Early Warning System
The early warning system for flash floods primarily monitors the processes of rainfall and the water stage when rainstorm events occur. The early warning signals are issued when any index (rainfall or water stage/flow) reaches the set threshold, so that the residents of the disaster-prevention areas can take appropriate measures (immediate migration or preparation for migration) in order to avoid a flood disaster. The flash flood early warning system is structured as shown in Figure 6. As shown in Figure 6, the calculation of rainfall and flow/water stage warning indices in the whole warning system can be divided into three parts. Part I is to establish the relationship between water stage and flow, and determine critical flow/water stage. Part II is to calculate design flood, and determine the frequency of critical flow and rainfall (assuming that the flood and the rainstorm have the same frequency). Part III is to calculate critical rainfall. The details are introduced in the following section.
In Part I, the relationship between water stage and flow is calculated based on the measured cross-sectional data and the Manning formula, and the critical water stage in gauging section is determined by considering the topographical conditions, locations, elevations of protected objects. Then, the critical flow can be obtained based on the rating curve of water stage-flow. Besides, the preparation for migration index in flow, is calculated based on the flood hydrograph with the critical flow as peak flow. Furthermore, the preparation for migration index in water stage is ascertained according to the rating curve. In Part II, the design flood is calculated with different frequencies (p = 1%, 2%, 5%, 10%, 20%), and the frequency curve of flow is drawn corresponding to these design floods. Then the frequency of critical flow, rainfall, the preparation for migration index in flow and rainfall are determined under the assumption that the rainstorm and flood have the same frequency. In Part III, the early warning indices in rainfall are calculated based on the frequency of index and the computational formula.
4. Results
The early warning index for prevention objects (Anding village and Qiangjiawan village) was calculated, and the early warning system was established in Zichang County.
4.1. Design Rainstorm and Floods
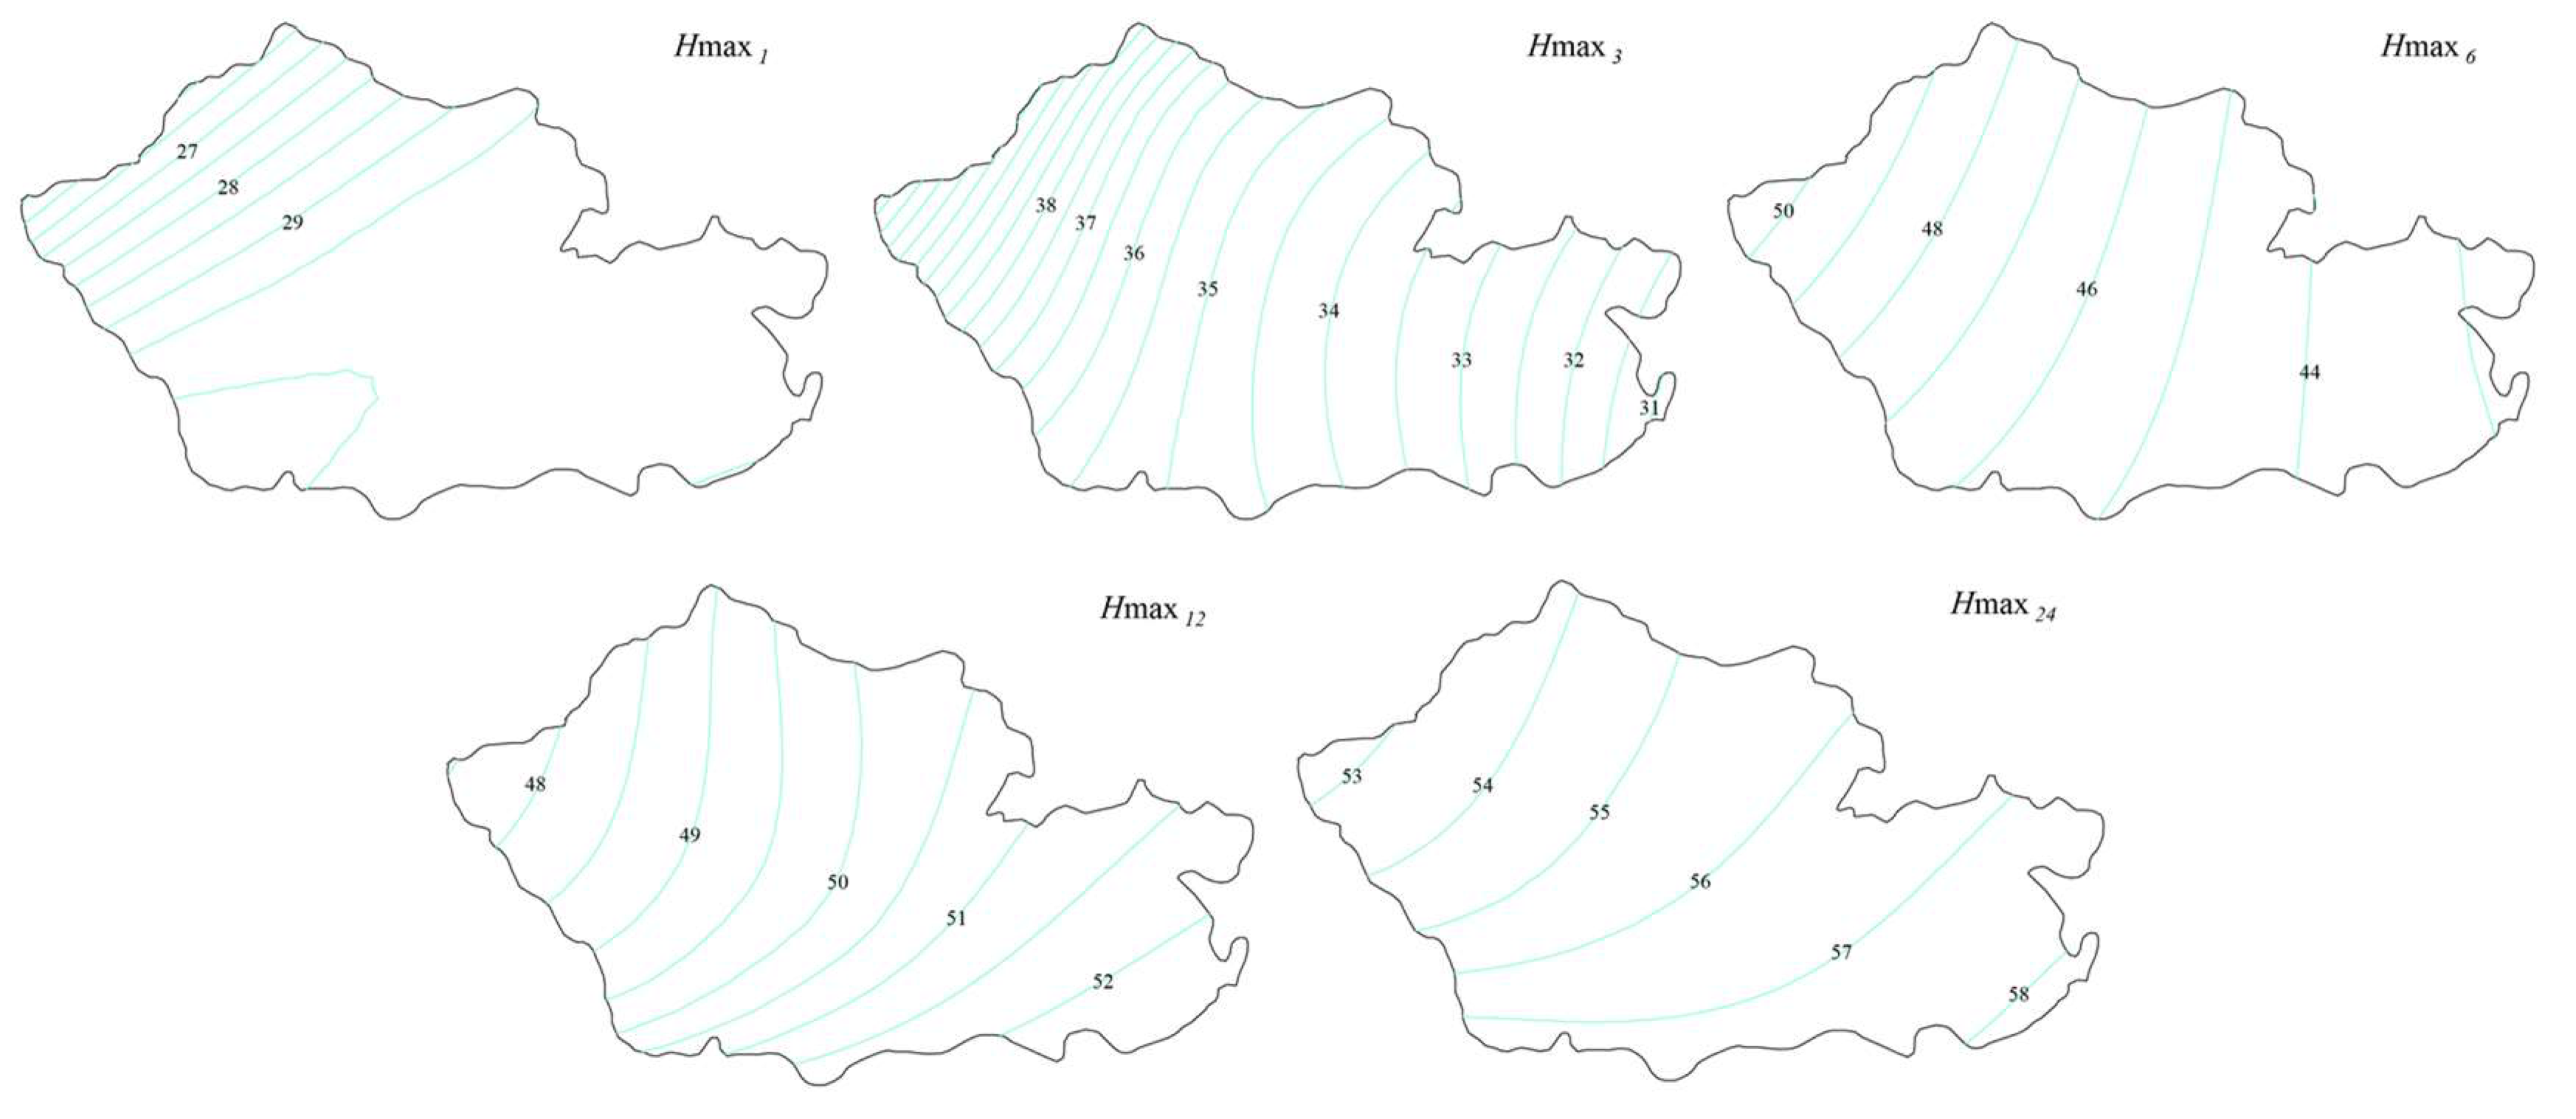
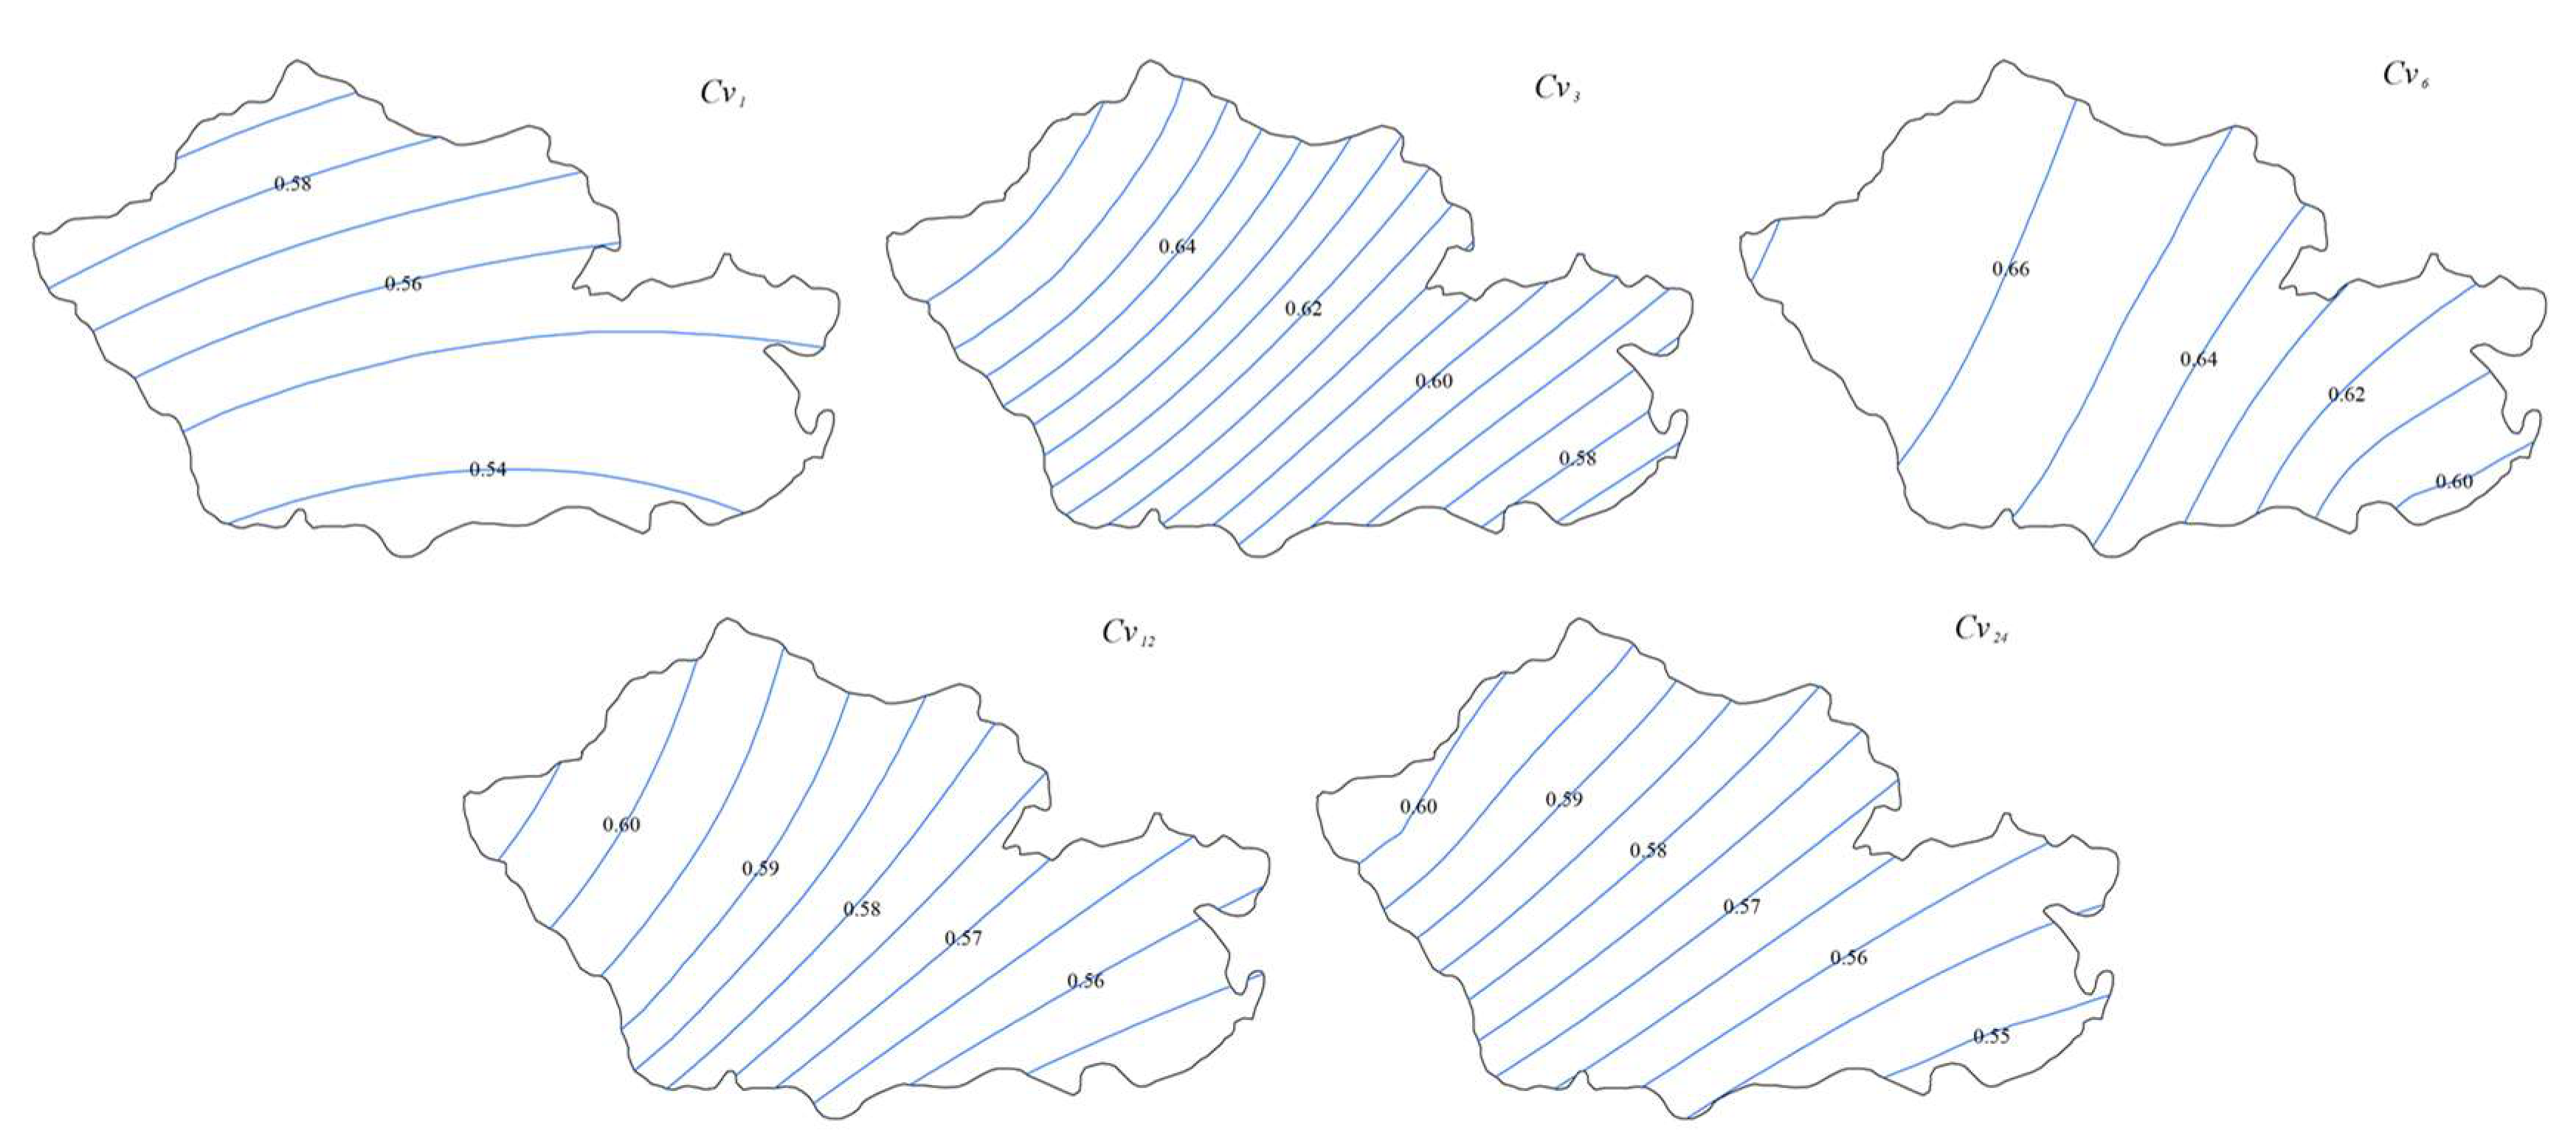
The first step is the calculation of design point rainstorm. The values of Cvd and Hmaxd with different durations can be obtained from the isohyetal rainfall maps (shown in Figure 7) and the isogram of Cvd (shown in Figure 8). The value of Kp was lookup from the table of Kp values based on the value of Cvd and the selected frequencies. The design point rainstorm of the controlled catchments by Anding and Qiangjiawan gauging sections with different frequencies can be calculated, based on the values of Hmaxd and Kp. The specific results are shown in Table 3.
The next step is to compute the design surface rainstorm. The values of ad and bd with different frequencies were determined by the practical hydrological handbook in Yan’an city. The point-to-surface conversion parameter was calculated via the empirical equation given in the handbook (the specific formula is shown in Figure 4), and the results of related parameters and design surface rainstorm are listed in Table 4. Therein, Cs represents the skewness or deviation coefficient, and the ratio of Cs to Cv is 3.5, depending on the regional knowledge.
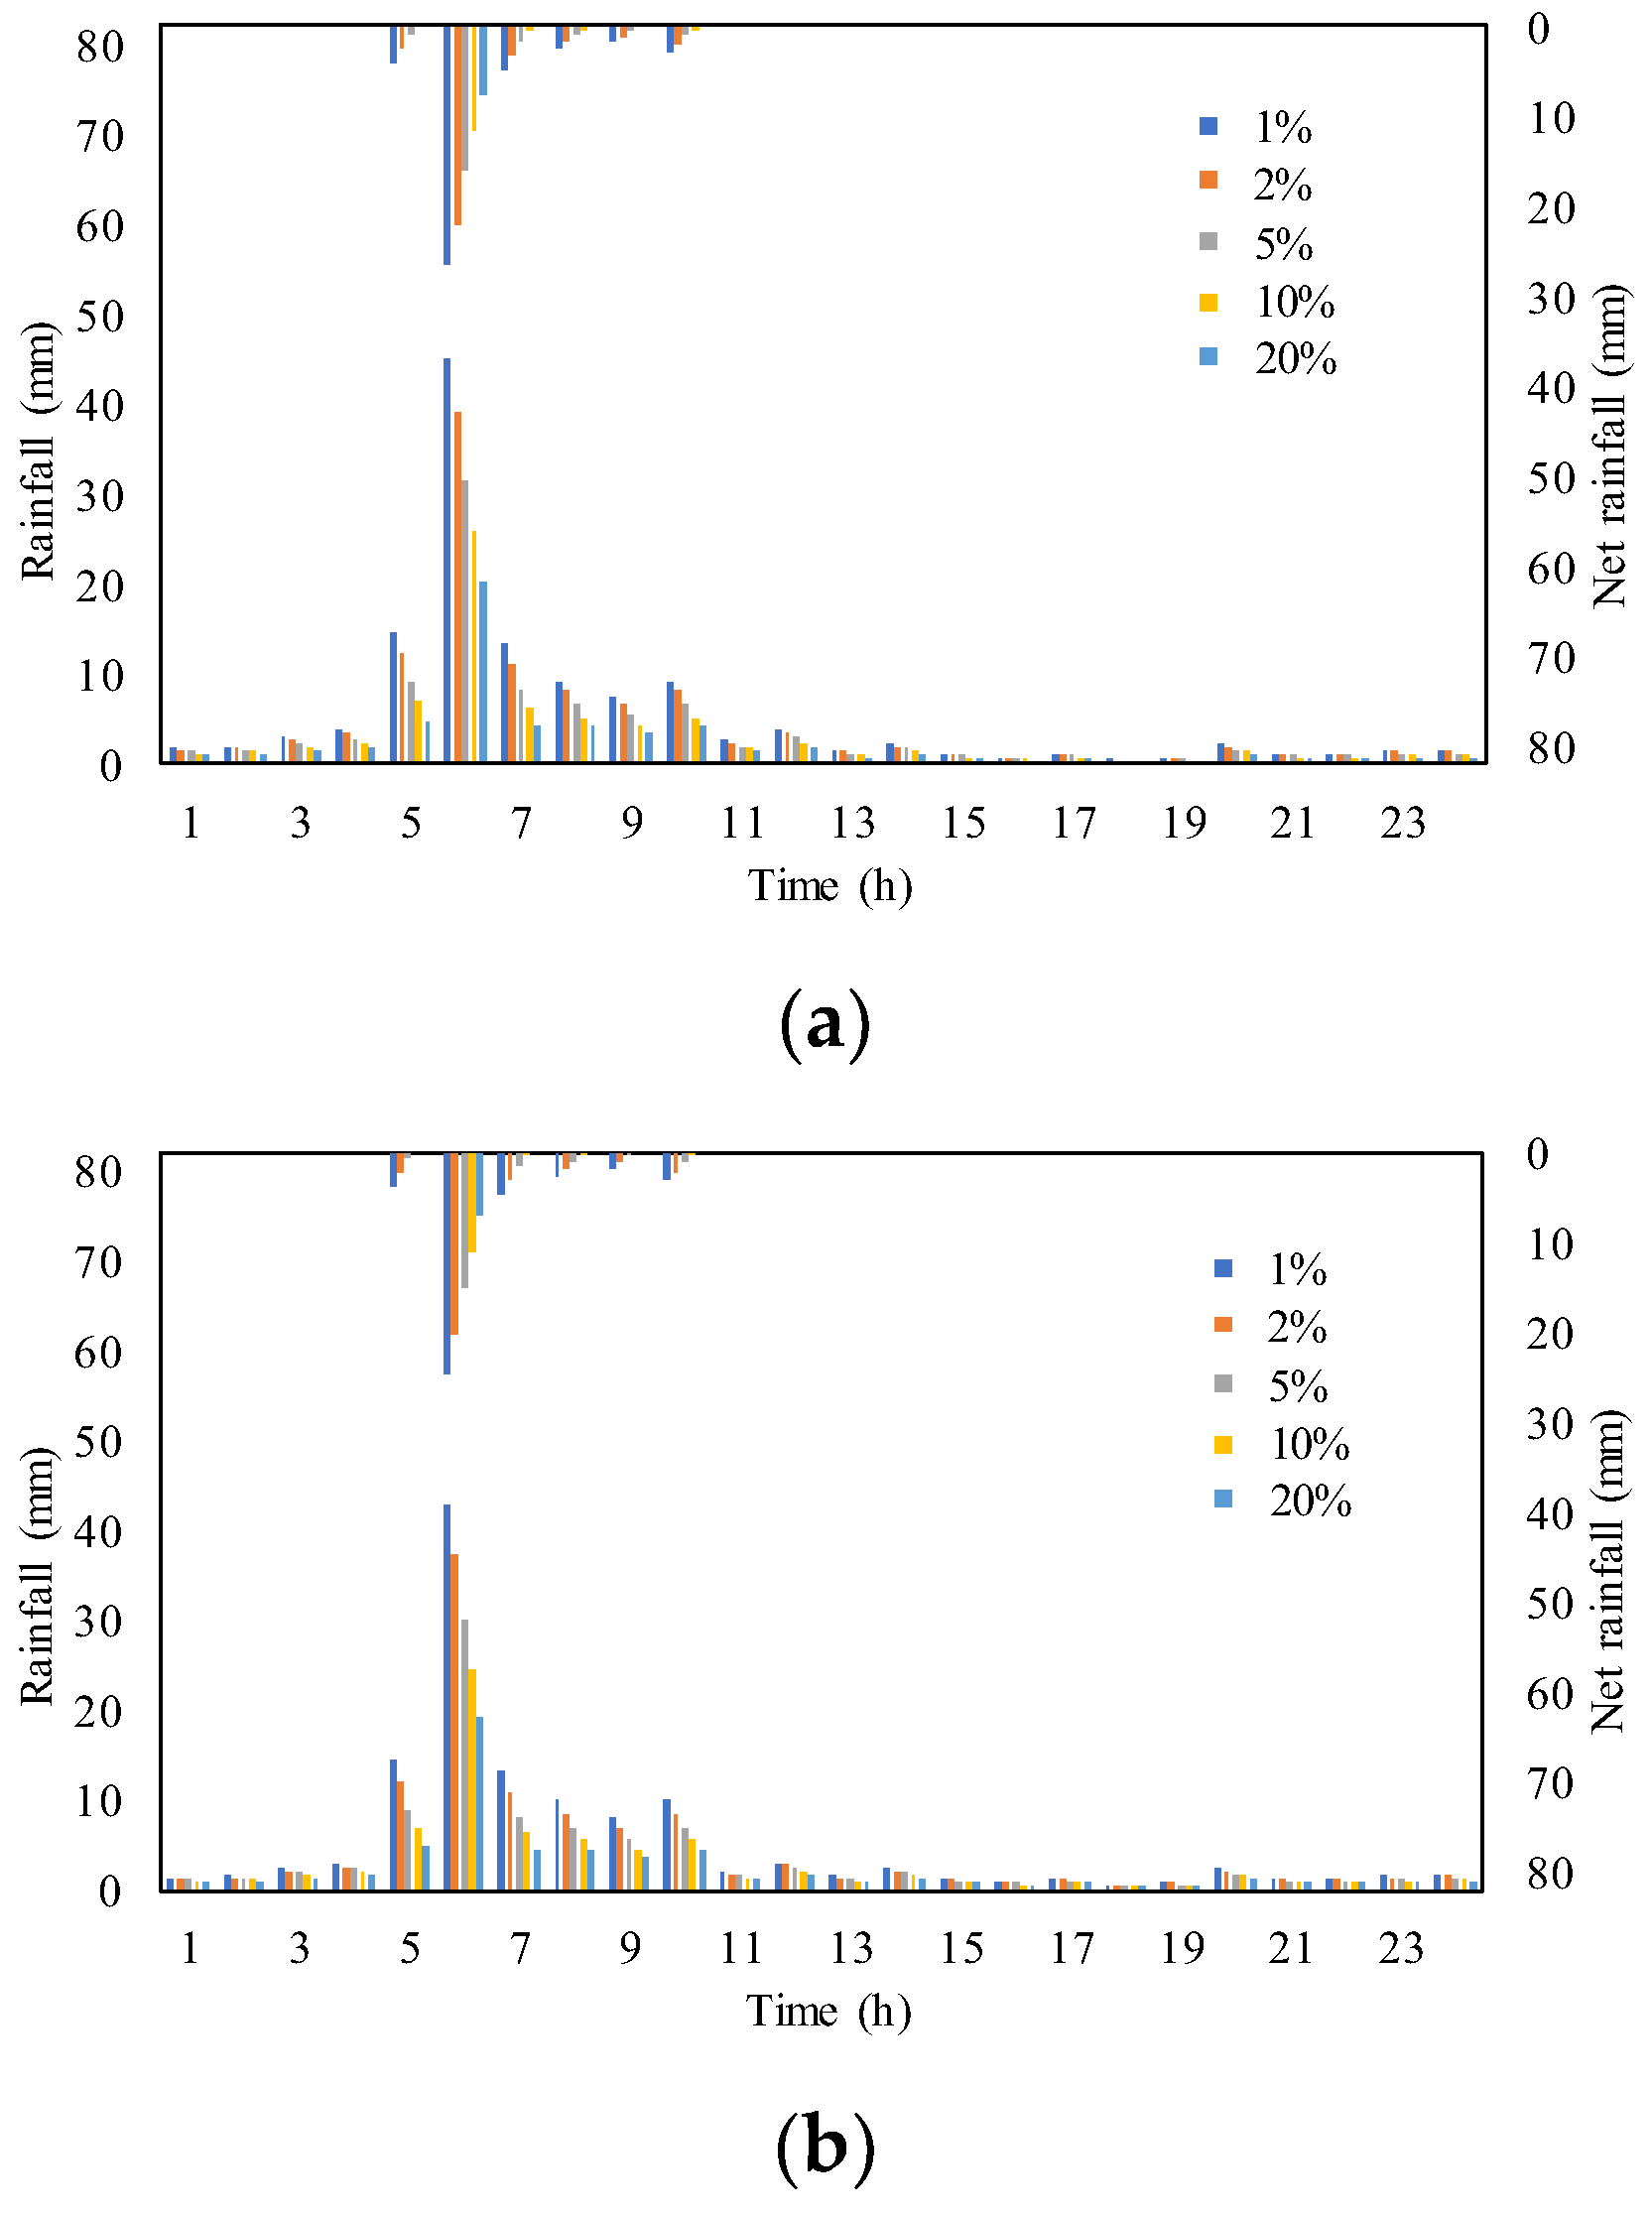
Third, the processes of design rainstorm and net rainfall with different frequencies were calculated, based on the results of design surface rainstorm and its distribution. The specific results are shown in Figure 9.
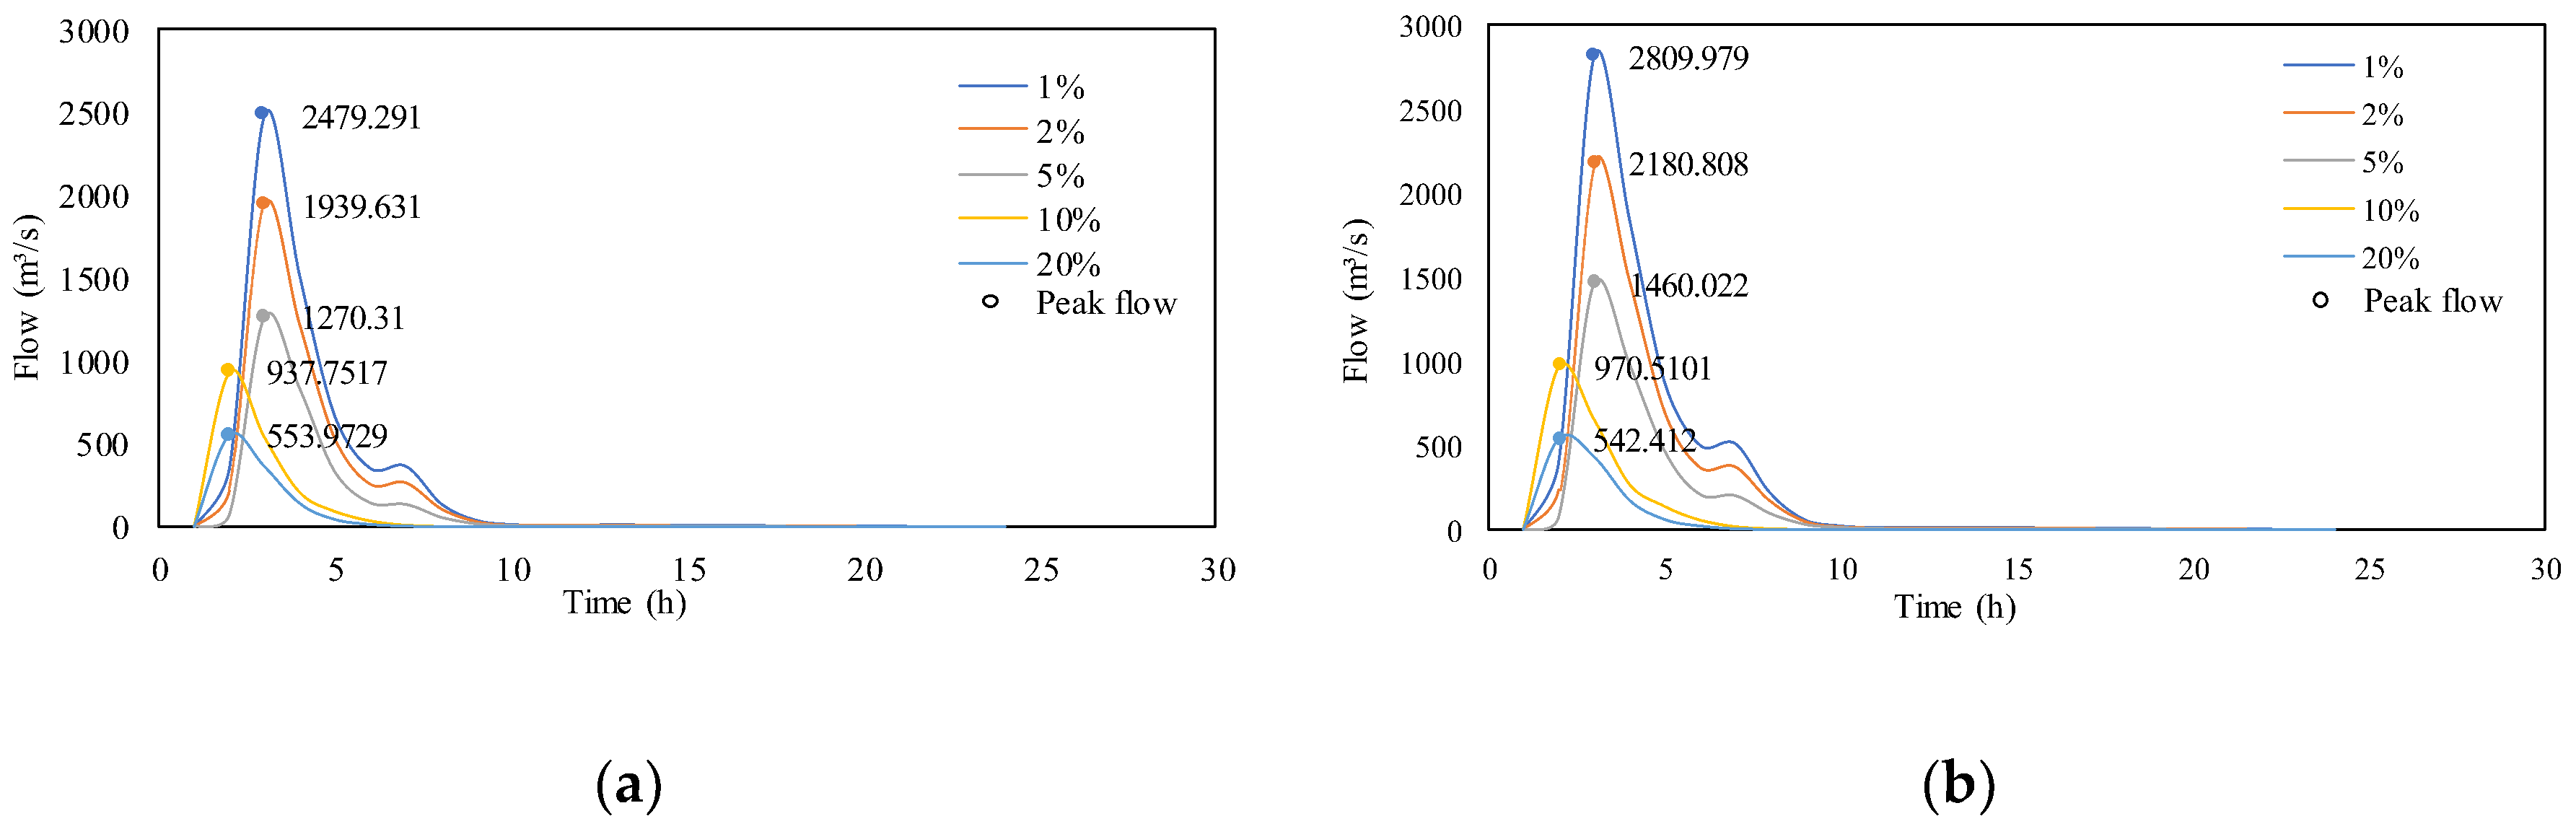
According to the process of net rainfall, the design flood hydrographs with different frequencies were calculated by the instantaneous unit hydrograph and the curves are drawn in Figure 10.
4.2. Rating Curve
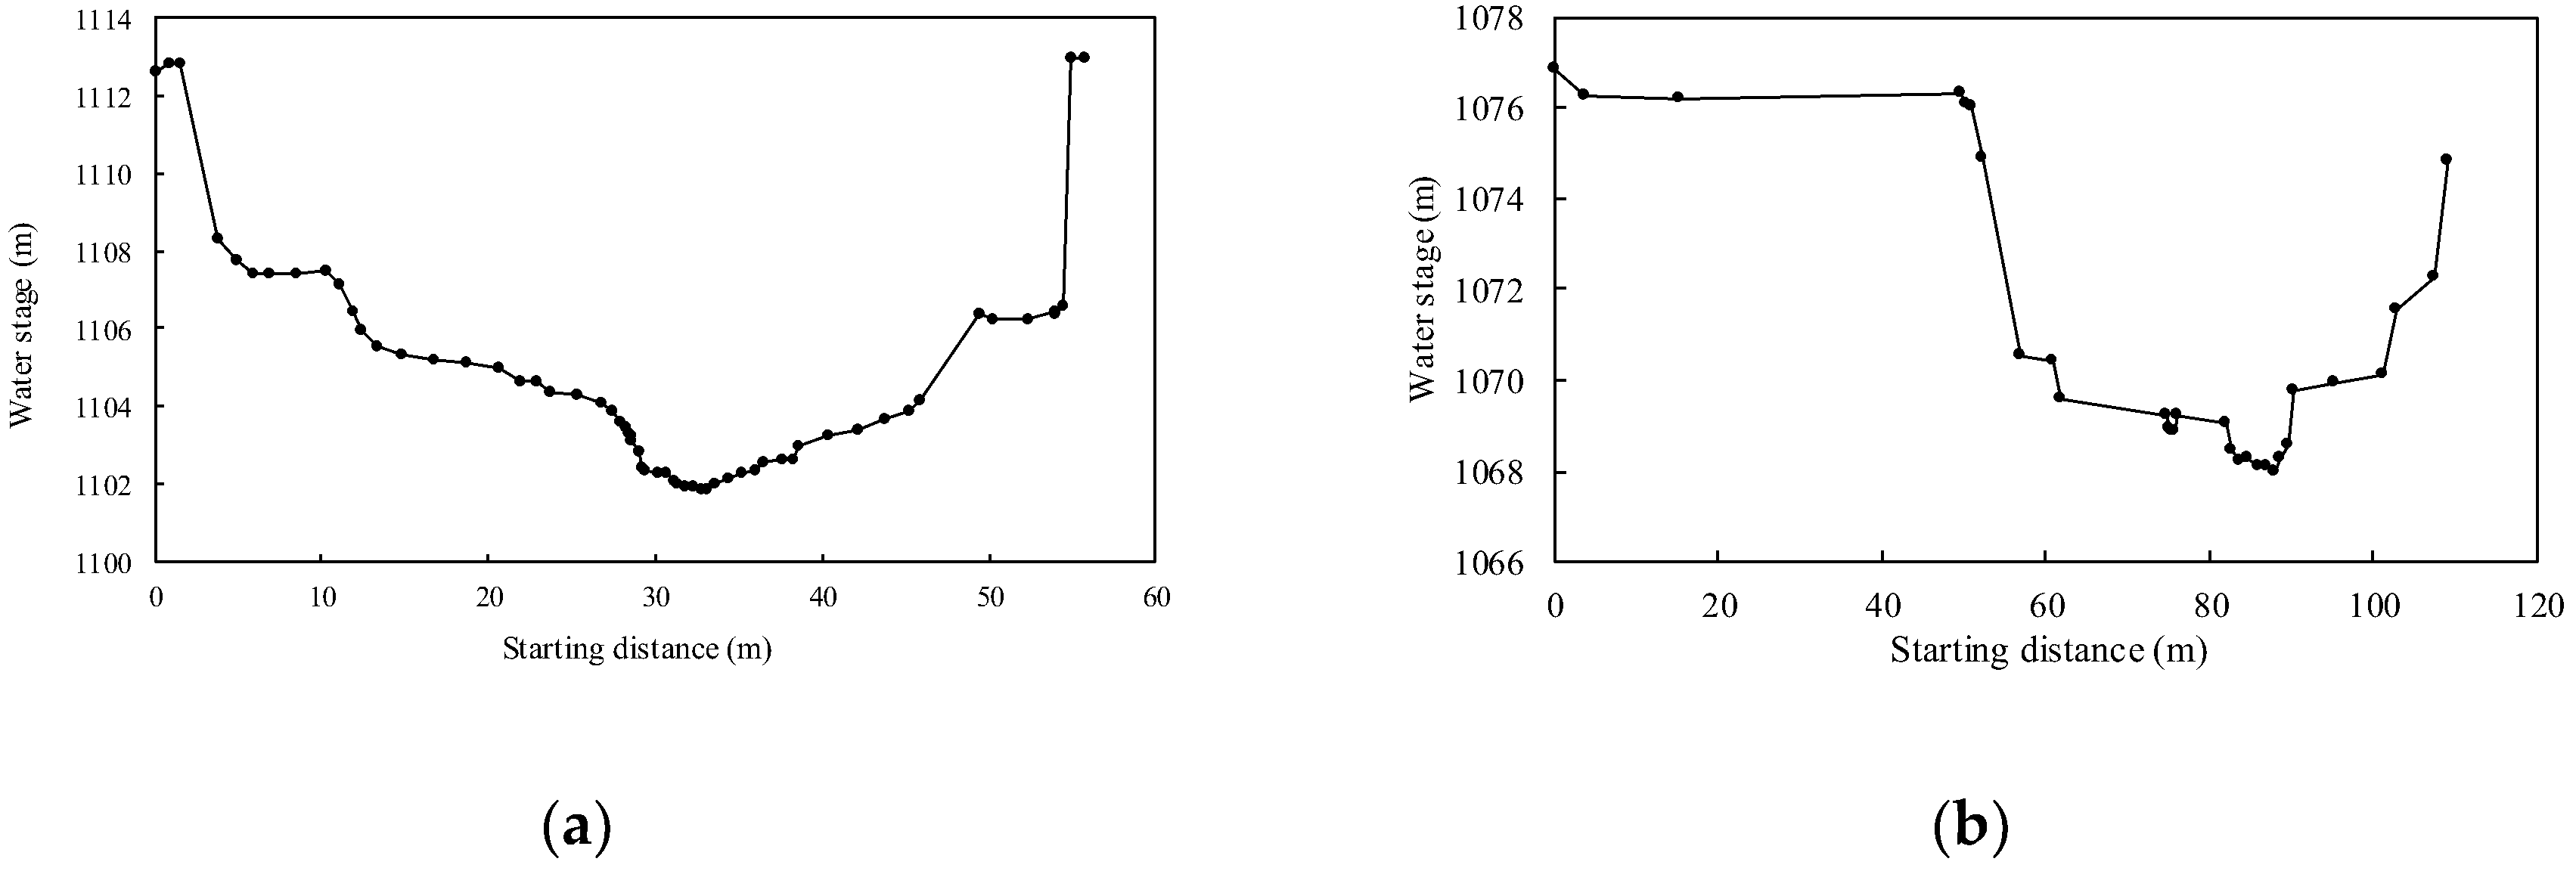
Two gauging cross-sections were measured, and the diagrams are shown in Figure 11.
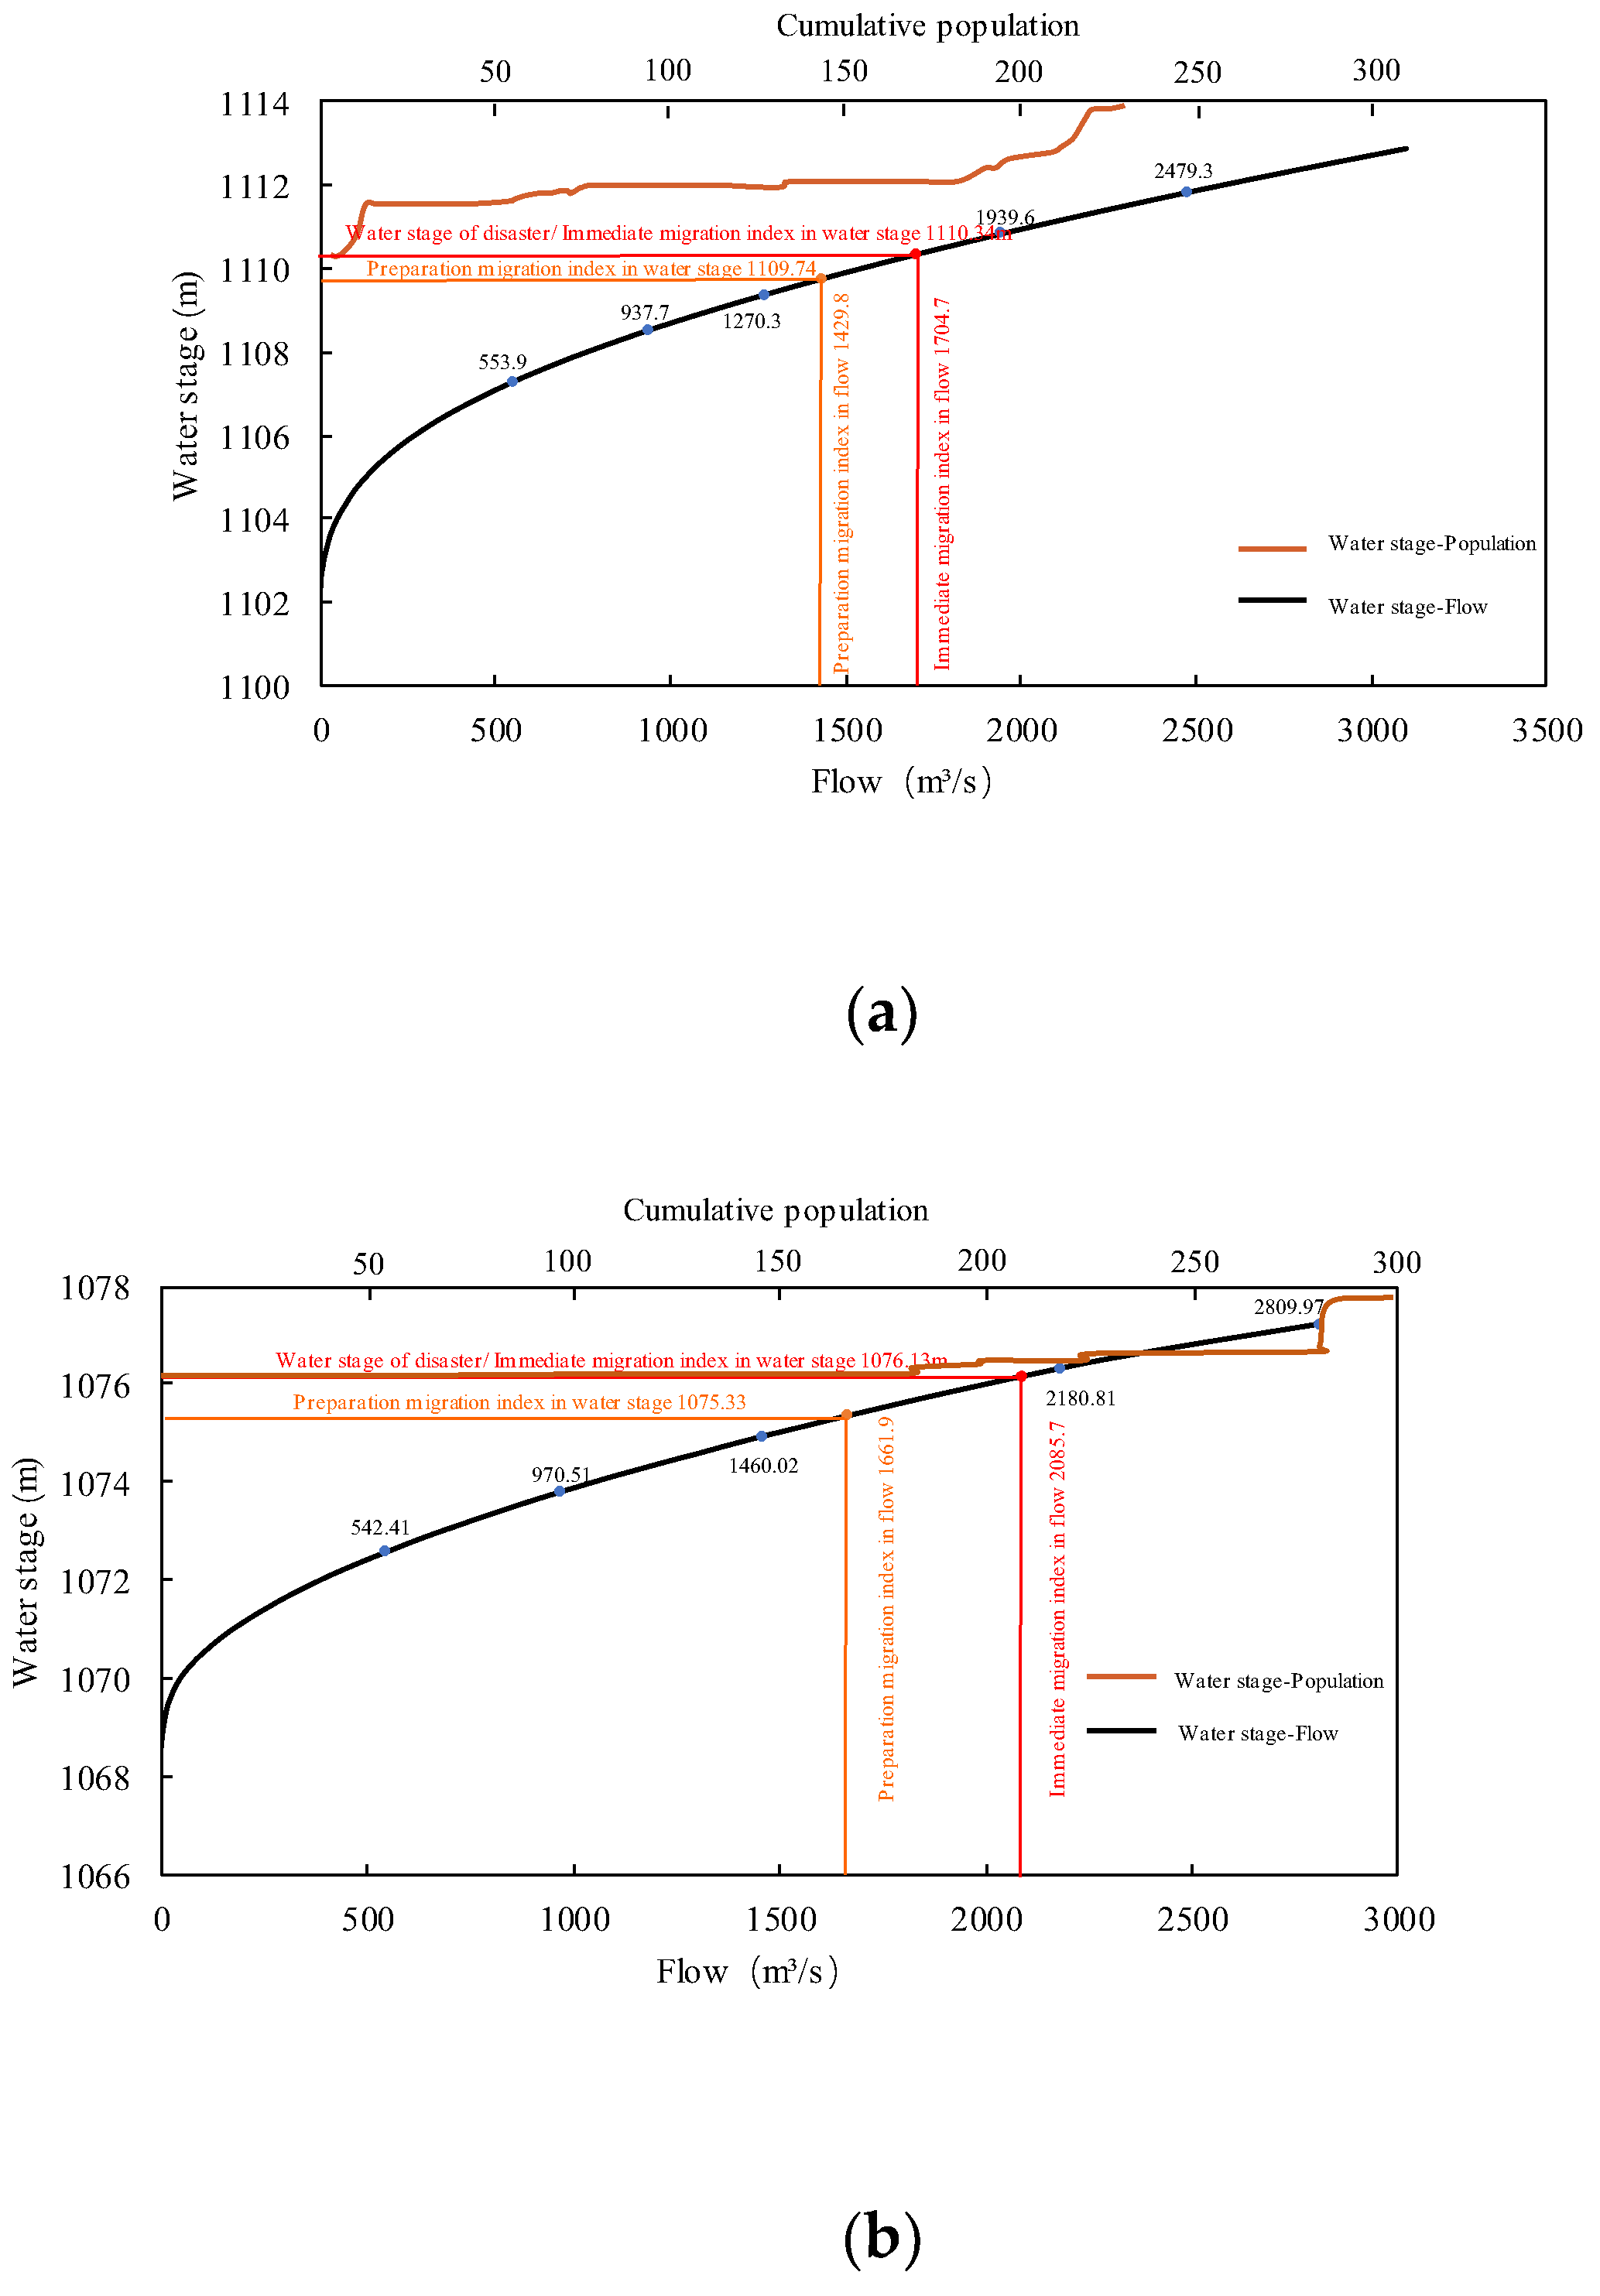
Depending on the section diagrams, the related hydraulic parameters were calculated, and the relationship between the water stage and flow was established, as shown in Figure 12. Figure 12 gives two curves, i.e., the water stage-cumulative population curve and the water stage-flow curve. The water stage-cumulative population curve represents the resident population under certain a water stage, implying the potential human losses without early warning when disaster flood corresponding to the water stage arrives. The water stage-flow curve is the rating curve at the gauging section, by which the water stage corresponding to the predicted flow can be compared with the critical water stage to issue the warning signal.
4.3. Early Warning Index in Water Stage/Flow
As mentioned above, the immediate migration index in the water stage is the critical water stage at the gauging section, and the flow index for immediate migration is the corresponding channel flow at the critical water stage, namely the critical flow. The preparation migration index in flow is selected as the flow occurring in half an hour before the critical flow, which can be interpolated on the design flow hydrograph. The water stage index for preparation migration corresponds to the flow index of preparation migration, and can be calculated via the rating curve of the gauging section. All the indices for preparation and immediate migration were marked in Figure 12, from which we can see how to ascertain the critical water stage, the indices in flow for preparation and the immediate migration according to the rating curve.
Figure 12 shows the critical water stage, or immediate migration index at Anding gauge is 1110.34 m, and that the corresponding index in flow is 1704.7 m3/s. The flow occurring half an hour earlier is 1429.8 m3/s, and is used as the preparation migration index in flow. The corresponding index in the water stage is 1109.74. At Qiangjiawan gauge, the indices in water stage and flow for preparation and immediate migration are 1075.33 m, 1076.13 m, 1661.9 m3/s and 2085.7 m3/s.
4.4. Critical Rainfall
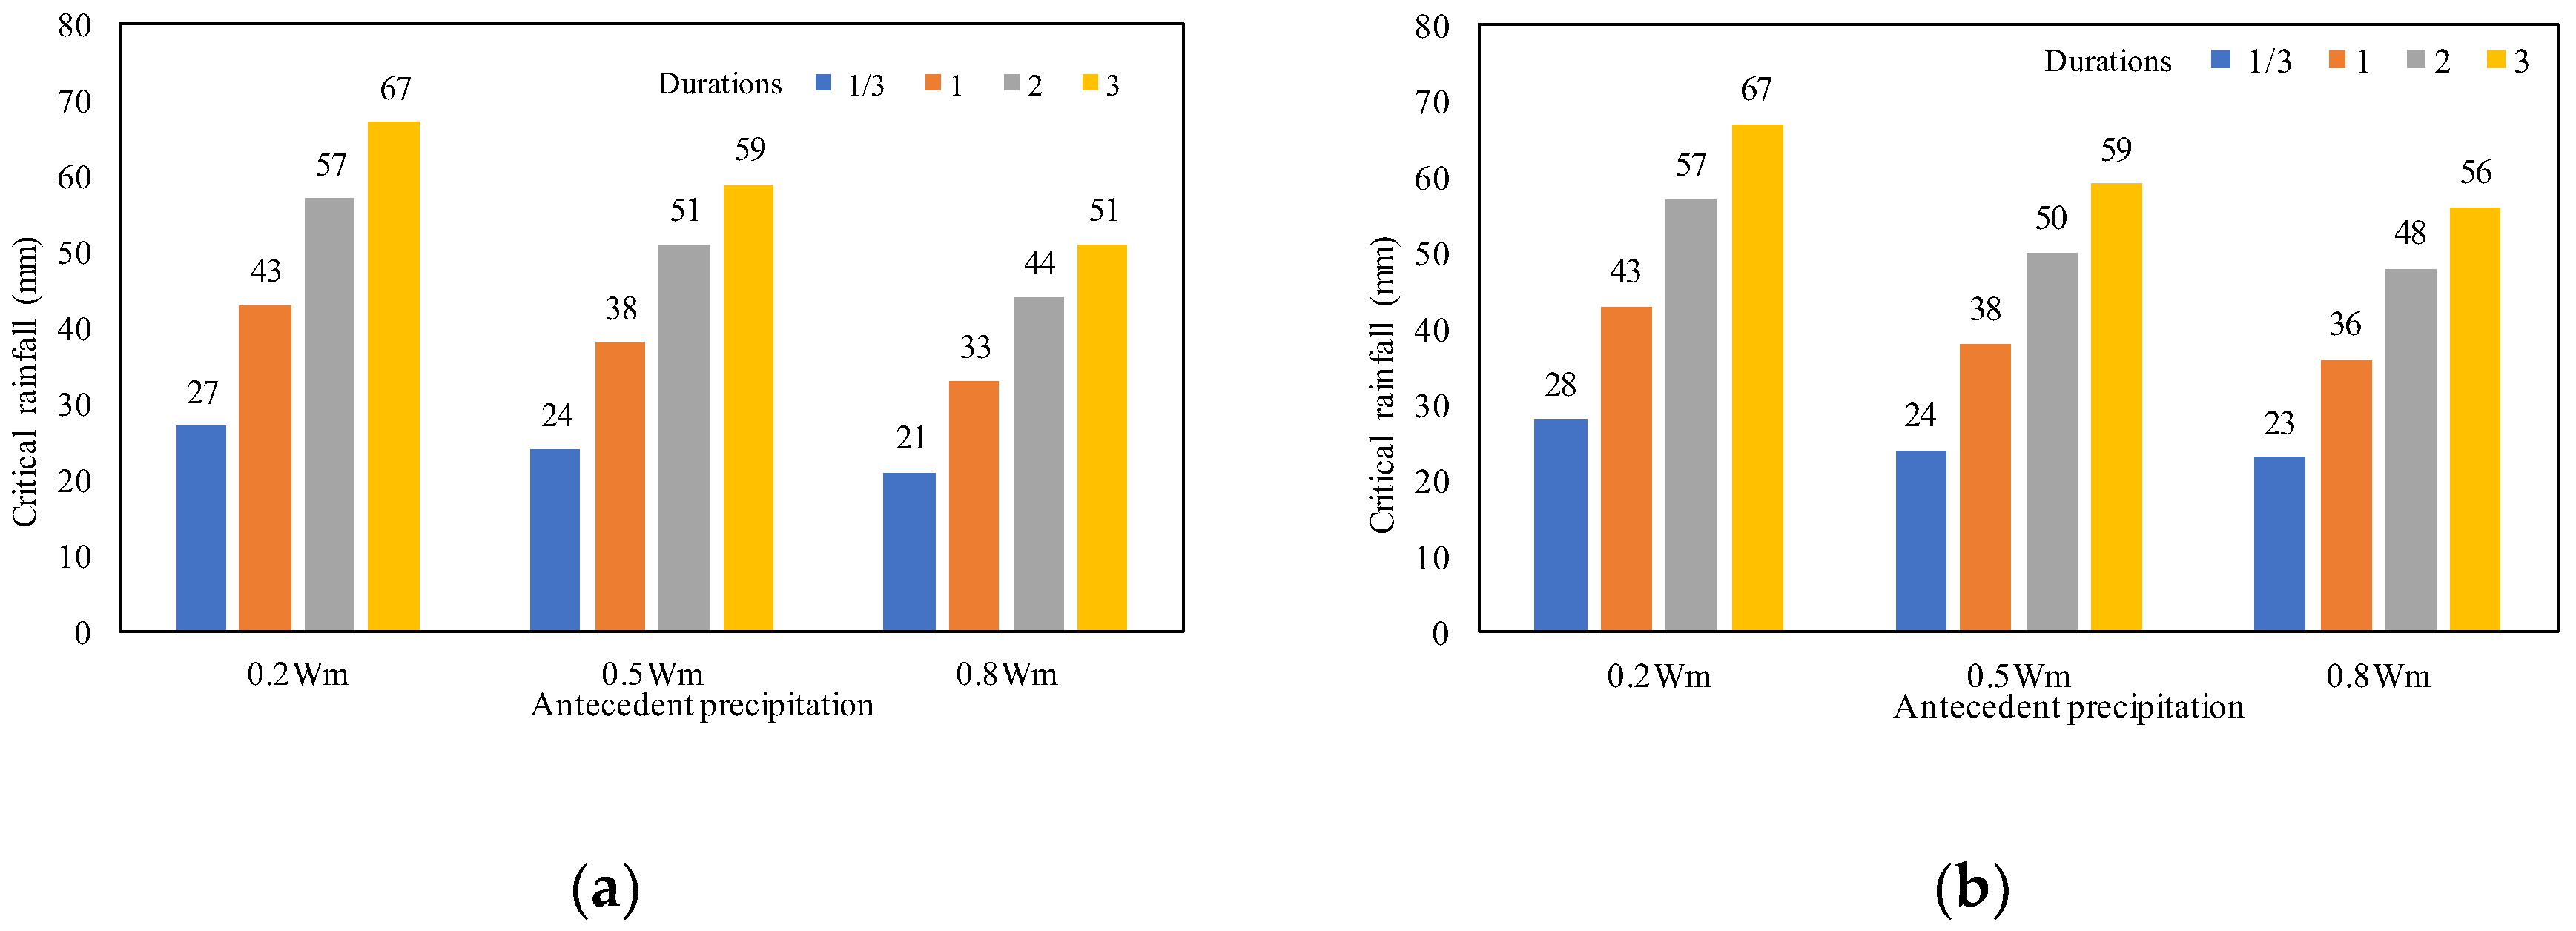
To obtain the critical rainfall, the frequencies of critical flow (i.e., the index inflow for immediate migration) were first computed, based on the critical flow and the frequency curve of the design flood. Due to the assumption of the same frequency of flood flow and rainfall in a small watershed, the frequency of critical rainfall is considered equal to the frequency of the critical flow, and the corresponding modulus coefficient Kp can be looked up. Next, the rainfall threshold ip and critical rainfall with different durations can be calculated from Equations (7) and (8). The results with different antecedent precipitation values and durations (h) are shown in Figure 13.
4.5. Early Warning Index in Rainfall
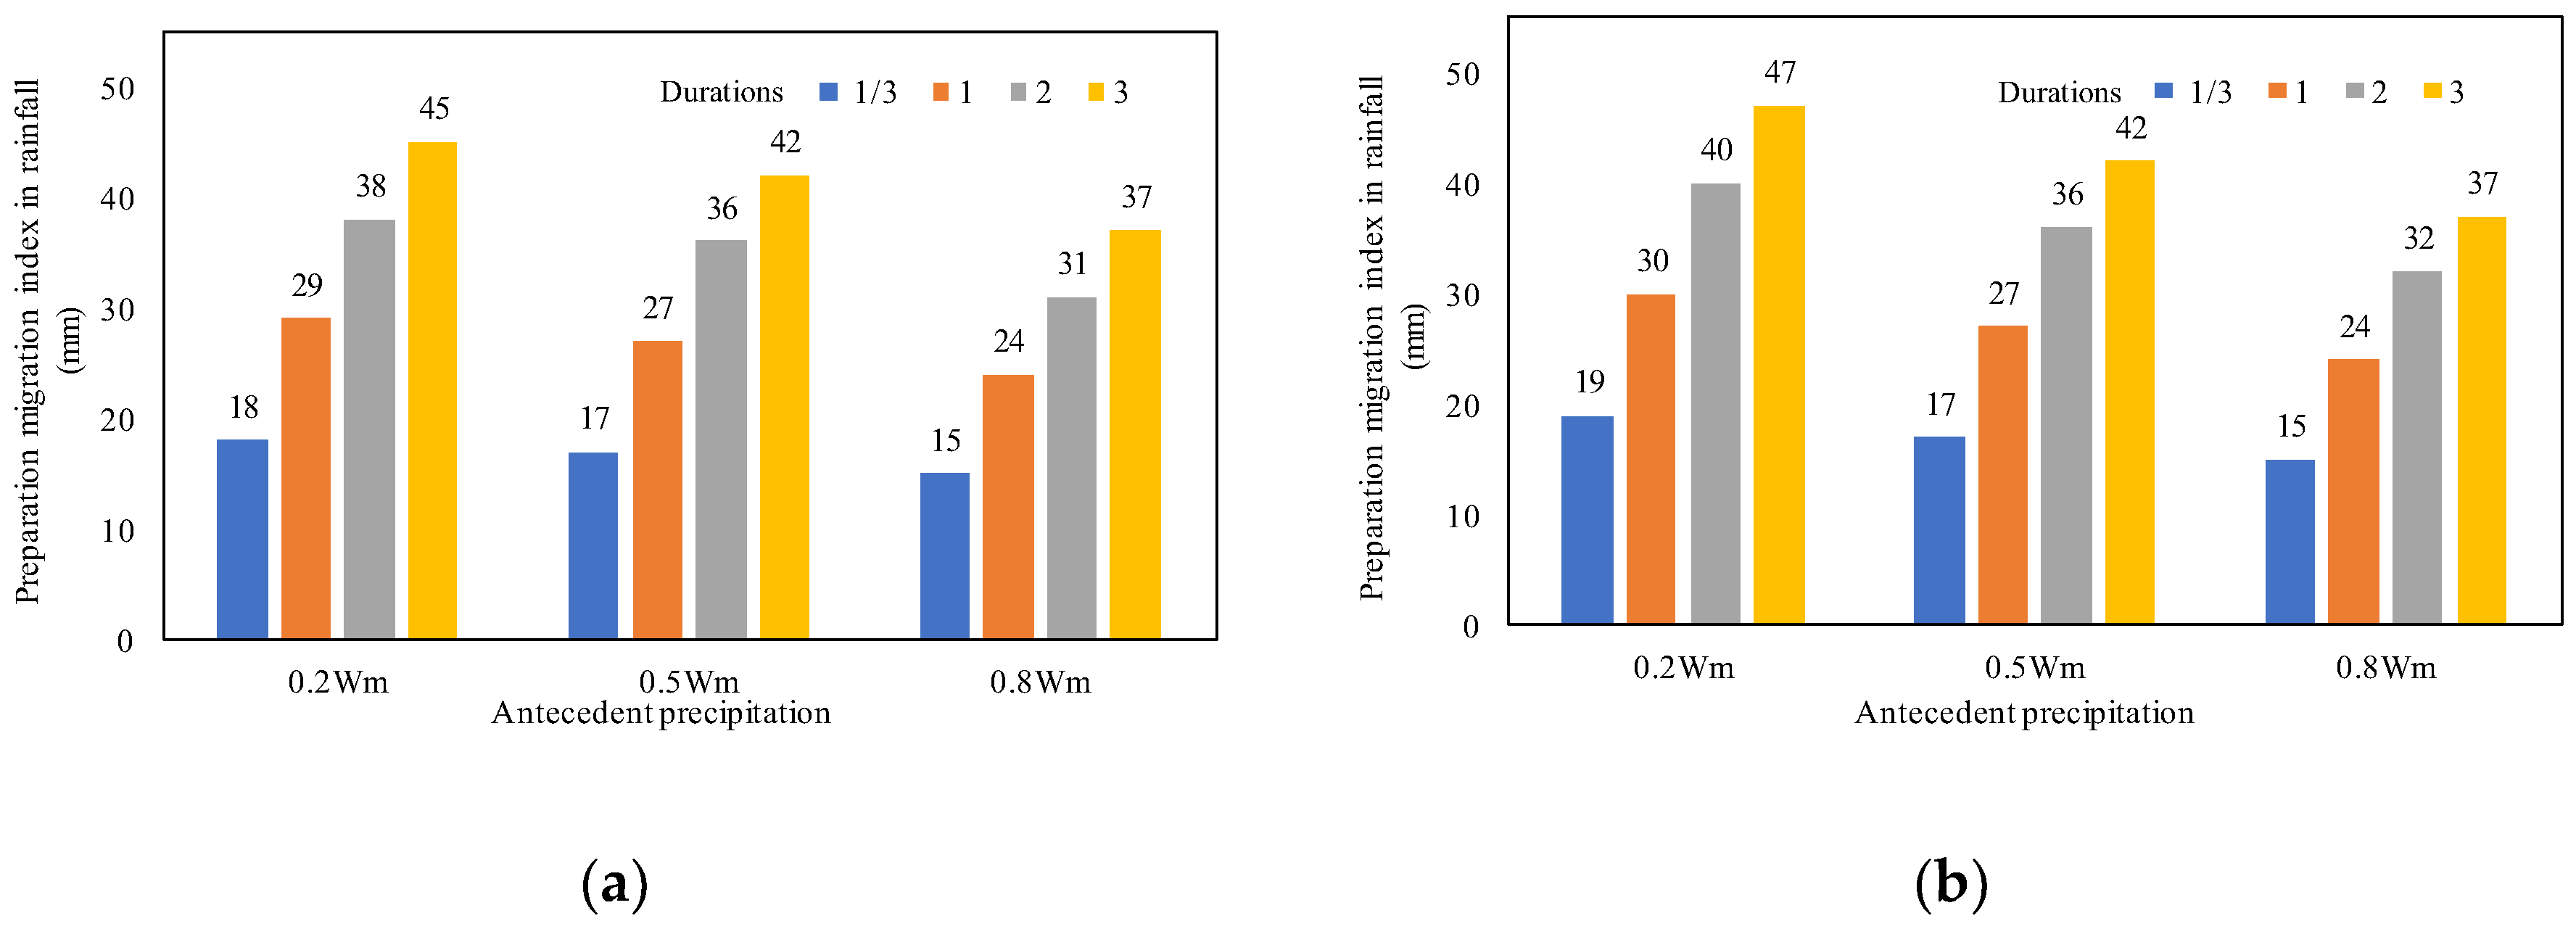
Similar to the indices in water stage/flow, the index value in rainfall for the immediate migration is equal to the critical rainfall, and the preparation migration index in rainfall is calculated by the flow index of preparation migration under the assumption of the same frequency of flood flow and rainfall in a small watershed. Also, to represent the influence of antecedent precipitation (e.g., Pa = 0.2 Wm, Pa = 0.5 Wm, and Pa = 0.8 Wm), the early warning index in rainfall for preparation migration was calculated separately under different antecedent precipitation condition. The results with various durations (hours) are shown in Figure 14.
It is seen from Figure 14, that the indices in rainfall for preparation and migration at Anding and Qiangjiawan gauging sections are similar, because they are geographically close to each other.
5. Application
With the purpose of testing the utility of the early warning system for flash floods, the 7.26 flood events occurring in 2017 in Zichang County, China, were used as an application case in this study. The special application was to compare the simulation results of the early warning system with the measured data (e.g., flood mark) and to evaluate the performance of the early warning system. The application content includes whether the flash flood early warning system can accurately simulate the flash flood event, and whether the early warning index can provide an effective warning signal.
5.1. Application Steps
According to the application content to the early warning system, the application includes two steps: The first step is to test whether the simulated results are consistent with the observed data, namely to answer the question whether the early warning system can accurately simulate flash flood events; the other step is to verify whether the published signal is consistent with the facts of the event, namely to reply whether the early warning index can issue the effective warning signal. The specific step is described as follows:
- Data collection. The observed data of current floods and rainstorms should be collected in the flash flood event, and the flood marks as well as relevant hydraulic parameters should be measured at the gauging section after the flood.
- Flood peak flow simulation. The observed rainstorm data are used to simulate the peak flow (Qa) with the instantaneous unit hydrograph.
- Simulation test. The river water stage Ea corresponding to the peak flow Qa is calculated via the plotted rating curve at the gauging section. Then the Ea is compared with the elevation of flood marks (Em) to assess the simulation performance of the early warning system, and the error can be calculated with the following formula:
ε=|Em–Ea|/Em
If the error is less than 0.5%, it reflects that the early warning system has a better performance on the rainfall-runoff simulation and is considered reasonable.
- Warning signal test. The issue of warning signal is determined by the relation between the measured rainfall cumulative curve and the cumulative curve of migration index in rainfall. We can draw the measured rainfall cumulative curve and the cumulative curves of rainfall indices for preparation and immediate migration in a figure. The corresponding warning signal should be issued once the measured curve exceeds the rainfall index for the preparation of immediate migration.
5.2. Application Results
To test the system, the early warning was performed on the 7.26 flood event occurrence in 2017. The rainfall data corresponding to the 7.26 flood events was first collected, and then the peak flow Qa and the corresponding water stage Ea were calculated. The relative error with the flood marks Em at the gauging section is shown in Table 5.
The table demonstrates that the differences are 0.06 m and 0.22 m, respectively, between Ea and Em at the Anding and Qiangjiawan gauging sections, for which relative errors are 0.005% and 0.021%, far less than 0.5%. It indicates that the early warning system can simulate well the rainfall-runoff process in the flash flood event, and is suitable for use in the early warning of flash floods.
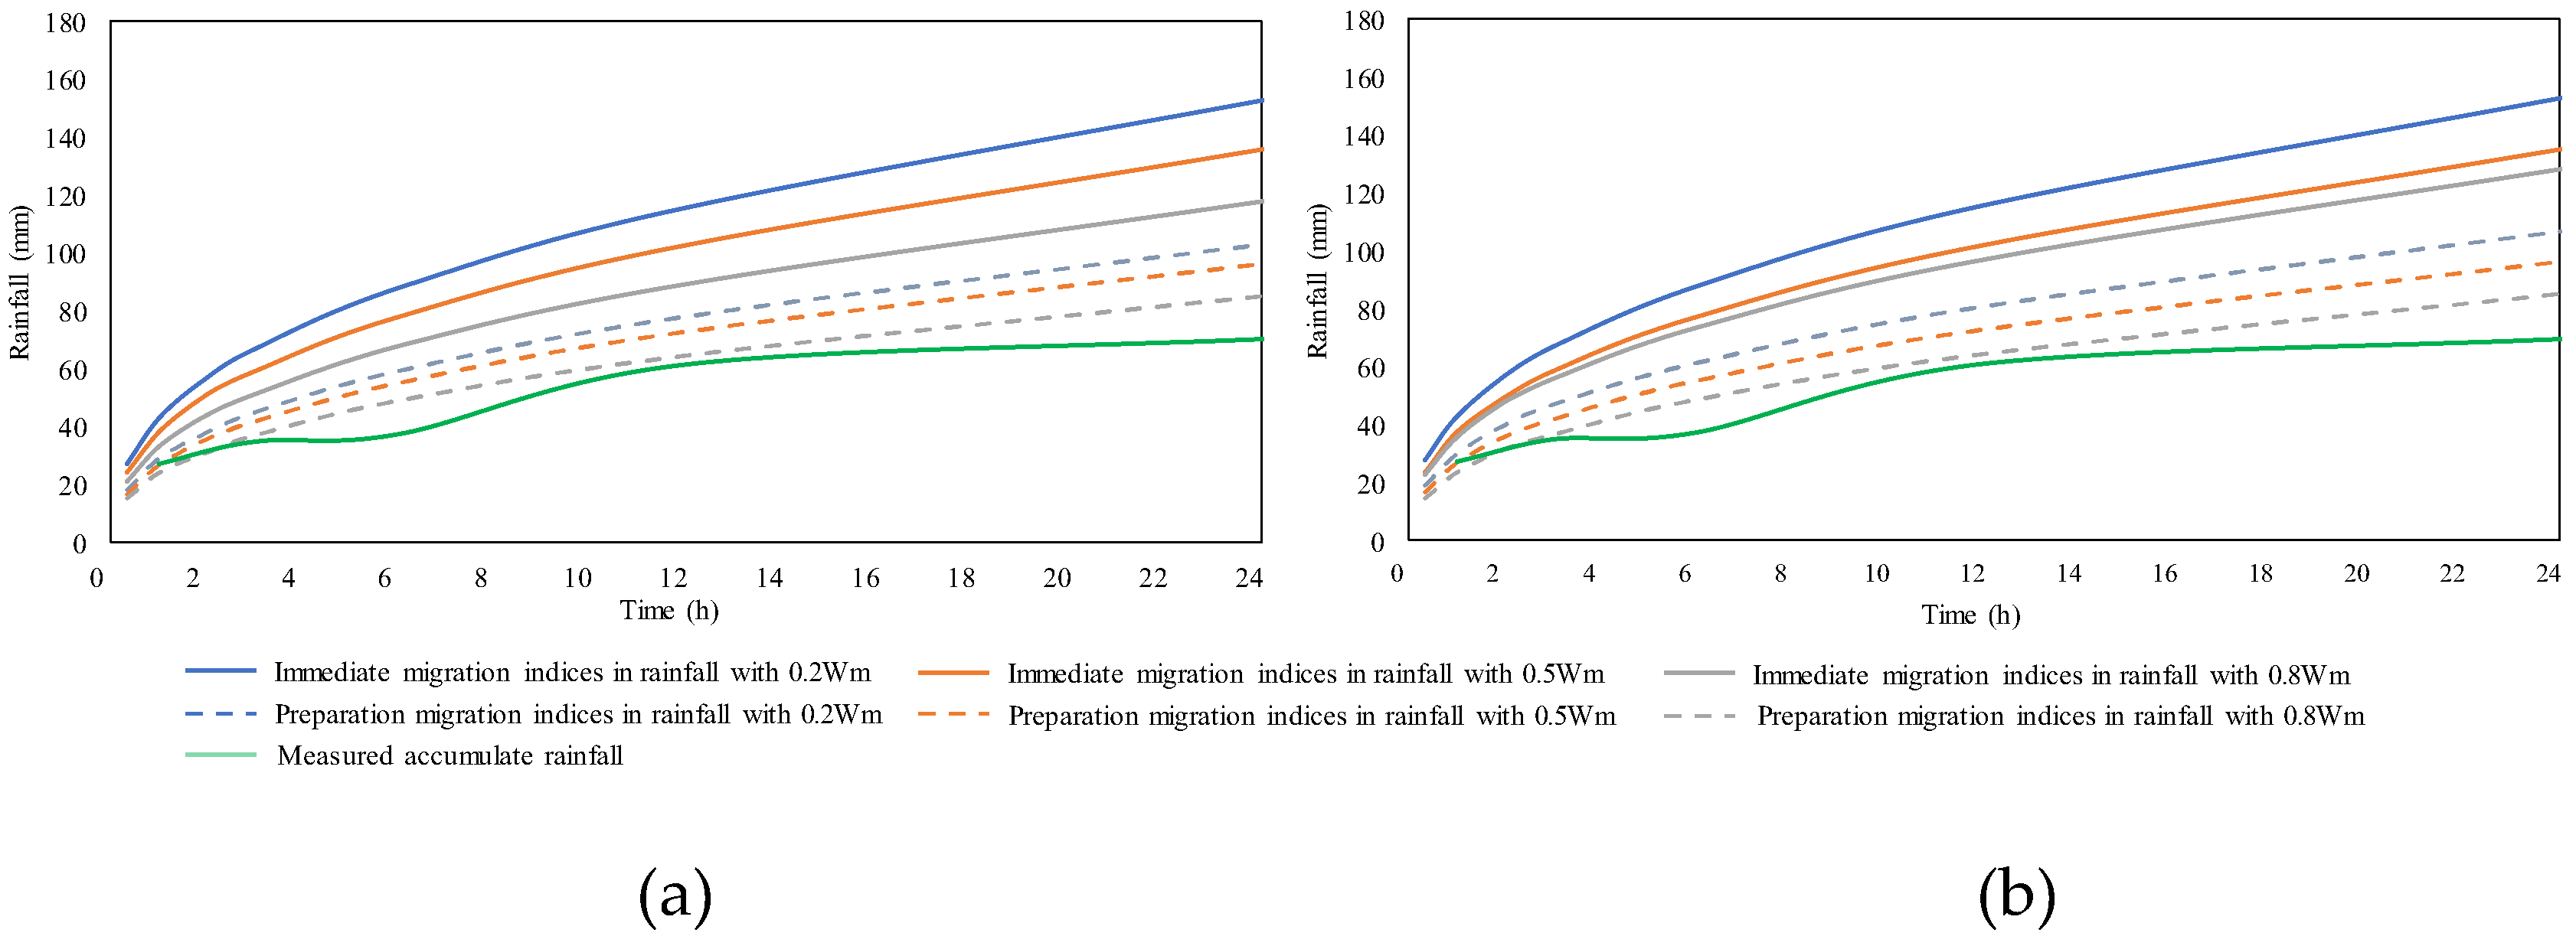
Next, we draw the measured cumulative rainfall curves at two gauges and compare them, with the early warning index curve to determine whether the warning signal needs to be issued, as shown in Figure 15. Also, Figure 15 gives the cumulative curves of rainfall indices for the preparation and immediate migration with different antecedent precipitation values.
Since two gauges are located in the Loess Plateau with notably large evaporation [40], the antecedent precipitation in the 7.26 flood events in 2017 was chosen as 0.2 Wm. Thus, comparison was performed between the measured cumulative rainfall curve and the cumulative curves of rainfall indices for preparation and immediate migration with the antecedent precipitation of 0.2 Wm. Results show no intersection occurs among the measured cumulative rainfall curve and the cumulative curves of rainfall indices for preparation and immediate migration (0.2 Wm) over time. It indicates that the rainstorm did not trigger the alarms at Anding and Qiangjiawan gauges in the 7.26 flood events and would not threaten the protected objects (Anding and Qiangjiawan villages).
Also, the simulated water stages (1104.93 m at Anding gauge and 1070.36 m at Qiangjiawan gauge) is much less than the water stage indices for preparation and immediate migration (1109.74 m and 1110.34 m at Anding gauge; 1075.33 m and 1076.13 m at Qiangjiawan gauge). The result is in accordance with the simulation result of rainfall indices and the facts of the 7.26 flood events [11]. We can draw a conclusion that the designed early warning system is reasonable in the Loess Plateau region, and can be employed to provide an early warning service for resident migration and to avoid the losses of life and property due to flood disaster. However, it should be noted that the 7.26 flood events in 2017 did not result in a flood disaster in the study area, and thus the validation case cannot give more verification information about the accuracy of the early warning index for preparation and immediate migration. It needs to be further verified in future flood disaster events.
6. Conclusions
An early warning system for flash floods was established in this study, including two warning indices in rainfall and water stage/flow. This system combines the frequency comparison method and the rainfall comparison method to calculate the thresholds (rainfall and water stage/flow). The rainfall and water stage/flow are monitored in real time, and warning signals should be issued once the index reaches the threshold. This early warning system was applied to the 7.26 flood events. The results of the application are used to verify the utility of this early warning system. The conclusions can be summarized as follows: (1) The proposed early warning system can accurately simulate the flash flood process, depending on the limited local knowledge and statistical law, although its structure is relatively simple. (2) The system provides two indices in rainfall and water stage/flow, and sets two thresholds for each indicator to serve for preparation and immediate migration of residents. It makes the early warning of flash floods no longer limited to a single index, but provides more information and sufficient time to deal with the coming flash flood. (3) The simulation results on the 7.26 flood events indicate the designed early warning system can provide better warnings for flash floods in the Loess Plateau region, and it may be considered to provide an early warning for resident migration to avoid the losses of life and property due to flood disaster.
Author Contributions
H.Z. provided the writing ideas and supervised the study; Z.L. conceived and designed the early warning system; Z.L. and V.P.S. wrote the paper, R.Y. and S.Z. provided assistance in performing the calculations and producing the figures, and all the authors were responsible for data processing and data analysis.
Funding
This research is supported by the National Natural Science Foundation of China (51379014, 51809005), the Technology Foundation for Selected Overseas Chinese Scholars, Department of Personnel in Shaanxi Province of China (2017035), and the Water Conservancy Science and Technology Program of Shaanxi Province of China (2018slkj-11).
Acknowledgments
Our cordial thanks should be extended to the editor and anonymous reviewers for their pertinent and professional suggestions and comments, which are greatly helpful for further improvement of the quality of this paper.
Conflicts of Interest
The authors declare no conflict of interest.
References
- Borga, M.; Boscolo, P.; Zanon, F.; Sangati, M. Hydrometeorological analysis of the 29 August 2003 flash flood in the Eastern Italian Alps. J. Hydrometeorol. 2007, 8, 1049–1067. [Google Scholar] [CrossRef]
- Desilets, S.; Ferré, T.; Ekwurzel, B. Flash flood dynamics and composition in a semiarid mountain watershed. Water Resour. Res. 2008, 44, 5121–5127. [Google Scholar] [CrossRef]
- Nieland, C.; Mushtaq, S. The effectiveness and need for flash flood warning systems in a regional inland city in Australia. Nat. Hazards 2016, 80, 1–19. [Google Scholar] [CrossRef]
- Borga, M.; Stoffel, M.; Marchi, L.; Marra, F.; Jakob, M. Hydrogeomorphic response to extreme rainfall in headwater systems: Flash floods and debris flows. J. Hydrol. 2014, 518, 194–205. [Google Scholar] [CrossRef]
- Miao, Q.; Yang, D.; Yang, H.; Li, Z. Establishing a rainfall threshold for flash flood warnings in China’s mountainous areas based on a distributed hydrological model. J. Hydrol. 2016, 541, 371–386. [Google Scholar] [CrossRef] [Green Version]
- Chang, J.; Zhang, H.; Wang, Y.; Zhu, Y. Assessing the impact of climate variability and human activities on streamflow variation. Hydrol. Earth Syst. Sci. 2016, 20, 1547–1560. [Google Scholar] [CrossRef] [Green Version]
- Huang, S.; Hou, B.; Chang, J.; Huang, Q.; Chen, Y. Copulas-based probabilistic characterization of the combination of dry and wet conditions in the Guanzhong Plain, China. J. Hydrol. 2014, 519, 3204–3213. [Google Scholar] [CrossRef]
- Luo, P.; Mu, D.; Xue, H.; Ngo-Duc, T.; Dang-Dinh, K.; Takara, K.; Nover, D.; Schladow, G. Flood inundation assessment for the Hanoi Central Area, Vietnam under historical and extreme rainfall conditions. Sci. Rep. 2018, 8, 12623. [Google Scholar] [CrossRef] [PubMed]
- Hill, L. More-than-representational geographies of the past and the affectivity of sound: Revisiting the Lynmouth flood event of 1952. Soc. Cult. Geogr. 2015, 16, 1–23. [Google Scholar] [CrossRef]
- Gaume, E.; Livet, M.; Desbordes, M.; Villeneuve, J. Hydrological analysis of the river Aude, France, flash flood on 12 and 13 November 1999. J. Hydrol. 2004, 286, 135–154. [Google Scholar] [CrossRef]
- He, Y.; He, S.; Hu, Z.; Qin, Y.; Zhang, Y. The devastating 26 July 2017 Floods in Yulin City, northern Shaanxi, China. Geomat. Nat. Hazards Risk 2018, 9, 70–78. [Google Scholar] [CrossRef]
- Hapuarachchi, H.; Wang, Q.; Pagano, T. A review of advances in flash flood forecasting. Hydrol. Process. 2011, 25, 2771–2784. [Google Scholar] [CrossRef]
- Chen, M.; Pang, J.; Wu, P. Flood routing model with particle filter-based data assimilation for flash flood forecasting in the micro-model of lower Yellow river, China. Water 2018, 10, 1612. [Google Scholar] [CrossRef]
- Hapuarachchi, H.A.P.; Wang, Q.J. A Review of Methods and Systems Available for Flash Flood Forecasting; CSIRO: Canberra, Australia, 2008; pp. 30–39. [Google Scholar]
- Reed, S.; Schaake, J.; Zhang, Z. A distributed hydrologic model and threshold frequency-based method for flash flood forecasting at ungauged locations. J. Hydrol. 2007, 337, 402–420. [Google Scholar] [CrossRef]
- Martina, M.; Todini, E.; Libralon, A. A Bayesian decision approach to rainfall thresholds based flood warning. Hydrol. Earth Syst. Sci. 2006, 2, 413–426. [Google Scholar] [CrossRef]
- Vincendon, B.; Ducrocq, V.; Nuissier, O.; Viè, B. Perturbation of convection-permitting NWP forecasts for flash-flood ensemble forecasting. Nat. Hazards Earth Syst. 2011, 11, 1529–1544. [Google Scholar] [CrossRef] [Green Version]
- Ntelekos, A.; Georgakakos, K.; Krajewski, W. On the uncertainties of flash flood guidance: Toward probabilistic forecasting of flash floods. J. Hydrometeorol. 2006, 7, 896–915. [Google Scholar] [CrossRef]
- Na, W.; Yoo, C. A bias correction method for rainfall forecasts using backward storm tracking. Water 2018, 10, 1728. [Google Scholar] [CrossRef]
- Zhang, H.; Singh, P.V.; Wang, B.; Yu, Y. CEREF: A hybrid data-driven model for forecasting annual streamflow in socio-hydrological system. J. Hydrol. 2016, 540, 246–256. [Google Scholar] [CrossRef]
- Chiang, Y.; Hsu, K.; Chang, F.; Hong, Y.; Sorooshian, S. Merging multiple precipitation sources for flash flood forecasting. J. Hydrol. 2007, 340, 183–196. [Google Scholar] [CrossRef]
- Kobold, M.; Brilly, M. The use of HBV model for flash flood forecasting. Nat. Hazards Earth Syst. Sci. 2006, 6, 407–417. [Google Scholar] [CrossRef] [Green Version]
- Sirdas, S.; Şen, Z. Determination of flash floods in western Arabian Peninsula. J. Hydrol. Eng. 2007, 12, 676–681. [Google Scholar] [CrossRef]
- Lincoln, W.; Franz, K. A Modeling Approach for Flash Flood Forecasting For Small Watersheds in Iowa; American Geophysical Union Fall Meeting: San Francisco, CA, USA, 2008. [Google Scholar]
- Borrell, V.E.; Dartus, D.; Ababou, R. Flash flood modeling with the MARINE hydrological distributed model. Hydrol. Earth Syst. Sci. 2006, 3, 3397–3438. [Google Scholar] [CrossRef]
- England, J.; Velleux, M.; Julien, P. Two-dimensional simulations of extreme floods on a large watershed. J. Hydrol. 2007, 347, 229–241. [Google Scholar] [CrossRef]
- Saber, M.; Yilmaz, K.K. Evaluation and bias correction of satellite-based rainfall estimates for modelling flash floods over the Mediterranean region: Application to Karpuz river basin, Turkey. Water 2018, 10, 657. [Google Scholar] [CrossRef]
- Norbiato, D.; Borga, M.; Esposti, S.; Gaume, E.; Anquetin, S. Flash flood warning based on rainfall thresholds and soil moisture conditions: An assessment for gauged and ungauged basins. J. Hydrol. 2008, 362, 274–290. [Google Scholar] [CrossRef]
- Zhai, X.; Guo, L.; Liu, R.; Zhang, Y. Rainfall threshold determination for flash flood warning in mountainous catchments with consideration of antecedent soil moisture and rainfall pattern. Nat. Hazards 2018, 94, 605–625. [Google Scholar] [CrossRef]
- Yan, W.; Deng, L.; Zhong, Y.; Shangguan, Z. The characters of dry soil layer on the Loess Plateau in China and their influencing factors. PLoS ONE 2015, 10, e0134902. [Google Scholar] [CrossRef] [PubMed]
- Ren, C.; Li, Z.; Zhang, H. Integrated multi-objective stochastic fuzzy programming and AHP method for agricultural water and land optimization allocation under multiple uncertainties. J. Clean Prod. 2019, 2101, 12–24. [Google Scholar] [CrossRef]
- Liu, D.; Tian, F.; Hu, H.; Hu, H. The role of run-on for overland flow and the characteristics of runoff generation in the Loess Plateau, China. Hydrol. Sci. J. 2012, 57, 1107–1117. [Google Scholar] [CrossRef] [Green Version]
- Zhang, H. The characteristics of hard rain and its distribution over the loess plateau. Acta Geogr. Sin. 1983, 4, 416–425. [Google Scholar]
- Yu, Y.; Zhang, H.; Singh, V.P. Forward prediction of runoff data in data-scarce basins with an improved ensemble empirical mode decomposition (EEMD) model. Water 2018, 10, 388. [Google Scholar] [CrossRef]
- Wang, T.; Kou, X.; Xiong, Y.; Mou, P.; Wu, J.; Ge, J. Temporal and spatial patterns of NDVI and their relationship to precipitation in the Loess Plateau of China. Int. J. Remote Sens. 2010, 31, 1943–1958. [Google Scholar] [CrossRef]
- Zhao, W.; Fu, B.; Men, Q.; Zhang, Q.; Zhang, Y. Effects of land-use pattern change on rainfall-runoff and runoff-sediment relations: A case study in Zichang watershed of the Loess Plateau of China. J. Environ. Sci. 2004, 16, 436–442. [Google Scholar]
- Song, S.; Schmalz, B.; Zhang, J.; Li, G.; Fohrer, N. Application of modified manning formula in the determination of vertical profile velocity in natural rivers. Hydrol. Res. 2017, 48, 133–146. [Google Scholar] [CrossRef]
- Chow, C.N. Open Channel Hydraulics; McGraw Hill Book Company: New York, NY, USA, 1959. [Google Scholar]
- Cao, Q.; Guan, K. Analysis on different forms of manning formula in stage—Discharge relation calculation for compound cross section channel. Ground Water 2015, 37, 156–169. (In Chinese) [Google Scholar]
- Xie, X.; Wang, L. Changes of potential evaporation in northern China over the past 50 years. J. Nat. Resour. 2007, 22, 683–691. (In Chinese) [Google Scholar]
Figure 1.
Location of Zichang County and the distribution of disaster prevention objects.

Figure 2.
Schematic of the water stage of a disaster.

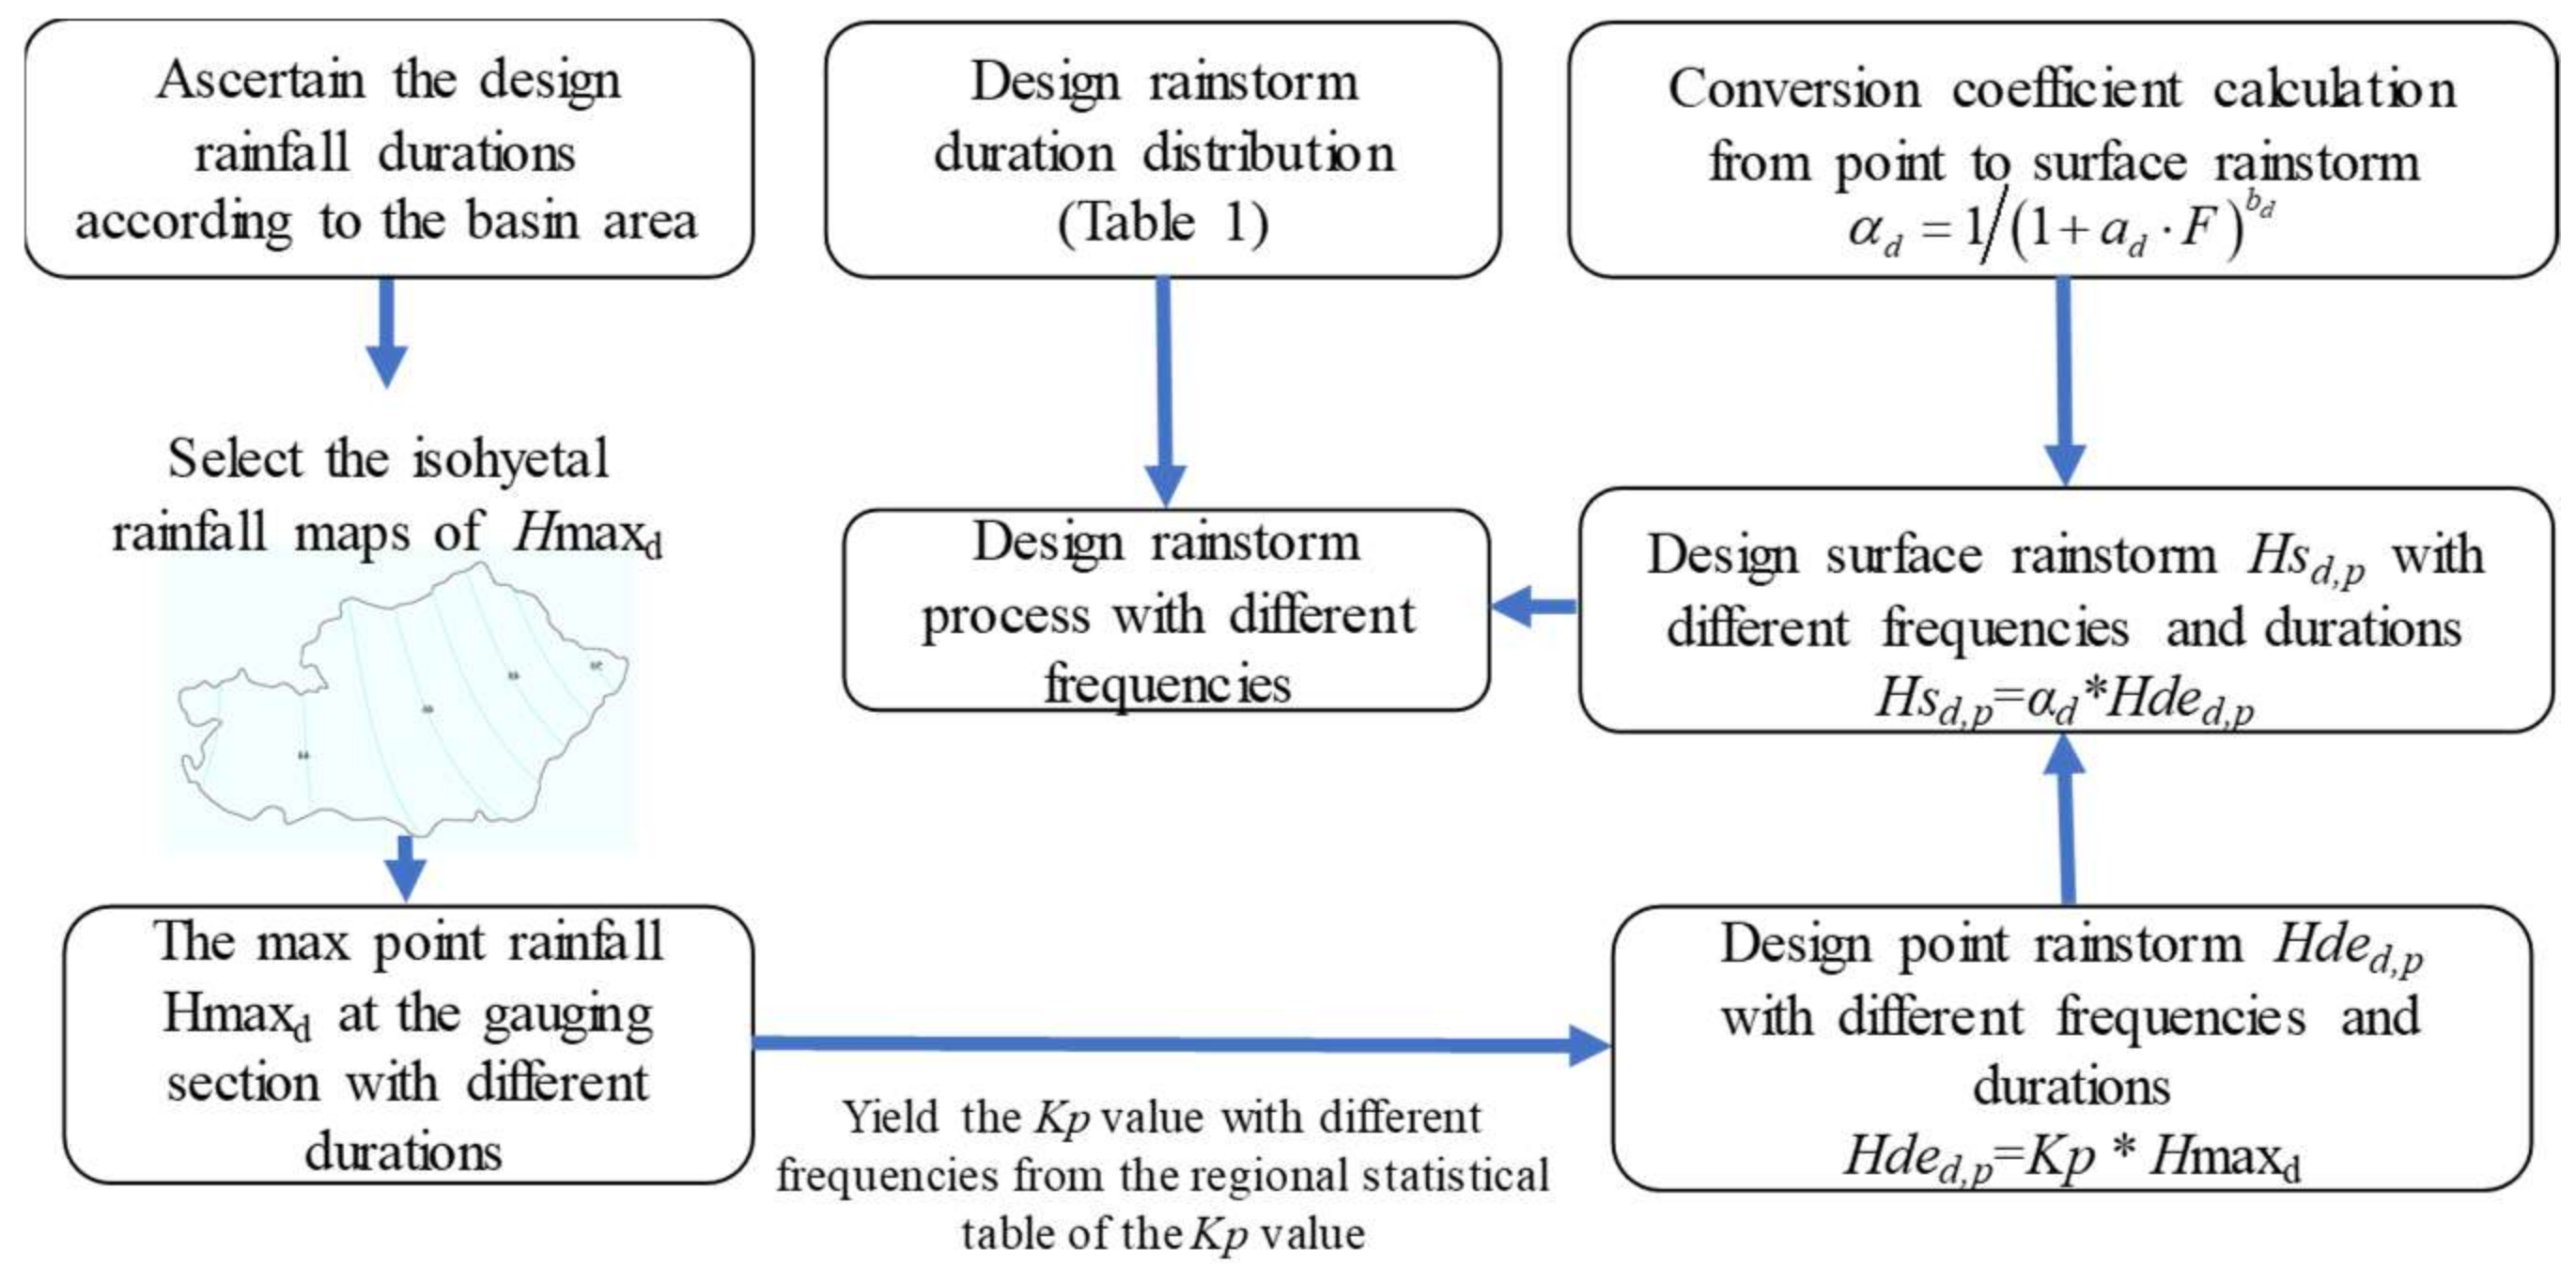
Figure 3.
Calculation diagram of the design rainstorm, where ad and bd are linear fitting parameters; Hmax represents the max point rainfall with different durations d; the coefficient of modulus Kp value, the maximum point isohyetal rainfall maps, and the linear fitting parameters in empirical formulas can be known from the regional practical hydrological handbook which provides many empirical formulas and parameter values for the hydrological design in the region.

Figure 4.
Design net rainfall calculation method, where Ht (t = 1, 2,…, 24) represents the hourly rainfall in the design rainfall duration curve; it (t = 1, 2,…, 24) represents the hourly rainfall intensity, mm/min; f represents the infiltration rate, mm/min; Rt (t = 1, 2,…, 24) represents the hourly depth of runoff, mm; W represents the water content of soil and its initial value is 33 mm; Rsumt represents the sum of Rt in 24 h, namely daily runoff depth, mm; Ru represents the daily underflow depth, mm; Ru represents the average hourly underflow depth; and Hnett (t = 1, 2,…, 24) represents the hourly net rainfall.

Figure 5.
Calculation method for the parameter values of n and K, where F represents the catchment area, km2; J represents the slope of the main channel; Hnetmax2 represents the maximum net rainfall in 2 h; l and g represent parameters of the design floods; ic represents the critical rainfall intensity; m1 represents hysteresis, which is equivalent to the time interval between the centroid of the net rainfall process and the centroid of the runoff process; m2 represents the measurement parameter reflecting the instantaneous unit hydrograph shape; and n is the parameters used in calculating the instantaneous unit hydrograph; and K represents the parameter about the time of concentration.

Figure 6.
Flowchart of the early warning system for flash flood disasters, where d represents the duration; Hmaxd represents the max point rainfall with different durations, mm; ip represents the rainfall threshold with one hour; Cv1 represents the coefficient of variation of max point rainfall when d = 1; Kp represents the coefficient of modulus; xd represents the threshold of rainfall with different durations; β represents the rainstorm decline coefficient.

Figure 7.
Isohyetal rainfall maps of Zichang County. Hmaxd is the max point rainfall with different durations, mm.
Figure 7.
Isohyetal rainfall maps of Zichang County. Hmaxd is the max point rainfall with different durations, mm.

Figure 8.
Isogram of the coefficient of variation of max point rainfall (Cvd) of Zichang County. Cvd is the coefficient of variation with different durations.
Figure 8.
Isogram of the coefficient of variation of max point rainfall (Cvd) of Zichang County. Cvd is the coefficient of variation with different durations.

Figure 9.
Hyetograph of design rainstorms and net rainfall: Anding (a), Qiangjiawan (b).

Figure 10.
Design flood hydrograph gauging section: Anding (a), Qiangjiawan (b).

Figure 11.
Cross-section map: Anding (a), Qiangjiawan (b).

Figure 12.
Curve of water stage-flow and population: Anding (a), Qiangjiawan (b).

Figure 13.
Critical rainfall/immediate migration index in rainfall with different antecedent precipitation values and durations (hours): Anding (a), Qiangjiawan (b).
Figure 13.
Critical rainfall/immediate migration index in rainfall with different antecedent precipitation values and durations (hours): Anding (a), Qiangjiawan (b).

Figure 14.
Preparation for migration index in rainfall with different antecedent precipitation and durations (hours): Anding (a), Qiangjiawan (b).
Figure 14.
Preparation for migration index in rainfall with different antecedent precipitation and durations (hours): Anding (a), Qiangjiawan (b).

Figure 15.
Accumulated rainfall curve for preparation and immediate migration and measured rainfall curve with different antecedent precipitation values.
Figure 15.
Accumulated rainfall curve for preparation and immediate migration and measured rainfall curve with different antecedent precipitation values.


Table 1.
Design rainstorm pattern with 24 h duration in Zichang County.
| Duration | Distribution of Design Rainstorm (%) | ||||
|---|---|---|---|---|---|
| (H) | Hs1,p | Hs3,p–Hs1,p | Hs6,p–Hs3,p | Hs12,p–Hs6,p | Hs24,p–Hs12,p |
| 1 | 10.6 | ||||
| 2 | 11.9 | ||||
| 3 | 17.9 | ||||
| 4 | 21.9 | ||||
| 5 | 52.2 | ||||
| 6 | 100 | ||||
| 7 | 47.8 | ||||
| 8 | 35.5 | ||||
| 9 | 29 | ||||
| 10 | 35.5 | ||||
| 11 | 15.2 | ||||
| 12 | 22.5 | ||||
| 13 | 9.4 | ||||
| 14 | 14.5 | ||||
| 15 | 7.6 | ||||
| 16 | 5 | ||||
| 17 | 7.6 | ||||
| 18 | 3.1 | ||||
| 19 | 4.4 | ||||
| 20 | 13.8 | ||||
| 21 | 7.6 | ||||
| 22 | 7.5 | ||||
| 23 | 9.4 | ||||
| 24 | 10.1 | ||||
| Total | 100 | 100 | 100 | 100 | 100 |
Table 2.
Method of calculation of the sum of net rainfall in each hour.
| Time (h) | Unit hydrograph u(t, △t) | Net rainfall (Hnett, mm) | Total Net Rainfall (mm) | |||
|---|---|---|---|---|---|---|
| Hnet1 | Hnet2 | … | Hnett | |||
| 0 | 0 | 0 | 0 | 0 | 0 | 0 |
| 1 | u(1,1) | u(1,1) × Hnet1 | 0 | 0 | 0 | Hnetsum1 |
| 2 | u(2,1) | u(2,1) × Hnet2 | u(1,1) × Hnet2 | 0 | 0 | Hnetsum2 |
| 3 | u(3,1) | u(3,1) × Hnet3 | u(2,1) × Hnet2 | … | … | Hnetsum3 |
| . | … | … | u(3,1) × Hnet2 | … | … | … |
| . | … | … | … | … | u(1,1) × Hnett | … |
| . | … | … | … | … | u(2,1) × Hnett | … |
| 23 | … | … | … | … | u(3,1) × Hnett | … |
| 24 | … | … | … | … | … | … |
Table 3.
Design point rainfall calculation results with different frequency.
| Disaster Prevention Objects | Duration (h) | Annual Maximum Rainfall and Statistical Parameters | Design Point Rainfall WITH Different Frequency | ||||||
|---|---|---|---|---|---|---|---|---|---|
| Hmaxd (mm) | Cvd | Cs/Cvd | 1% | 2% | 5% | 10% | 20% | ||
| Anding | 1 | 30.8 | 0.56 | 3.5 | 92.7 | 80.7 | 65.3 | 53.3 | 41.6 |
| 3 | 35.8 | 0.64 | 3.5 | 121.4 | 103.8 | 81.6 | 65.2 | 48.7 | |
| 6 | 43.0 | 0.62 | 3.5 | 141.5 | 121.7 | 96.3 | 77.0 | 58.5 | |
| 12 | 49.6 | 0.59 | 3.5 | 156.2 | 135.4 | 108.1 | 87.3 | 67.0 | |
| 24 | 56.0 | 0.57 | 3.5 | 171.4 | 148.4 | 119.8 | 97.4 | 75.6 | |
| Qiangjiawan | 1 | 31.5 | 0.56 | 3.5 | 94.8 | 82.5 | 66.7 | 54.4 | 42.5 |
| 3 | 36.5 | 0.64 | 3.5 | 123.7 | 105.8 | 83.2 | 66.4 | 49.6 | |
| 6 | 44.5 | 0.62 | 3.5 | 146.4 | 125.9 | 99.6 | 79.6 | 60.5 | |
| 12 | 50.2 | 0.58 | 3.5 | 155.6 | 135.1 | 108.4 | 87.8 | 67.7 | |
| 24 | 57.5 | 0.56 | 3.5 | 173.1 | 150.6 | 121.9 | 99.4 | 77.6 | |
Table 4.
Design surface rainfall calculation results with different frequencies.
| Disaster Prevention Objects | Duration (h) | Parameters | Point-to-Surface Conversion Parameter | Design Surface Rainfall with Different Frequency | |||||
|---|---|---|---|---|---|---|---|---|---|
| ad | bd | αd | 1% | 2% | 5% | 10% | 20% | ||
| Anding | 1 | 0.018 | 0.313 | 0.484 | 44.9 | 39.1 | 31.6 | 25.8 | 20.1 |
| 3 | 0.014 | 0.247 | 0.599 | 72.8 | 62.2 | 48.9 | 39.1 | 29.2 | |
| 6 | 0.009 | 0.209 | 0.698 | 98.8 | 85 | 67.2 | 53.7 | 40.8 | |
| 12 | 0.007 | 0.197 | 0.739 | 115.4 | 100 | 79.9 | 64.5 | 49.5 | |
| 24 | 0.007 | 0.187 | 0.763 | 130.7 | 113.2 | 91.4 | 74.3 | 57.7 | |
| Qiangjiawan | 1 | 0.018 | 0.313 | 0.453 | 42.9 | 37.3 | 30.2 | 24.6 | 19.2 |
| 3 | 0.018 | 0.313 | 0.569 | 70.4 | 60.2 | 47.3 | 37.8 | 28.2 | |
| 6 | 0.014 | 0.247 | 0.670 | 98.1 | 84.3 | 66.7 | 53.3 | 40.5 | |
| 12 | 0.009 | 0.209 | 0.712 | 110.7 | 96.1 | 77.1 | 62.5 | 48.2 | |
| 24 | 0.007 | 0.197 | 0.737 | 127.5 | 111 | 89.8 | 73.3 | 57.2 | |
Table 5.
Relative error between the simulated and measured water stages.
| Section | Simulated Water Stage Ea (m) | Measured Flood Mark Em (m) | Relative Error ε (%) |
|---|---|---|---|
| Anding | 1104.93 | 1104.87 | 0.005 |
| Qiangjiawan | 1070.36 | 1070.58 | 0.021 |
© 2019 by the authors. Licensee MDPI, Basel, Switzerland. This article is an open access article distributed under the terms and conditions of the Creative Commons Attribution (CC BY) license (http://creativecommons.org/licenses/by/4.0/).
Share and Cite
MDPI and ACS Style
Li, Z.; Zhang, H.; Singh, V.P.; Yu, R.; Zhang, S. A Simple Early Warning System for Flash Floods in an Ungauged Catchment and Application in the Loess Plateau, China. Water 2019, 11, 426. https://doi.org/10.3390/w11030426
AMA Style
Li Z, Zhang H, Singh VP, Yu R, Zhang S. A Simple Early Warning System for Flash Floods in an Ungauged Catchment and Application in the Loess Plateau, China. Water. 2019; 11(3):426. https://doi.org/10.3390/w11030426
Chicago/Turabian StyleLi, Zhehao, Hongbo Zhang, Vijay P. Singh, Ruihong Yu, and Shuqi Zhang. 2019. "A Simple Early Warning System for Flash Floods in an Ungauged Catchment and Application in the Loess Plateau, China" Water 11, no. 3: 426. https://doi.org/10.3390/w11030426
Note that from the first issue of 2016, this journal uses article numbers instead of page numbers. See further details here.