Article

Open Channel Sluice Gate Scouring Parameters Prediction: Different Scenarios of Dimensional and Non-Dimensional Input Parameters

1
Water Resources Engineering Department, College of Engineering, University of Duhok, Duhok, Iraq
2
Dams and Water Resources Department, College of Engineering, University of Anbar, Ramadi, Iraq
3
UFR S2ATA « Sciences Agronomiques, de l’Aquaculture et des Technologies Alimentaires », Université Gaston Berger (UGB), BP 234-Saint Louis, Sénégal
4
Department of Water Engineering and Hydraulic Structures, Faculty of Civil Engineering, Semnan University, Semnan 3513119111, Iran
5
School of Civil Engineering, Faculty of Engineering, Universiti Teknologi Malaysia, Johor Bahru 81310, Malaysia
6
Civil, Environmental and Natural Resources Engineering, Lulea University of Technology, 97187 Lulea, Sweden
7
Sustainable Developments in Civil Engineering Research Group, Faculty of Civil Engineering, Ton Duc Thang University, Ho Chi Minh City, Vietnam
*
Author to whom correspondence should be addressed.
Water 2019, 11(2), 353; https://doi.org/10.3390/w11020353
Submission received: 25 January 2019 / Revised: 15 February 2019 / Accepted: 15 February 2019 / Published: 19 February 2019
(This article belongs to the Special Issue Water Resources Management Strategy Under Global Change)

Abstract

:
The determination of scour characteristics in the downstream of sluice gate is highly important for designing and protection of hydraulic structure. The applicability of modern data-intelligence technique known as extreme learning machine (ELM) to simulate scour characteristics has been examined in this study. Three major characteristics of scour hole in the downstream of a sluice gate, namely the length of scour hole (Ls), the maximum scour depth (Ds), and the position of maximum scour depth (Lsm), are modeled using different properties of the flow and bed material. The obtained results using ELM were compared with multivariate adaptive regression spline (MARS). The dimensional analysis technique was used to reduce the number of input variable to a smaller number of dimensionless groups and both the dimensional and non-dimensional variables were used to model the scour characteristics. The prediction performances of the developed models were examined using several statistical metrics. The results revealed that ELM can predict scour properties with much higher accuracy compared to MARS. The errors in prediction can be reduced in the range of 79%–81% using ELM models compared to MARS models. Better performance of the models was observed when dimensional variables were used as input. The result indicates that the use of ELM with non-dimensional data can provide high accuracy in modeling complex hydrological problems.

1. Introduction

Sluice gates are widely used in rivers, dams, spillways and barrages to control floods, retention of water and maintaining optimum flow [1,2]. In spite of numerous benefits, construction of such hydraulic structure leads to number of problems in the downstream of the structure due to changes in flow. Formation of local scour in the river bed is one of the major side effect of sluice gate. The high velocity of water through the gate leads to a strong local shear stresses over the river bed causing a local scour in the downstream which affects the stability of the structure and may lead to structural failure [3].
The scour formation is a complicated dynamic process and depends on river morphology and hydraulic flow properties [4]. At the earlier stages of scouring process, the finer particles are transported through the channel and the courser particles are swept upstream by the reverse vortexes as illustrated in Figure 1a [5]. The remaining courser particles covers the downstream end of scour hole and causes an increase in the courser layer thickness in scour-hole slope. When the downstream slope of generated scour hole increases, the effect of shear stresses on the particles reduces and a cloud of the moved particles are mounted in the downstream of scour hole. Lim and Yu [5] described that the maximum scour depth happens during the jet impingement (Figure 1b) which leads to a formation of a sediment-laden vortex. The generated vortexes start to take horizontal actions over the scour hole (Figure 1c), leading to some courser particles being retained in the hole and finer particles to be carried downstream of the scour hole.
Modeling scour parameters such as its depth and length are very important for taking necessary protective measures. Therefore, several studies have been conducted over the last century to understand the scouring phenomena [6,7]. A number of empirical equations have been developed using statistical methods to estimate scour-hole properties using river flow and bed materials [8,9,10,11,12]. The main drawback of the empirical formulation for scouring problem is the difficulty to relate the behavior of parameters with the scouring depth. This is due to the fact that the physical relationship between the independent parameters and the scour characteristics is highly stochastic and non-linear. Therefore, soft computing techniques have been introduced far more reliable and robust estimation of souring parameters in recent years.
One of the earliest studies conducted on scouring parameters determination using soft computing models by Reference [13], where a fuzzy model was used for the estimation of the scour parameters downstream of a dam’s vertical gate and soft computing methods were found to be reliable alternatives to conventional statistical methods. In recent years, a number of studies have been conducted to model scour-hole characteristics using various state-of-the-art artificial intelligence (AI) techniques. Azamathulla et al. [14] used a neuro-fuzzy scheme to compute the scour downstream spillways. Another study reported the implementation of artificial neural network (ANN) to compute the scour-hole characteristics in free and submerged hydraulic jump conditions [15]. Guven and Gunal [16] used explicit neural networks formulations (ENNF) to predict local scour in the downstream of grade-control structures. A multi-output descriptive neural network (DNN) was developed by Reference [17] to estimate scour geometry in the downstream of hydraulic structures. The genetic programming (GP) method was applied to predict scouring depth in the downstream of ski-jump bucket spillway [18]. The feasibility of gene expression programming (GEP) was also examined for the prediction of scour depth at the downstream of sills and flip-bucket spillway [19,20]. The GEP was also used to predict scour depth in stilling basins [21]. Onen [22] employed ANN and GEP to investigate the scour process in the downstream of a side weir. Goel and Pal [23] inspected the potential of support vector machine (SVM) to simulate the scouring properties in the downstream of grade-control structures [23]. Sharafi et al. [24] also applied SVM to estimate scour depth around the bridge piers [24]. Goyal and Ojha [25] developed SVM and M5 model tree to predict the scour in the downstream of a ski-jump bucket. All the studies reported efficacy of the various versions of AI methods in modeling scour-hole properties.
With the improvement of AI techniques, more advanced soft computing techniques have been used in prediction of scour characteristics in recent years. Najafzadeh and Lim [26] developed an intelligent model based on the integration neuro-fuzzy, group method of data handling used particle swarm optimization (NF-GMDH-PSO) to estimate the local scour in the downstream of a sluice gate with an apron. Hybridization of NF, GMDH, GEP and evolutionary polynomial regression (EPR) in addition to NF-GMDH-PSO model was used to quantify the depth of scour at downstream of grade-control structures [27]. Najafzadeh [28] used the Neuro-fuzzy GMDH-based evolutionary algorithms to estimate scour pile. Most recently, Najafzadeh et al. [29] examined multiple AI models to model the local scour depth in the downstream of sluice gate. All the advanced AI modeling techniques demonstrated a superiority in the prediction performance over the conventional AI models. The trend of research in this regard is to explore more reliable and robust predictive models for the scouring depth determination owing to its complex variability.
In the present study, two recently developed soft computing techniques known as extreme learning machine (ELM) and multivariate adaptive regression spline (MARS) were adopted to estimate the three major characteristics of the geometry of scour hole, namely maximum scour depth, position of maximum scour depth and length of scour hole in the downstream of sluice gate. Data collected using laboratory experiments were used for calibration and validation of the models. The performance of the models for two different scenarios namely, dimensional and non-dimensional input variables in the prediction of scour characteristics were investigated. The accuracy and the precision of ELM models were compared with MARS models to show the efficacy of ELM in modeling scouring phenomena.

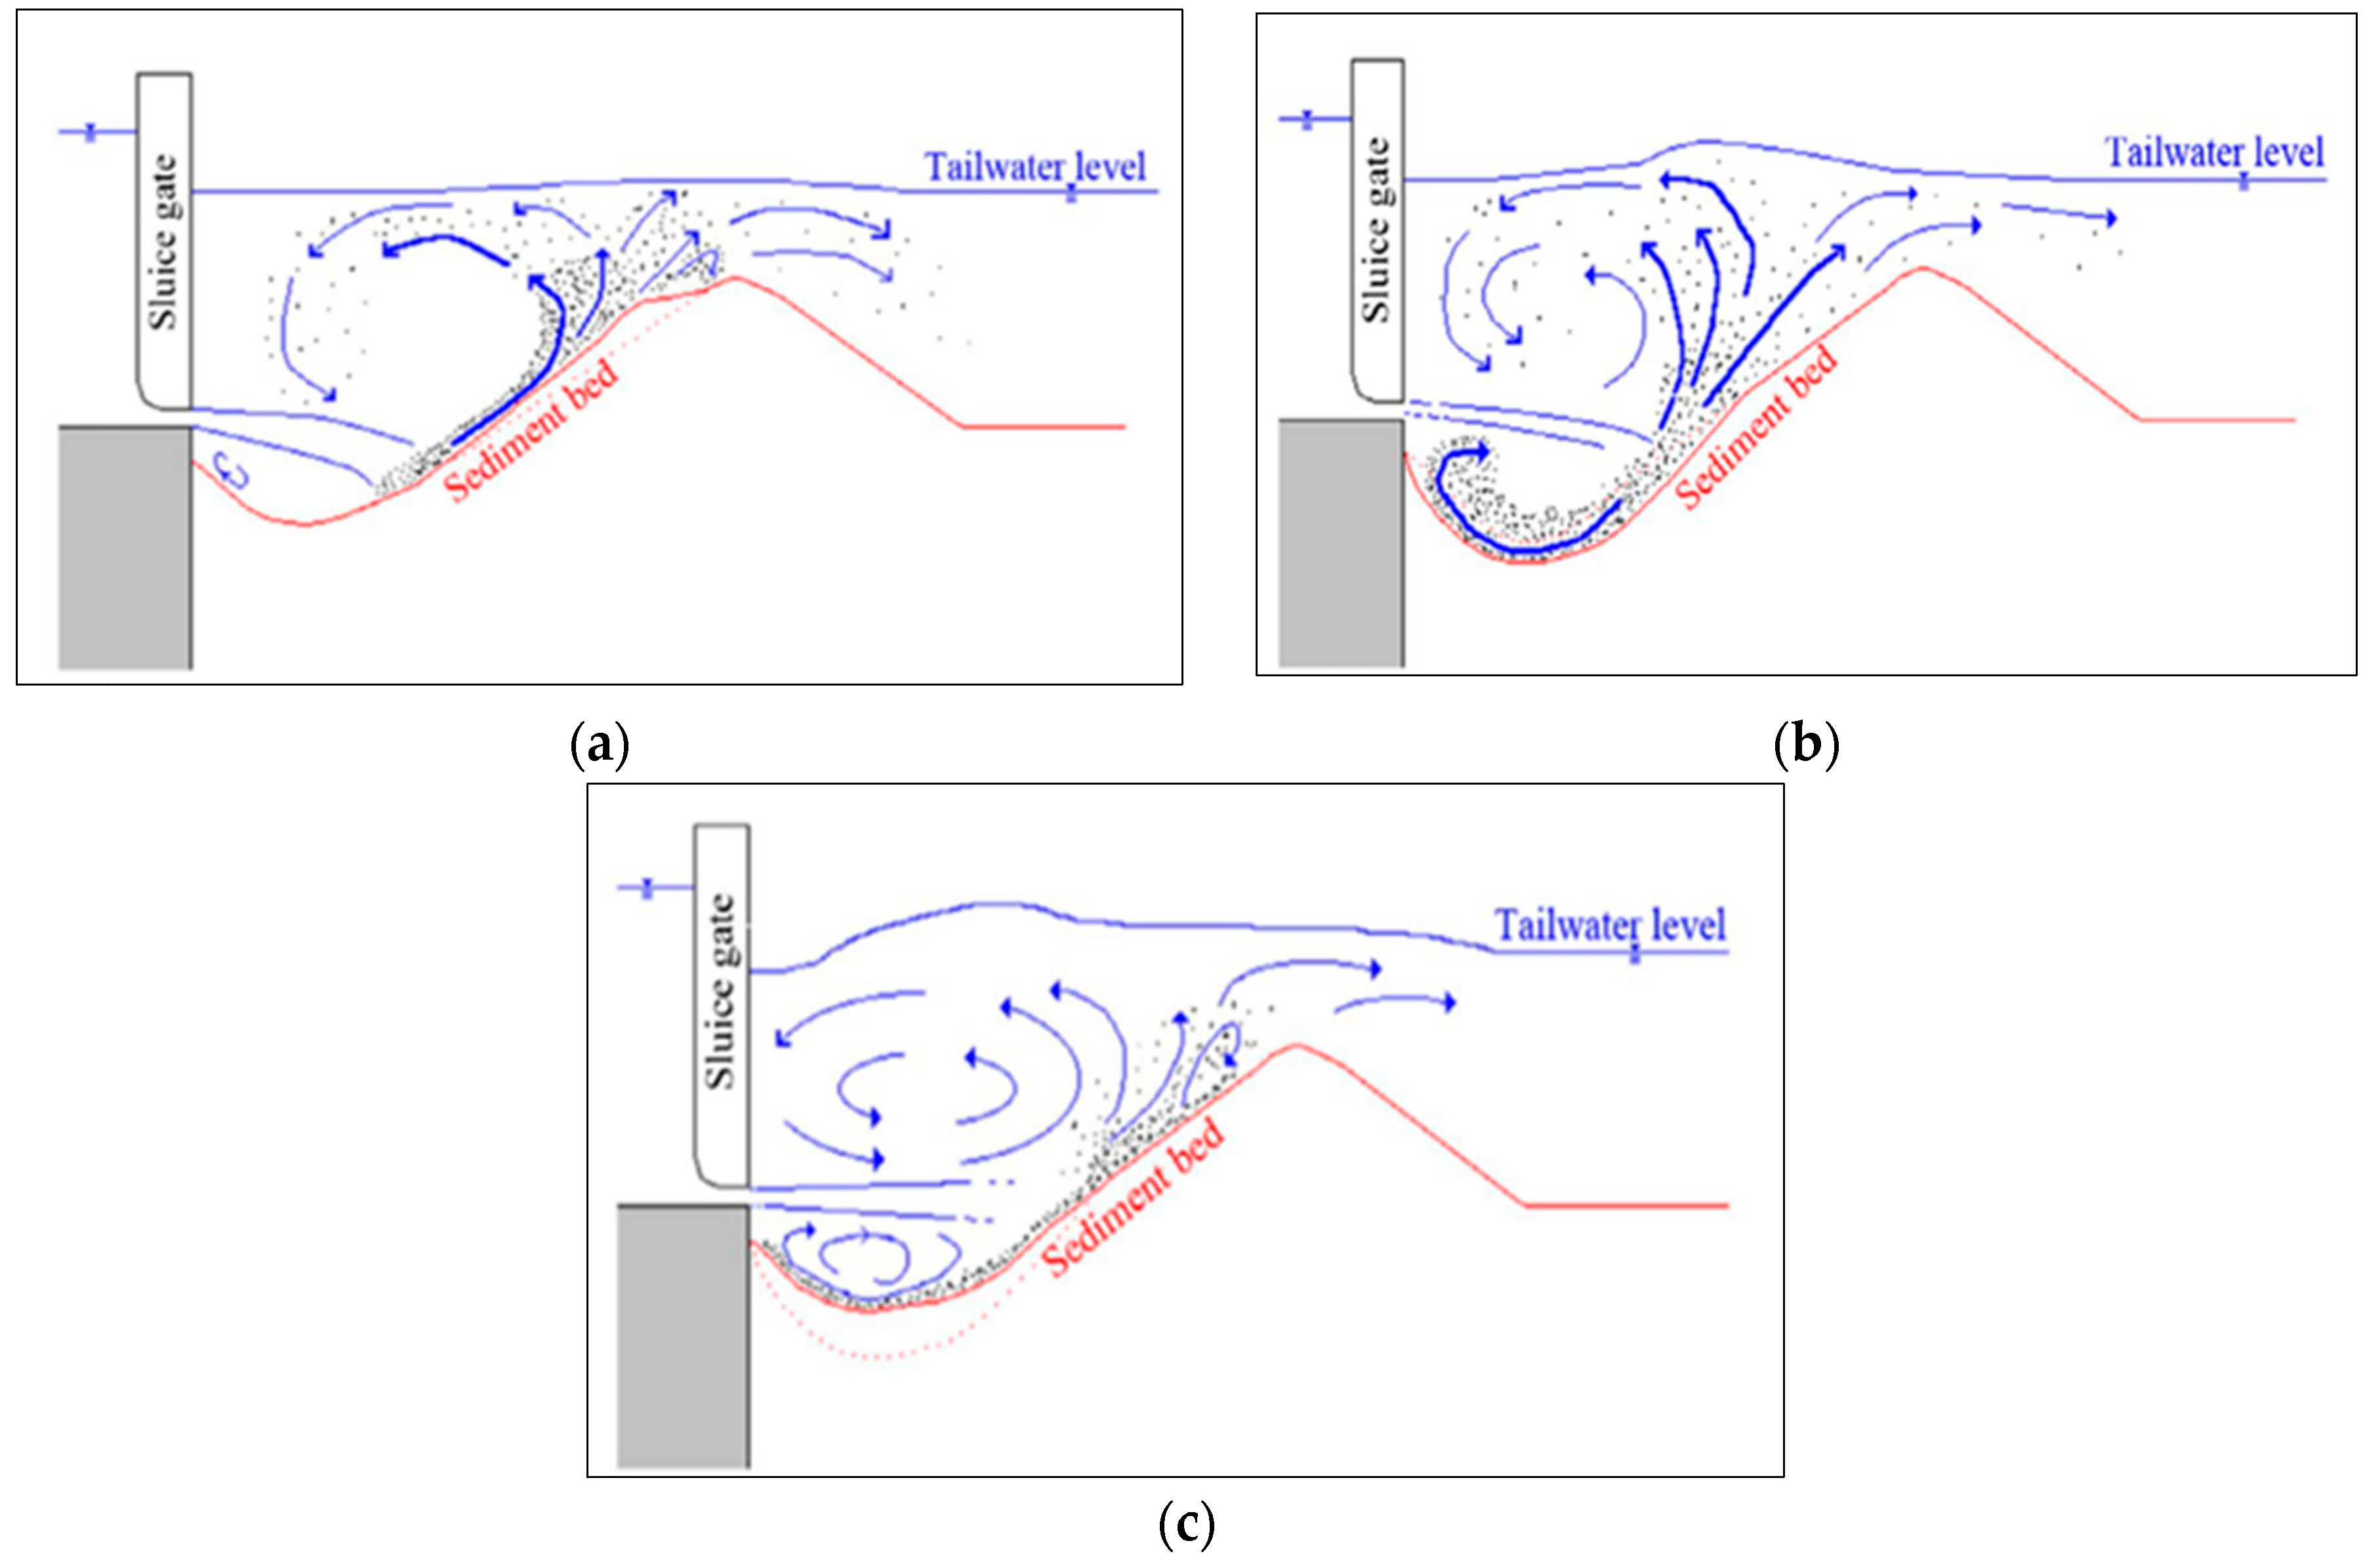
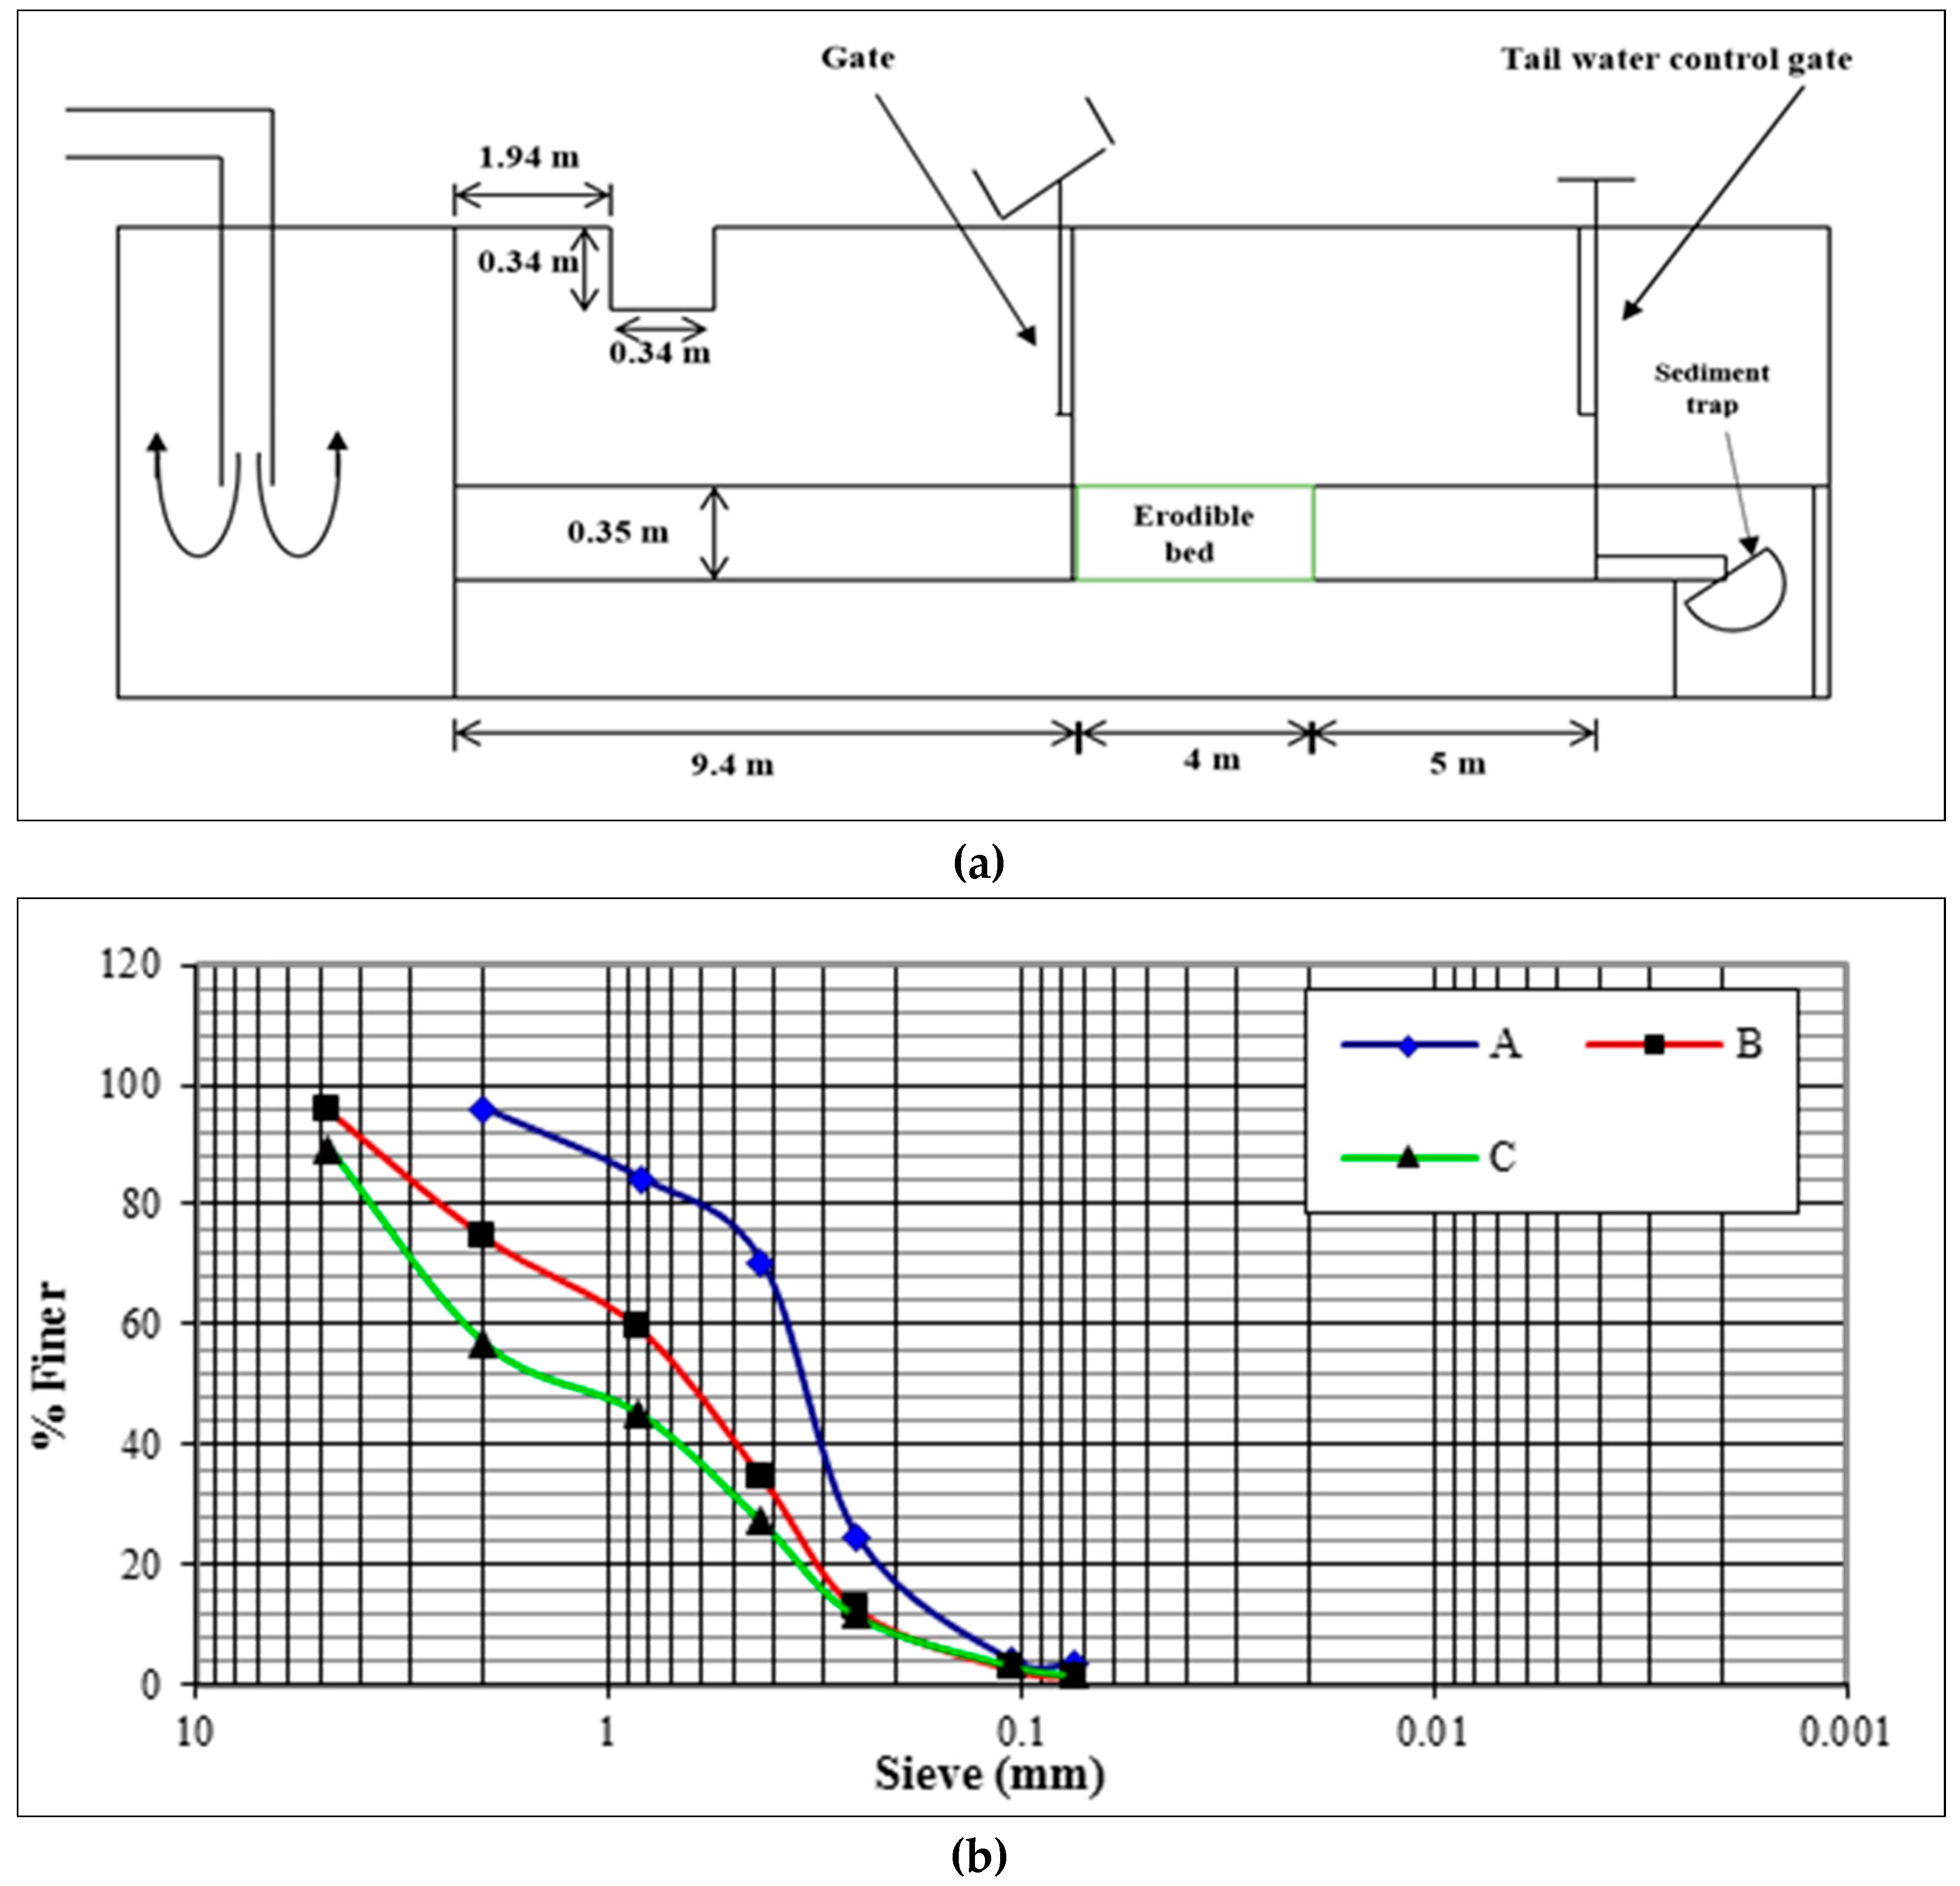
2. Laboratory Experiment of Scouring in Sluice Gate

An experimental investigation was conducted in the hydraulic laboratory of the College of Engineering at University of Mosul to study the local scour phenomena in the downstream of sluice gate. A concrete channel with dimensions of 24.64 m length, 0.81 m width and 0.76 m height, as illustrated in Figure 2a, was used for the experiment. The channel was a recirculated system connected to pump with a maximum discharge equal to 100 L/s. Three different types of bed materials taken from Tigris River were used in the experiments. Table 1 presents the geometric standard deviation and mean diameter of bed materials. Figure 2b shows the results of the sieve analysis of bed materials used in the study.
The scour process in sluice gate downstream is affected by several properties of the flow and bed material which include the diameter of bed material, gate opening, velocity of flow under the gate, effective head of flow, density of water and bed material [5,8,30]. A functional relationship between the scour-hole characteristics and the influencing parameters can be expressed as followed:
Lc = f ( V 0 . a . ρ . Δ ρ . D 50 . Δ h . h 2 . g . μ )
where, Lc is the characteristics of scour hole (length of scour hole (Ls), maximum scour depth (Ds), and position of maximum scour depth (Lsm)); V 0 is the average velocity of flow under the gate; a is the gate opening; ρ and Δ ρ are density of water and the difference between the density of water and sediment; D 50 is the diameter of 50% of bed material; Δ h is the difference in head between upstream and downstream of the gate; h 2 is the tail water depth; and g and μ are gravitational acceleration and viscosity of water, respectively. The effect of the water viscosity is neglected in Equation (1) as the flow is turbulent. Data of scour-hole geometry and all the influencing factors mentioned in Equation (1) was collected through the laboratory experiment.
The dimensional analysis technique can be used to reduce the number of influencing parameters into a smaller number of dimensionless groups of the parameters,
L c a = f [ F r 0 = V 0 g Δ ρ ρ D 50 × Δ h a × h 2 a ]
where, L c / a is the relationship between scour hole properties (Ls, Ds and Lsm) and gate opening; F r 0 is the densimetric particle of Froude number; Δ h / a is the relationship between the effective head and gate opening; and h 2 / a is the relationship between tail water depth and gate opening.
Both the dimensional and non-dimensional parameters have been used in literature for the analysis of scouring phenomena using regression-based and artificial intelligence methods. It has been reported that the dimensionless parameters are more appropriate for modeling scour parameters [1,17]. In the present study, both the dimensional and non-dimensional parameters were used to simulate the scour-hole characteristics to assess the impacts of pre-processing of input data in model performance.

3. Description of the Models

The ELM and MARS models were developed in this study to predict three parameters of sluice gate scour (Y) namely, the length of scour hole (Ls), the maximum depth of scour (Ds), and the position of maximum scour depth (Lsm) using different combinations of the predictors (X) which include the diameter of bed material, gate opening, velocity of flow under the gate, effective head of flow and the density of water and bed material. Separate models were developed for prediction of each of the three scour parameters. The description of ELM and MARS are given in following sections.

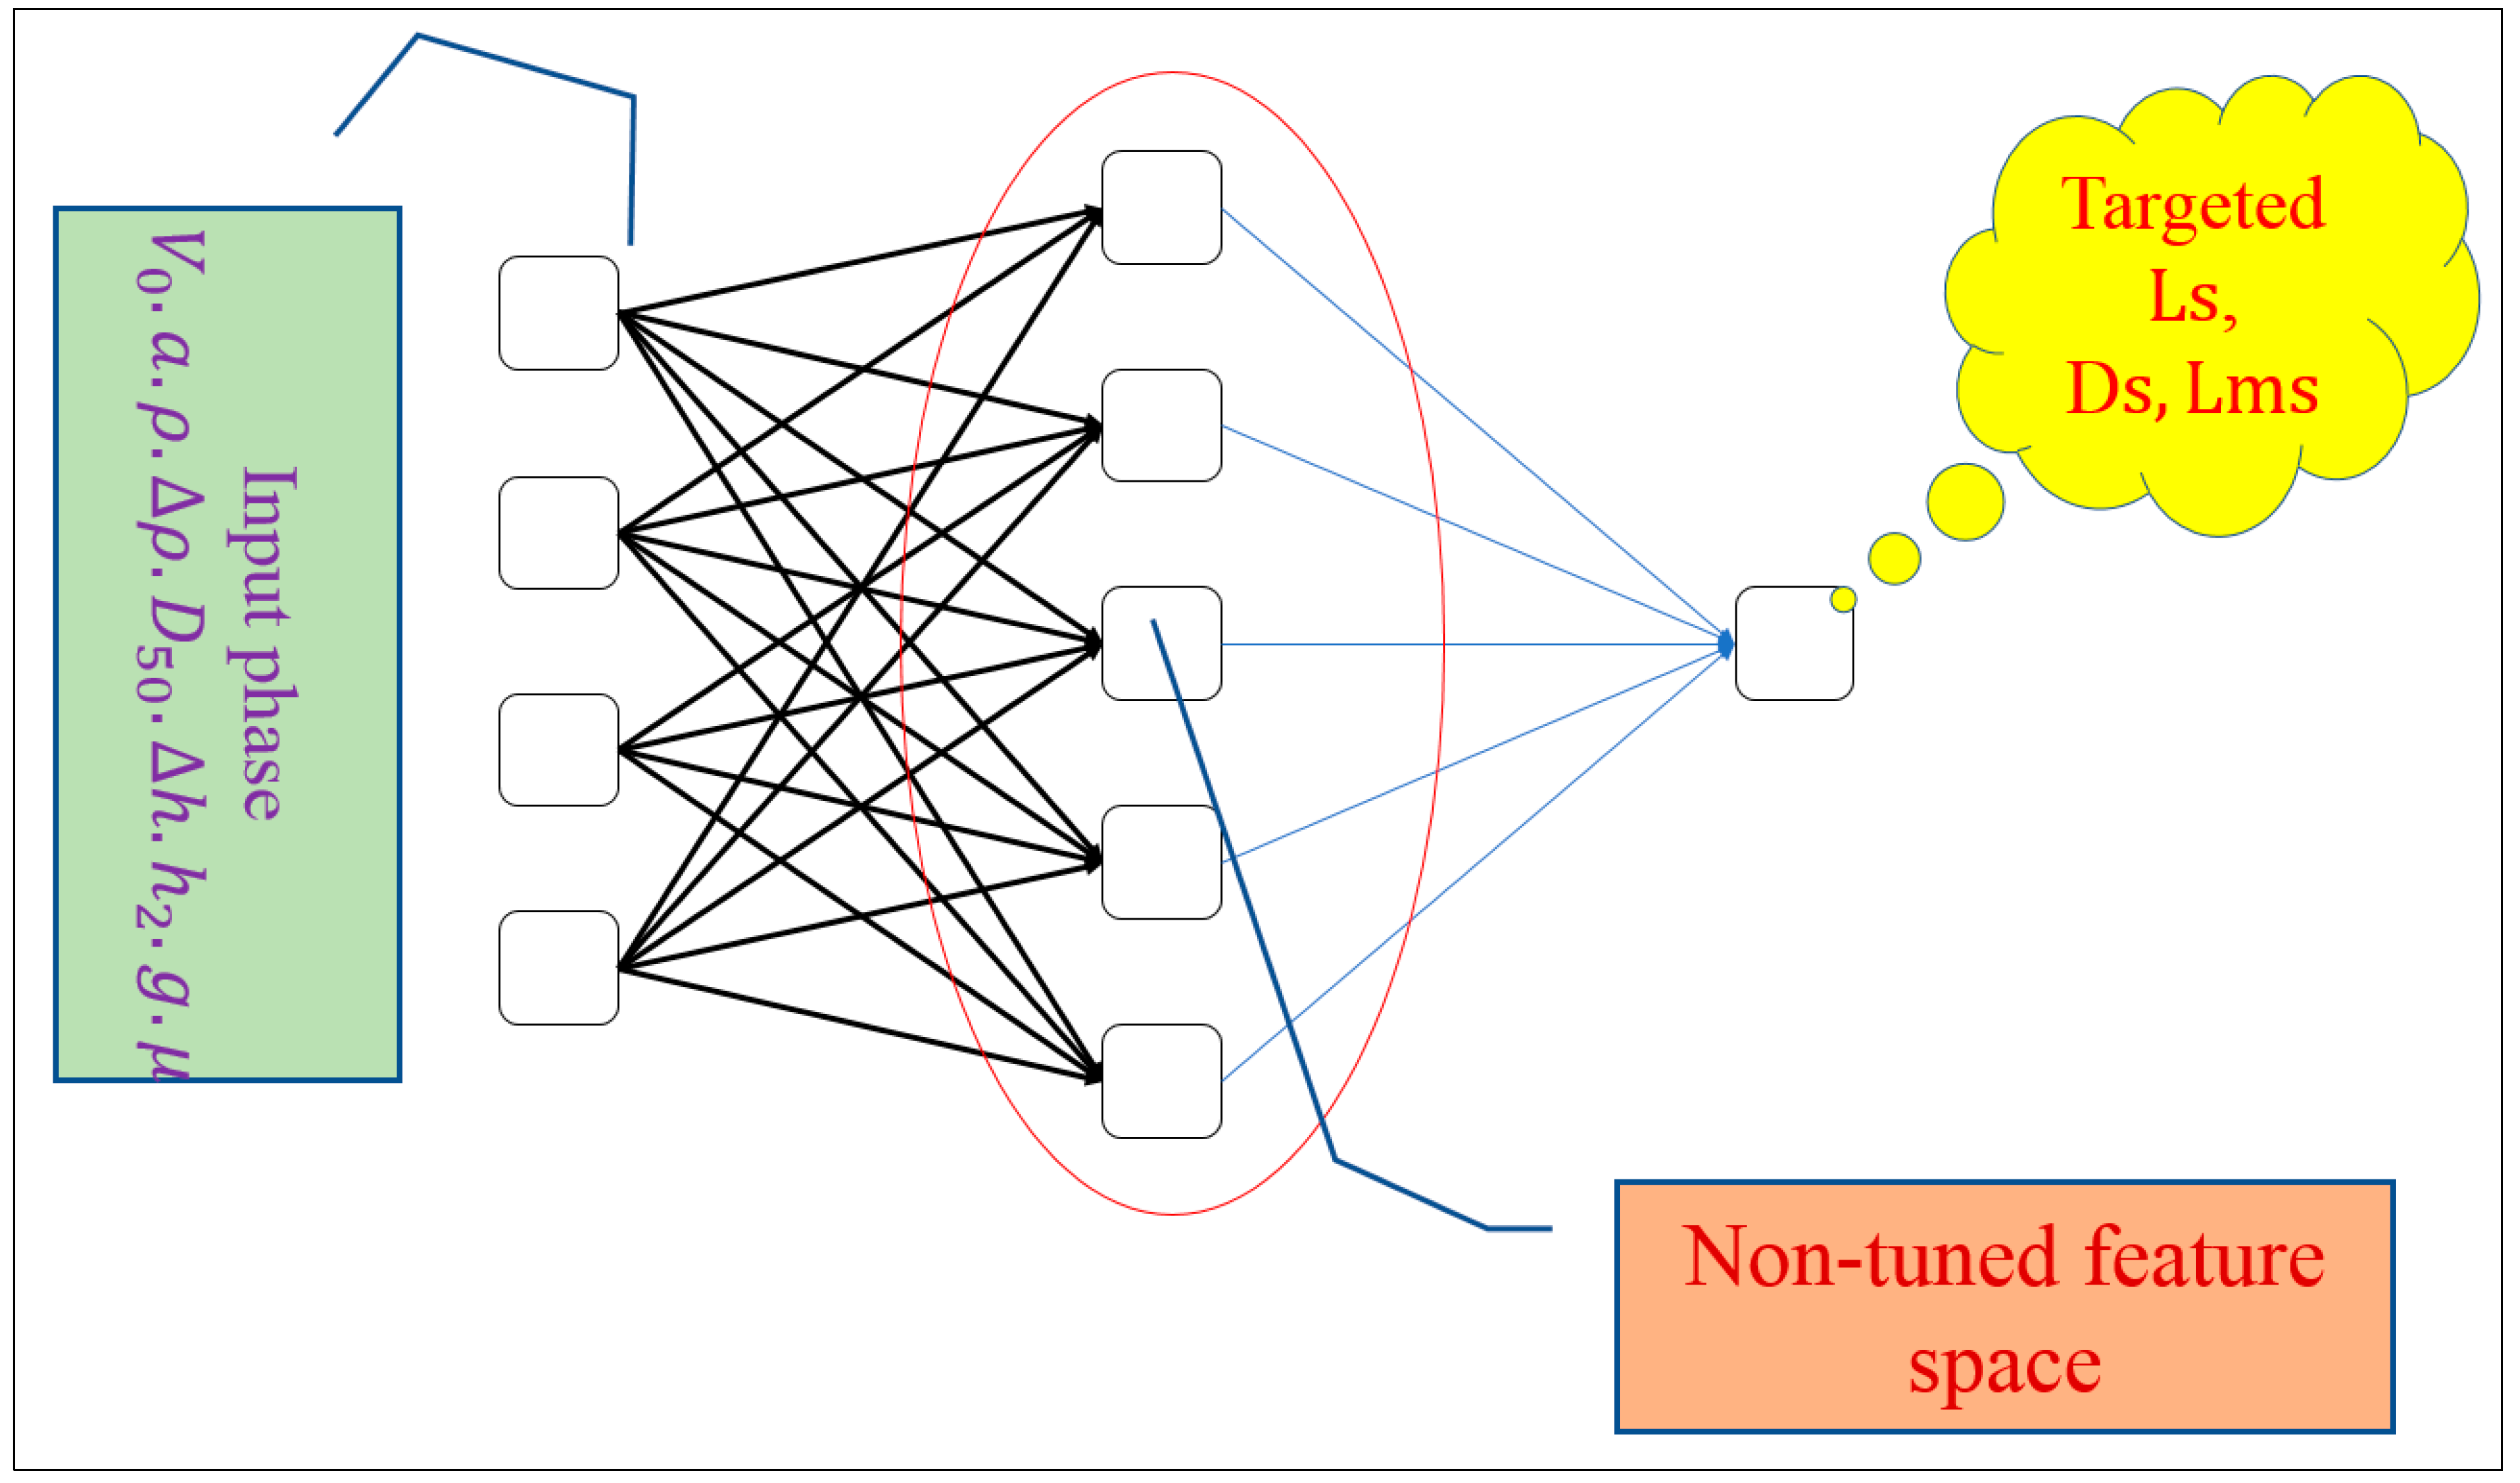
3.1. Extreme Learning Machine (ELM) Model

The ELM is one of the relatively new soft computing techniques that aims to overcome the reported limitations of the traditional artificial neural network model [31,32]. The term of “extreme” defines the robust feasibility of mimicking the human brain attitudes in analyzing complex problems with short time [33]. Unlike the classical soft computing techniques such as ANN and SVM which entail human intervention and internal tuning parameters, the learning process of ELM does not need to tune during the learning phase [34]. For its very simple and unique characteristics, the ELM has been positively used in various applications and has been found to have relatively better learning capacity in solving problems like clustering, regression, feature learning and classification [35,36,37,38].
Though various soft computing techniques have been successfully applied for the modeling of sour characteristics, no study has been conducted so far to assess the predictability feasibility of ELM model for simulating sluice gate scour parameters. The originality of the applied methodology in the present study is the fact that ELM model is fast learning process characterized [39]. Figure 3 shows the architectural structure of ELM model used in the present study. The input variables used in ELM model are the dimensional and non-dimensional information and the target variable is the sluice gate scour parameters. The internal weights of the input/hidden/output layers are randomly computed.
In ELM, the input data are processed through a M-dimensional plotting feature space that randomly regulates the internal weights, whereas the output of the network can be formulated as follows [34]:
F ( x ) = i = 1 M β i h i ( x )
where, β i is the output matrix weight. It is represented the connection weight between the hidden and output layers. h i is the hidden nodes output for the input variables (x). Finally, M symbolizes the dimension of the ELM algorithm’s feature space. The estimation of the scour property from multiple input parameters can be solved using the ELM learning processes as a function of regression problem [34] as:
H β = T
where, H signifies the feature space and T describes the target matrix. The main theorem of ELM algorithm is to perform the learning process based on the concept of the minimum error in accordance with the term: Minimize:‖T‖ and ‖β‖ whereas the hidden output layer H can be designated as follows [40]:
H = [ h 1 x 1 h M x 1 h 1 x N h M x N ]

3.2. Multivariate Adaptive Regression Spline

The main concept of MARS model is to explore the non-linear interactions between exploratory (i.e., inputs) and response variable for the prediction of response variable [41]. MARS does not require any assumption about the links between input(s) and the response variable [42] since the prediction is generated through learned relationships concealed in the multivariable dataset placed into a training-target matrix. The calibration data are split into splines that spread over the length of the dataset such that for each spline, the input is split into subgroups, nodes and hinges [43]. The nodes are much more (3–4 times) than the basis functions’ number [44], however, the number of nodes can be reduced by trial-error procedure to avoid overfitting. In this process, the shortest distance between neighboring nodes is identified to construct the MARS model.
The MARS models were developed in this study to predict the scour-hole characteristics (Y) from different combinations of the predictor (X). By analyzing the input-output matrix, a dual stage system was applied. In the first stage, the basis functions, BF(x), were identified and, in the second stage, the optimal functions were used to predict the scour-hole characteristics [45]. Considering X to be a N-length vector (x1, x2, …, xN), the MARS model estimates the target variable as,
Y = ξ ( X ) + ψ
where, ξ is the input matrix; ψ is distribution of MARS model’s residue; and N is the number of data used for training.
The MARS is designed to approximate ξ (.) by applying BF(x) with either a linear or a cubic piecewise function where max (0, xc) is realized and a knot is seen at position c [46]. The term max(.) indicates that only the part (.) > 0 is utilized, otherwise it is considered to be 0. This can be stated as follows:
max ( 0 , x c ) = { x c , i f   c t 0 , o t h e r w i s e
The function ξ (X) is based on a linear combination of BF(x) in accordance with
ξ ( X ) = β o + n = 1 N β n B F ( x )
where, β is a constant calculated via a least square approach. The MARS model is selected based on the generalized cross-validation (GCV), acting as a regularization (or penalty) term for the model [47]:
GCV = m s e [ 1 α N ] 2
where, mse is the mean squared error and α is the penalty [48]. The model may be overfitted if several basis functions are formed. Therefore, some of the bias functions are required to be removed during pruning phase of MARS model to choose the “best” model having least GCV metric [45].

3.3. Model Development

The ELM and MARS were used to develop regression models based on physical relationship between the predictors and the predictand, 80% of experimental dataset were used for the training of the models and the remaining 20% of the dataset were used for model validation. The accuracy of the models was evaluated using a number of statistical performance indicators namely, scatter index (SI), mean absolute percentage of error (MAPE), root mean square error (RMSE), mean absolute error (MAE), root mean square relative error (RMSRE), the correlation coefficient (R) [49]. The mathematical notions of the performance indicators can be expressed as,
S I = i = 1 n ( O b s i P r e i ) 2 n O b s i ´
M A P E = 100 n i = 1 n | O b s i P r e i O b s i |
R M S E = i = 1 n ( O b s i P r e i ) 2 n
M A E = i = 1 n | O b s i P r e i | n
R M S R E = 1 n i = 1 n ( O b s i P r e i O b s i ) 2
R = 100 × ( i = 1 n ( O b s i O b s i ´ ) ( P r e i P r e i ´ ) ) 2 i = 1 n ( O b s i O b s i ´ ) 2 i = 1 n ( P r e i P r e i ´ ) 2
where, O b s i is the observed values, P r e i is predicted values by the models, O b s i ´ is the mean of the observed values, P r e i ´ is the mean of the predicted values, and n is the length of the data series.

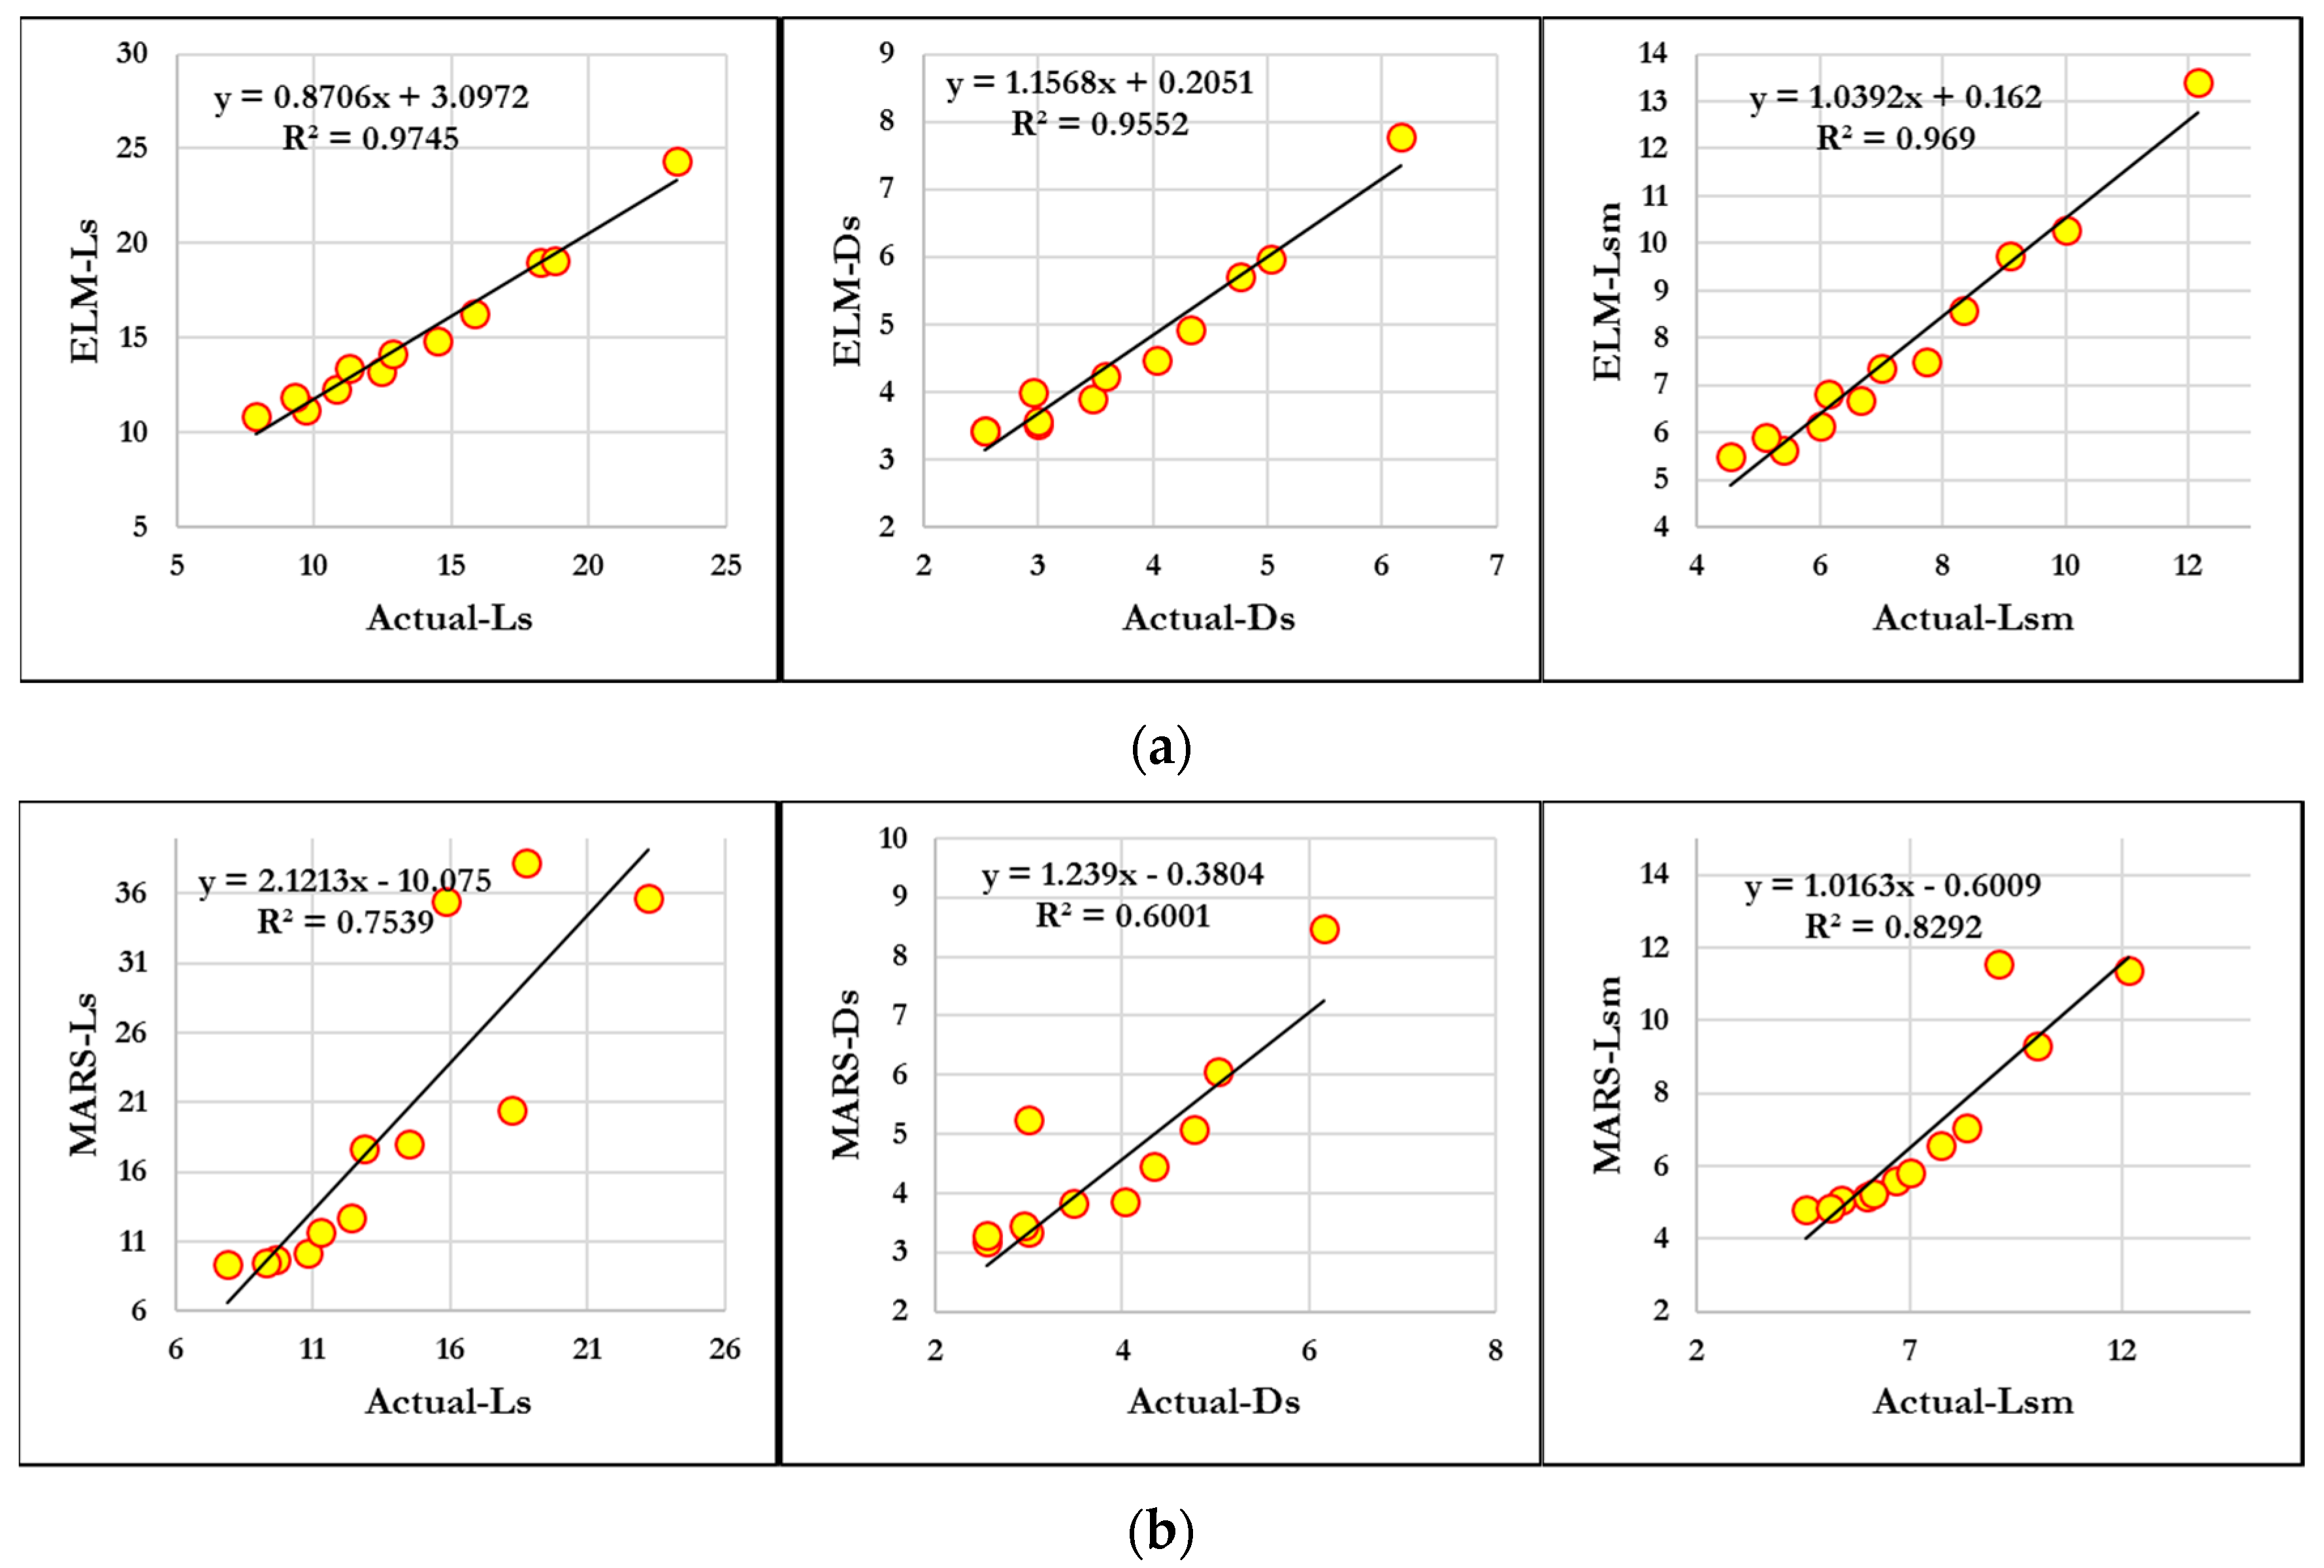
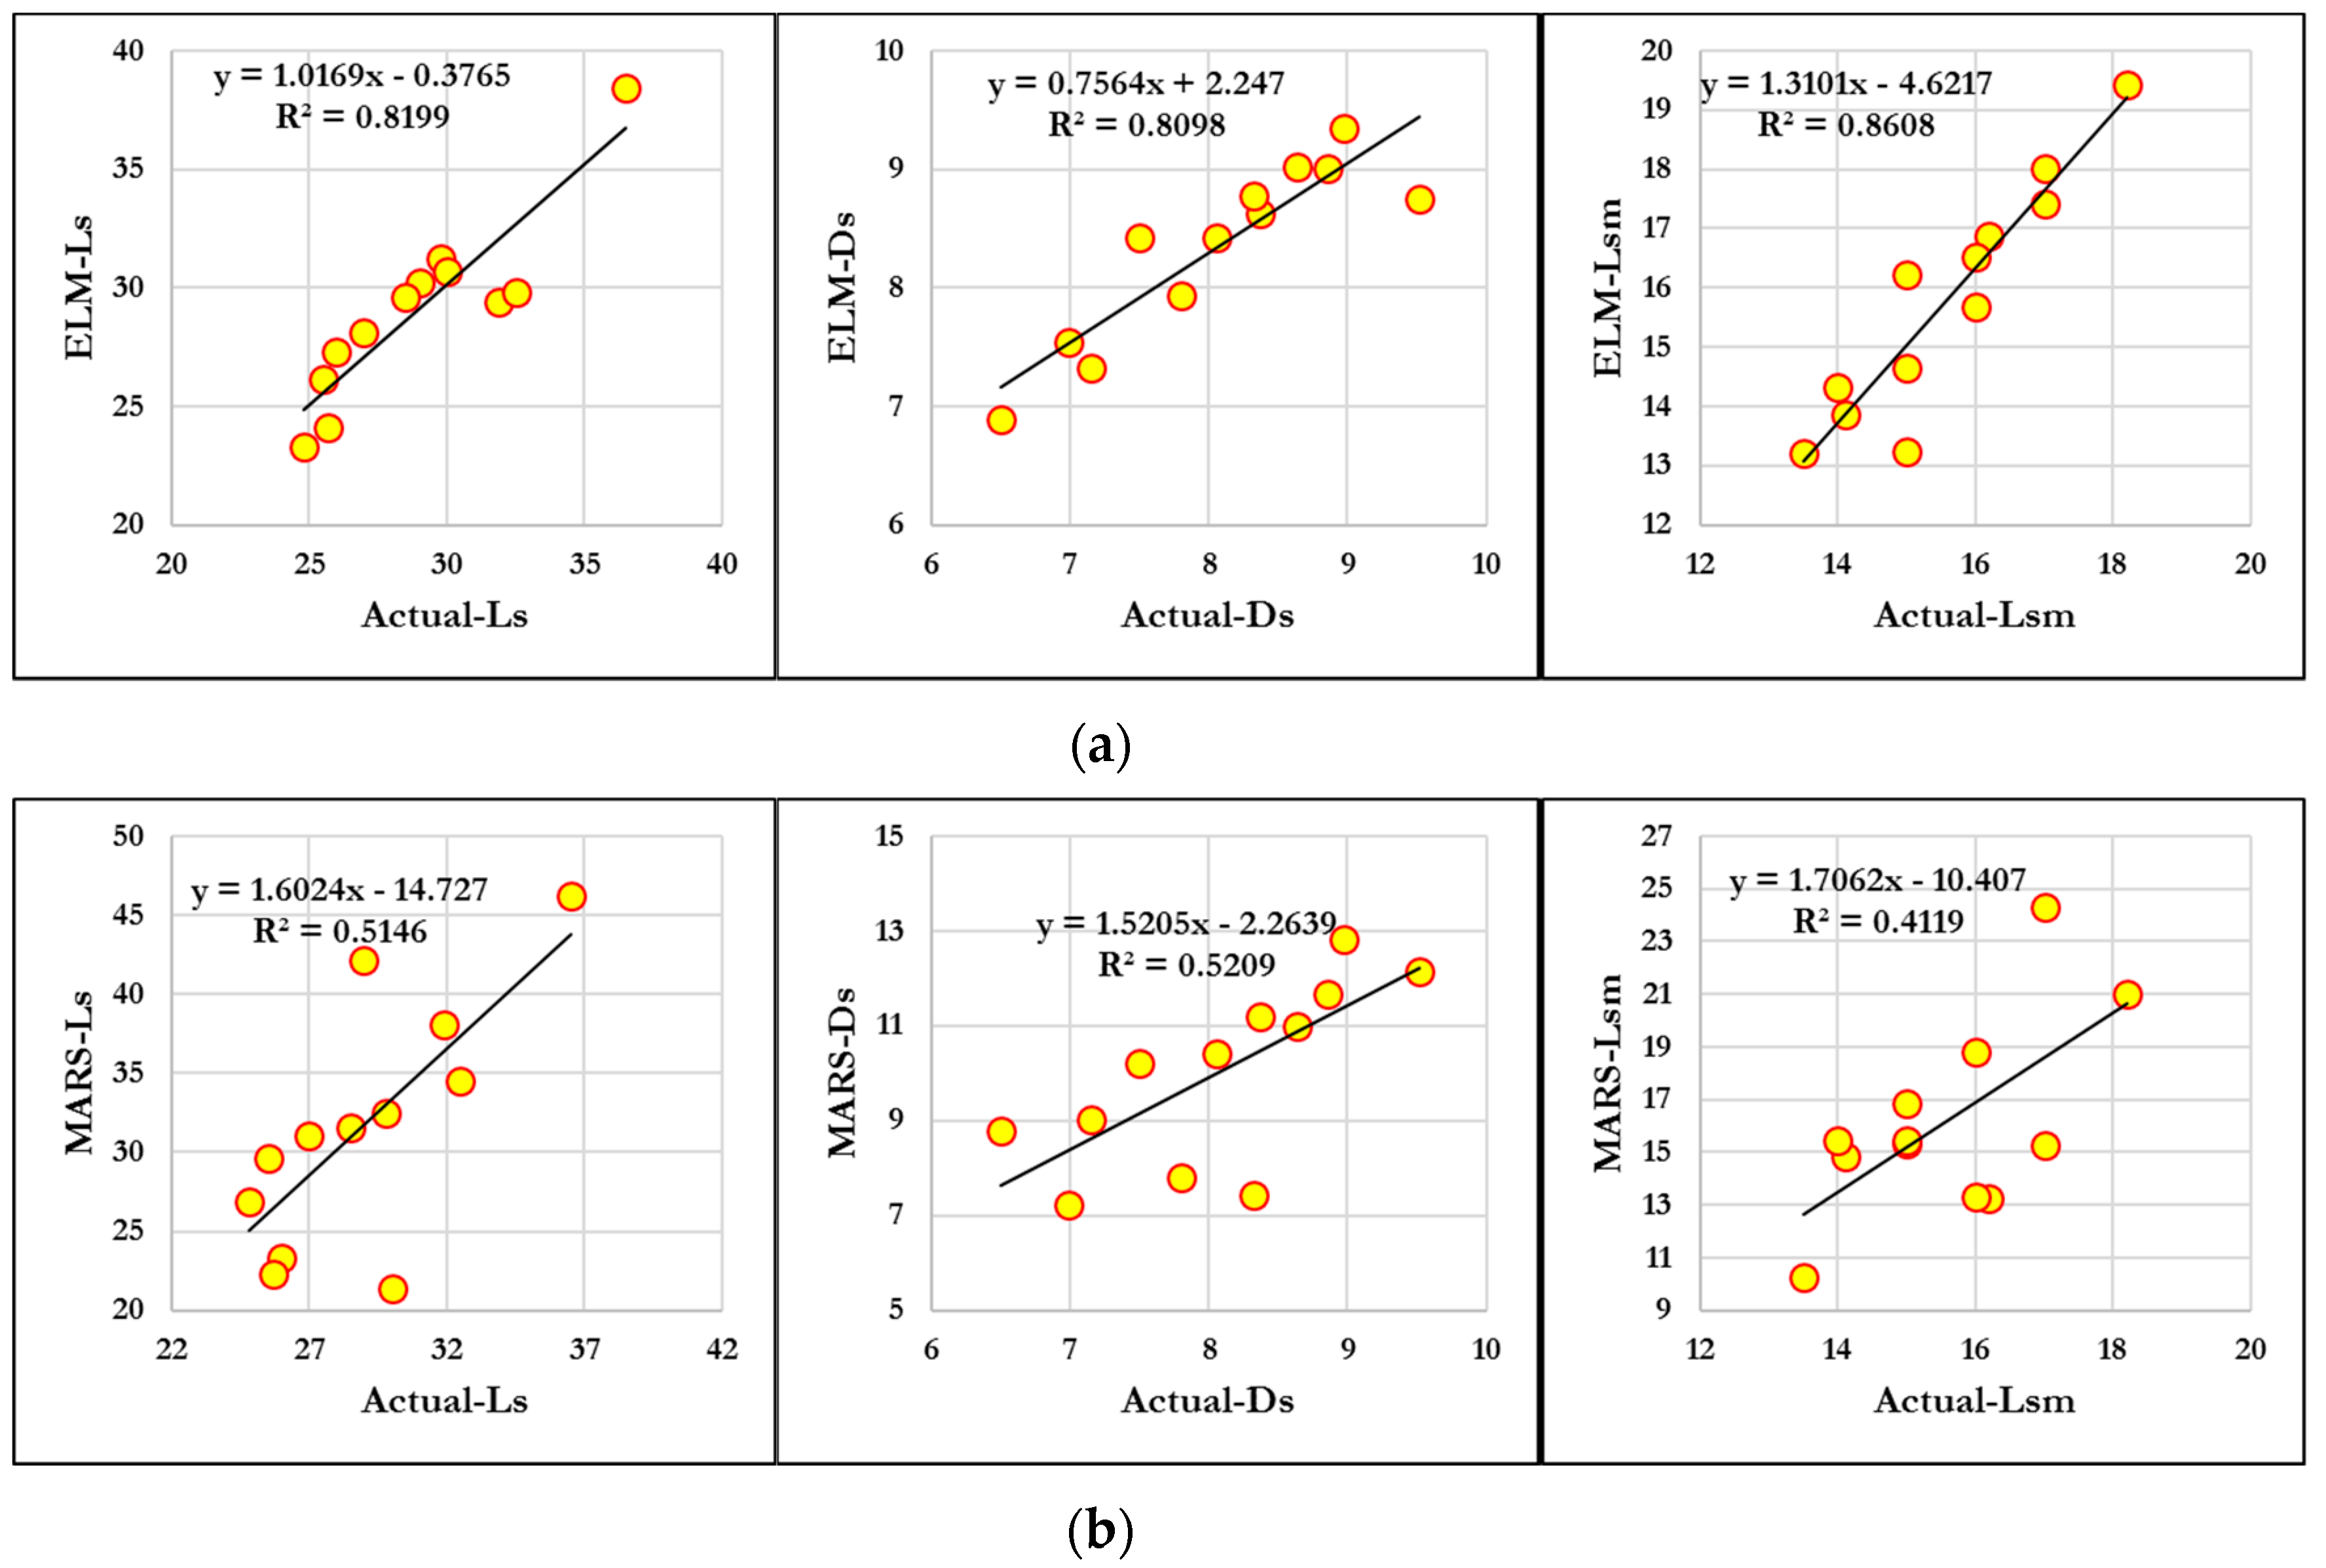
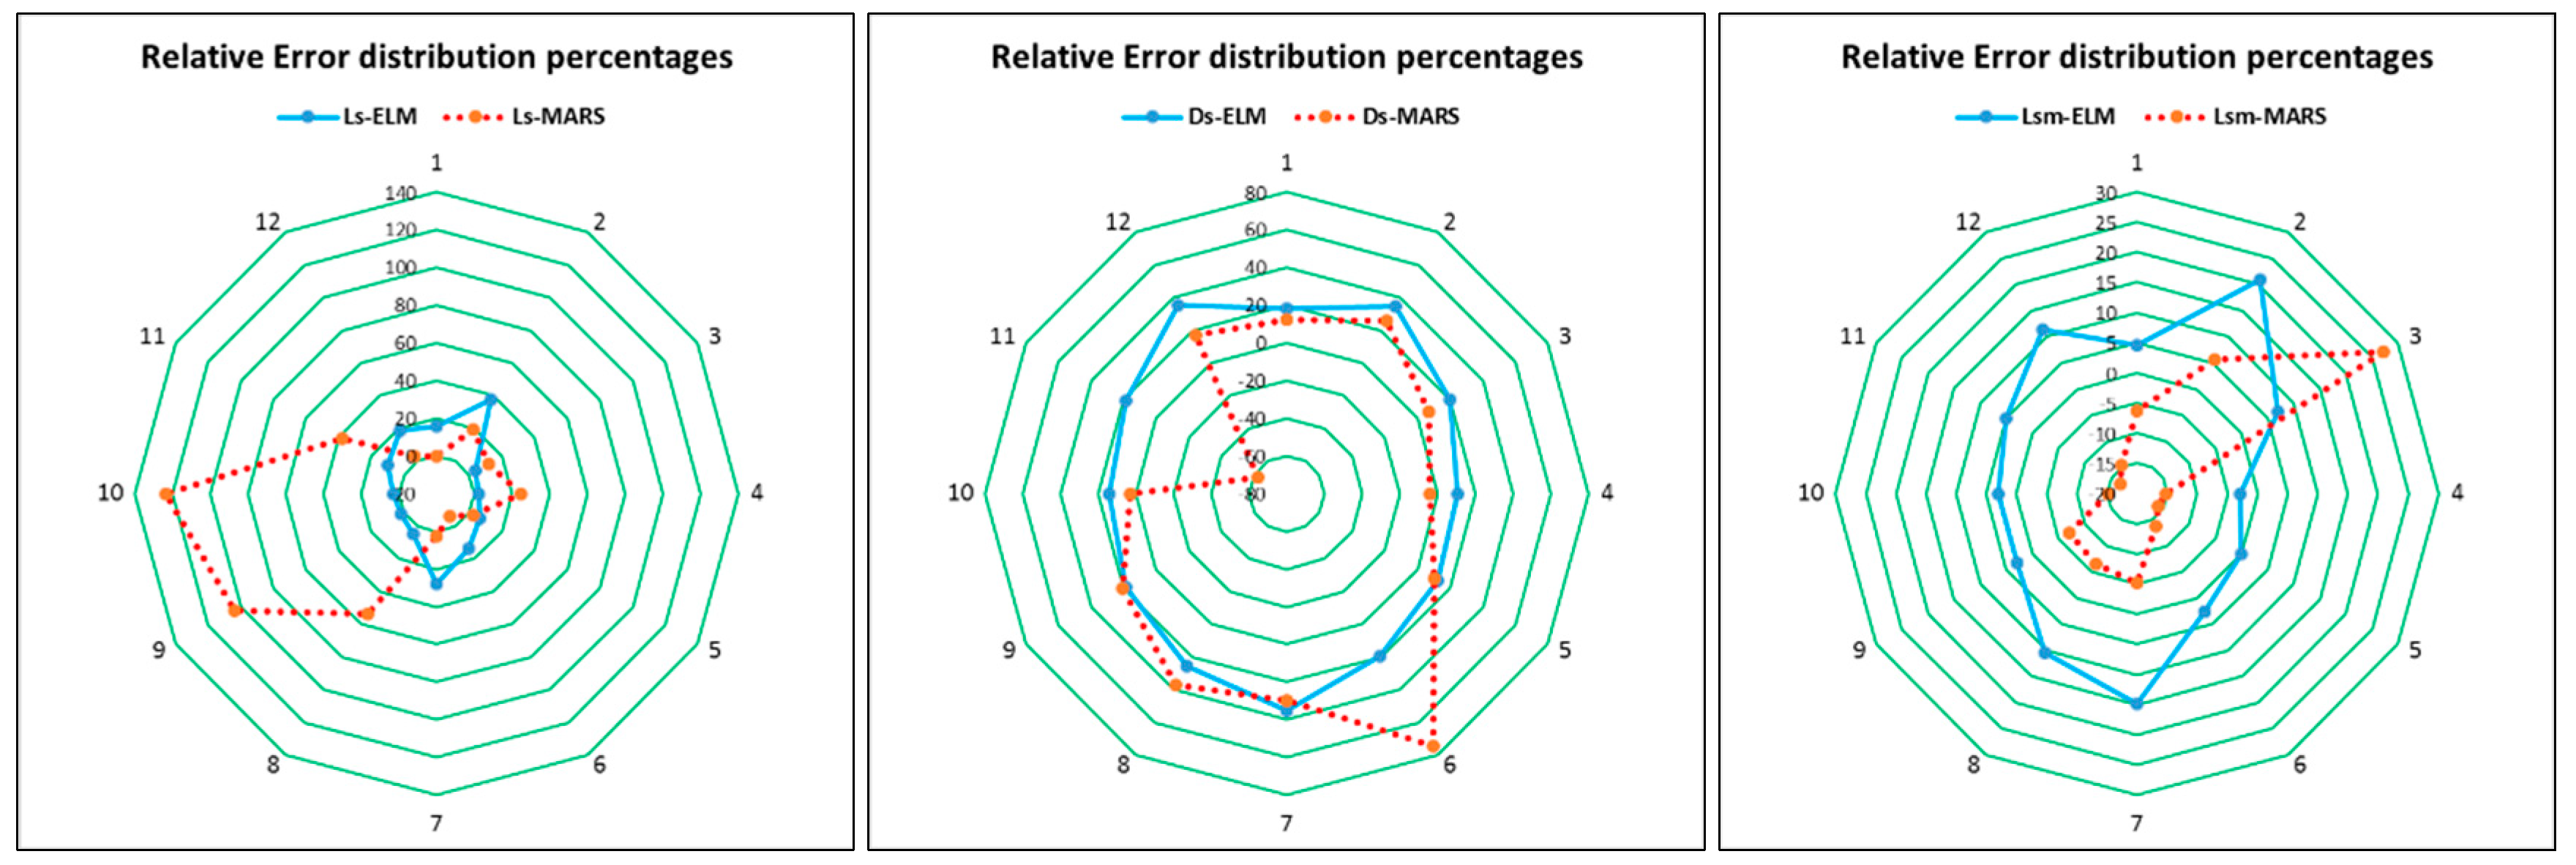
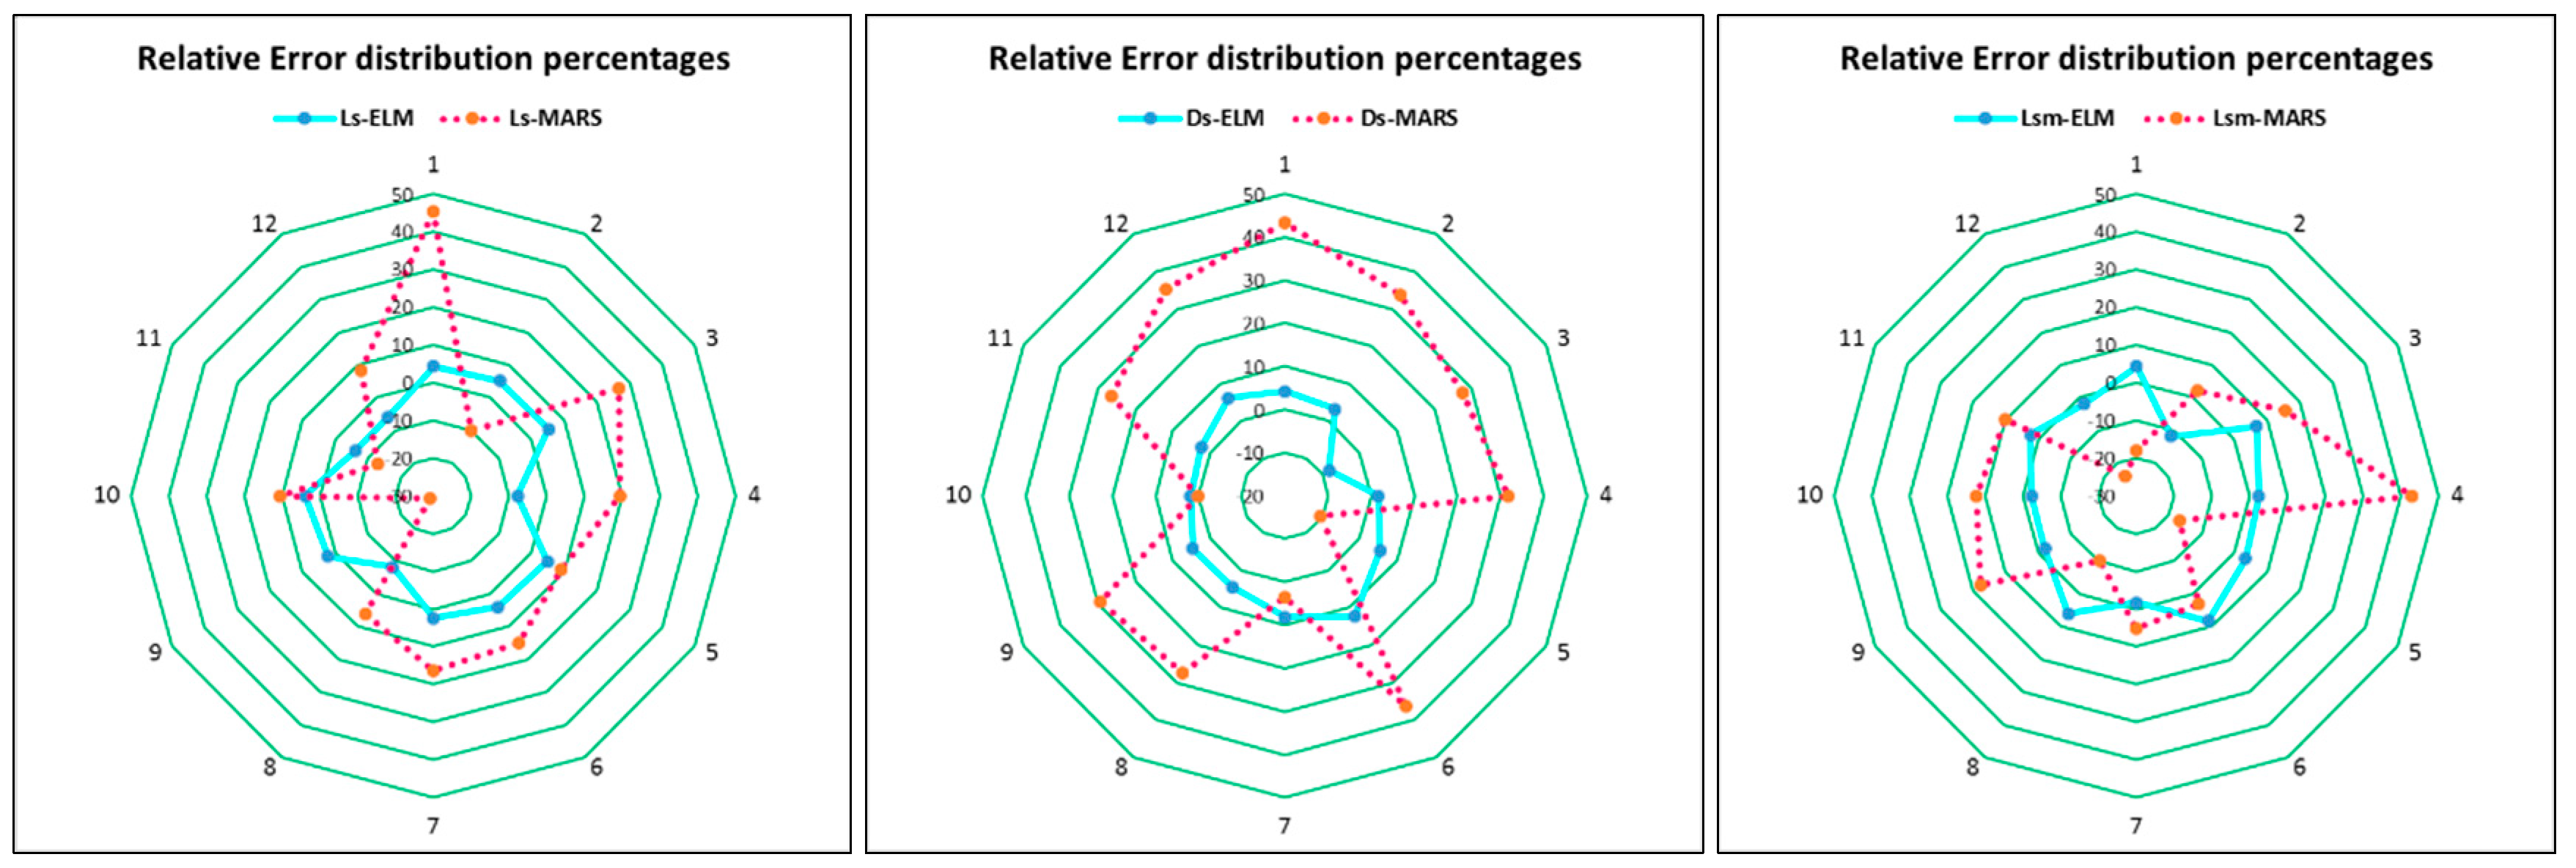
4. Results and Discussion

The capability of ELM in prediction of major characteristics of scour hole in a sluice gate downstream was compared with MARS in order to show the efficacy of ELM. The diameter of bed material, gate opening, velocity of flow under the gate, effective head of flow and density of water and bed material were used as input for the prediction of scour-hole characteristics. The impacts of two different scenarios, dimensional (Scenario I) and non-dimensional (Scenario II) input parameters in model predictive capacity were also inspected.
Table 2, Table 3, Table 4 and Table 5 show the statistical performance of the models in prediction of Ls, Ds, and Lsm using ELM and MARS for both the dimensional and non-dimensional input during model validation. The tables clearly show that ELM performed better in term of prediction accuracy compared to MARS for both the scenarios. The remarkable capability of the non-tuned ELM predictive model to abstract the physical mechanism of the relationship between the predictors and the predictand have made the ELM better in prediction.
Among the scour-hole parameters, the ELM was found best in prediction of Ds using dimensional data. This indicates the reliability of the dimensionless parameters as predictors for Ds. The dimensionless parameters (e.g., Froude number) are free from any measurement error; on the contrary, dimensional parameters might comprise various laboratory measurement errors that consequence less reliability of independent parameters. In cases of Lsm and Ls, the ELM gave foremost results for Scenario II except for RMSE and MAE.
The analysis of the results obtained using two different scenarios showed superior accuracy in terms of lower measure of the RMSE and MAE for ELM when non-dimensional parameters were used. The values of the prediction skill metrics, SI, MAPE, RMSE, MAE, RMSRE, and R were found equal to 0.0249, 0.0093, 0.2008, 0.0742, 0.0253 and 0.89 respectively in prediction of Ds for Scenario II. On the other hand, those skill metrics in prediction of Ds by MARS model were found 0.1232, 0.0456, 0.9925, 0.3717, 0.1207 and 0.72 respectively. There was a remarkable improvement in the absolute error metrics (RMSEMAE) by 79%–81% when ELM was used for prediction of Ds instead of MARS.
In order to analyze the agreement between the predicted and observed values of sluice gate scour parameters, scatter plots were generated (Figure 4 and Figure 5). The figures show excellent performance of ELM models in prediction of scour-hole characteristics with very convincing correlation coefficient. The results also showed that ELM model produced less error in predicting the scour-hole characteristics compared to MARS.
The ELM models were found to perform better when the dimensional variables were used compared to non-dimensional variables. The use of dimensional parameters was demonstrated substantively higher correlation coefficient values (>0.955). However, it should be noted that the high value of R2 is always not the measure of best prediction as it is based on linear agreement between the predicted and the observed values.
Figure 6 and Figure 7 illustrate the relative error distribution percentages over the testing period of the models using the dimensional and non-dimensional parameters, respectively. It can be noticed that, independent of the scour-hole characteristics (Ls, Ds, and Lsm), the prediction errors of ELM models were lower and had less sparse distribution. The ELM model was also found to yield least prediction error for both the dimensional and non-dimensional inputs. The relative errors in prediction of Ls were found to vary between −20 and 40 for ELM while −20 and 120 for MARS when dimensional variables were used as predictor. In the case of Ds, the prediction errors were found between 20 and 40 for ELM and between −80 and 80 for MARS, while for Lsm it was in the range of −2.5 to 20 for ELM and −20 to 27.5 for MARS. The results affirmed the superiority of the ELM over the MARS model. Furthermore, it proves that the dimensional analysis helps to substantially ameliorate the modeling results as confirmed in previous studies. Recalling the literature, artificial neural network and adaptive neuro-fuzzy inference system models were established to predict scour depth around bridge piers [50]. The authors reported better modeling performance using the dimensional variables over the normalized variables. In addition, it was reported by Reference [51] that the main advantage of the dimensional information is the capability to reduce the number and complexity of experimental variables by using a sort of compacting technique. The dimensional analysis retains only the variables that explain the physical phenomena properly and thus reduces errors and improves the accuracy of model prediction. The dimensional analysis can be a good alternative to reduce the time and resources required for experimental data collection. Therefore, the dimensional method can be linked with predictive models used for experimental data analysis to provide a strong tool for solving complex hydraulic problems.

5. Conclusions

Hydraulic structure in river can have substantial negative influence on river bed morphology such as fluvial geomorphology, sedimentology and others. Over the past decades, there have been several attempts to study the effects of hydraulic structure on scouring phenomena. However, there are still some limitations in reliable modeling of different scour characteristics using conventional regression analysis due to inherent limitation in the predictive capability of the techniques used. In this research, a new data-intelligence model called extreme learning machine has been introduced for predicting three major characteristics of sluice gate downstream scour hole using dimensional and non-dimensional information. The study revealed superiority of the ELM models over the traditional models in prediction of scour-hole characteristics. The study established the greater potential of ELM in solving complex hydrological problems [52].

Author Contributions

Conceptualization, Z.M.Y.; Data curation, A.A.Y.; Formal analysis, Z.M.Y.; Investigation, Z.M.Y.; Methodology, M.E.; Project administration, Z.M.Y.; Resources, S.O.S.; Software, M.E.; Supervision, S.S. and N.A.-A.; Validation, S.O.S.; Visualization, Z.M.Y.; Writing—original draft, Z.M.Y., A.A.Y., S.O.S. and L.D.; Writing—review & editing, L.D.

Funding

This research received no external funding.

Conflicts of Interest

The authors declare no conflicts of interest.

References

  1. Ali, H.M.; El Gendy, M.M.; Mirdan, A.M.H.; Ali, A.A.M.; Abdelhaleem, F.S.F. Minimizing downstream scour due to submerged hydraulic jump using corrugated aprons. Ain Shams Eng. J. 2014, 5, 1059–1069. [Google Scholar] [CrossRef] [Green Version]
  2. Novák, P.; Moffat, A.; Nalluri, C.; Narayanan, R. Hydraulic Structures, 4th ed.; Taylor & Francis: New York, NY, USA, 2007. [Google Scholar]
  3. Sharafati, A.; Yasa, R.; Azamathulla, H.M. Assessment of Stochastic Approaches in Prediction of Wave-Induced Pipeline Scour Depth. J. Pipeline Syst. Eng. Pract. 2018, 9, 4018024. [Google Scholar] [CrossRef]
  4. Simons, D.B.; Senturk, F. Sediment Transport Technology; Water Resources Publications: Fort Collins, CO, USA, 1976. [Google Scholar]
  5. Lim, S.Y.; Yu, G. Scouring downstream of sluice gate. In Proceedings of the First International Conference on Scour of Foundations, ICSF-1, College Station, TX, USA, 17–20 November 2002. [Google Scholar]
  6. Carstens, M.R. Similarity laws for localized scour. J. Hydraul. Div. 1966, 92, 13–36. [Google Scholar]
  7. Abrahim, H.I. Flume Study of Scour Length Downstream of Regulators with Variable Block Sizes; University of Baghdad: Baghdad, Iraq, 1978. [Google Scholar]
  8. Chatterjee, S.S.; Ghosh, S.N. Submerged Horizontal Jet over Erodible Bed. J. Hydraul. Div. 1980, 106, 1765–1782. [Google Scholar]
  9. Hassan, N.M.K.N.; Narayanan, R. Local Scour Downstream of an Apron. J. Hydraul. Eng. 1985, 111, 1371–1385. [Google Scholar] [CrossRef]
  10. Aderibigbe, O.; Rajaratnam, N. Effect of sediment gradation on erosion by plane turbulent wall jets. J. Hydraul. Eng. 1998, 124, 1034–1042. [Google Scholar] [CrossRef]
  11. Grimaldi, C.; Gaudio, R.; Calomino, F.; Cardoso, A.H. Countermeasures against local scouring at bridge piers: slot and combined system of slot and bed sill. J. Hydraul. Eng. 2009, 135, 425–431. [Google Scholar] [CrossRef]
  12. Kells, J.A.; Balachandar, R.; Hagel, K.P. Effect of grain size on local channel scour below a sluice gate. Can. J. Civ. Eng. 2001, 451, 440–451. [Google Scholar] [CrossRef]
  13. Uyumaz, A.; Altunkaynak, A.; Özger, M. Fuzzy Logic Model for Equilibrium Scour Downstream of a Dam’s Vertical Gate. J. Hydraul. Eng. 2006, 132, 1069–1075. [Google Scholar] [CrossRef]
  14. Azamathulla, H.M.; Deo, M.C.; Deolalikar, P.B. Alternative neural networks to estimate the scour below spillways. Adv. Eng. Softw. 2008, 39, 689–698. [Google Scholar] [CrossRef]
  15. Shenouda, B.; Abdel-rahim, G.A.; Ali, K.A.; Izumi, N. Prediction of Scour Downstream Regulators Using ANNs. Int. J. Hydraul. Eng. 2013, 2, 1–13. [Google Scholar]
  16. Guven, A.; Gunal, M. Prediction of Scour Downstream of Grade-Control structures using neural networks. J. Hydraul. Eng. 2008, 134, 1656–1660. [Google Scholar] [CrossRef]
  17. Guven, A. A multi-output descriptive neural network for estimation of scour geometry downstream from hydraulic structures. Adv. Eng. Softw. 2011, 42, 85–93. [Google Scholar] [CrossRef]
  18. Azamathulla, M.; Ghani, A.A.; Zakaria, N.; Lai, S.; Chang, C.; Leow, C.; Abuhasan, Z. Genetic programming to predict ski-jump bucket spill-way scour. J. Hydrodyn. Ser. B 2008, 20, 477–484. [Google Scholar] [CrossRef]
  19. Azamathulla, H.M. Gene-expression programming to predict scour at a bridge abutment. J. Hydroinform. 2012, 14, 324–331. [Google Scholar] [CrossRef] [Green Version]
  20. Guven, A.; Azamathulla, H.M. Gene-expression programming for flip-bucket spillway scour. Water Sci. Technol. 2012, 65, 1982–1987. [Google Scholar] [CrossRef]
  21. Mesbahi, M.; Talebbeydokhti, N.; Hosseini, S.; Afzali, S. Gene-expression programming to predict the local scour depth at downstream of stilling basins. Sci. Iran. Trans A Civil Eng. 2016, 23, 102. [Google Scholar] [CrossRef]
  22. Onen, F. Prediction of Scour at a Side-Weir with GEP, ANN and Regression Models. Arab. J. Sci. Eng. 2014, 39, 6031–6041. [Google Scholar] [CrossRef]
  23. Goel, A.; Pal, M. Application of support vector machines in scour prediction on grade-control structures. Eng. Appl. Artif. Intell. 2009, 22, 216–223. [Google Scholar] [CrossRef]
  24. Sharafi, H.; Ebtehaj, I.; Bonakdari, H.; Zaji, A.H. Design of a support vector machine with different kernel functions to predict scour depth around bridge piers. Nat. Hazards 2016, 84, 2145–2162. [Google Scholar] [CrossRef]
  25. Goyal, M.K.; Ojha, C.S.P. Estimation of Scour Downstream of a Ski-Jump Bucket Using Support Vector and M5 Model Tree. Water Resour. Manag. 2011, 25, 2177–2195. [Google Scholar] [CrossRef]
  26. Najafzadeh, M.; Lim, S.Y. Application of improved neuro-fuzzy GMDH to predict scour depth at sluice gates. Earth Sci. Inform. 2015, 8, 187–196. [Google Scholar] [CrossRef]
  27. Najafzadeh, M. Neuro-fuzzy GMDH based particle swarm optimization for prediction of scour depth at downstream of grade control structures. Eng. Sci. Technol. Int. J. 2015, 18, 42–51. [Google Scholar] [CrossRef] [Green Version]
  28. Najafzadeh, M. Neuro-fuzzy GMDH systems based evolutionary algorithms to predict scour pile groups in clear water conditions. Ocean Eng. 2015, 99, 85–94. [Google Scholar] [CrossRef]
  29. Najafzadeh, M.; Tafarojnoruz, A.; Lim, S.Y. Prediction of local scour depth downstream of sluice gates using data-driven models. ISH J. Hydraul. Eng. 2017, 23, 195–202. [Google Scholar] [CrossRef]
  30. Rajaratnam, N.; Macdougall, R.K. Erosion by Plane Wall Jets with Minimum Tailwater. J. Hydraul. Eng. 1983, 109, 1061–1064. [Google Scholar] [CrossRef]
  31. Yaseen, Z.M.; Jaafar, O.; Deo, R.C.; Kisi, O.; Adamowski, J.; Quilty, J.; El-shafie, A. Stream-flow forecasting using extreme learning machines: A case study in a semi-arid region in Iraq. J. Hydrol. 2016, 542, 603–614. [Google Scholar] [CrossRef]
  32. Sanikhani, H.; Deo, R.C.; Yaseen, Z.M.; Eray, O.; Kisi, O. Non-tuned data intelligent model for soil temperature estimation: A new approach. Geoderma 2018, 330, 52–64. [Google Scholar] [CrossRef]
  33. Huang, G.; Huang, G.B.; Song, S.; You, K. Trends in extreme learning machines: A review. Neural Netw. 2015, 61, 32–48. [Google Scholar] [CrossRef]
  34. Huang, G.-B.; Zhu, Q.-Y.; Siew, C.-K. Extreme learning machine: Theory and applications. Neurocomputing 2006, 70, 489–501. [Google Scholar] [CrossRef] [Green Version]
  35. Li, J.; Salim, R.D.; Aldlemy, M.S.; Abdullah, J.M.; Yaseen, Z.M. Fiberglass-Reinforced Polyester Composites Fatigue Prediction Using Novel Data-Intelligence Model. Arab. J. Sci. Eng. 2018. [Google Scholar] [CrossRef]
  36. Yaseen, Z.M.; Deo, R.C.; Hilal, A.; Abd, A.M.; Bueno, L.C.; Salcedo-Sanz, S.; Nehdi, M.L. Predicting compressive strength of lightweight foamed concrete using extreme learning machine model. Adv. Eng. Softw. 2018, 115, 112–125. [Google Scholar] [CrossRef]
  37. Bhat, A.U.; Merchant, S.S.; Bhagwat, S.S. Prediction of Melting Points of Organic Compounds Using Extreme Learning Machines. Ind. Eng. Chem. Res. 2008, 47, 920–925. [Google Scholar] [CrossRef]
  38. Soria-Olivas, E.; Gómez-Sanchis, J.; Martín, J.D.; Vila-Francés, J.; Martínez, M.; Magdalena, J.R.; Serrano, A.J. BELM: Bayesian extreme learning machine. IEEE Trans. Neural Netw. 2011, 22, 505–509. [Google Scholar] [CrossRef]
  39. Yaseen, Z.M.; Allawi, M.F.; Yousif, A.A.; Jaafar, O.; Hamzah, F.M.; El-Shafie, A. Non-tuned machine learning approach for hydrological time series forecasting. Neural Comput. Appl. 2016, 30, 1–13. [Google Scholar] [CrossRef]
  40. Hou, M.; Zhang, T.; Weng, F.; Ali, M.; Al-Ansari, N.; Yaseen, Z. Global solar radiation prediction using hybrid online sequential extreme learning machine model. Energies 2018, 11, 3415. [Google Scholar] [CrossRef]
  41. Friedman, J.H. Multivariate Adaptive Regression Splines. Ann. Stat. 1991, 19, 1–67. [Google Scholar] [CrossRef] [Green Version]
  42. Butte, N.F.; Wong, W.W.; Adolph, A.L.; Puyau, M.R.; Vohra, F.A.; Zakeri, I.F. Validation of Cross-Sectional Time Series and Multivariate Adaptive Regression Splines Models for the Prediction of Energy Expenditure in Children and Adolescents Using Doubly Labeled Water. J. Nutr. 2010, 140, 1516–1523. [Google Scholar] [CrossRef] [Green Version]
  43. Sephton, P. Forecasting recessions: Can we do better on MARS? Review 2001, 83, 39–49. [Google Scholar] [CrossRef]
  44. Yaseen, Z.; Kisi, O.; Demir, V. Enhancing Long-Term Streamflow Forecasting and Predicting using Periodicity Data Component: Application of Artificial Intelligence. Water Resour. Manag. 2016, 30, 4125–4151. [Google Scholar] [CrossRef]
  45. Sharda, V.N.; Prasher, S.O.; Patel, R.M.; Ojasvi, P.R.; Prakash, C. Performance of Multivariate Adaptive Regression Splines (MARS) in predicting runoff in mid-Himalayan micro-watersheds with limited data. Hydrol. Sci. J. 2008, 53, 1165–1175. [Google Scholar] [CrossRef]
  46. Zhang, W.; Goh, A.T.C. Multivariate adaptive regression splines and neural network models for prediction of pile drivability. Geosci. Front. 2014, 7, 45–52. [Google Scholar] [CrossRef]
  47. Craven, P.; Wahba, G. Smoothing noisy data with spline functions—Estimating the correct degree of smoothing by the method of generalized cross-validation. Numer. Math. 1978, 31, 377–403. [Google Scholar] [CrossRef]
  48. Deo, R.C.; Şahin, M. Application of the Artificial Neural Network model for prediction of monthly Standardized Precipitation and Evapotranspiration Index using hydrometeorological parameters and climate indices in eastern Australia. Atmos. Res. 2015, 161–162, 65–81. [Google Scholar] [CrossRef]
  49. Tao, H.; Diop, L.; Bodian, A.; Djaman, K.; Ndiaye, P.M.; Yaseen, Z.M. Reference evapotranspiration prediction using hybridized fuzzy model with firefly algorithm: Regional case study in Burkina Faso. Agric. Water Manag. 2018, 208, 140–151. [Google Scholar] [CrossRef]
  50. Choi, S.U.; Choi, B.; Lee, S. Prediction of local scour around bridge piers using the ANFIS method. Neural Comput. Appl. 2017, 28, 335–344. [Google Scholar] [CrossRef]
  51. Ayoubloo, M.K.; Etemad-Shahidi, A.; Mahjoobi, J. Evaluation of regular wave scour around a circular pile using data mining approaches. Appl. Ocean Res. 2010, 32, 34–39. [Google Scholar] [CrossRef] [Green Version]
  52. Yaseen, Z.M.; Sulaiman, S.O.; Deo, R.C.; Chau, K.-W. An enhanced extreme learning machine model for river flow forecasting: State-of-the-art, practical applications in water resource engineering area and future research direction. J. Hydrol. 2018, 569, 387–408. [Google Scholar] [CrossRef]
Figure 1. Flow patterns in the downstream of a sluice gate, (a) water jets along the bed surface, (b) jet rising to the water surface, (c) surface jet [5].
Water 11 00353 g001
Figure 2. (a) Schematic diagram of the experimental setup, (b) Sieve analysis graphs of bed materials.
Water 11 00353 g002
Figure 3. The structure of the extreme learning machine model used in the present study.
Water 11 00353 g003
Figure 4. Scatter plots including the least square regression line and the coefficient of determination for the predicted scour-hole characteristics (Ls, Ds, Lsm) obtained using dimensional variables in (a) ELM and (b) MARS models.
Water 11 00353 g004
Figure 5. Scatter plots including the least square regression line and the coefficient of determination for the predicted scour-hole characteristics (Ls, Ds, Lsm) obtained using non-dimensional variables in (a) ELM and (b) MARS models.
Water 11 00353 g005
Figure 6. The relative error distribution percentages during validation of ELM and MARS models using dimensional variables.
Water 11 00353 g006
Figure 7. The relative error distribution percentages during validation of ELM and MARS models using dimensional variables.
Water 11 00353 g007
Table 1. The properties of the bed materials used in the experiment.
Bed Material SamplesGeometric Standard Deviation σ g Mean Diameter (mm) D 50
A20.345
B3.510.6309
C3.791.31
Table 2. The statistical performance of ELM models during validation period in prediction of Ls , Ds and Lsm using dimensional data.
Predicted ValueSIMAPERMSEMAERMSRER
Ls 0.04820.02190.66110.23660.06910.98
Ds 0.09610.03930.36340.14300.09950.97
Lsm 0.03490.01280.25630.08710.03910.97
Table 3. The statistical performance of MARS models during validation period in prediction of Ls , Ds and Lsm using dimensional data.
Predicted ValueSIMAPERMSEMAERMSRER
Ls 0.27600.05803.78760.97210.21710.86
Ds 0.13750.04540.52010.16540.14200.77
Lsm 0.06310.02230.46370.16730.05890.90
Table 4. The statistical performance of ELM models during validation period in prediction of Ls , Ds and Lsm using non-dimensional data.
Predicted ValueSIMAPERMSEMAERMSRER
Ls 0.02320.00900.67240.26370.02250.90
Ds 0.02490.00930.20080.07420.02530.89
Lsm 0.02300.00800.35900.12570.02270.92
Table 5. The statistical performance of MARS models during validation period in prediction of Ls , Ds and Lsm using non-dimensional data.
Predicted ValueSIMAPERMSEMAERMSRER
Ls 0.09020.03122.61070.92130.08670.71
Ds 0.12320.04560.99250.37170.12070.72
Lsm 0.08040.02661.25250.42360.07720.64

