Land Use and Climate Change Effects on Surface Runoff Variations in the Upper Heihe River Basin


1
Shaanxi Key Laboratory of Earth Surface System and Environmental Carrying Capacity, College of Urban and Environmental Sciences, Northwest University, Xi’an 710127, China
2
Department of Environmental Engineering, College of Urban and Environmental Science, Northwest University, Xi’an 710127, China
*
Author to whom correspondence should be addressed.
Water 2019, 11(2), 344; https://doi.org/10.3390/w11020344
Submission received: 8 January 2019
/
Revised: 2 February 2019
/
Accepted: 13 February 2019
/
Published: 18 February 2019
(This article belongs to the Special Issue Climate Variability and Climate Change Impacts on Land Surface, Hydrological Processes and Water Management)
Abstract
:The runoff in the upper reaches of the Heihe River has been continuously abundant for more than a decade, and this has not happened previously in history. Quantitative analysis of runoff variation and its influencing factors are of great significance for the ecological protection of the basin. In this paper, the soil and water assessment tool model was used to simulate runoff in the study area, and the method of scenario simulation was used to quantitatively analyze the runoff response with respect to land use and climate change. According to the abruptness of the runoff sequence, the years before 2004 are categorized as belonging to the reference period, and after 2004 is categorized as the interference period. According to the analysis, compared with the reference period, the contribution rate of climate change is 87.15%, while the contribution rate of land use change is only 12.85%. The climate change scenario simulation analysis shows that the change in runoff is positively correlated with the change in precipitation. The relationship with the change in temperature is more complicated, but the influence of precipitation change is stronger than the change in temperature. According to the land use scenario simulation analysis, under the economic development scenario, the runoff decreased, whereas under the historical trend and ecological protection scenario, the runoff increased. Additionally, the runoff increased more under the ecological protection scenario.
1. Introduction
Runoff is the product of the interaction between climate and land use change in a basin [1,2,3]. Climate change will directly change the spatial distribution and temporal variability of atmospheric precipitation and change the spatial configuration of runoff [4,5]. Changes in land use can directly lead to changes in the production and flow processes, which lead to changes in runoff [6,7]. To some extent, changes in land use also represent the impact of human activities on water resources [8]. Changes in runoff in a source area will directly affect life production in the middle and lower reaches [9]. This is crucial to revealing the characteristics of river basin runoff and its evolution against a background of land use change and climate change [10,11,12].
For arid and semiarid areas, where meteorological and hydrological monitoring data are scarce, it is particularly important to select appropriate methods to quantify the contribution rates of land use and climate change [13]. Many studies have been carried out on the impact of climate and land use change on the water resources of a basin [14,15,16]. The main methods used are long-term data comparative analysis, experimental comparative analysis and watershed hydrological simulation. The basin test method requires a long period of time and is difficult to implement, and this method is not suitable for large-scale watershed research [17]. The long-sequence data statistical method can be used to analyze hydro-meteorological data trends, but the spatial heterogeneity of the basin and the mechanism of land use and climate change on the hydrology of the basin cannot be considered. Large-scale watershed attribution analysis is also difficult [18]. Therefore, a semi-distributed hydrological model based on physical processes is selected in this paper to evaluate the hydrological response of climate variability and land use change and to further quantify the degree of impact. In the model setting, climate change and human activities are assumed to be independent factors that lead to changes in runoff [19]. The hydro-meteorological sequence is divided into reference stages and stages affected by land use change. Finally, the natural runoff during the impact of land use change is simulated, and the contribution of the two factors to runoff is calculated based on the water balance [20,21,22].
The main difficulties in this study are the determination of the mutation point and the contribution rate calculation. The determination of the mutation point uses statistical analysis methods, including the Mann-Kendall test method, wavelet analysis method, Pettitt test method, cumulative anomaly analysis method and so on [23,24,25,26]. The runoff in the reference period generally takes the measured runoff in the reference period of the basin as the reference value, and considers that the difference between the measured runoff and the reference value in the period of impact of land use change is caused by environmental changes. This difference consists of two parts: one is the climate change impact contribution, and the other is the contribution of land use change [27]. Using a hydrological model, according to the different periods of runoff mutation location, the meteorological data and land use data for different periods are combined to establish a real situation based on the combination of meteorological data and land use data before the mutation. In addition, the natural runoff is simulated under the influence of both climate and land use change using the meteorological data of the time period after mutation. The land use data are used for the pre-mutation time period to simulate the runoff under the influence of climate change alone using the time before the mutation. The meteorological data within the segment and the land use data during the post-mutation period simulate runoff under land use change alone [28,29,30].
Many researchers have conducted simulations of the upstream runoff for the Heihe River, but the quantitative analysis is relatively simple and uses the traditional mathematical statistics method [31]. Wang et al. used a wavelet analysis, wavelet neural network model and GIS spatial analysis for the Heihe River [32]. The analysis and prediction of watershed runoff showed that the increase in annual runoff has a causal relationship with the increase in upstream air temperature and precipitation. He et al. used the M-K test and cumulant slope change rate comparison method to calculate the contribution of climate change and human activities to runoff rate, and the researchers found that the upper reaches of the Heihe River are dominated by climate change, and the impact of human activities is small [33]. Other studies have been conducted in the Heihe River Basin. Wang et al. studied the impact of land use change on hydrological processes in the middle reaches of the Heihe River and found that human activities dominated the changes in runoff in the middle reaches of the Heihe River [34]. Zhang et al. studied the effects of irrigation on surface climate in the Heihe River Basin [35]. Although some scholars have conducted preliminary research on the runoff simulation of the SWAT model in the upper reaches of the Heihe River, it is necessary to conduct systematic research on the hydrological effects in the changing environment. Zhao et al. used the Hydrologiska Fyrans Vattenbalans model to study the corresponding effects of runoff on climate change in the Heihe River Basin [36]. He et al. used the Variable Infiltration Capacity model to analyze the uncertainty of runoff simulation in the upper reaches of the Heihe River [37].
In the study of the upper reaches of the Heihe River, the SWAT model is a relatively more used model, and it is more suitable for simulations with long time periods and continuous spatiotemporal runoff changes. It is convenient to use the spatial information provided by remote sensing and GIS to simulate the hydrological effects in many different scenarios. The application of the SWAT model in the upper reaches of the Heihe River began in the early 21st century. Liu et al. first applied the SWAT model to the Heihe River Basin [38]. In later studies, they carried out improvements in the SWAT model, including the study of the snowmelt module [39]. Due to the small number of meteorological stations in the Heihe River Basin, Zou, Meng et al conducted a coupling study of SWAT with other models to obtain a more accurate simulation [40,41]. Zhang, Luo and others used the SWAT model to simulate the runoff and evaporation of the Heihe River Basin [42,43]. They are analytical studies based on historical data. In this paper, the contribution rate of climate and land use change to surface runoff is separated based on hydrological model. And combined with the analysis of different climate and land use scenarios, on the one hand, it repeals the response of runoff to climate and land use change, on the other hand, it can make some predictions on the future changes in runoff under climate and land use scenarios.
In this paper, based on the hydrological model, we calculate the contribution rate of climate and land use change to surface runoff. Based on the scenario setting method of the model, the response of surface runoff to climate and land use change is studied. The possible scenarios are used to predict the runoff under future climate and land use conditions; it also provides a reference for the rational allocation of water resources in the basin. The main objectives of this paper are threefold: (1) determining the point of change of runoff based on long-term hydrological sequence; (2) quantitatively analyzing the contribution rate of climate and land use change to runoff impact; (3) through the scenario setting simulation method, studying the response of runoff to climate and land use change. The aim is to provide a reference for the rational allocation of living, production and ecological water in the basin.
2. Materials and Methods
2.1. Study Area and Data Sources
2.1.1. Study Area
The Heihe River Basin is the second largest inland river basin in China. Due to the arid and semiarid climate, water shortages are a major factor limiting the sustainable development of the socioeconomic and ecological environment in the region [44,45]. Recently, the grassland degradation trend in the Heihe River Basin has been obvious, and the ecological damage is serious [46]. To alleviate this series of problems, in August 2001, the State Council began to carry out comprehensive management of the Heihe River Basin and implement Heihe River water dispatching and integrated river basin management [47]. According to the upstream water supply situation, the difference in different annual water levels has led to an increased contradiction between water and water demand in the middle and lower reaches [48]. To achieve rational allocation of water resources, the upstream water supply trend must be understood. The upstream runoff of the Heihe River has been abundant for more than a decade, and such a history of runoff has never before been seen [49]. Therefore, it is necessary to analyze the causes of water abundance and combine these data into a model to study the contribution of climate change and land use factors and to develop and utilize water resources for the basin, which will provide a reference for rational planning.
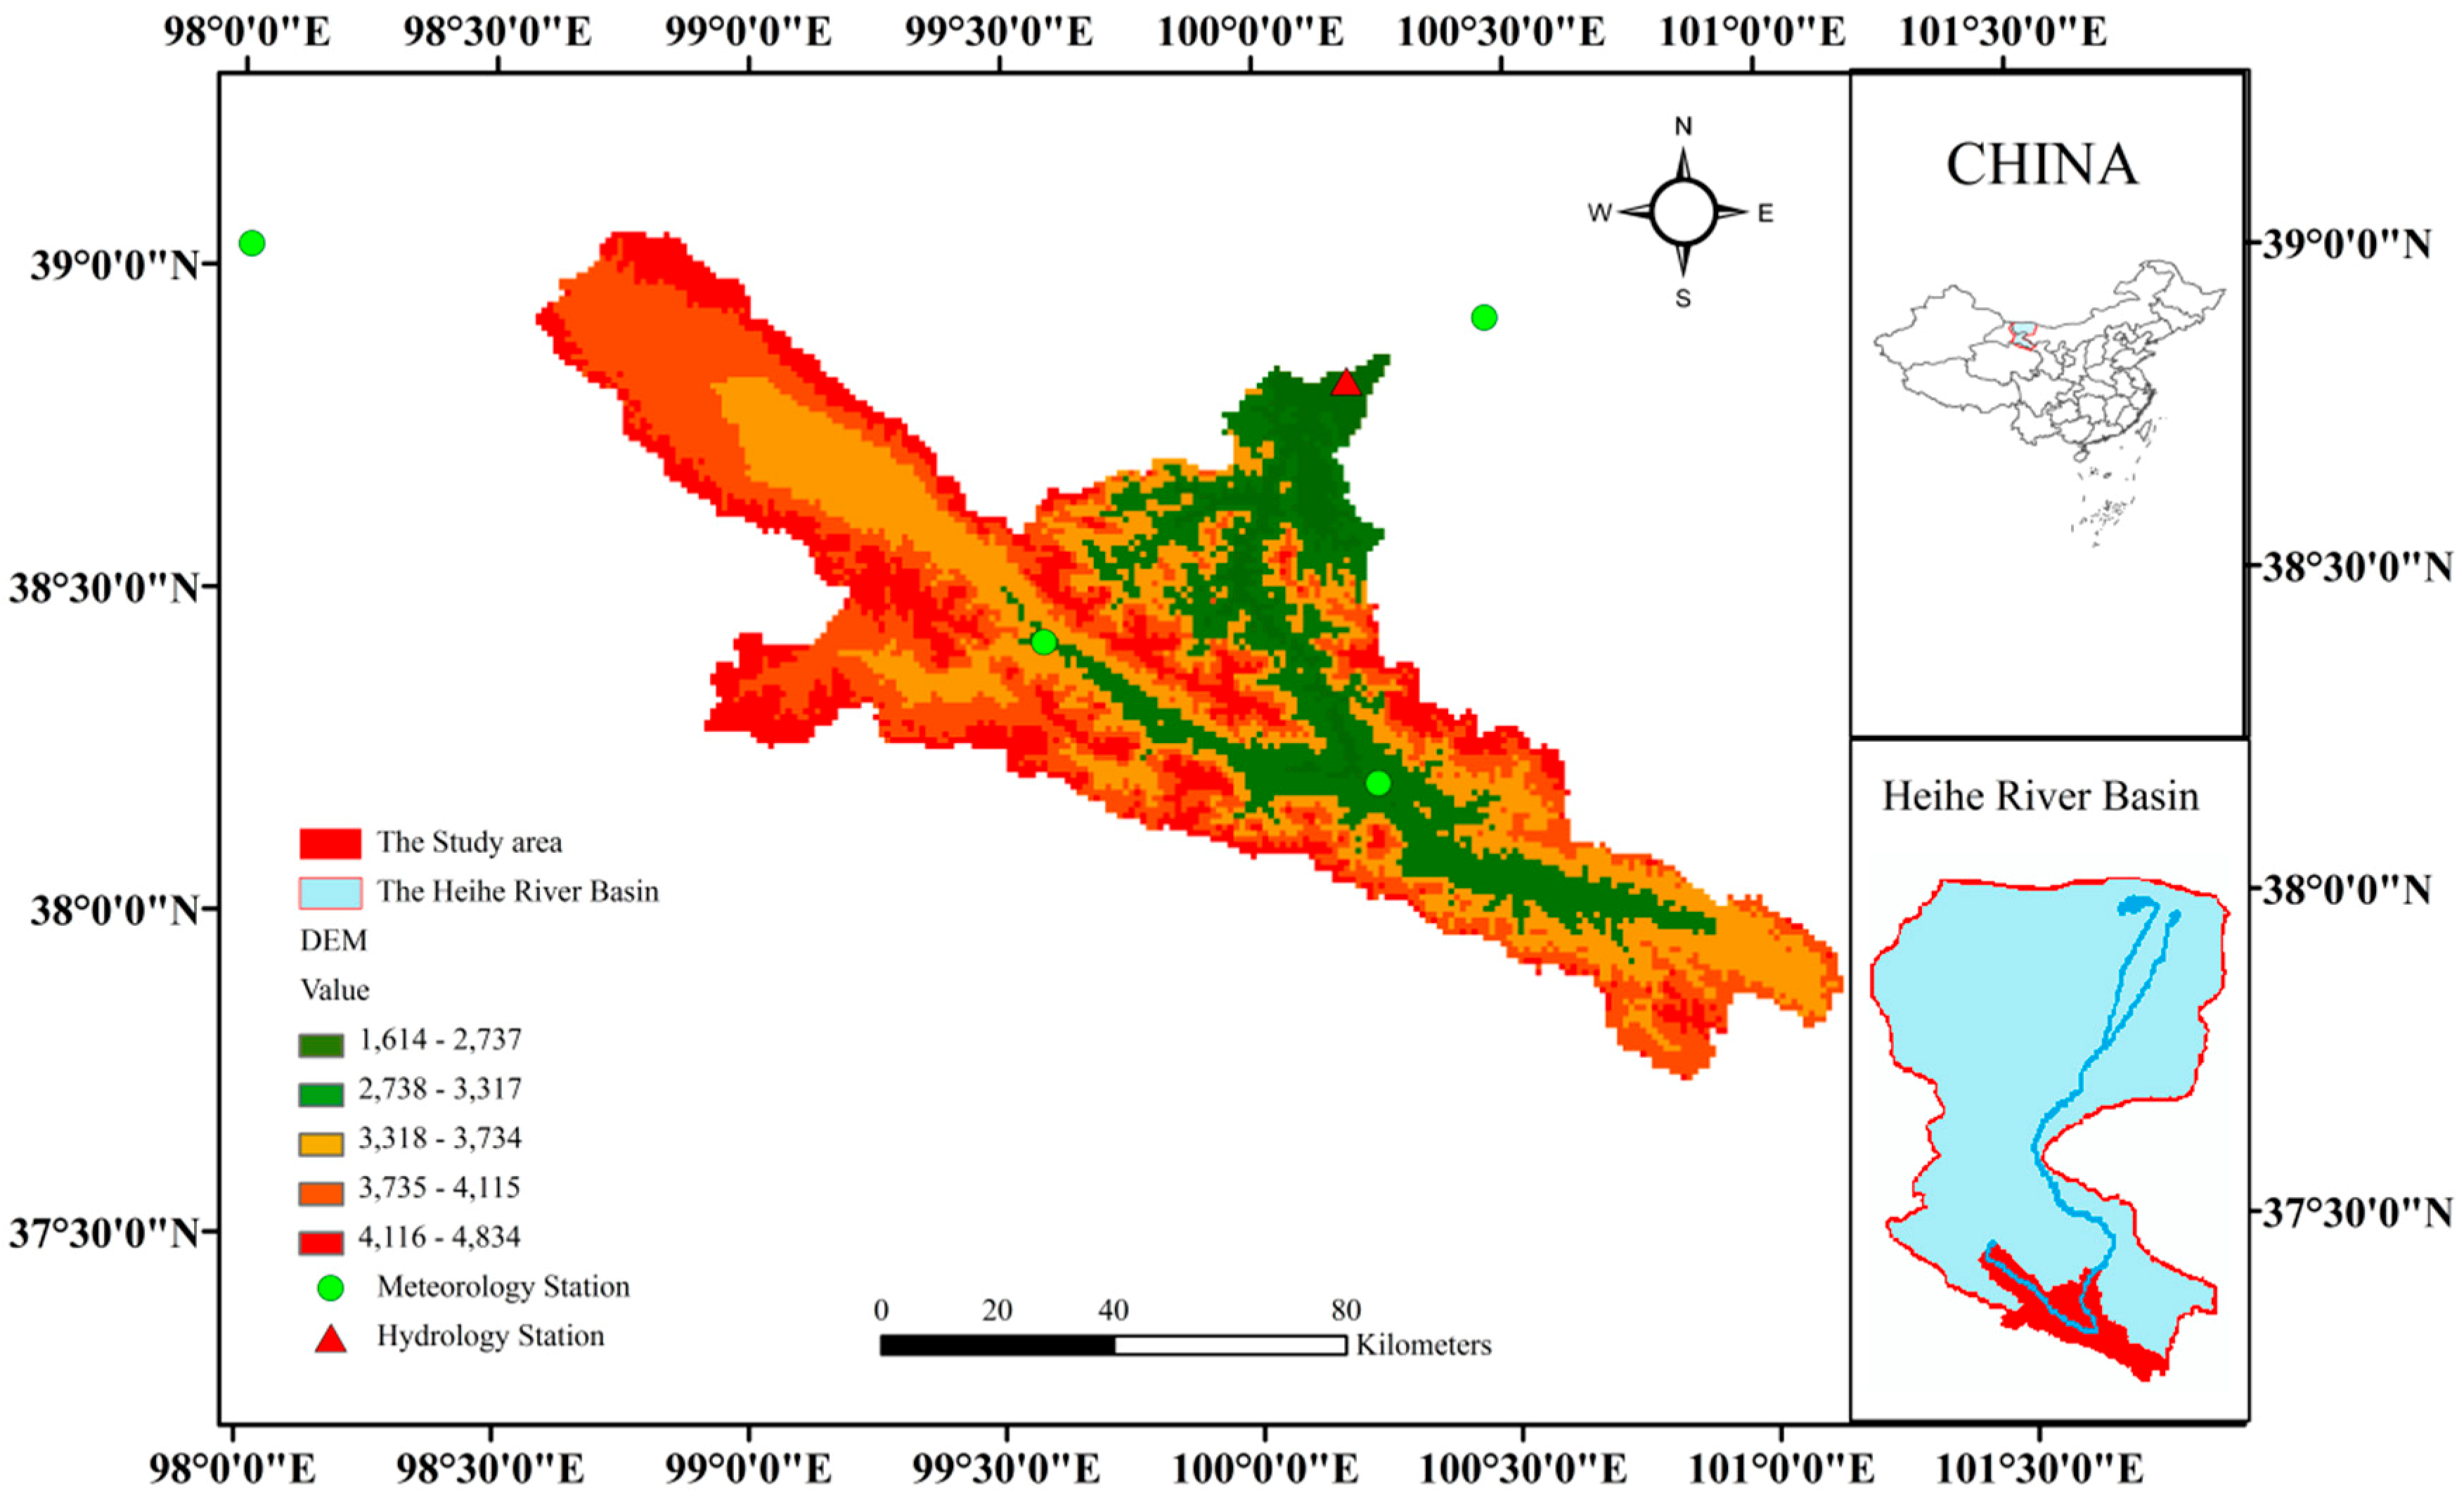
The Heihe River originates in the Qilian Mountain region on the northern edge of the Tibetan Plateau. This area is a typical inland river basin in the arid region of northwest China, located in the middle of the Hexi Corridor [50]. The upstream area is attached to Qilian County in the Qinghai Province, and the basin area is approximately 10,000 km2. This area is located in the central part of the Eurasian continent and is the site of the ancient Silk Road. The study area is far from the sea and the elevation ranges between 1600 m and 4800 m. Affected by the circulation of the westerly winds in the middle–high latitudes and the influence of polar cold air masses, the climate in the upper reaches is dry, and precipitation is scarce and concentrated [51]. The upper Heihe River is the main area of the Heihe River Basin. Surface runoff mainly comes from atmospheric precipitation and melting snow and ice. The runoff distribution throughout the year is basically the same as the precipitation process and during the high temperature season [52]. The runoff and precipitation are concentrated in summer and autumn, and the annual average precipitation exceeds 400 mm. This area is sparsely populated, and the main economic activities are forestry and animal husbandry. The low level of economic development has led to a limited level of water resource development and utilization [53]. The location of the study area is shown in Figure 1, as well as the distribution of the hydrology and meteorology stations.
2.1.2. Data Sources
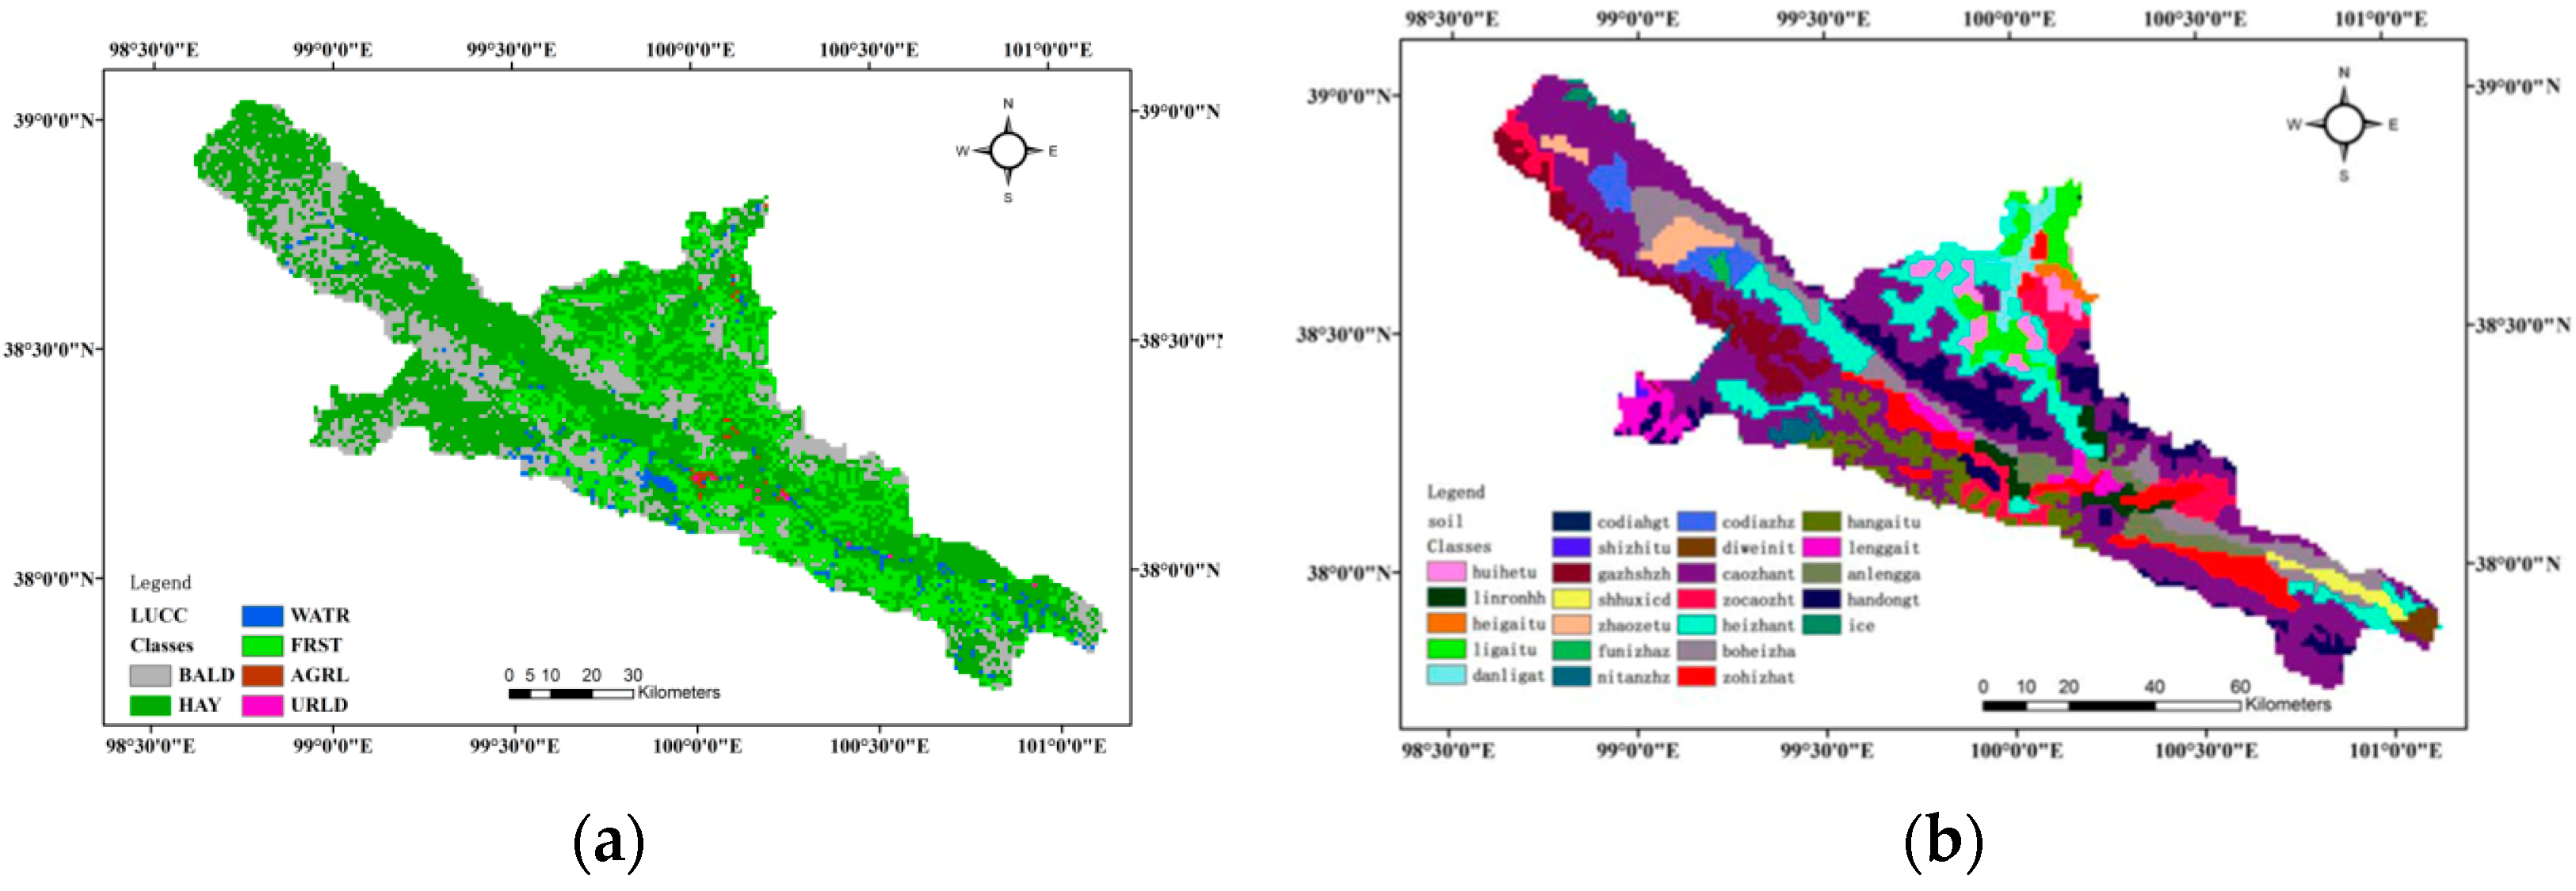
The data used in this paper are divided into two parts. The first part is used to analyze the water resource situation in the upper reaches of the Heihe River and the relationship between runoff and climate elements. The second part is the data needed for the soil and water assessment tool model (SWAT). The model data mainly include two parts: model input data and model calibration verification data. Model input data includes DEM data (1000 m × 1000 m), soil data (1:1,000,000), land use/cover data (1:100,000), and meteorological data. The model’s calibration verification data is primarily the runoff and flow of the hydrological station. The data are based on ARCGIS 9.3 unified projection processing, in which all spatial data are converted into a unified projection with a spatial reference of Beijing_1954_GK_Zone_17N. DEM data and land use/cover data are from the Cold and Arid Regions Science Data Center. According to the standard, land use data are divided into six categories: forestland, grassland, water area, cultivated land, unused land, and urban construction land, as shown in detail in Table 1 and Figure 2. Soil data are from the HWSD-World Harmony Soil Database and include 8 soil classes, 14 soil classes, and 24 subcategories. See Figure 3 for details. The time series of climate data were selected from January 1980 to December 2008 and include daily precipitation, maximum and minimum temperature, humidity and wind speed. Meteorological data and hydrological data were downloaded from the Heihe River Bureau for model calibration and evaluation and include the Qilian station, Zhangye station, Yeniugou station, Tuole station, and Yingluoxia station, seeing Table 2 and Table 3 for details.
2.2. Methodology
2.2.1. Mann-Kendall Trend Test
The Mann-Kendall test was performed on the mutation point. The Mann-Kendall test method is a nonparametric method. The M-K test is simple to calculate, and the results are not disturbed by a few outliers in the time series such as temperature, rainfall, and runoff. At the same time, it is not necessary for the sample to follow a certain distribution, and it can clearly indicate the start time of the sudden change of the time series of temperature, rainfall, runoff, and the like [54].
It is assumed that time series , such as temperature, rainfall, runoff, etc., are composed of n randomly independent and identically distributed samples, such as X = x1, x2, …, xn.
First, construct an order column:
when , has a value of 1, otherwise it has a value of 0.
The order column is the cumulative number of times the value of the stat at time i is greater than the value at time j.
Based on the assumption that the sample is a random independent and identical distribution, the normalized order column is defined as the statistic .
The above process is repeated in time series x in reverse order …, making , .
Given the significance level , the critical value , the two statistical sequence curves of and , and the two critical values are plotted on the same graph for analysis.
If one of the statistics or is positive, it can be judged that time series such as temperature, rainfall, and runoff have an upward trend. In addition, when the absolute values of the statistics or exceed the threshold of the significance level, it can be further judged that the rising or falling trend of the time series such as temperature, rainfall, runoff, etc. is significant; in particular, the statistics or are at the level of significance. When the critical values intersect, the intersection point is the sudden change point, and the corresponding time is the sudden change time of temperature, rainfall and runoff [55].
2.2.2. Cumulative Anomaly Method
The anomaly is a commonly used statistic that indicates that the runoff deviates from the normal situation [56]. The difference between a certain value and the average value of a series of values is the anomaly; that is, xi − . Any runoff series can be transformed into a sequence with an average value of 0 after anomaly processing. The cumulative anomaly is a statistical method for judging the trend of discrete data points by curve. The calculation process involves first calculating the anomaly value of annual runoff and then accumulating values year-by-year according to the time series to obtain the variation process of the cumulative anomaly value with time. The trend of discrete data points can be visually judged by the curve. The cumulative anomaly for a sequence X at a certain time t is expressed as follows:
The runoff cumulative anomaly curve can be used to characterize the abundance of runoff change. When the curve changes downward, this indicates that the runoff enters the dry season. An upward change indicates that the runoff enters the wet season, and a horizontal change indicates that the runoff enters the flat period.
2.2.3. Soil and Water Assessment Tool (SWAT Model)
The SWAT model is a typical distributed hydrological model based on the GIS platform, which was developed by the United States Department of Agriculture [57]. The model can predict the trend and impact of runoff changes under different land use patterns, soil conditions, and river basin management conditions in large watersheds [58]. The data required for the SWAT model include topography, soil, land use/cover, weather, hydrology, etc., and different databases can be selected depending on the purpose of the study [59]. The SWAT-simulated watershed hydrological process is divided into the land phase of the hydrological cycle and the convergence phase of the hydrological cycle. The entire water circulation system follows the law of water balance, and the formula is as follows:
where is the final soil moisture content, mm; is the initial soil moisture content of the i-th day, mm; t is the time, d; is the precipitation of the i-th day, mm; is the surface runoff of day i, mm; indicates the amount of evapotranspiration on day i, mm; indicates the amount of water entering the vale zone from the soil profile on day i, mm; and indicates the return flow amount on day i, mm.
The runoff simulation in the SWAT model is the SCS runoff curve method based on daily precipitation data and the Green&Ampt infiltration method based on time precipitation data. The SCS runoff curve number model links soil type, runoff, land use and management measures to provide a basis for estimating runoff under various land uses and soil types. According to the collected precipitation data, this paper selects the SCS runoff curve method to simulate the runoff.
The SWAT model has the following basic assumptions: The ratio between the actual water storage amount F and the maximum water storage capacity S is equal to the ratio of the runoff Q to the difference between the rainfall P and the initial loss ; a linear relationship between and S. Its rainfall-runoff relationship expression is as follows:
According to the water balance, it can be obtained that:
Therefore, Equation (6) can be derived as follows:
is affected by factors such as land use, farming methods, irrigation conditions, canopy interception, etc. It has a certain proportional relationship with the maximum possible permeability S. Based on the analysis of a large number of long-term experimental results, the SWAT model provides that the most suitable scale factor for and S is 0.2:
S is closely related to the underlying surface factors such as land use type, soil type and slope. The model can introduce CN to better determine S. The formula is as follows:
CN is a dimensionless parameter. The CN value reflects a comprehensive parameter of the characteristics of the pre-rainfall watershed. It is a combination of factors such as soil moisture, slope, land use type and soil type.
The principle of runoff simulation of the SWAT model is as follows: when the rainfall reaches the ground, the water infiltration rate is larger due to the dryness of the surface soil. The continuous rainfall process causes the soil moisture to increase, which leads to the decrease of water infiltration rate. When the rainfall intensity is greater than the infiltration rate, the filling begins. Once the surface is filled, the surface runoff will be generated. The hydrological simulation of the SWAT model is based on the water balance equation [38].
2.2.4. Parameter Sensitivity Analysis and Model Calibration and Validation
For the calibration of the model, the Yingluoxia hydrological station is selected, which controls the upstream outlets and has a strong representativeness, which helps to improve the accuracy of the model. First, the annual scale simulation is performed, and then the monthly scale simulation is performed. SWAT-CUP software was used for the calibration of the model. The SUFI-2 algorithm was used for iterative calculation. According to previous research experience, the parameters were selected for the LH-OAT sensitivity analysis. First, the initial range of the model is determined, and then multiple operations are performed until the optimal value of the parameter is determined. The model was evaluated using the decision coefficient and the model efficiency coefficient NSE to achieve good results:
where is the observed streamflow, is the simulated streamflow, and are the average simulated and observed streamflow values, respectively, and n is the simulation number. The range of is 0~1, and the closer this value to 1, the better the simulation effect. For NSE, greater than 0.5 indicates that the simulation result is acceptable, and the NSE is between 0.5–0.65, indicating suitable simulation results [60].
2.2.5. Contribution Rate Calculation
The semi-distributed hydrological model, the SWAT model, is used to calculate the contribution rate of climate change and human activities to runoff effects. The reference period and the interference period are accurately divided according to the abrupt position of the runoff, and then the meteorological, hydrological and land use data rates of the reference period are used to determine the hydrological model parameters. The period before the runoff mutation point is the reference period, and the period after the runoff mutation point is the interference period. To analyze the contribution of the calculation of land use and climate change, the following scenarios are used for analysis; see Table 4. Based on scenario 1, scenario 3 is compared with the common impacts of land use change on runoff, scenario 2 is compared with the impact of climate change on runoff, and finally, the impacts of land use and climate change on runoff during different periods are quantitatively analyzed in the upper reaches of the Heihe River.
Q1, Q2, Q3, and Q4 are the average annual runoffs simulated under scenarios 1, 2, 3, and 4, respectively. In addition, the following formula is used to complete the calculation of the contribution rate of climate change and land use change.
2.2.6. Scenario Setting and Model Analysis
To further explore the impact of climate change on runoff in the upper reaches of the Heihe River, the range of possible future variabilities in climate change, precipitation and temperature changes were given. The following scenarios are determined: The existing precipitation conditions remain unchanged, precipitation is increased by 10% and 20%, and the precipitation is reduced by 10% and 20%, which gives a total of 5 scenario options. Additionally, the existing temperature is maintained, reduced by 0.5 °C, 1 °C, 1.5 °C and 2 °C, and increased by 0.5 °C, 1 °C, 1.5 °C, and 2 °C, for a total of 9 options.
To further explore the impact of land use on the runoff in the upper reaches of the Heihe River, according to the scenario analysis of the Western Data Center future trend of land use in the Heihe River, the ecological protection trend, the economic development trend and historical trend are adopted. (http://westdc.westgis.ac.cn/) Based on the historical development trend and existing problems of the Heihe River Basin, this dataset uses the Dyna-CLUE model to simulate land use development scenarios in the Heihe River Basin in 2020 and 2030.
3. Results and Discussion
3.1. Parameter Sensitivity Analysis and Model Calibration and Validation
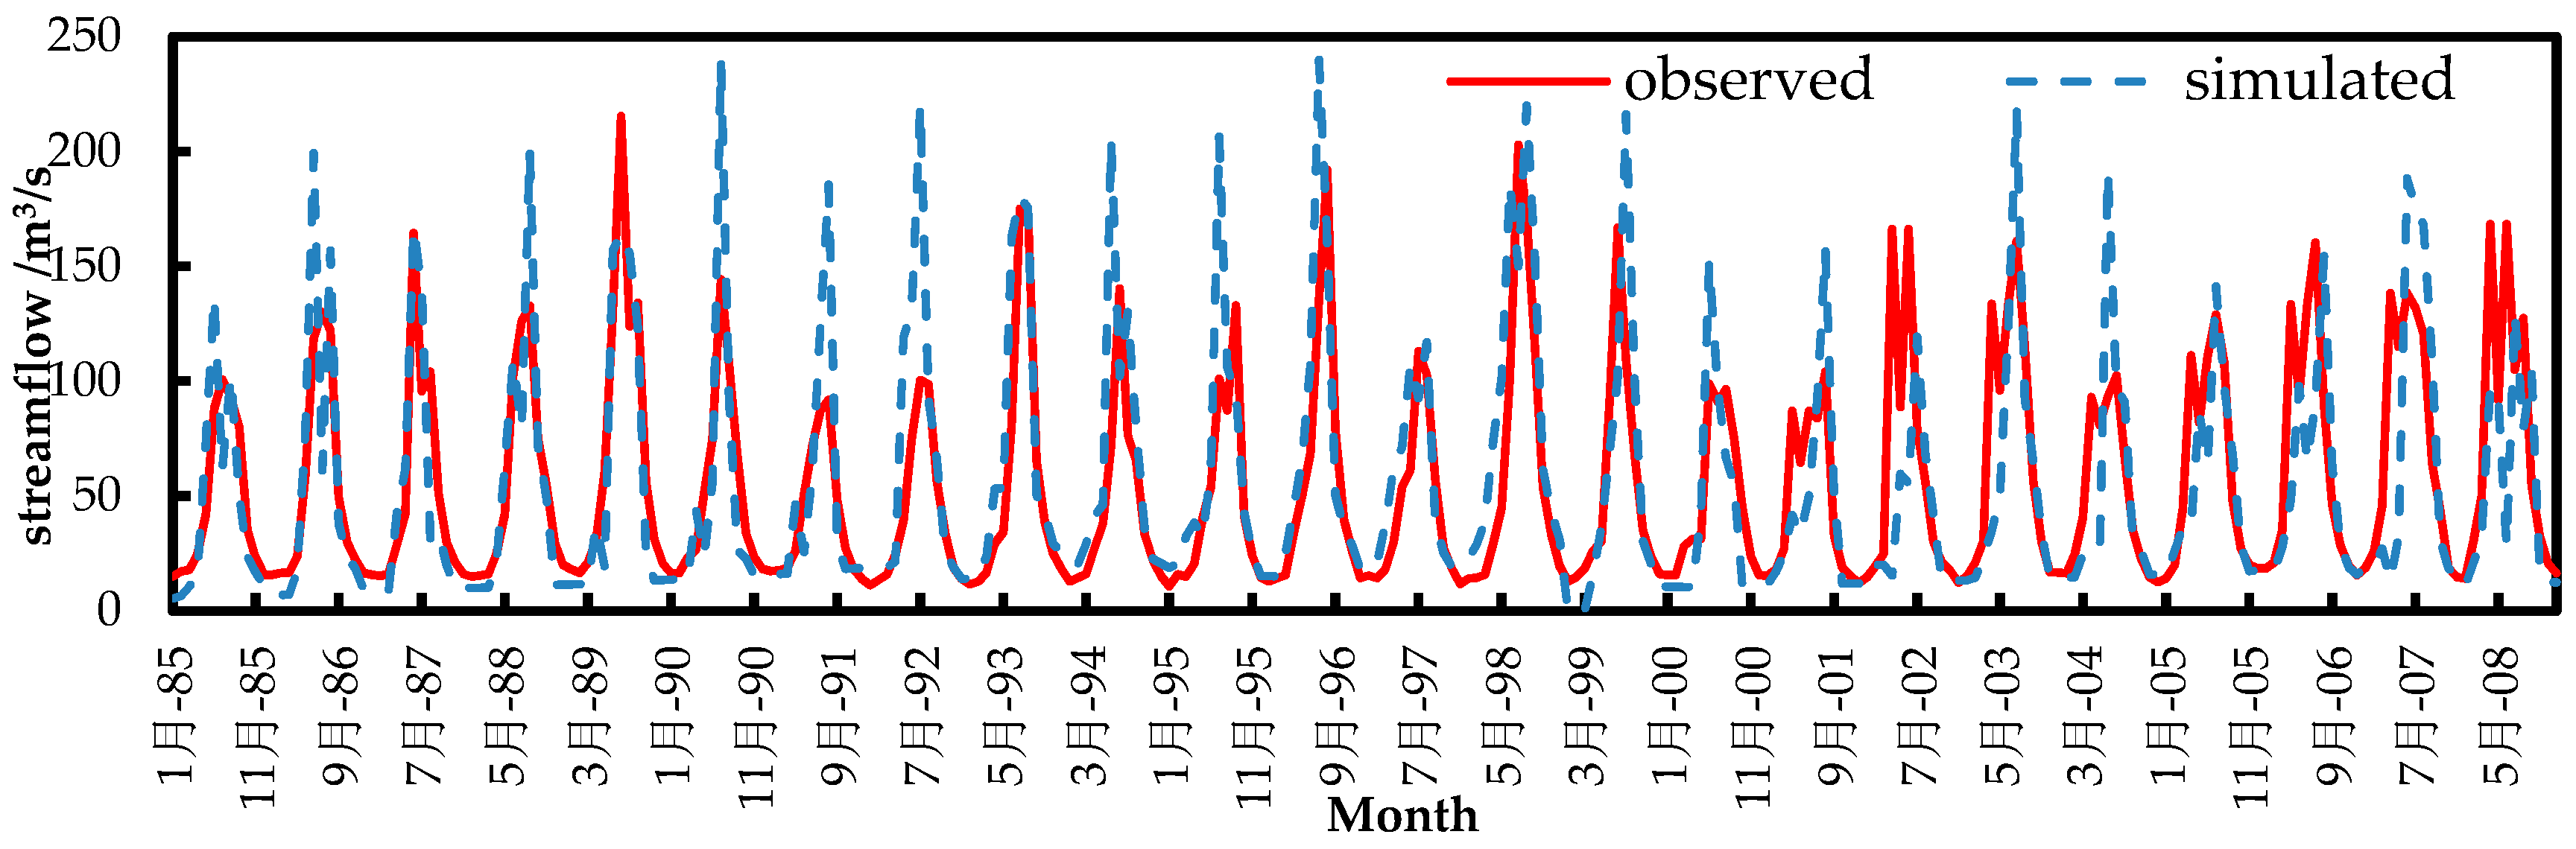
Through the sensitivity analysis of the SWAT model, 14 parameters with higher sensitivity were selected to calibrate and verify the model (Table 5). The initial values and the range of the parameters can refer to the existing research, which can save time for parameter adjustment and improve efficiency. The period of 1980–1984 was used as the model’s warm-up period, 1985–1998 was used as the model’s calibration period, and 1999–2008 was used as the validation period of the model. SWAT-CUP was used to calibrate the model parameters, and the monthly streamflow at the upstream outlet at the Yingluoxia station was calibrated and adjusted. The monthly streamflow R2 and ENS at the Yingluoxia station during the calibration period were 0.75 and 0.65, respectively, and the verification periods were 0.71 and 0.63. The SWAT model is suitable for the upper reaches of the Heihe River. The simulation results are shown in Figure 3 and Table 6.
3.2. Trends in Annual Runoff
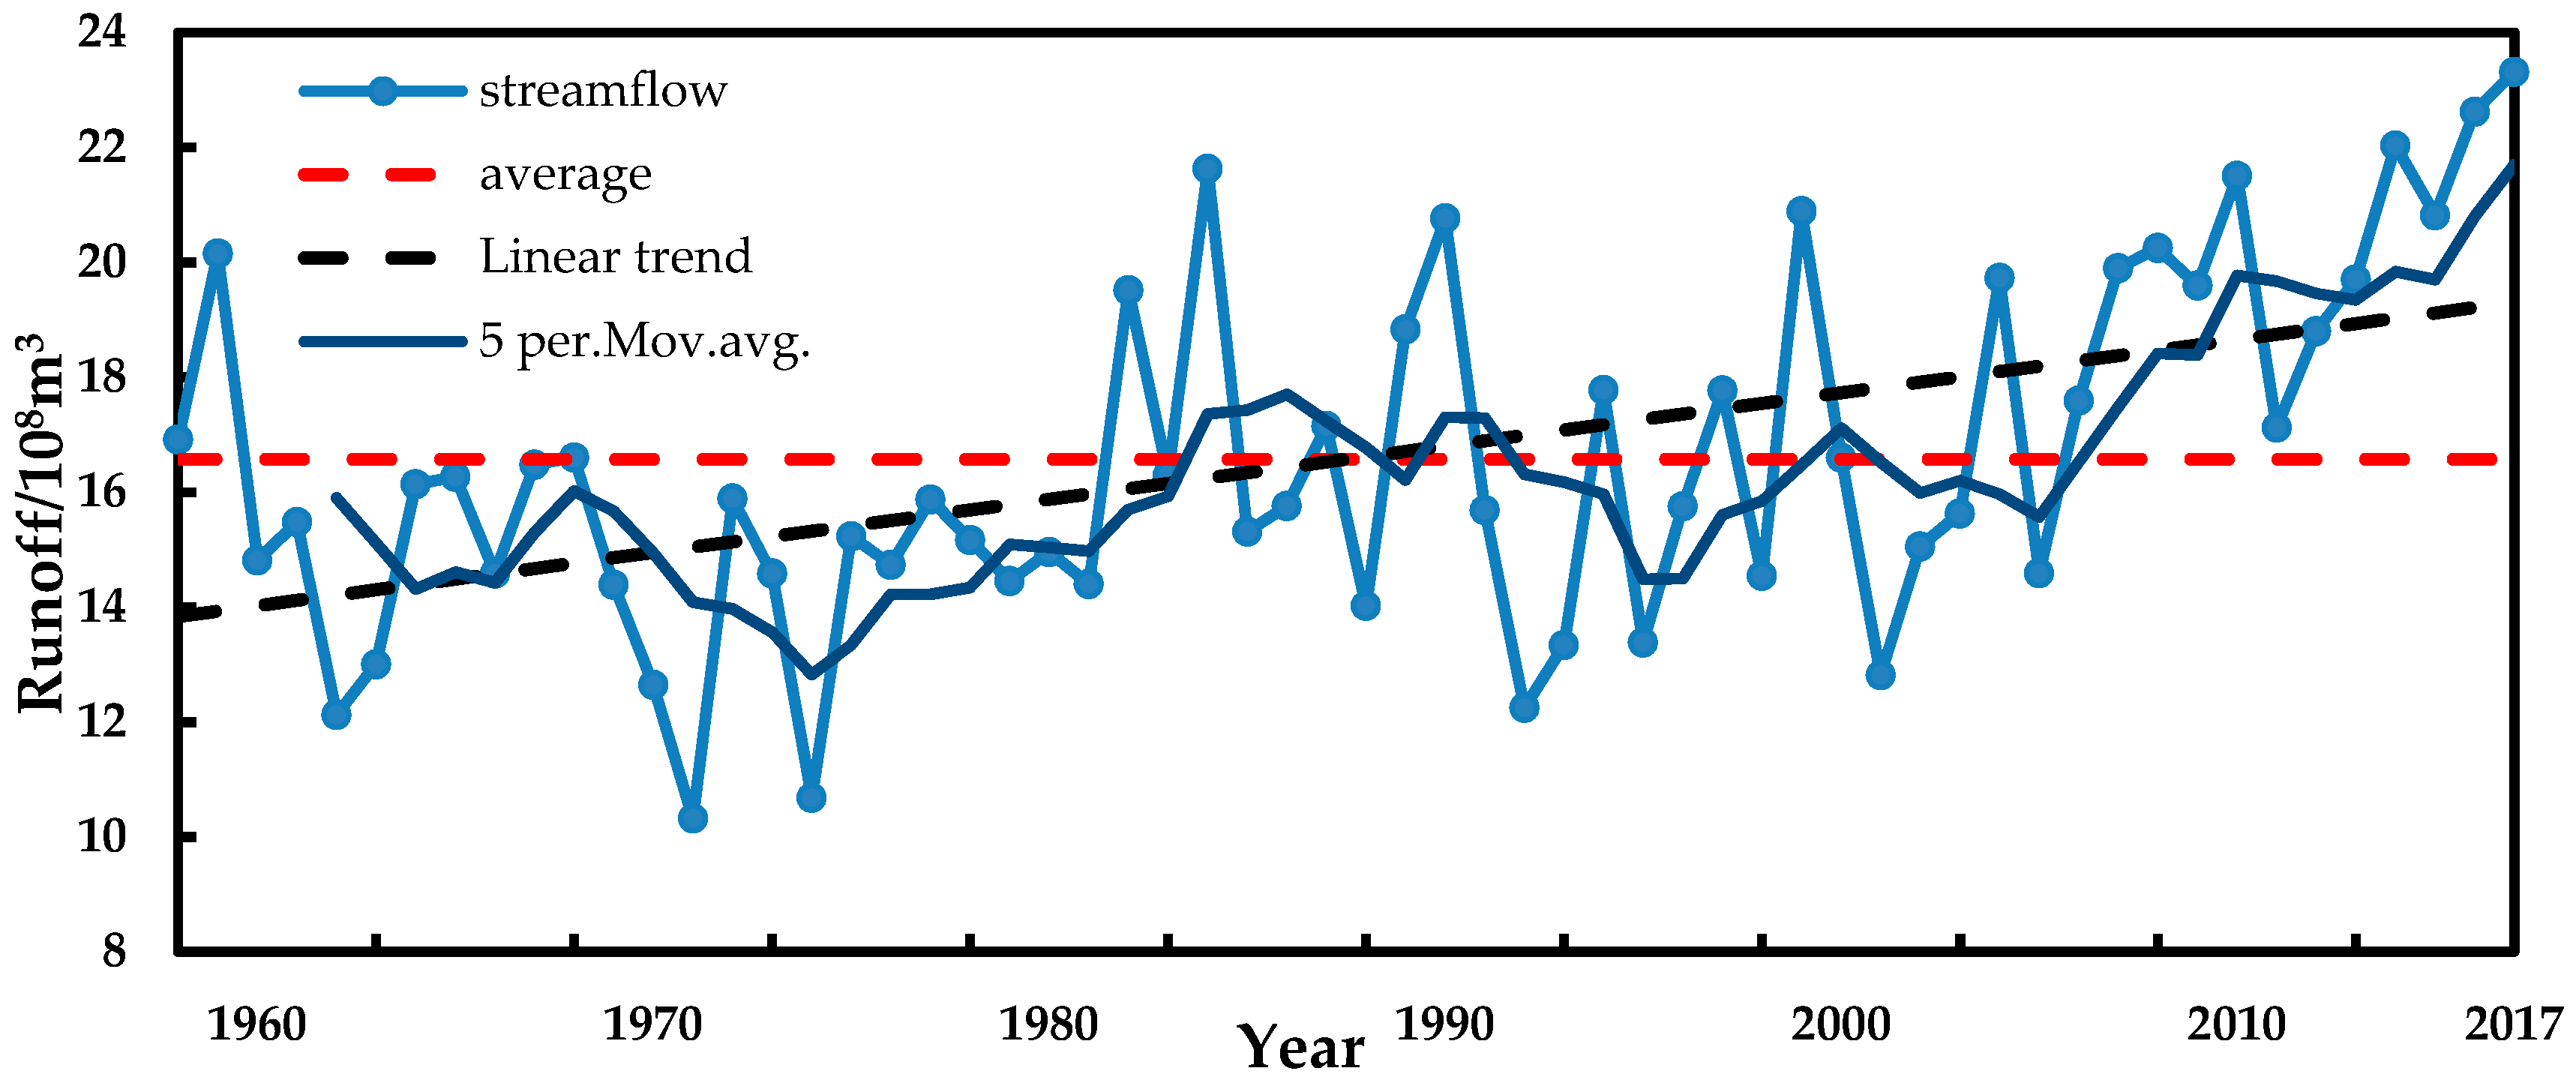
Figure 4 shows the linear analysis of the runoff from 1958 to 2017 and the 5-year moving average curve of the hydrological station at the water outlet of the Heihe source area. In the past 60 years, the annual runoff of the Yingluoxia shows an increasing trend, on the whole. The annual runoff at the Yingluoxia station reached its maximum in 2017, at 23.31 × 10⁸ m3, while the minimum appeared in 1971 at 10.32 × 10⁸ m3, with a tendency to change of 0.93 × 10⁸ m3·10 a−1. After entering the 21st century, runoff is generally large, showing a fluctuating rising trend.
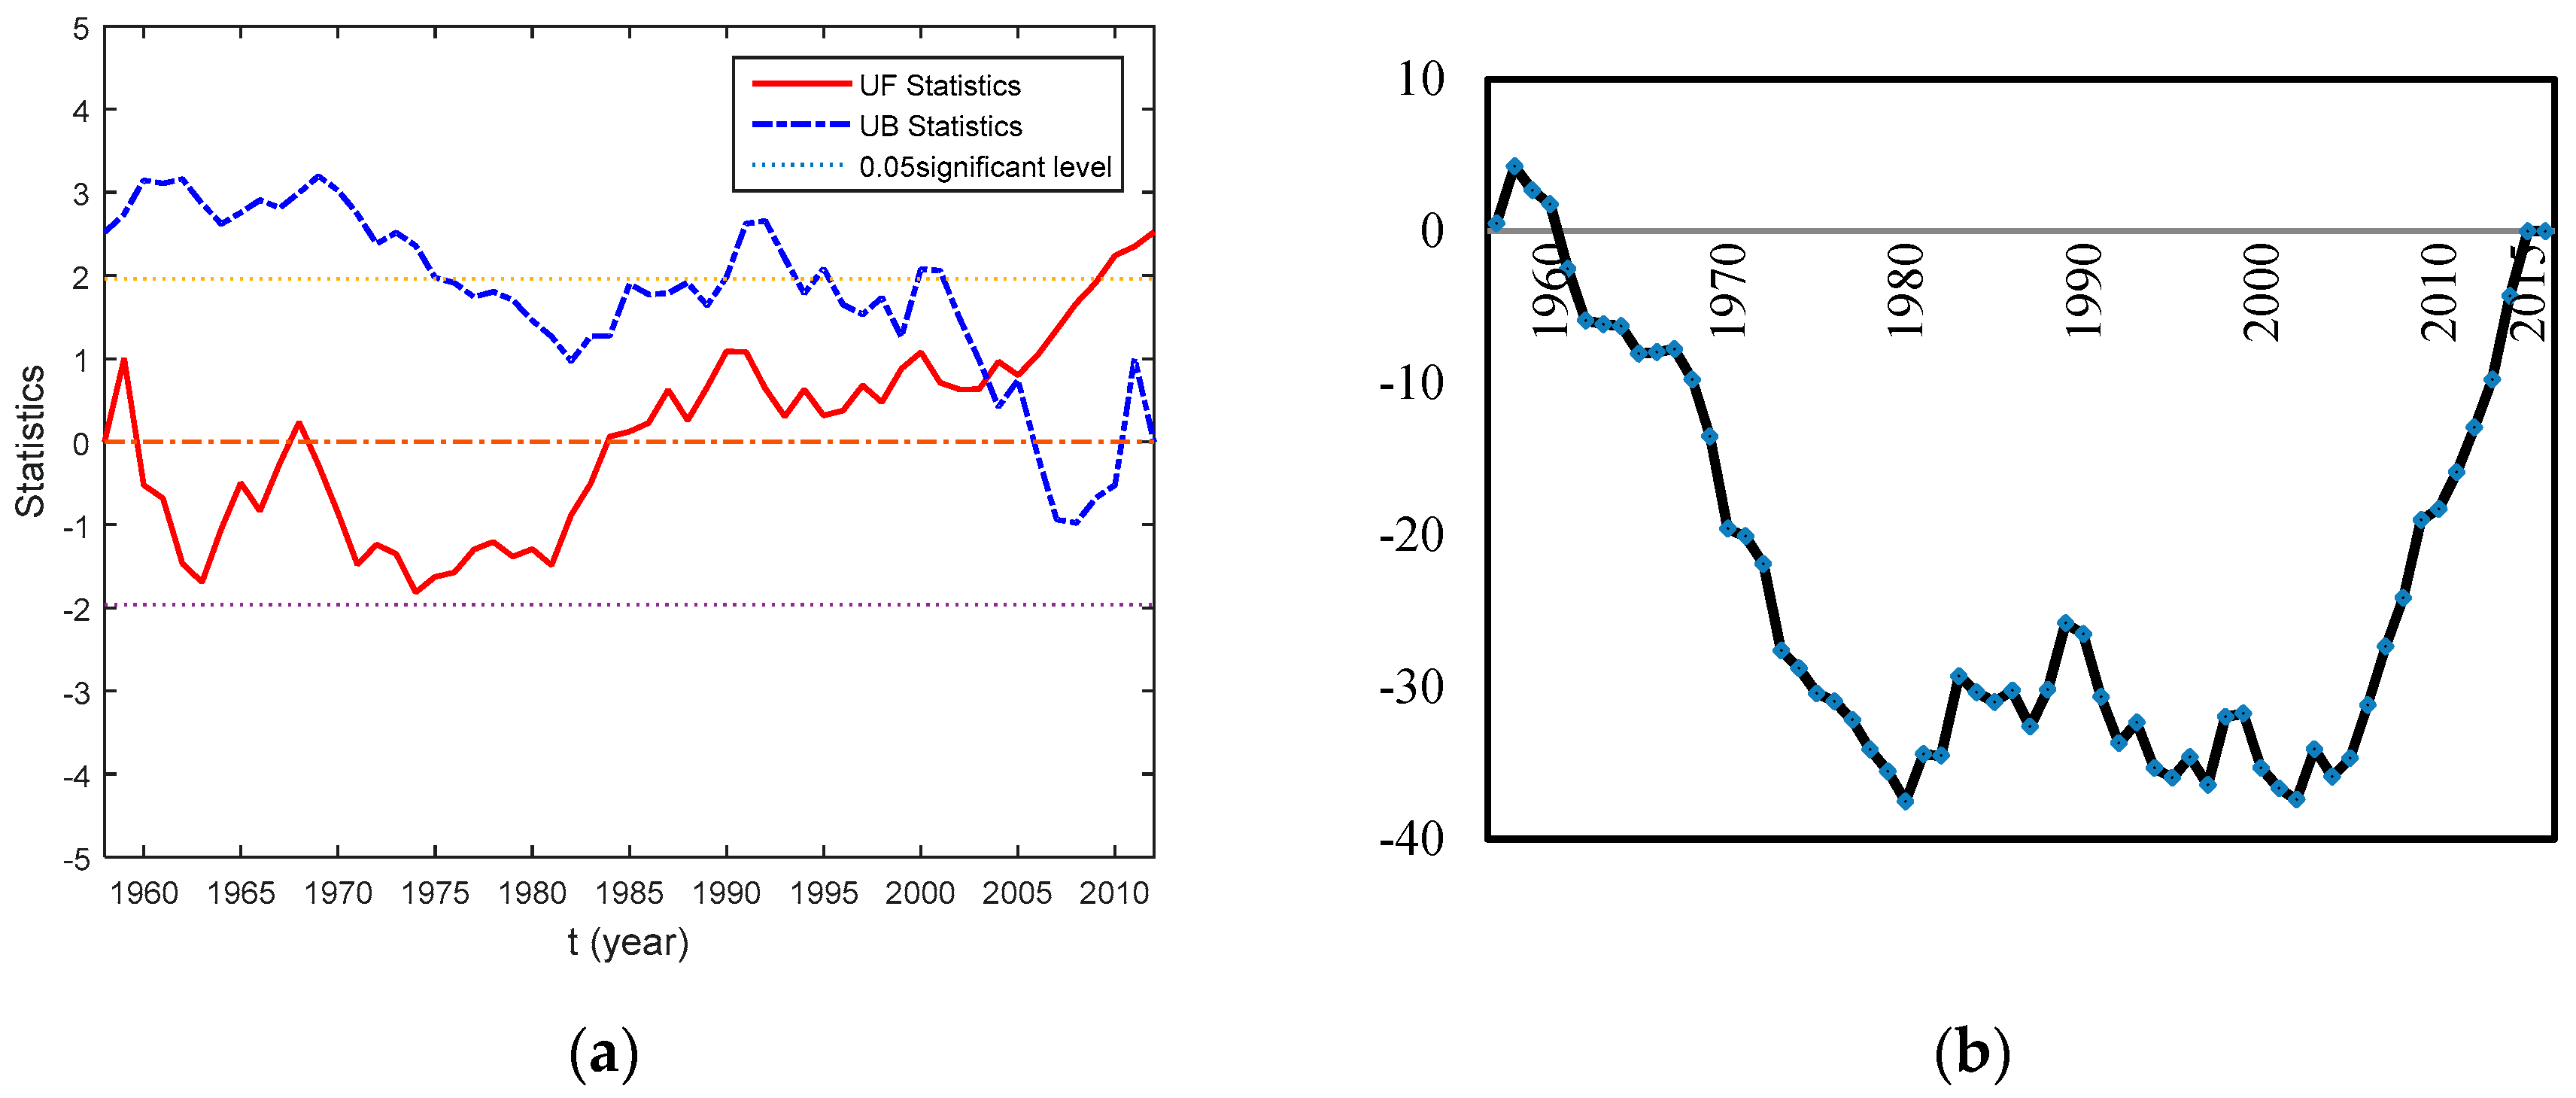
We use a combination of two methods to identify the point of abrupt changes in the runoff sequence. In the M-K curve, the and graphs are plotted. If the value of or is greater than 0, this indicates that the sequence is on an upward trend, and less than 0 indicates a downward trend. When these values exceed the critical line, this indicates a significant increase or decrease. The range exceeding the critical line is determined as the time zone in which the mutation occurs. If there is an intersection between the curves of and , and the intersection is between the critical lines, then the moment corresponding to the intersection is the time when the mutation starts.
As shown in Figure 5a, in the 1980s, the value began to be greater than 0 and was always greater than 0, indicating that the runoff sequence of Yingluoxia station began to rise from the 1980s. In 2008, the value was greater than 1.96, indicating that the trend of increasing the runoff was significant based on a significance level test of 0.05. Also, an intersection of the curves appeared in 2004. As seen in the cumulative anomaly curve of Figure 5b, the cumulative anomaly change process can be roughly divided into three stages: from 1958 to 1980, the annual runoff showed a decreasing trend; from 1981 to 2003, the annual runoff showed a relatively gradual fluctuation trend; after 2004, runoff showed a clear upward trend. The mutations may be caused by symptoms of climate change, such as increased precipitation. In the 21st century, the global climate is warming, and the climate in northwestern China is warm and humid, but there is a significant hysteresis effect, which may lead to sudden changes of runoff appearing in 2004. Combining the two methods, the mutation point was set to 2004. Therefore, in the follow-up study, we divided the study period into a reference period pre-2004 and an interference period after 2004.
3.3. Precipitation and Runoff Correlation Analysis
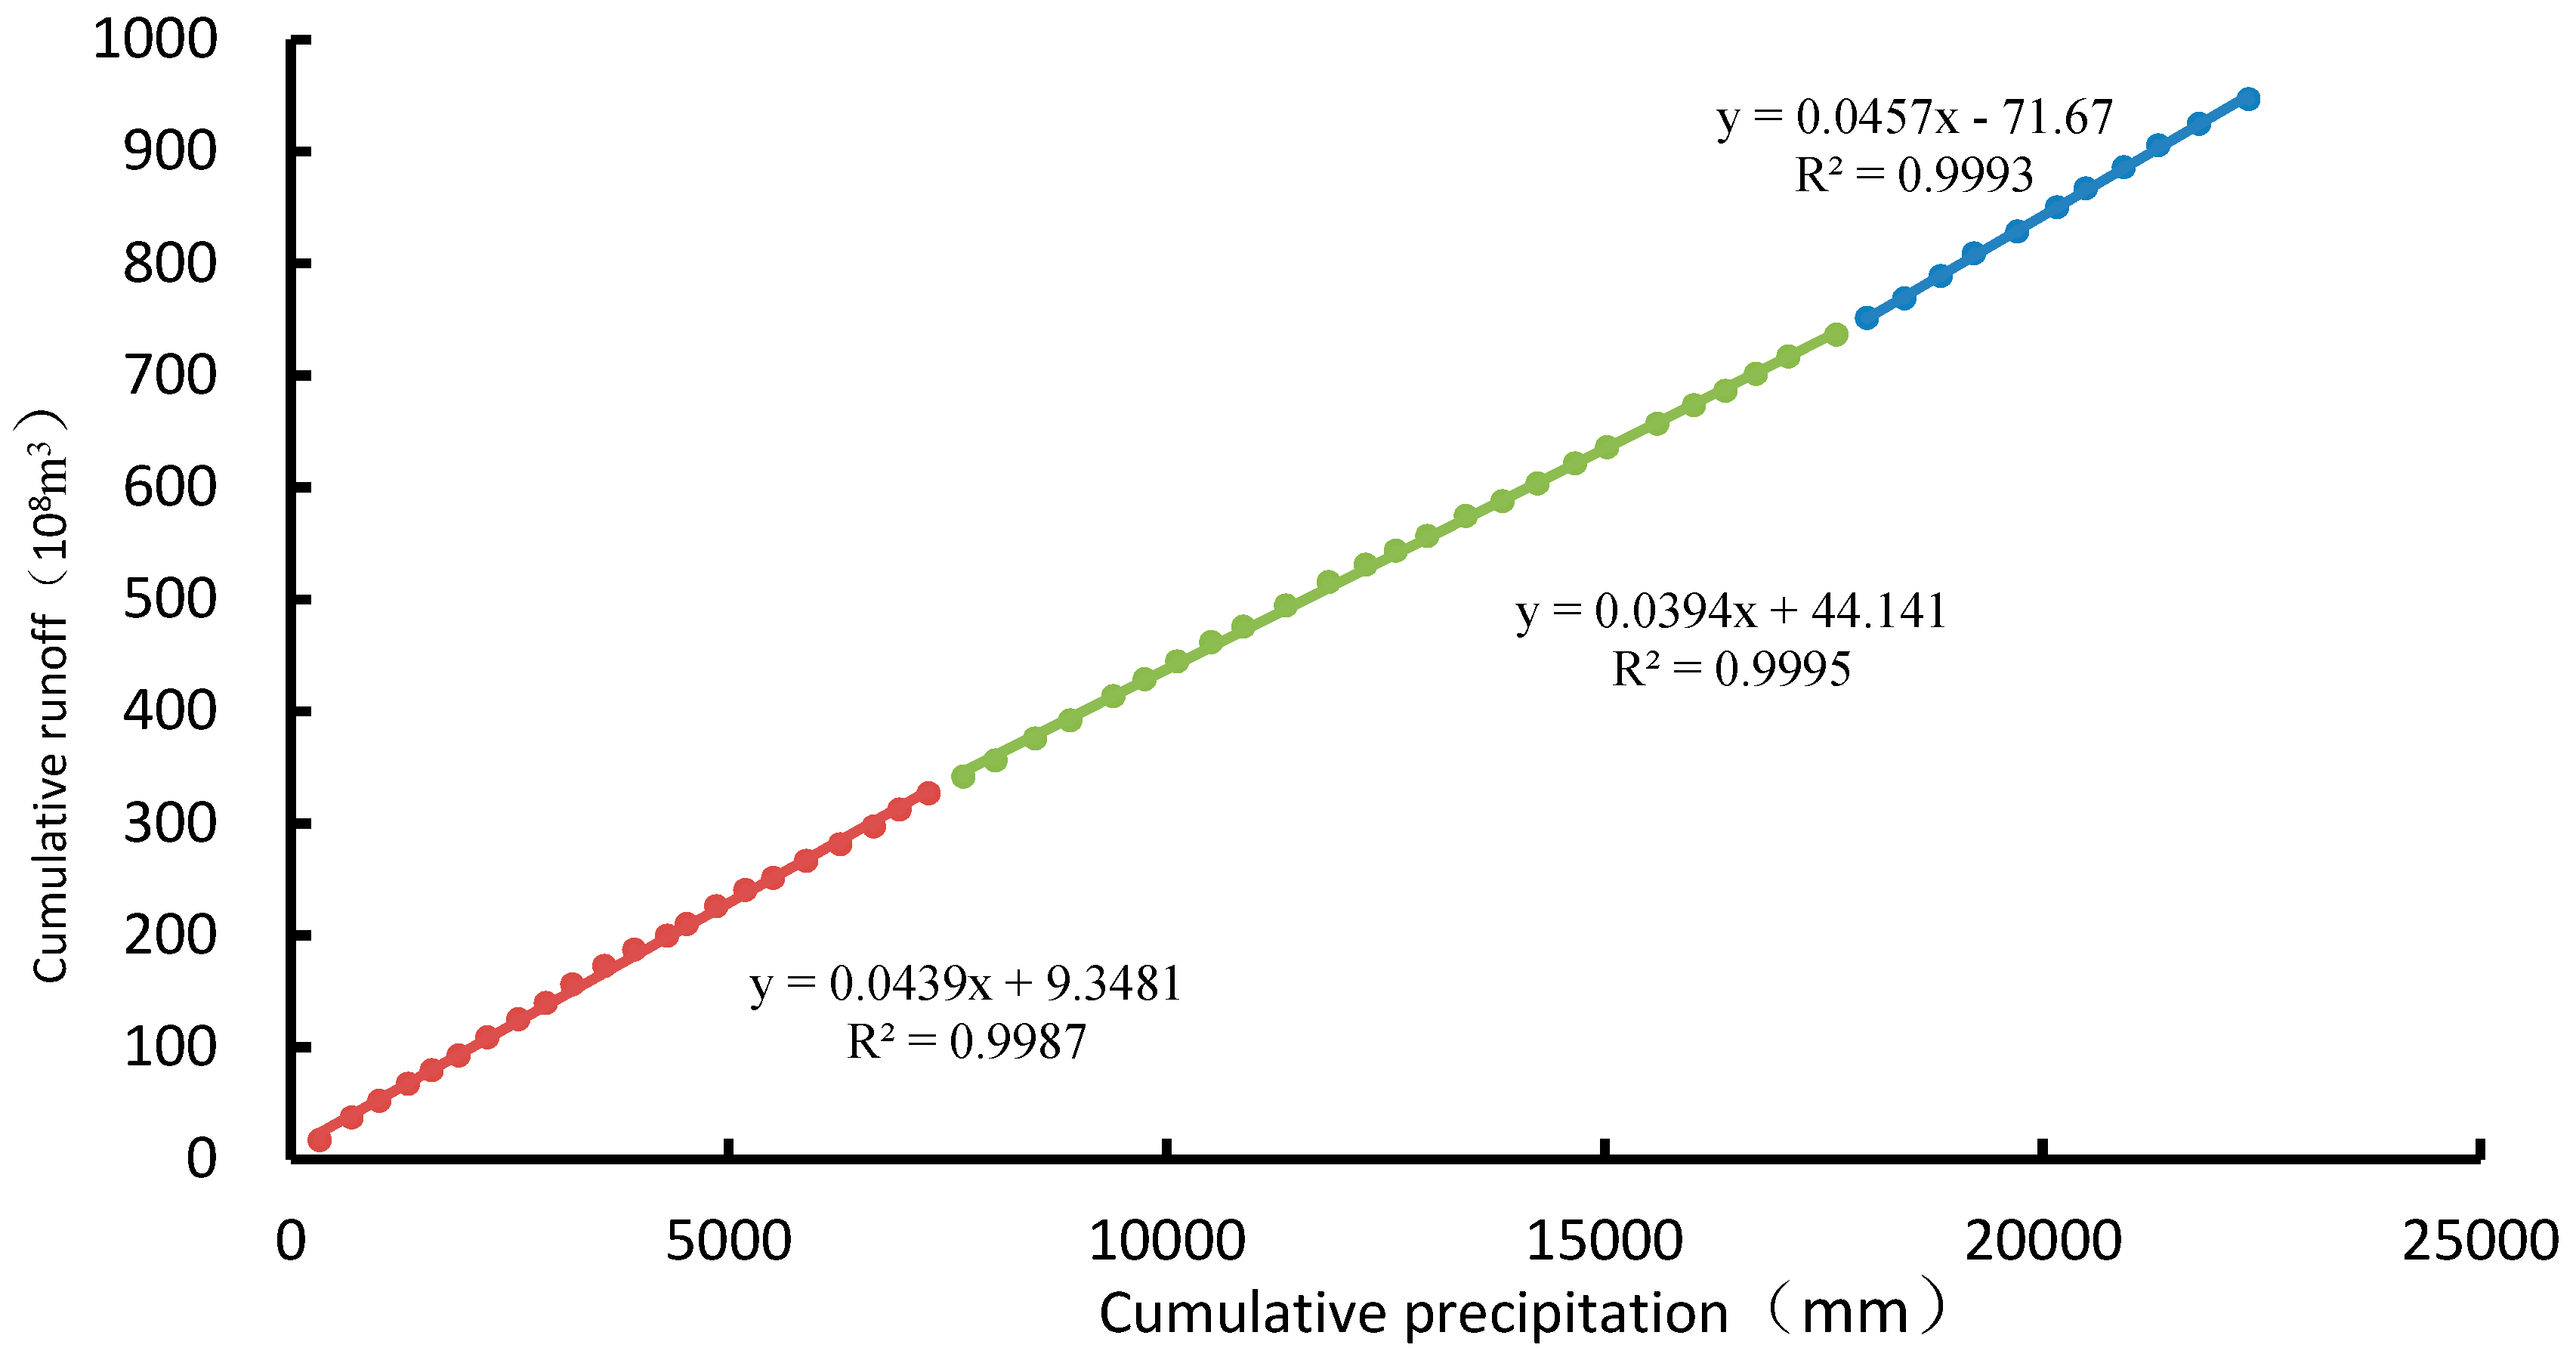
The Double Mass Curve (DMC) is a common method for testing the consistency of relationships between two parameters and their changes. The DMC is the relationship between the continuous cumulative value of one variable and the continuous cumulative value of another variable plotted in the Cartesian coordinate system. It can be used to test the consistency of hydro-meteorological elements. The DMC of the runoff and precipitation in the upper reaches of the Heihe River was plotted to test the correlation between the two factors. The M-K test and the cumulative anomaly curve analysis of the annual runoff of the Yingluoxia hydrological station have been well verified in the precipitation-runoff DMC. As seen in Figure 6, the precipitation-runoff DMC is roughly divided into three phases, 1958–1979, 1980–2003, and 2004–2014.
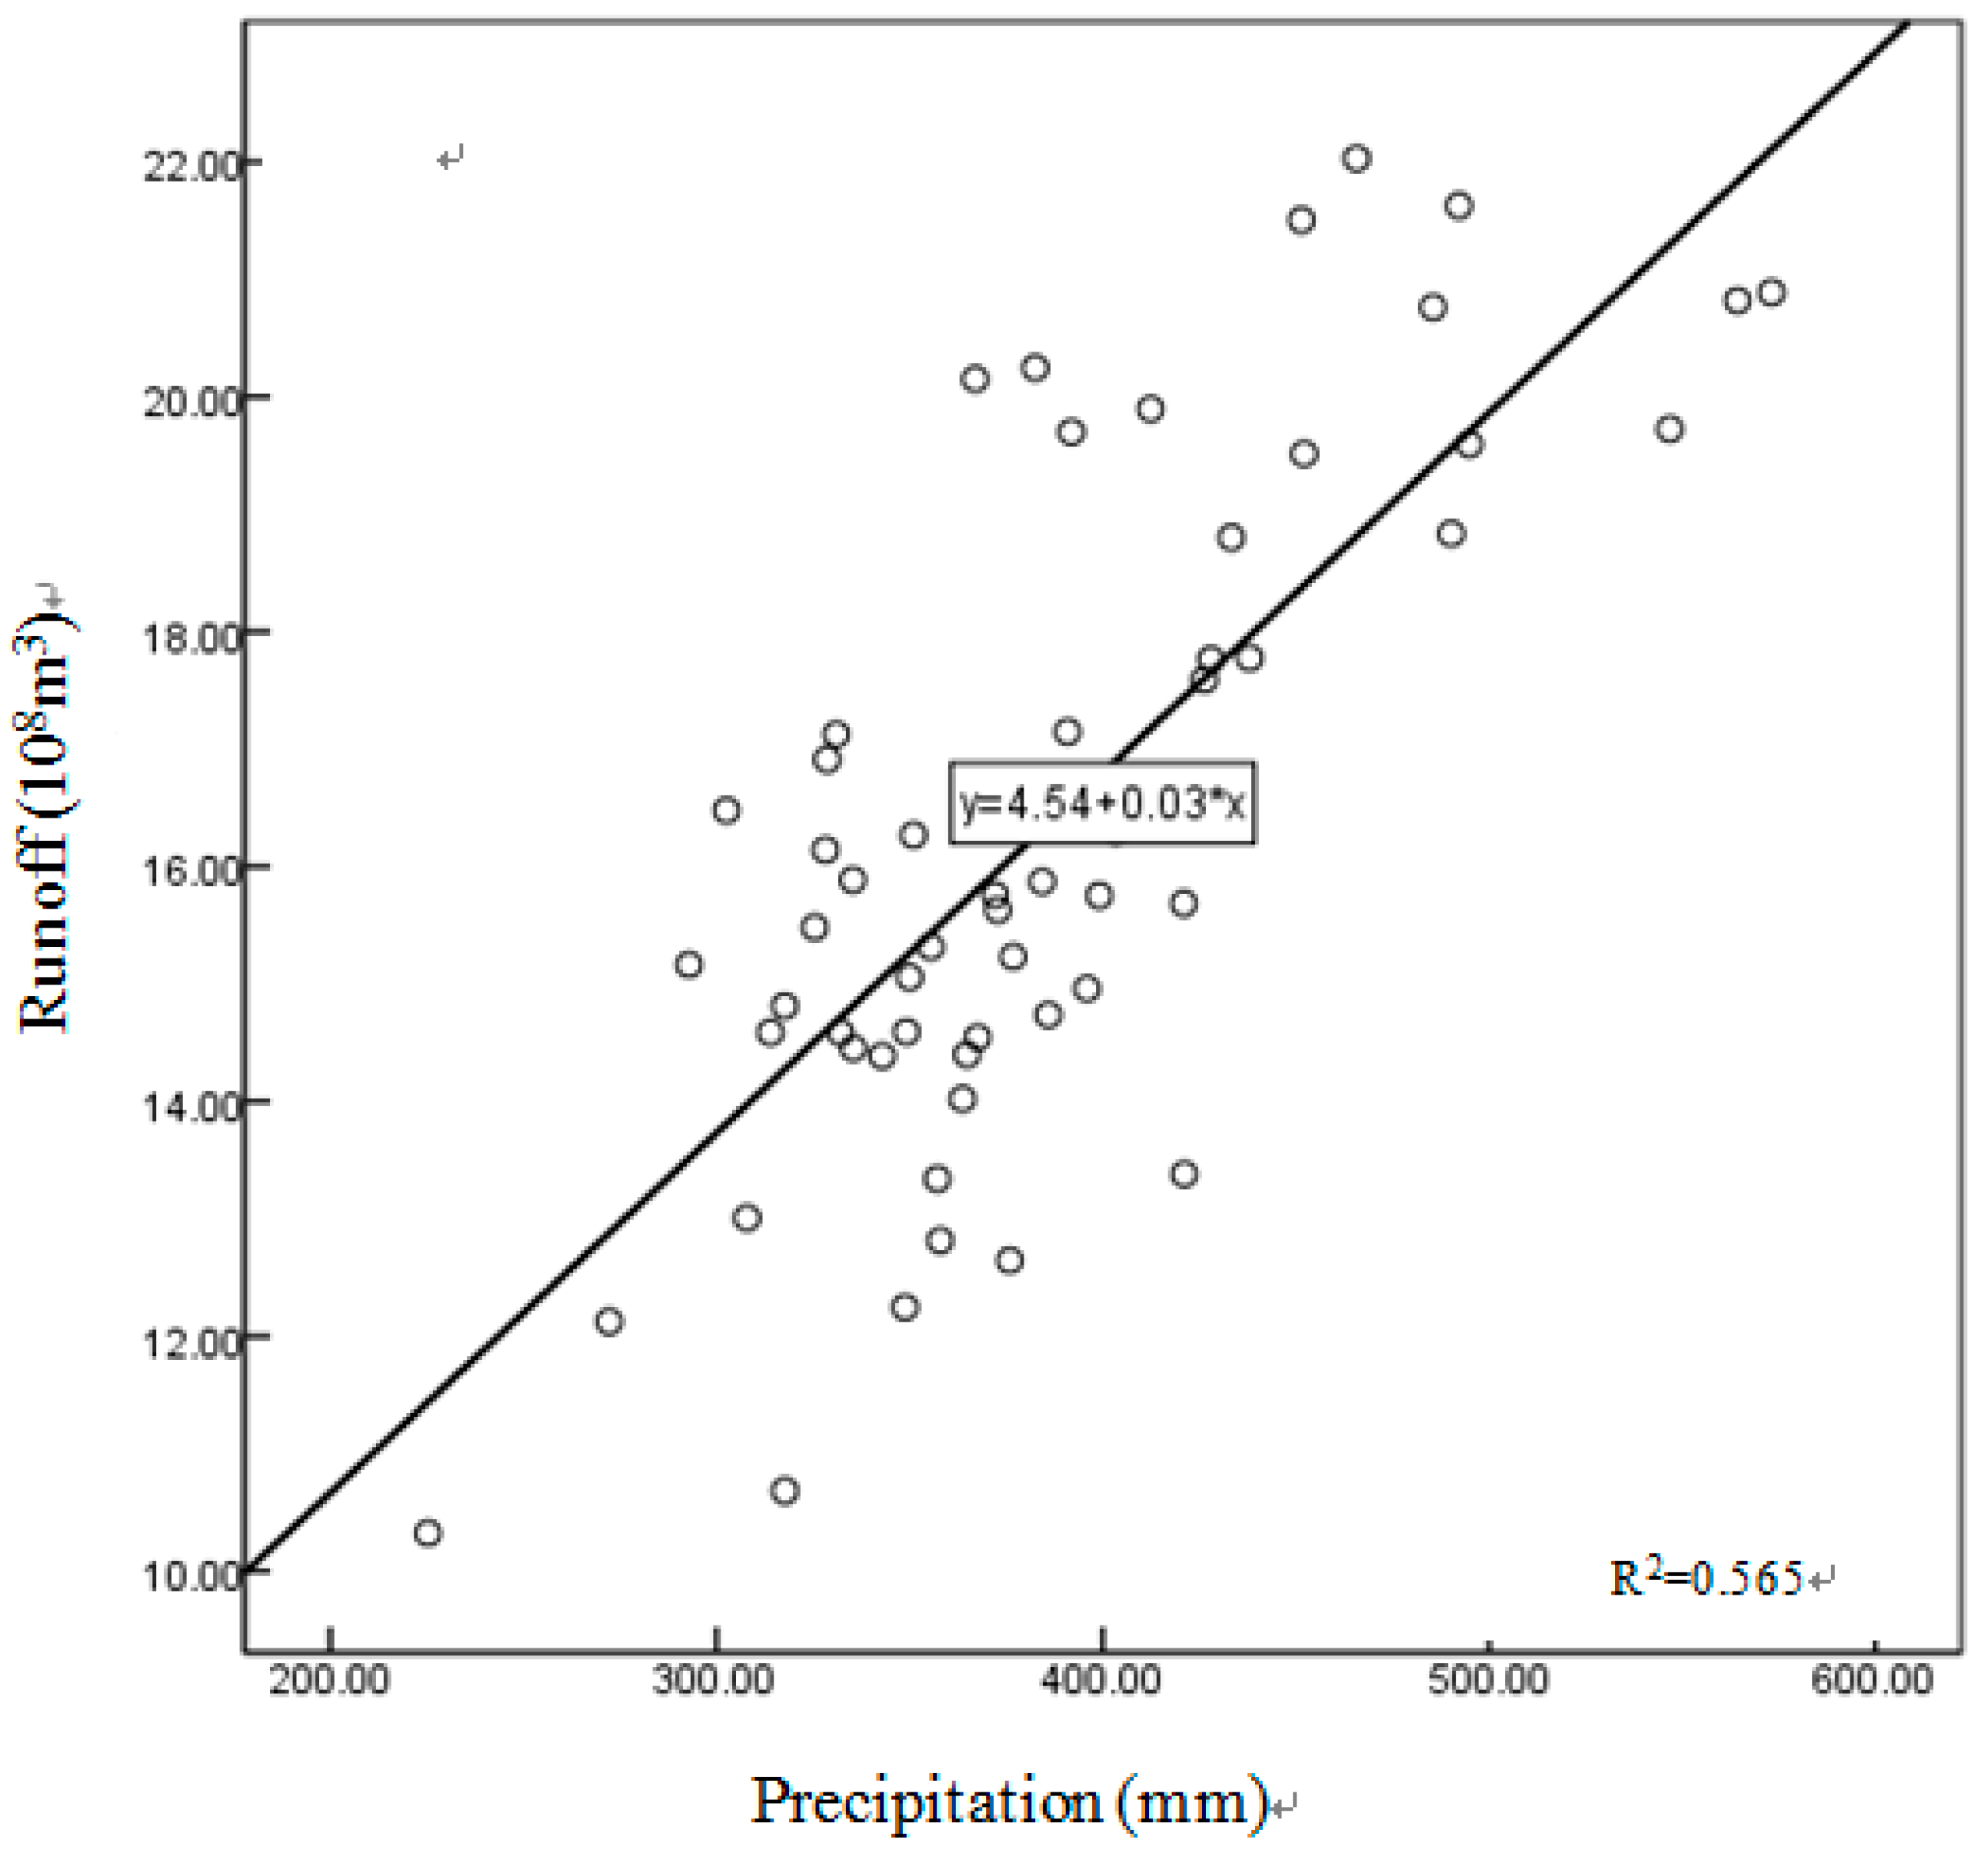
Figure 7 shows the correlation analysis between runoff and precipitation changes. From the annual scale, the runoff changes are consistent with the precipitation changes, and there is a clear correlation. In addition, the correlation passed the significance test.
3.4. Contribution of Land Use and Climate Change to Runoff Variation
The different meteorological data and land use data for the designated natural period and interference period are combined and the runoff contribution rate of land use and climate change in the Heihe River Basin is calculated according to different scenarios. In the upper reaches of the Heihe River, the contribution rate of climate change runoff is much greater than the contribution rate of human activities.
The simulation results are shown in Table 7. The simulated annual runoff is 622.67 m3/s in the reference period and 710.90 m3/s in the interference period. Compared with the reference period, the total runoff increased during the interference period by 88.23 m3/s. Among the scenarios, the increase caused by climate change is 76.89 m3/s, and the increase caused by human activities is 11.34 m3/s. The contribution rate of climate change is 87.15%, while the contribution rate of human activities is only 12.85%.
He et al. calculated the contribution rate of climate change and human activities to runoff in the upper reaches of the Heihe River by the elastic coefficient method, and found that the contribution rate of climate change is greater than that of human activities, but because of the analysis based on statistical characteristics, the land use type and soil are ignored the type and other physical mechanisms [32]. Lin et al. identified the effects of climate and land use change on runoff and evapotranspiration through hydrological model separation. The role of climate change is found to be much greater than land use change [50]. Meng et al. used the SWAT model to study the Aksu River in the northwest inland area and found that climate factors and human activities were responsible for 92.28% and 7.72% of the variability, respectively [61]. These are consistent with the results of this paper.
3.5. Scenario Simulation of Climate Change and Land Use Cover Change
3.5.1. Climate Change Factor
The SWAT model was used to analyze the combined scenarios of different meteorological data. According to Table 8, the influence of temperature on runoff is complicated, and the increase or decrease in runoff caused by temperature cannot be determined. When the temperature is lowered, evaporation is reduced, which leads to an increase in surface runoff. However, when the temperature rises, the change of surface runoff presents uncertainty due to the conflict effect caused by evaporation and snowmelt runoff. An increase in temperature causes an increase in evaporation, resulting in a decrease in surface runoff. At the same time, an increase in temperature will also lead to an increase in glacial snowmelt runoff, which will increase surface runoff. In the case of maintaining the precipitation in the upper reaches of the Heihe River, the runoff also changed with the change in temperature, but all scenarios showed an increasing trend; as the temperature increases, the increase in surface runoff has been alleviated. The effect of rainfall on runoff is positive. With the temperature of the upper reaches of the Heihe River remains unchanged, the runoff increases with increasing rainfall, and vice versa.
Table 9 shows the response of runoff to lower temperatures and higher precipitation. As shown in Table 9, when ∆T = 0, it means the response of the runoff to the increase of precipitation when the temperature is constant. It can be seen that the increase in precipitation increases the runoff, and the more the precipitation increases, the more the runoff increases. When ∆P = 0, it means the response of the runoff to the temperature decreases when the precipitation is constant. It can be seen that the lower the temperature, the more the runoff increases, and the more the temperature is lowered, the more the runoff increases. When both ∆T and ∆P are not zero, it means that the temperature decreases and the precipitation increases. It can be found that when the temperature decreases and the precipitation increases, the runoff increases the most.
Table 10 shows the response of runoff to both elevated temperature and precipitation. It can be seen from Table 10 that when ∆P = 0, when the precipitation is constant, the runoff will increase when the temperature rises. When both ∆T and ∆P are not zero, it indicates the response of the runoff when the temperature and precipitation increase simultaneously. When the increase of precipitation reaches 10% or more, the runoff increases, indicating that the effect of precipitation on runoff is more significant. Due to the large area of glaciers in the upper reaches of the Heihe River, when the temperature rises, the increase of glacial snowmelt will also lead to an increase in runoff.
Table 11 shows the response of runoff to simultaneous decrease in temperature and precipitation. From Table 11, when ∆T = 0, it means that when the temperature is constant, the runoff decreases when the precipitation decreases. When both ∆T and ∆P are not zero, it indicates the response of the runoff when both temperature and precipitation decrease. It can be seen that the decrease in temperature and the decrease in precipitation have the opposite effect on runoff. When the precipitation is constant, the temperature decreases, the runoff increases, and the lower the temperature, the larger the runoff. When the temperature is constant, the decrease in precipitation will result in a decrease in runoff, and the lower the temperature, the lower the runoff.
Table 12 shows the response of runoff to elevated temperatures and reduced precipitation. It can be seen from Table 12 that when ∆T = 0, and the temperature is constant, when the precipitation decreases, the runoff will decrease, and the more the precipitation decreases, the smaller the runoff. When both ∆T and ∆P are not zero, it indicates the response of the runoff when the temperature rises and precipitation decreases. It can be seen that both the increase in temperature and the decrease in precipitation can reduce the runoff.
3.5.2. Land Use Change Factor
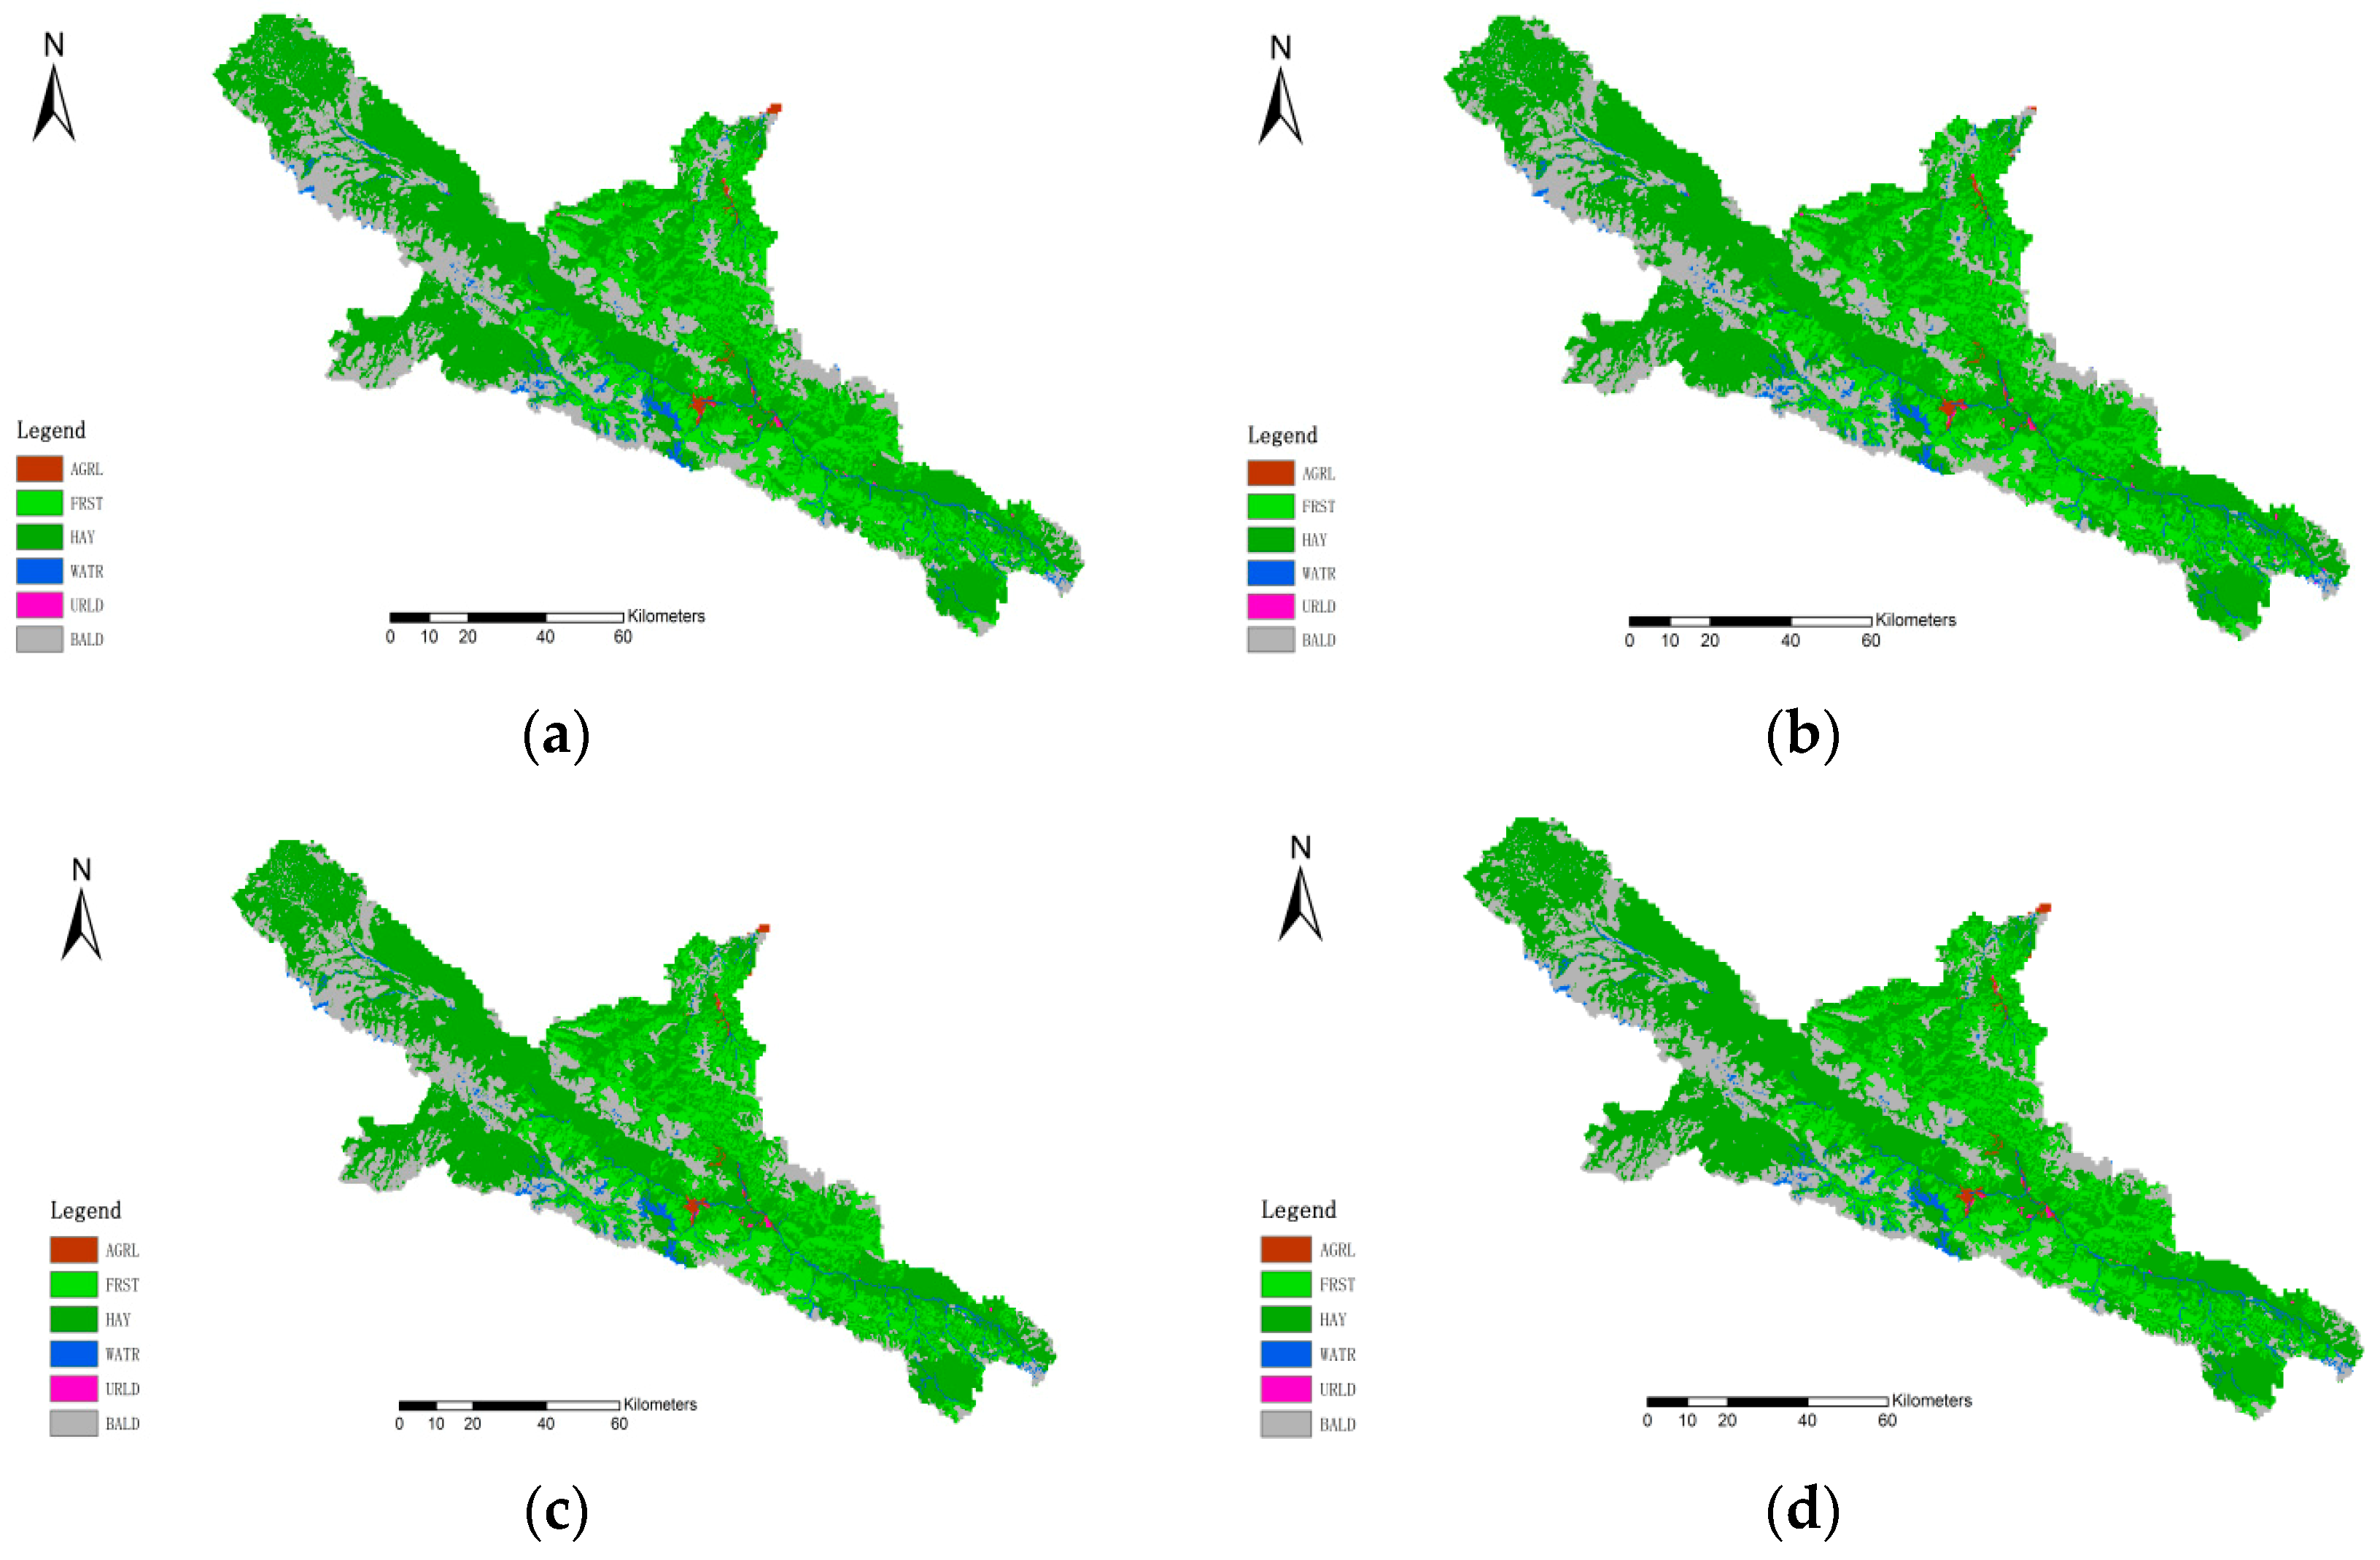
According to the historical development trend and existing problems in the Heihe River Basin, the Dyna-CLUE model was used to simulate the land use scenarios of the 2020 and 2030 (Figure 8). Considering the actual land use setting in 2000 as a basic scenario, the impact of future land use changes on runoff was analyzed. The dataset was provided by the Heihe Plan Science Data Center, National Natural Science Foundation of China.
Under natural scenarios, land-use change evolves according to existing trends. The ecological protection scenario is to strictly limit the land use type to occupy land for forest land, grassland and water land, strictly implementing the measures of returning farmland to forests and grasslands. Under circumstances of economic development, with the development of the social economy and the increase of the urban population, the demand for industry, residential and public land is urgent, leading to the continuous expansion of the urban scale, leading in turn to an increase in urban construction land and cultivated land.
It can be seen from Table 13 that under the future scenario, land use areas of various types will increase or decrease to different degrees. Under natural growth, from 2020 to 2030, the cultivated land will increase, and the forest and grassland area will decrease. Under the protection situation, from 2020 to 2030, the area of cultivated land, forest land and grassland will increase, and the area of bare land will decrease. Under the economic development situation, from 2020 to 2030, the area of cultivated land will increase, the area of bare land will increase, and the area of forest land and grassland will decrease.
The land use scenario simulation results are shown in Table 14. In 2020, under the natural growth scenario and ecological protection scenario, runoff showed an increasing trend, but the degree of increase was different between the scenarios, while under economic development, runoff showed a decreasing trend. Under the natural growth scenario, the area of grassland decreased, the area of cultivated land and bare land increased, and by 2030, the amount of runoff increased. Under the ecological protection scenario, the area of arable land and bare land decreased, and the area of forestland and grassland increased. The increase in runoff was larger than that under the natural growth scenario, which shows that the increase in forestland and grassland has a greater impact on the increase in runoff than that of cultivated land or bare land. In future planning, the area of ecological land such as forest and grass can be appropriately increased.
In the future land use scenario, the SWAT model is used to simulate, and the results show that the runoff increases or decreases in different situations. In the case of natural growth and ecological protection, runoff shows an increasing trend. However, in the case of ecological protection, the increase in runoff is more significant. Under the economic development situation, the runoff is reduced due to the large reduction in grassland area. It can be seen that the construction of ecological construction land such as forest land and grassland can, to a certain extent, improve the regional microclimate, improve the soil environment, reduce the surface temperature, reduce the direct evaporation of water, and have a positive effect on the surface runoff.
4. Conclusions
By analyzing the impact of climate and land use change on runoff in this paper, a qualitative analysis is turned into a quantitative analysis for the development and utilization of water resources in the Heihe River Basin, providing a reference base. In this paper, the runoff change trend at the Yingluoxia station in the upper reaches of the Heihe River over the past 60 years is analyzed and combined with the SWAT model to simulate runoff. We combine different scenarios of climate and land use change to simulate surface runoff. The results show the following:
- (1)
- The annual runoff in the upper reaches of the Heihe River is increasing. The long-term runoff sequence was mutated in 2004. Therefore, the runoff sequence was divided into the reference period before 2004 and the interference period after 2004.
- (2)
- The SWAT model has good applicability in runoff simulation of the Yingluoxia hydrological station. It can be used for contribution rate calculations and scenario simulations.
- (3)
- The contribution rates of climate change and land use to watershed runoff are very different. In the upper reaches of the Heihe River, the contribution rate of climate change to runoff change is 87.15%, while human activities contribute only 12.85%.
- (4)
- According to different temperature and rainfall scenarios, the simulation analysis shows that decreased temperature causes increased surface runoff. However, when the temperature rises, the change of surface runoff presents uncertainty due to the conflict effect caused by evaporation and snowmelt runoff. While an increase in rainfall will lead to an increase in runoff, but the amount of increase will differ. It can be found that when the precipitation increases and the temperature decreases, the runoff increases the most. When the temperature increases and the precipitation decreases, the amount of runoff reduction is most significant.
- (5)
- Land use in different scenarios has different effects on runoff. Both natural and ecological conservation trends lead to increased runoff, but the increase in runoff is greater under the ecological protection scenario, while under economic development, runoff showed a decreasing trend. The increase of forest land and grassland area caused the increase of surface runoff. It can improve the regional climate to a certain extent and have a positive effect on surface runoff. Also, the cultivated land has a negative contribution to soil and water conservation and has a negative effect on the occurrence of surface runoff.
Although climate change plays a key role in the runoff changes in the UHRB, the impact of human activities cannot be ignored. Against the background of climate change, according to the water resource utilization management objectives, watershed management measures can be adjusted to realize the rational layout of land use and then change the river basin runoff trend, which provides a reference for effective scientific planning in river basins. In the future watershed management process, while meeting upstream water demand, the land use structure can be adjusted and rationally distributed, thereby increasing the upstream water output and ensuring water use in the lower reaches of the basin. In this paper, research regarding a certain contribution rate was conducted, but there are still many factors that have not been considered. For example, climate change can be combined with evapotranspiration, and other human activities can also be added to considerations for further research.
Author Contributions
Methodology, X.S., C.W.; software, X.S.; validation, X.S.; formal analysis, X.S.; investigation, X.S., R.J.; writing—original draft preparation, X.S.; writing—review and editing, X.S.; supervision, X.J.; project administration, X.J. All authors have read and approved the final manuscript.
Funding
This research was supported by the National Natural Science Fund Major Research Plan (91325201), the National Natural Science Fund (51779209), and the National key research and development plan (2017YFC0404303).
Conflicts of Interest
The authors declare no conflict of interest.
References
- Huntington, T.G. Evidence for intensification of the global water cycle: Review and synthesis. J. Hydrol. 2006, 319, 83–95. [Google Scholar] [CrossRef]
- Wang, R.; Kalin, L.; Kuang, W.; Tian, H. Individual and combined effects of land use/cover and climate change on Wolf Bay watershed streamflow in southern Alabama. Hydrol. Process. 2014, 28, 5530–5546. [Google Scholar] [CrossRef]
- Liu, D.D.; Chen, X.H.; Lian, Y.Q. Impacts of climate change and human activities on surface runoff in the Dongjiang River basin of China. Hydrol. Process. 2010, 24, 1487–1495. [Google Scholar] [CrossRef]
- Xia, J.; Liu, C.Z.; Ren, G.Y. Opportunity and Challenge of the Climate Change Impact on the Water Resource of China. Adv. Earth Sci. 2011, 26, 1–12. [Google Scholar]
- Zhang, L.; Srinivasan, R.; Bai, Z.K. Analysis of streamflow response to climate variability and land use change in the Loess Plateau region of China. CATENA 2017, 154, 1–11. [Google Scholar] [CrossRef]
- Birkinshaw, S.J.; Guerreiro, S.B.; Nicholson, A.; Liang, Q.; Quinn, P.; Zhang, L.; He, B.; Yin, J.; Fowler, H.J. Climate change impacts on Yangtze River discharge at the Three Gorges Dam. Hydrol. Earth Syst. Sci. 2017, 21, 1911–1927. [Google Scholar] [CrossRef] [Green Version]
- Li, Z.; Liu, W.Z.; Zhang, X.C.; Zheng, F. Impacts of land use change and climate variability on hydrology in an agricultural catchment on the Loess Plateau of China. J. Hydrol. 2009, 337, 35–42. [Google Scholar] [CrossRef]
- Liu, J.Y.; Zhang, Q.; Deng, X.Y.; Ci, H.; Cheng, X.H. Quantitative analysis the influences of climate change and human activities on hydrological processes in Poyang Basin. J. Lake Sci. 2016, 28, 432–443. [Google Scholar]
- Bao, Z.X.; Zhang, J.Y.; Wang, G.Q.; Fu, G.; He, R.; Yan, X.; Jin, J.; Liu, Y.; Zhang, A. Attribution for decreasing streamflow of the Haihe River basin, northern China: Climate variability or human activities? J. Hydrol. 2012, 460/461, 117–129. [Google Scholar] [CrossRef]
- Kibria, K.N.; Ahiablame, L.; Hay, C.; Djira, G. Streamflow Trends and Responses to Climate Variability and Land Cover Change in South Dakota. Hydrology 2016, 3, 2. [Google Scholar] [CrossRef]
- Ma, L.; Liu, T.X.; Ma, L.; Sun, M.; Ding, T.; Xin, X.H. The effect of climate change and human activities on the runoff in the upper and middle reaches of the Liaohe River, Inner Mongolia. J. Glaciol. Geocryol. 2017, 3, 470–479. [Google Scholar]
- Gao, C.; Ruan, T. The influence of climate change and human activities on runoff in the middle reaches of the Huaihe River Basin, China. J. Geogr. Sci. 2018, 28, 79–92. [Google Scholar] [CrossRef]
- Gao, L.M.; Zhang, Y.N. Spatio-temporal variation of hydrological drought under climate change during the period 1960–2013 in the Hexi Corridor, China. J. Arid. Land 2016, 8, 157–171. [Google Scholar] [CrossRef]
- Li, L.J.; Zhang, L.; Wang, H.; Meng, X. Assessing the impact of climate variability and human activities on streamflow from the Wuding river basin in China. Hydrol. Process. 2007, 21, 3485–3491. [Google Scholar] [CrossRef]
- Zhang, Y.; Guan, D.; Jin, C.; Wang, Z. Impacts of climate change and land use change on runoff of forest catchment in northeast China. Hydrol. Process. 2014, 28, 186–196. [Google Scholar] [CrossRef]
- Zhang, A.J.; Wang, B.D.; Cao, M.M. Influence research of climate change and human activities on runoff contribution. Northeast Water Conserv. Hydropower 2012, 1, 6–11. [Google Scholar]
- Yin, Z.L.; Xiao, H.L.; Zou, S.; Lu, Z.X. Process of the Research on Hydrological Simulation in the Mainstream of the Heihe River, Qilian Mountains. J. Glaciol. Geocryol. 2013, 35, 438–466. [Google Scholar]
- Tao, H.; Bai, Y.G.; Mao, W.Y. Observed and Projected Climate Changes in Tarim River Basin. J. Glaciol. Geocryol. 2011, 35, 738–743. [Google Scholar]
- Hu, S.S.; Zheng, H.X.; Liu, C.M.; Yu, J.J.; Wang, Z.G. Assessing the Impacts of Climate Variability and Human Activities on Streamflow in the Water Source Area of Baiyangdian Lake. Acta Geogr. Sin. 2012, 67, 62–70. [Google Scholar] [CrossRef]
- Ma, C.K.; Sun, L.; Liu, S.Y.; Shao, M.; Luo, Y. Impact of climate change on the streamflow in the glacierized Chu River Basin, Central Asia. J. Arid Land 2015, 7, 501–513. [Google Scholar] [CrossRef] [Green Version]
- Wu, F.; Zhan, J.; Su, H.; Yan, H.; Ma, E. Scenario-based impact assessment of land use/cover and climate changes on watershed hydrology in Heihe River Basin of northwest China. Adv. Meteorol. 2014, 2015, 11. [Google Scholar] [CrossRef]
- An, M.; Zhang, B.; Sun, L.; Zhang, T.; Yang, B.; Wang, D.; Zhang, C. Quantitative analysis of dynamic change of land use and its influencing factor in upper reaches of the Heihe river. J. Glaciol. Geocryol. 2013, 35, 355–363. [Google Scholar]
- Wang, Y.; Ding, Y.J.; Ye, B.S.; Liu, F.J.; Wang, J.; Wang, J. Contributions of climate and human activities to changes in runoff of the Yellow and Yangtze rivers from 1950 to 2008. Sci. China Earth Sci. 2012, 56, 1398–1412. [Google Scholar] [CrossRef]
- Li, Y.G.; He, D.; Li, X.; Zhang, Y.; Yang, L. Contributions of Climate Variability and Human Activities to Runoff Changes in the Upper Catchment of the Red River Basin, China. Water 2016, 8, 414. [Google Scholar] [CrossRef]
- Li, F.P.; Zhang, G.X.; Xu, Y.J. Separating the impacts of climate variation and human activities on runoff in the Songhua River Basin, Northeast China. Water 2014, 6, 3320–3338. [Google Scholar] [CrossRef]
- Wang, G.Q.; Zhang, J.Y.; Liu, J.F.; Yan, J. Quantitative assessment for climate change and human activities impact on river runoff. China Water Resour. 2008, 2, 55–58. [Google Scholar]
- Rahman, K.; da Silva, A.G.; Tejeda, E.M.; Gobiet, A.; Beniston, M.; Lehmann, A. An independent and combined effect analysis of land use and climate change in the upper Rhone River watershed, Switzerland. Appl. Geogr. 2015, 63, 264–272. [Google Scholar] [CrossRef]
- Zhao, Y.; Yu, X.X.; Zheng, J.K.; Wu, Q.Y. Quantitative effects of climate variations and land-use changes on annual streamflow in Chaobai River Basin. Trans. Chin. Soc. Agric. Eng. 2012, 28, 252–260. [Google Scholar]
- Li, Z.; Liu, W.Z.; Zheng, F.L.; Hu, H.C. The impacts of climate change and human activities on river flow in the Loess Tableland of China. Acta Ecol. Sin. 2010, 30, 2379–2386. [Google Scholar]
- Hu, X.L. Analysis on Runoff Variation Regularity and Regional Water Resources Optimum Allocation in the Heihe River Basin. Hydrology 2003, 23, 32–37. [Google Scholar]
- Wang, J.; Meng, J.J. Research on runoff variations based on wavelet analysis and wavelet neural network model: A case study of the Heihe River drainage basin (1944–2005). J. Geogr. Sci. 2007, 3, 327–338. [Google Scholar] [CrossRef]
- He, X.Q.; Zhang, B.; Sun, L.W.; Jin, S.L.; Zhao, Y.F.; An, M.L. Contribution rates of climate change and human activity on the runoff in upper and middle reaches of Heihe River basin. Chinese J. Ecol. 2012, 31, 2884–2890. [Google Scholar]
- Sang, Y.F.; Wang, Z.G.; Liu, C.M.; Yu, J. The impact of changing environments on the runoff regimes of the arid Heihe River basin, China. Theor. Appl. Climatol. 2014, 115, 187–195. [Google Scholar] [CrossRef]
- Wang, G.; Liu, J.; Kubota, J.; Ma, X. Effects of land-use changes on hydrological processes in the middle basin of the Heihe River, northwest China. Hydrol. Process. 2007, 21, 1370–1382. [Google Scholar] [CrossRef]
- Zhang, X.; Xiong, Z.; Tang, Q. Modeled effects of irrigation on surface climate in the Heihe River Basin, Northwest China. J. Geophys. Res. Atmos. 2017, 122, 7881–7895. [Google Scholar] [CrossRef]
- Zhao, N.; Zeng, X.F.; Liu, H. Response of runoff to climate change in Heihe River Basin based on HBV model. Yangtze River 2018, 49, 34–38. [Google Scholar]
- He, R.; Pang, B.; Zhang, L.Y.; Shi, R. Uncertainty analysis of VIC model on GLUE method. J. Beijing Normal Univ. (Nat. Sci.) 2015, 50, 576–580. [Google Scholar]
- Wang, Z.G.; Liu, C.M.; Huang, Y.B. The Theory of SWAT Model and its Application in Heihe Basin. Prog. Geog. 2003, 22, 79–86. [Google Scholar]
- Huang, Q.H.; Zhang, W.C. Improvement and Application of GIS-based distributed SWAT Hydrological Modeling on High Altitude, Cold, Semi-arid Catchment of Heihe River Basin, China. J. Nanjing Normal Univ. (Nat. Sci.) 2004, 28, 21–26. [Google Scholar]
- Ruan, H.W.; Zou, S.B.; Lu, Z.X.; Yang, D.W.; Xiong, Z. Coupling SWAT and RIEMS to simulate mountainous runoff in the upper reaches of the Heihe River basin. J. Glaciol. Geocryol. 2017, 4, 384–394. [Google Scholar]
- Meng, X.Y.; Shi, C.X.; Liu, S.Y.; Lei, X.H.; Liu, Z.H.; Ji, X.N. CMADS Datasets and Its Application in Watershed Hydrological Simulation: A Case Study of the Heihe River Basin. Pearl River 2016, 37, 1–19. [Google Scholar]
- Zhang, L.; Nan, Z.T.; Xu, Y. Hydrological Impacts of Land Use Changeand Climate Variability in the Headwater Region of the Heihe River Basin, Northwest China. PLOS ONE 2016, 11. [Google Scholar] [CrossRef]
- Luo, K.S.; Tao, F.L.; Deng, X.Z.; Moiwo, J.P. Changes in potential evapotranspiration and surface runoff in1981–2010 and the driving factors in Upper Heihe River Basin in Northwest China. Hydrol. Process. 2017, 31, 90–103. [Google Scholar] [CrossRef]
- Lu, Z.Y.; Xiao, H.L.; Wei, Y.P.; Zou, S.B.; Ren, J. Advances in the study on the human-water-ecology evolution in the past two thousand years in Heihe River Basin. Adv. Earth Sci. 2015, 30, 396–406. [Google Scholar]
- Jiang, X.H.; Liu, C.M. The influence of water regulation on vegetation in the lower Heihe River. Geogr. Sci. 2010, 20, 701–711. [Google Scholar] [CrossRef]
- Liu, X.L.; Dong, G.T.; Zhao, M.J.; Jiang, X.H.; Fan, Z.J.; Yin, H.J.; Guo, X.W. Evaluation of the Heihe River Water Diversion Scheme Adaptability. Yellow River 2017, 39, 65–69. [Google Scholar]
- Cheng, J.Z.; Lu, Z.X.; Zou, S.B.; Yin, Z.L. Variation of the runoff in the upper and middle reaches of the main Heihe River and its causes. J. Glaciol. Geocryol. 2017, 39, 123–129. [Google Scholar]
- Li, B.; Li, C.Y.; Liu, J.Y.; Hu, S. Decreased streamflow in the Yellow River Basin, China: Climate change or human-induced? Water 2017, 9, 116. [Google Scholar] [CrossRef]
- Wang, S.J.; Yan, Y.X.; Yan, M. Contributions of precipitation and human activities to the runoff change of the Huangfuchuan drainage basin: Application of comparative method of the slope changing ratio of cumulative quantity. Acta Geog. Sin. 2012, 67, 388–397. [Google Scholar]
- Dang, S.Z.; Liu, C.M.; Wang, Z.G.; Wu, M.Y. Analyses on Temporal Variations of Snowmelt Runoff Time in the Upper Reaches of Heihe River and Its Climate Causes. J. Glaciol. Geocryol. 2013, 34, 920–926. [Google Scholar]
- Bai, L.M.; Hou, H.Y.; Yang, L.F. Analysis on change trend of runoff in Yingluoxia station of Heihe River. Yellow River 2013, 35, 23–25. [Google Scholar]
- Zhang, X.F. Climate change and its driving effect on the runoff in the Heihe basin. Resour. Environ. Yangtze Basin 2014, 23, 542–548. [Google Scholar]
- Cao, H.; Huang, Q.; Chang, J.X. Analysis on variation characteristics on the runoff series of the Heihe River. J. Water Resour. Water Eng. 2008, 19, 69–72. [Google Scholar]
- Sun, Y.Y.; Mu, X.M.; Gao, P. Temporal Change in Runoff in the Upper and Middle Reaches of Yellow River. Res. Soil Water Conser. 2017, 24, 59–64. [Google Scholar]
- Mo, G.Y. Runoff Response to the Climate and Land Use Change in the Longtan Basin; Guangxi University: Nanning, China, 2017; pp. 23–25. [Google Scholar]
- Yang, L.S.; Feng, Q.; Yin, Z.L.; Wen, X.H.; Si, J.H.; Deo, R.C. Identifying separate impacts of climate and land use/cover change on hydrological processes in upper stream of Heihe River, Northwest China. Hydrol. Process. 2017, 31, 1100–1112. [Google Scholar] [CrossRef]
- Luo, Y.; Sophocleous, M. Two-way coupling of unsaturated-saturated flow by integrating the SWAT and MODFLOW models with application in an irrigation district in arid region of West China. J. Arid Land 2011, 3, 164–173. [Google Scholar] [CrossRef]
- Yu, W.J.; Nan, Z.T.; Zhao, Y.B.; Li, S. Improvement of snowmelt implementation in the SWAT hydrologic model. Acta Ecol. Sin. 2013, 33, 6992–7001. [Google Scholar]
- Ficklin, D.L.; Barnhart, B.L. SWAT hydrologic model parameter uncertainty and its implications for hydro-climatic projections in snowmelt-dependent watersheds. J. Hydrol. 2014, 519, 2081–2090. [Google Scholar] [CrossRef]
- Van Liew, M.W.; Garbrecht, J. Hydrologic simulation of the Little Washita River experimental watershed using SWAT. J. Am. Water Resour. Assoc. 2003, 39, 413–426. [Google Scholar] [CrossRef]
- Meng, F.H.; Liu, T.; Huang, Y.; Luo, M.; Bao, A.M.; Hou, D.W. Quantitative detection and attribution of runoff variations in the Aksu River Basin. Water 2016, 8, 338. [Google Scholar] [CrossRef]
Figure 1.
Upper reaches of the Heihe River Basin.

Figure 2.
(a) Distribution of land use/cover types; (b) Distribution of soil types.

Figure 3.
Calibration and validation results of SWAT model for monthly streamflow.

Figure 4.
Trend analysis of runoff at Yingluoxia station.

Figure 5.
(a) Change trends of the M-K test; (b) Cumulative anomaly of the annual runoff in Yingluoxia station.
Figure 5.
(a) Change trends of the M-K test; (b) Cumulative anomaly of the annual runoff in Yingluoxia station.

Figure 6.
The precipitation-runoff DMC.

Figure 7.
The correlation analysis between precipitation and runoff.

Figure 8.
Distribution of land use types under different simulation scenarios. (a) Natural growth scenario in 2020, (b) Natural growth scenario in 2030, (c) Ecological protection scenario in 2020, (d) Ecological protection scenario in 2030, (e) Economic development scenario in 2020, (f) Economic development scenario in 2030.


Table 1.
Land use/cover type.
| Land Use Type | Land Use Secondary Classification | SWAT Code |
|---|---|---|
| urban construction land | urban resident land, rural resident land | URLD |
| forestland | forestland, shrub land, woodland, other woodland | FRST |
| grassland | high-covered grassland, medium-covered grassland, and low-covered grassland | HAY |
| water area | lakes, swamps, glacial snow, canals, beaches | WATR |
| unused land | sand, Gobi, swamp, bare rock | BALD |
| arable land | mountain drylands, plain dryland | AGRL |
Table 2.
Meteorological station information.
| Station Name | Longitude/° | Latitude/° | Elevation/m |
|---|---|---|---|
| Tuole station | 98.42 | 38.8 | 3367 |
| Yeniugou station | 99.58 | 38.42 | 3320 |
| Qilian station | 100.25 | 38.18 | 2787.4 |
| Zhangye station | 100.43 | 38.93 | 1482.7 |
Table 3.
Hydrological station information.
| Station Name | Longitude/° | Latitude/° | Elevation/m |
|---|---|---|---|
| Yingluoxia station | 100.18 | 38.82 | 1700 |
Table 4.
Scenarios for quantitative attribution analysis.
| Scenarios | Land Use/Cover Data | Meteorological Data |
|---|---|---|
| 1 | 1980s | 1980–2003 |
| 2 | 1980s | 2004–2008 |
| 3 | 2000s | 1980–2003 |
| 4 | 2000s | 2004–2008 |
Table 5.
Parameter sensitivity analysis.
| Parameter | Sensitive | Value Range | Fitted Value |
|---|---|---|---|
| CN2.mgt | 2 | (35,98) | 29.532 |
| Ch_K2.ret | 5 | (−0.01,500) | 21.402 |
| Ch_N2.ret | 12 | (0,0.2) | 0.098 |
| ESCO.hru | 1 | (0,1) | 0.815 |
| EPCO.hru | 14 | (0,1) | 0.188 |
| CANMX.hru | 10 | (0,100) | 6.634 |
| SOL_Z.sol | 4 | (0,3500) | 0.187 |
| SOL_K.sol | 6 | (0,2000) | −0.248 |
| SOL_AWC.sol | 3 | (0,1) | 0.358 |
| GWQMN.gw | 8 | (0,5000) | 3398.502 |
| GW_Delay.gw | 13 | (0,500) | 17,795 |
| REVAPMN.gw | 11 | (0,500) | 0.225 |
| GW_REVAP.gw | 7 | (0.02,0.2) | 0.02 |
| ALPHA_BF.gw | 9 | (0,1) | 0.008 |
CN2: Moisture condition SCS curve number; Ch_K2: River effective water transfer coefficient; Ch_N2: Manning’s “n” value for the main channel; ECSO: Soil evaporation compensation factor; EPCO: Plant transpiration compensation coefficient; CANMX: Maximum canopy storage; SOL_Z: Depth from soil surface to bottom of layer; SOL_K: Saturated hydraulic conductivity; SOL_AWC: Available water capacity of the soil layer; GWQMN: Threshold water level in shallow aquifer for base flow; GW_Delay: Groundwater delay coefficient; REVAPMN: Threshold water level in in shallow aquifer for “revap”; GW_REVAP: Groundwater “revap” coefficient; ALPHA_BF: Baseflow recession constant.
Table 6.
Calibration and validation results of SWAT model for monthly streamflow.
| Period | Measured Average m3/s | Simulated Average m3/s | Nash-Suttcliffe | R2 |
|---|---|---|---|---|
| 1985–1998 | 51.65 | 58.52 | 0.65 | 0.75 |
| 1999–2008 | 66.08 | 57.62 | 0.63 | 0.71 |
Table 7.
Simulated response of human activities and climate change in Heihe River Basin.
| Time Interval | Period | Simulated Annual Runoff m3/s | Total Increase m3/s | Effect of Human Activities on Runoff | Effect of Climate Change on Runoff | ||
|---|---|---|---|---|---|---|---|
| Reference period | 1980–2003 | 622.67 | —— | —— | —— | —— | —— |
| Interference period | 2004–2008 | 710.9 | 88.23 | Increase m3/s | Proportion | Increase m3/s | Proportion |
| 11.34 | 12.85% | 76.89 | 87.15% | ||||
Table 8.
Relative variation of mean annual runoff for different scenarios/%.
| Temperature | Precipitation | ||||
|---|---|---|---|---|---|
| −20% | −10% | 0 | +10% | +20% | |
| −2 °C | −11.87 | −4.45 | 17.39 | 23.21 | 38.65 |
| −1.5 °C | −15.85 | −6.76 | 13.13 | 18.86 | 32.97 |
| −1 °C | −20.69 | −7.70 | 9.11 | 11.24 | 21.75 |
| −0.5 °C | −22.45 | −15.33 | 4.35 | 8.96 | 16.50 |
| 0 | −30.63 | −20.85 | 0 | 7.45 | 14.69 |
| +0.5 °C | −21.35 | −9.64 | 9.2 | 10.52 | 22.49 |
| +1 °C | −23.44 | −12.17 | 6.29 | 12.48 | 25.86 |
| +1.5 °C | −23.96 | −12.96 | 5.36 | 16.63 | 26.52 |
| +2 °C | −25.79 | −15.59 | 4.43 | 18.72 | 30.03 |
Table 9.
Response of runoff to temperature reduction and precipitation increase.
| Temperature Change | Precipitation Change | ||
|---|---|---|---|
| 0 | 7.45 | 14.69 | |
| 4.35 | 8.96 | 16.50 | |
| 9.11 | 11.24 | 21.75 | |
| 13.13 | 18.86 | 32.97 | |
| 17.39 | 23.21 | 38.65 | |
Table 10.
Response of runoff to simultaneous increase in temperature and precipitation.
| Temperature Change | Precipitation Change | ||
|---|---|---|---|
| 0 | 7.45 | 14.69 | |
| 9.2 | 10.52 | 22.49 | |
| 6.29 | 12.48 | 25.86 | |
| 5.36 | 16.63 | 26.52 | |
| 4.43 | 18.72 | 30.03 | |
Table 11.
Response of runoff to simultaneous decrease in temperature and precipitation.
| Temperature Change | Precipitation Change | ||
|---|---|---|---|
| −30.63 | −20.85 | 0 | |
| −22.45 | −15.33 | 4.35 | |
| −20.69 | −7.70 | 9.11 | |
| −15.85 | −6.76 | 13.13 | |
| −11.87 | −4.45 | 17.39 | |
Table 12.
Response of runoff to temperature increase and precipitation decrease.
| Temperature Change | Precipitation Change | ||
|---|---|---|---|
| −20.69 | −7.70 | 0 | |
| −21.35 | −9.64 | 9.2 | |
| −23.44 | −12.17 | 6.29 | |
| −23.96 | −12.96 | 5.36 | |
| −25.79 | −15.59 | 4.43 | |
Table 13.
Area ratio of different land use scenarios.
| Type of Landuse | Natural Growth Scenario | Ecological Protection Scenario | Economic Development | |||
|---|---|---|---|---|---|---|
| 2020 | 2030 | 2020 | 2030 | 2020 | 2030 | |
| AGRL | 12.009% | 12.569% | 11.565% | 11.778% | 12.889% | 13.764% |
| FRST | 12.930% | 12.786% | 13.060% | 13.102% | 12.680% | 12.413% |
| HAY | 35.344% | 34.824% | 35.753% | 35.848% | 34.533% | 33.728% |
| WATR | 2.295% | 2.294% | 2.294% | 2.293% | 2.290% | 2.290% |
| URLD | 0.983% | 0.986% | 0.959% | 0.972% | 1.037% | 1.091% |
| BALD | 36.439% | 36.541% | 36.369% | 36.007% | 36.570% | 36.714% |
Table 14.
Change of runoff under land use/cover scenarios.
| Land Use/Cover Change Scenarios | Change Rate of Runoff | |
|---|---|---|
| 2020 | (a) | 0.27% |
| (c) | 0.34% | |
| (e) | −0.10% | |
| 2030 | (b) | 1.57% |
| (d) | 3.74% | |
| (f) | −0.22% |
© 2019 by the authors. Licensee MDPI, Basel, Switzerland. This article is an open access article distributed under the terms and conditions of the Creative Commons Attribution (CC BY) license (http://creativecommons.org/licenses/by/4.0/).
Share and Cite
MDPI and ACS Style
Shang, X.; Jiang, X.; Jia, R.; Wei, C. Land Use and Climate Change Effects on Surface Runoff Variations in the Upper Heihe River Basin. Water 2019, 11, 344. https://doi.org/10.3390/w11020344
AMA Style
Shang X, Jiang X, Jia R, Wei C. Land Use and Climate Change Effects on Surface Runoff Variations in the Upper Heihe River Basin. Water. 2019; 11(2):344. https://doi.org/10.3390/w11020344
Chicago/Turabian StyleShang, Xingxing, Xiaohui Jiang, Ruining Jia, and Chen Wei. 2019. "Land Use and Climate Change Effects on Surface Runoff Variations in the Upper Heihe River Basin" Water 11, no. 2: 344. https://doi.org/10.3390/w11020344
Note that from the first issue of 2016, this journal uses article numbers instead of page numbers. See further details here.