Estimating the Wind-Generated Wave Erosivity Potential: The Case of the Itumbiara Dam Reservoir
by
 and
and
Ricardo Moreira Vilhena
1, 
Márcia Maria dos Anjos Mascarenha
2,
Maurício Martines Sales
2,
Patrícia de Araújo Romão
3 and
Marta Pereira da Luz
4,* 1
Geotechnics Postgraduate Program PPG-GECON, Federal University of Goiás, Eletrobras Furnas, BR153, km 510, Zona Rural, Aparecida de Goiânia CEP 74923-650, Goiás, Brazil
2
School of Civil and Environmental Engineering, Federal University of Goiás, Universitária Ave. 1488, Setor Universitário, Goiânia CEP 74605-220, Goiás, Brazil
3
Institute of Socio-environmental Studies of the Federal University of Goiás, Esperança Ave., Samambaia Campus, Goiânia CEP 74690-900, Goiás, Brazil
4
Eletrobras Furnas, Industrial and Systems Engineering Postgraduate Program-MEPROS, Pontifical Catholic University of Goiás, BR153, km 510, Zona Rural, Aparecida de Goiânia CEP 74923-650, Goiás, Brazil
*
Author to whom correspondence should be addressed.
Water 2019, 11(2), 342; https://doi.org/10.3390/w11020342
Submission received: 30 December 2018
/
Revised: 21 January 2019
/
Accepted: 14 February 2019
/
Published: 18 February 2019
(This article belongs to the Section Water Resources Management, Policy and Governance)
Abstract
:The impact of wind waves is a process that affect reservoir shorelines, causing economic and environmental damage. The objective of this paper is to analyze the erosive potential of waves generated by winds at the shoreline of a large tropical reservoir of the Itumbiara Dam that stands along the Paranaiba River in the Midwest of Brazil. A GIS-based analysis was carried out using a wave fetch model tool (WAVE) developed by the US Geological Survey with wind data from a Doppler sensor (SODAR—SOnic Detection and Ranging) and an ultrasonic anemometer. A wave erosivity potential map was generated combining 16 fetch rasters from every 22.5° wind directions and was weighted according to its corresponding wind frequency over the rainy season. This result showed the critical areas which may have a high wave potential to increase sediment detachment along the reservoir shoreline. Finally, some of these high erosivity potential areas coincide with large erosions sites, which are detected by satellite imagery. This technique was capable of identifying the wave potential which can cause shoreline erosions and also contribute to reservoir management and support future works, including field experimental programs and shoreline erosion treatments.
1. Introduction
Dam reservoirs are responsible for changes in the hydrodynamic characteristics of their ecosystems by increasing the erosive processes on the shorelines. In addition, there is a direct correlation between these factors and long-term reservoir deposition [1]. Erosive processes that affect the shoreline of dam reservoirs are related to the susceptibility of different shoreline erosion sources such as wave action [2] and surface runoff [3]. Rainfall is the main source of shoreline erosion, which is represented by sheet and rill erosions, as well as wave action generated by the wind or wakes of boats. Another type of natural force acting in reservoirs is the gravity force causing slumping and soil creep. The geotechnical properties, characteristics and dynamics of the shore material (i.e., the soil or rock) make the comprehension of shoreline erosion more complex due to the interactions between the geology, topography and climate [4,5,6].
Sedimentation is a global issue that comes from natural and man-made erosions that influence the strategies of water managers to resolve economic and environmental problems [7,8,9,10,11,12,13,14]. This problem causes a reduction of the effective reservoir storage capacity, decreases the effective lifespan of dams and lessens various reservoir functionalities [8]. Many researchers studied the effects of erosion by rainfall [15,16,17,18,19] and waves [2,20,21,22] to predict or examine sediment yield in reservoir.
Wave energy is the most important parameter in predicting erosion rates of water bodies and is influenced by the wave height, speed and frequency of the wind [23,24]. Furthermore, the effects of wave erosivity depend on several factors, such as the wind direction and speed at the shoreline and vegetation cover, as well as geometric characteristics of the shoreline profile (e.g., the shape, size and slope). Also, the physical and chemical properties of the soil [25], through wet-dry cycles, contributes to the intensity of its degradation. However, wave energy mensuration requires wind data, bathymetry data and offshore/onshore measurement systems, which are not always available for consultation.
The wind erosion agents can be analyzed from a low-cost perspective using a geographic information system (GIS) or a combination of geospatial model tools supported by remote sensing. Some authors applied geospatial analysis and numerical models to estimate the erosive potential of wind-generated waves in natural lakes, reservoirs and estuaries: Mattosinho [26] and Sandford and Gao [23] used SWAN (Simulating Waves Nearshore); Kaliraj et al. [27] and Bheeroo et al. [28] used DSAS (Digital Shoreline Analysis System); Olson and Ventura [29] used the WAVES tool; and OndisCAD was applied by Hernández [30].
Larger lakes usually provide longer distances of open water, producing wind-generated waves with higher wave heights across a body of water, resulting in high energy waves along the shoreline, causing erosion and environmental problems. This concept is called fetch, the distance the wind travels over water in a constant direction. In lakes (i.e., inland water), the fetch is smaller than on the coast (i.e., open water) because ocean waves have more energy and longer distances to grow. The geometry of man-made reservoirs also contributes to small fetches because they are more irregular and often present dendritic forms.
GIS techniques provide an important platform that can assist inreservoir management for the monitoring of dam reservoirs [9,20]. The WAVES tool (v.2012) has proven to be able to provide reliable results in the study of shoreline erosion in a large inland lake [29]. This tool was developed by Finlayson [20] on behalf of the U. S. Geological Survey (USGS) to estimate the erosive potential of waves from the measurements of wind and geospatial correlations. In this study, this numerical approach overestimated the erosion of the lake shoreline, but the final result was adequate to identify potential areas for erosive processes by waves. The WAVES tool also allows the elaboration of wind fetch and wave models. In addition, the bathymetry of the reservoir is not necessary to estimate the wave potential. This geospatial tool calculates effective fetches using the recommended procedure of the Shore Protection Manual (SPM) [20].
The analysis of wind fetch with a geospatial tool allows the identification of the buffer strip of a reservoir affected by the wave impact, thus helping to make better decisions regarding the monitoring and intervention in shorelines, as well as the definition of the local sites that will probably require shoreline erosion treatment and assist in laboratory tests, including erodibility tests (i.e., wave flume tests).
Therefore, the objectives of this study are (i) to investigate the erosive potential of wind-generated waves using a GIS fetch model tool applied to an inland lake, (ii) compare wind data from two different anemometer devices, and (iii) determine the wave erosivity potential due to the action of local winds on the shoreline of the Itumbiara Dam reservoir.
2. Materials and Methods
2.1. Study Area
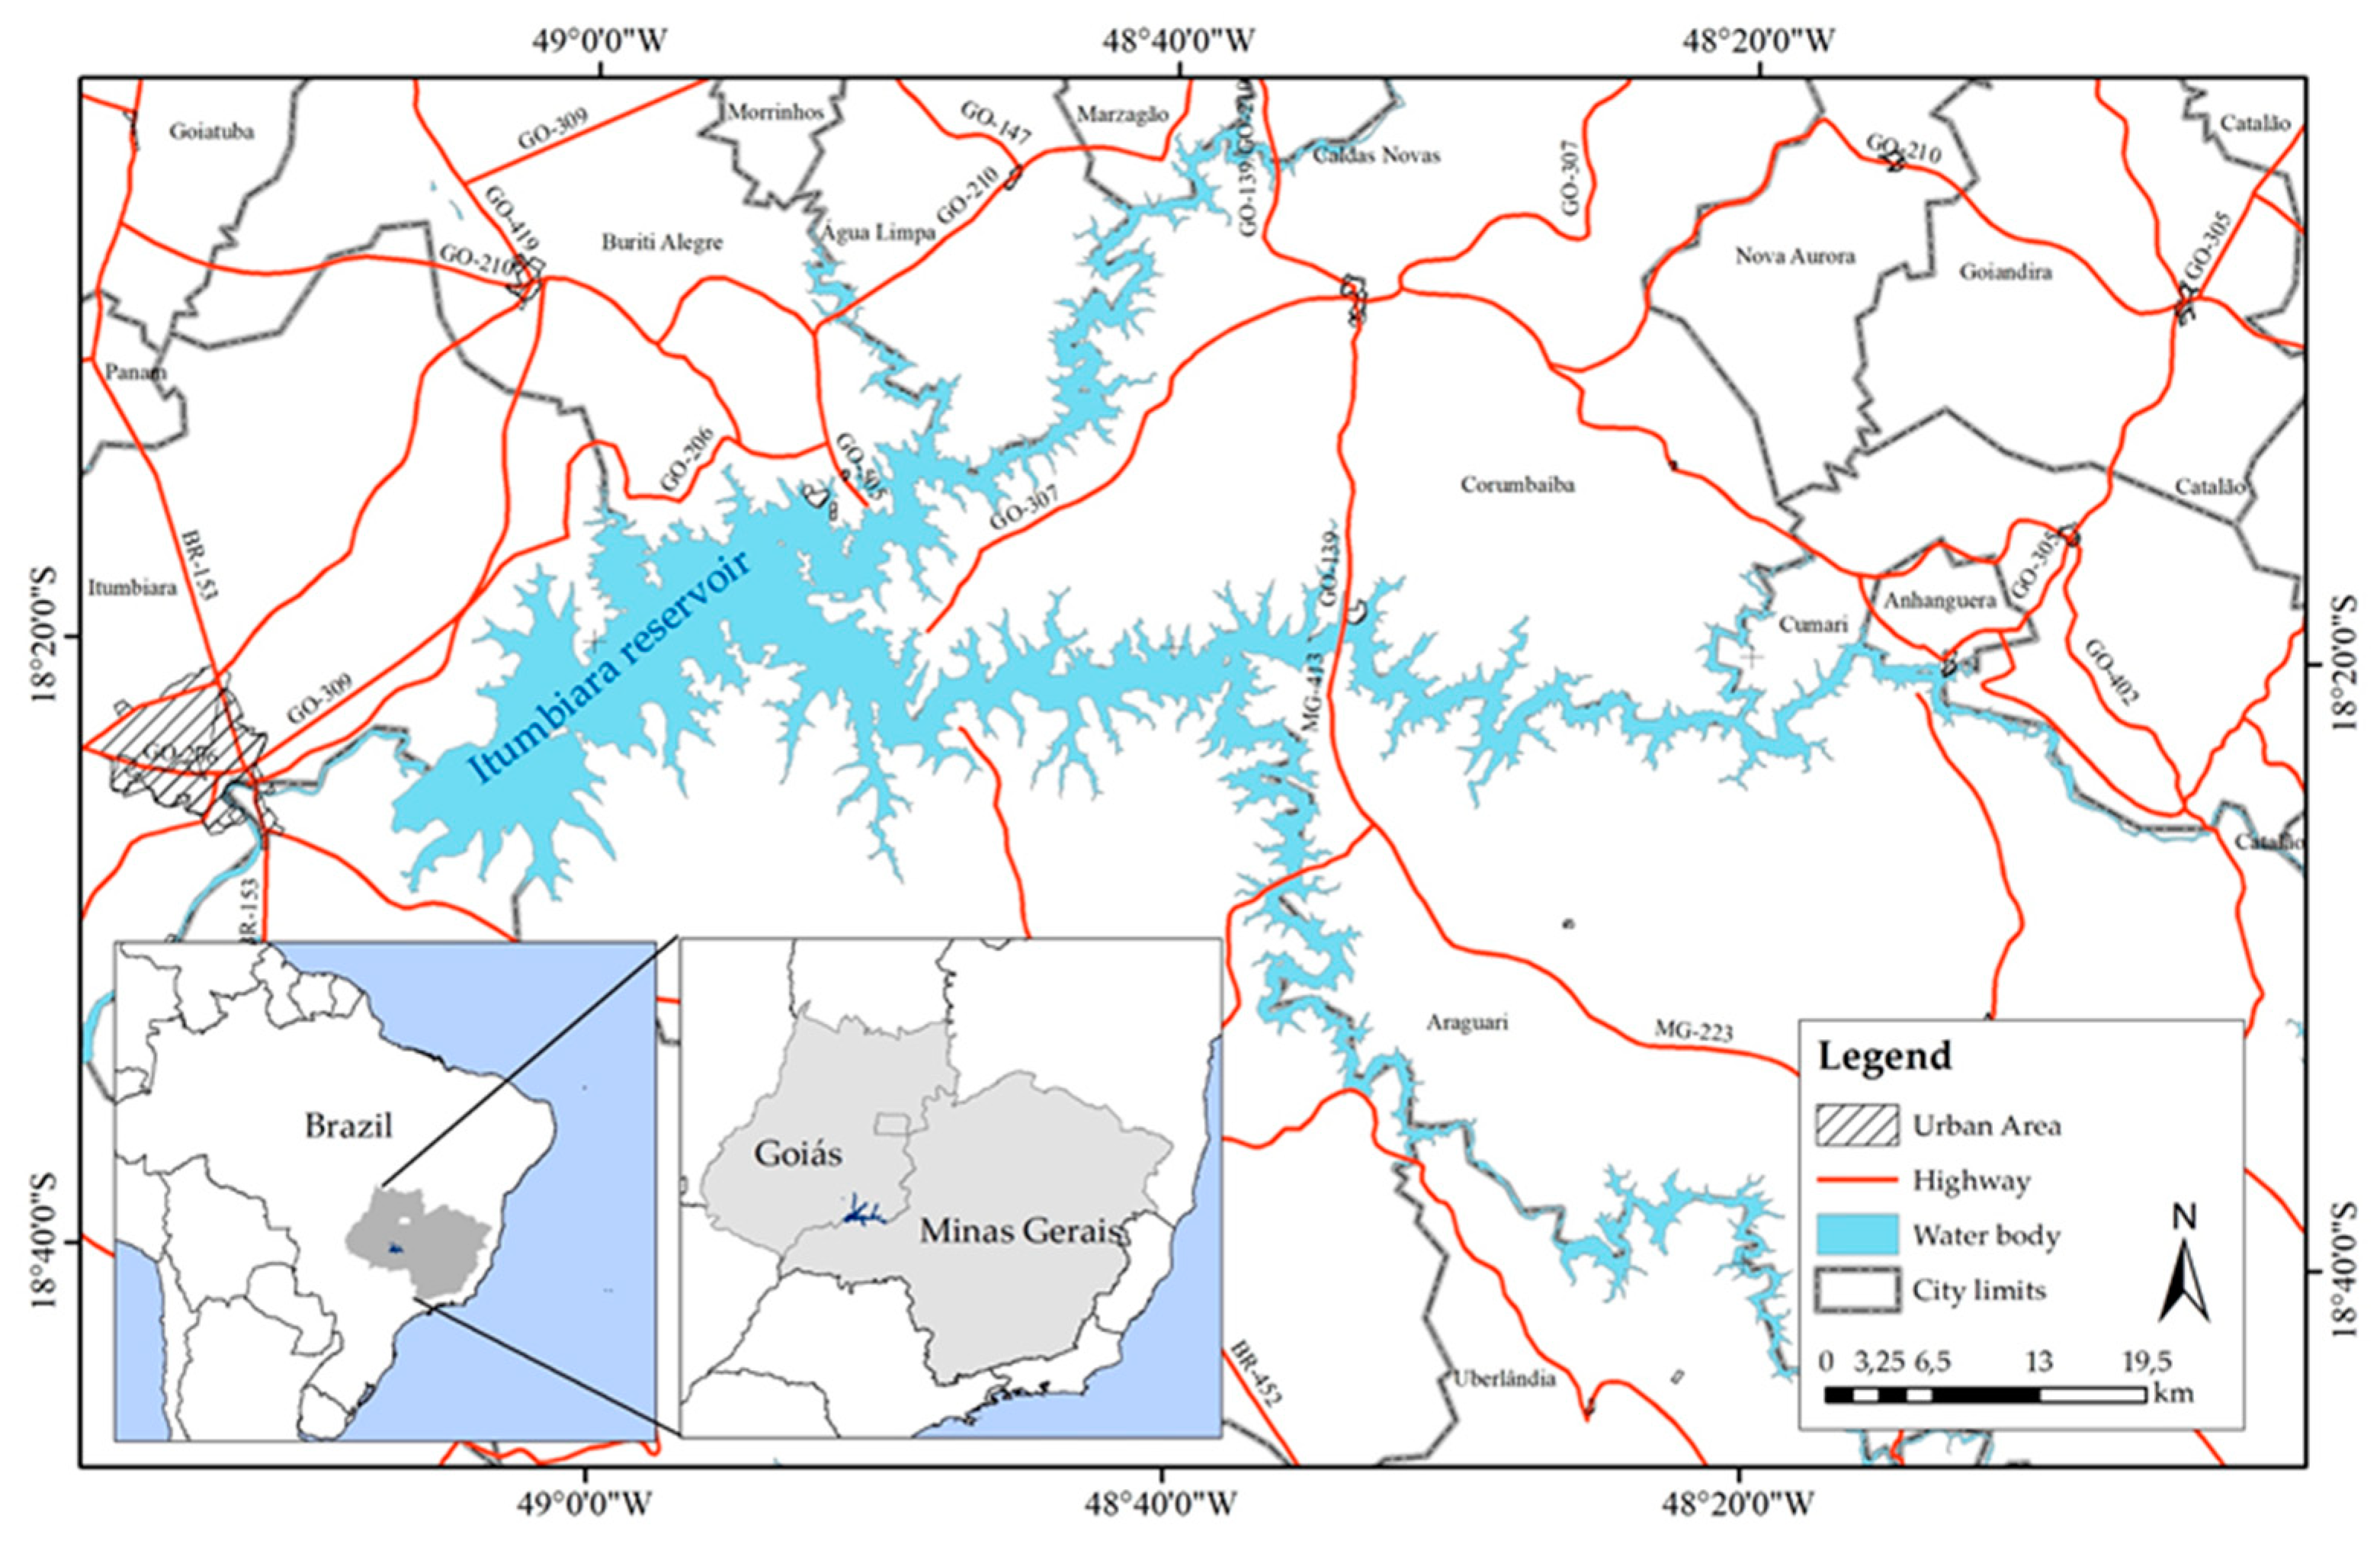
The study area covers the large tropical reservoir of the Itumbiara Dam (with a water surface area of 778 km²), a South American earth-filled dam that is located between two Brazilian cities, Itumbiara-GO and Araporã-MG (Figure 1), standing along the Paranaíba River. This embankment dam lies between latitude 18°24’27" S and longitude 49°5’53" W and is the 14th largest hydroelectric power plant reservoir in a water surface area and 12th in installed capacity (i.e., 2082 MW) [31] in Brazil.
The bedrock geology of the Itumbiara Dam reservoir includes metamorphic rocks of pre-Cambrian age (older than 570 Ma) lying beneath the volcanic flood basalts of the Serra Geral Formation. These rocks underwent intense tectonism, identified by various regional structural lineaments. The lithological sequences of metamorphic rocks, from the base to the top of the bedrock, are amphibole-gneiss, biotite-gneiss, amphibolite, muscovite-gneiss, and quartzites. Furthermore, the soil of this region is a detrital laterite cover of quaternary age (1.6 Ma). Based on the geotechnical soil classification, the residual soils and colluvium are normally deposited on the land surface and the alluvium on the riverbeds [32].
According to the soil taxonomy, the soil orders found in the study area are inceptisols, oxisols and entisols (or cambisols, ferralsols and leptosols in the FAO/WRB soil system). They are related to the weathering process of soil formation from an intensely schistous metamorphic rock that shows a high erodibility potential for shoreline erosion [33]. Geomorphic features can also be observed along the shore, from nearly flat to gently lakeward-sloping (5°–10°) platforms; this condition allows for higher sheet flows producing an increase in hillslope evolution. Locally, the shore zone is more predisposed to the sheet than to rill erosion [34] and the action of wave erosion.
2.2. Wave Erosivity Potential
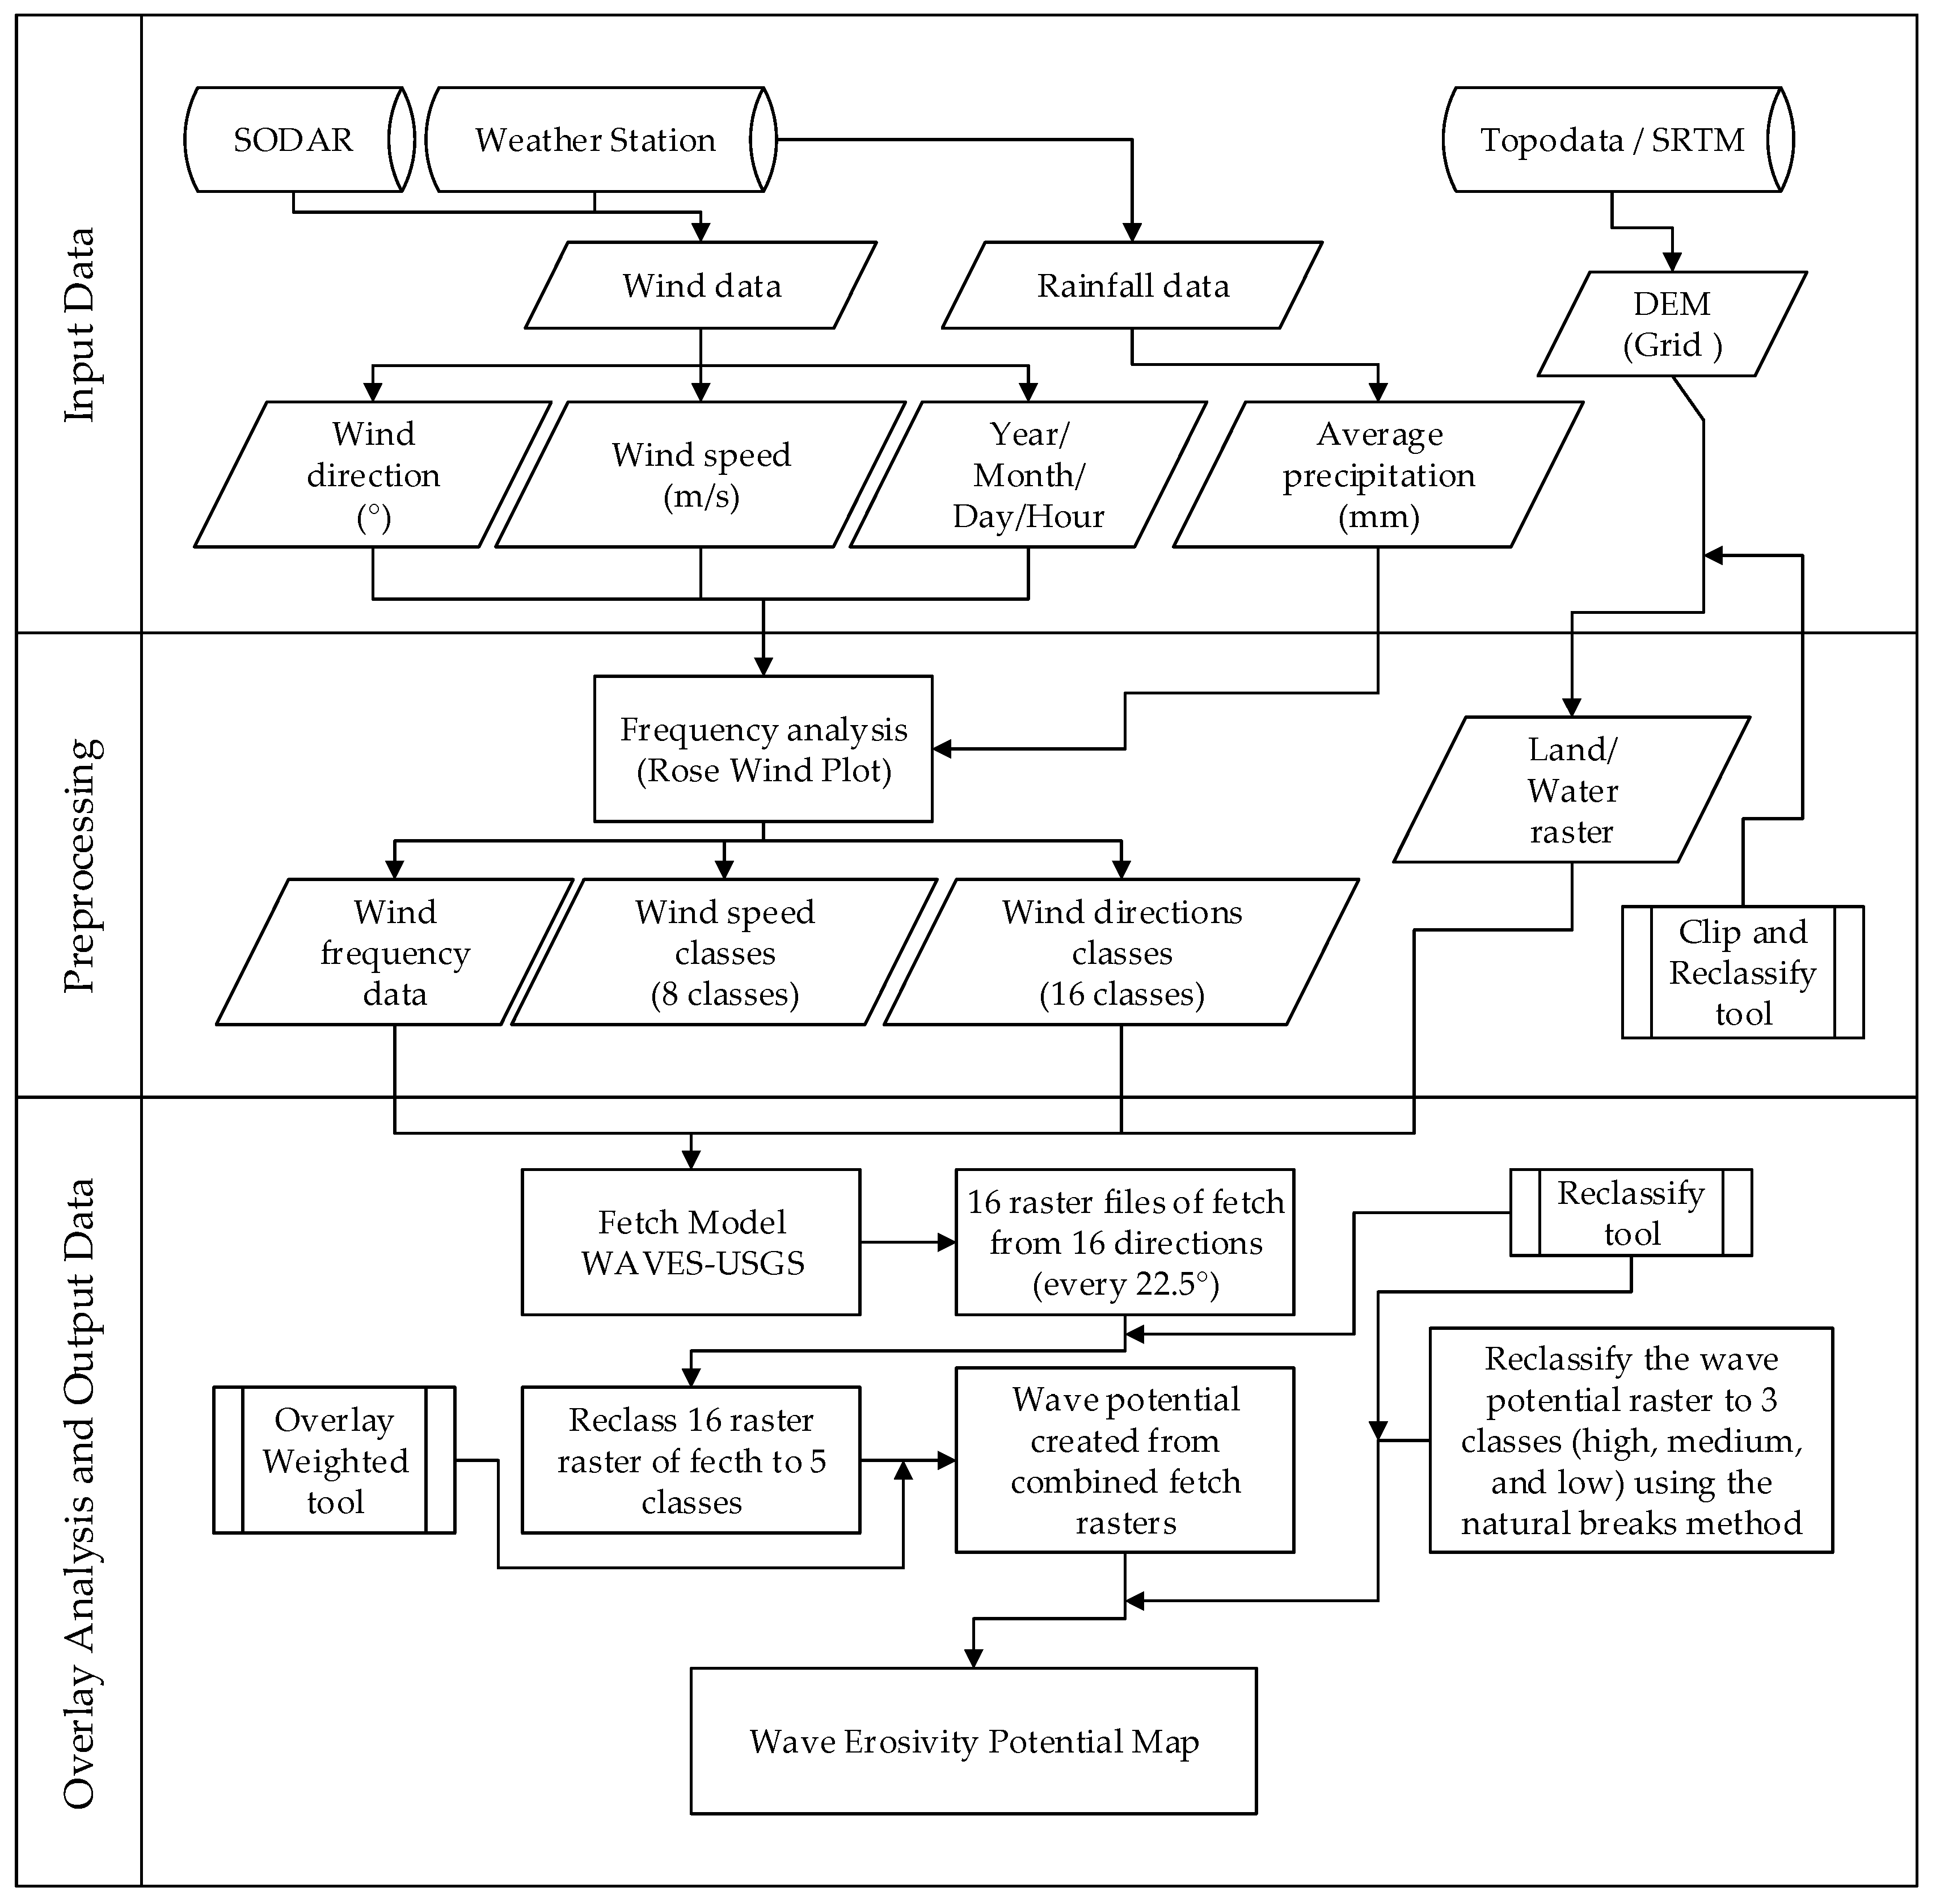
The shoreline erosive potential was evaluated based on the previous work of Olson and Ventura [29] that used a wave fetch model to estimate the wave potential generate by wind. This GIS-based model produces a wave potential raster of the combined effects of the fetch and wind data on inland lake shores. The wind data had several wind direction frequencies of occurrence that were weighted to produce a fetch raster. The wave potential of the Itumbiara Dam reservoir was obtained following three main procedures, as follows: input data, preprocessing and geospatial analyses (overlay analysis and output data). Input data includes wind data from two different anemometers, precipitation data, and the land raster. Preprocessing involves the statistical analysis of the wind behavior and suitability of the digital terrain model. All the geospatial data were analyzed using the geoprocessing tools in ArcGIS 10.3 (v.10.3, ESRI, Redlands, CA, USA). Finally, the overlay analysis and output of data used tools in a GIS platform to elaborate the final model of wave erosivity. Figure 2 shows the flowchart of the main procedures of this study that determined the Shoreline Erosivity Potential map.
The determination wave erosivity from actual wave energy is a complex analysis that requires several input parameters, such as soil properties, shoreline geomorphology and wave characteristics (e.g. wave height, wave length, shallow, and deep-water effects). The wind-fetch model of WAVES tool ignores nearshore processes and does not consider deep water effects. This study focused on estimating wave erosive potential from the wind fetch model and qualitative analysis of the local natural characteristics (geology and geomorphology), allied with satellite imagery.
2.2.1. Input Data
Wind speed and direction measurements were used in different systems as follows: an acoustic Doppler sensor, also called a SODAR (SOnic Detection And Ranging) sensor and an ultrasonic anemometer, installed at a height of 10 meters on a meteorological tower (i.e., a weather station). The acoustic sensor performs readings every 10 minutes at various heights: 40, 50, 60, 80, 100, 120, 140, 160, 180, and 200 m. The ultrasonic device measures the wind every hour only at a height of 10 m. Both sensors were installed in different locations of the Itumbiara Dam. Furthermore, the wind data were acquired from 23 September 2014 to 23 December 2015 to coincide with the time period in which SODAR remained in that area.
The meteorological tower is located downstream of the dam, lying between latitude 18°24’27.67" S and 49°06’37.1" W longitude, and the SODAR sensor remained on the left abutment of the embankment of the Itumbiara Dam for 1 year after the removal of the tower. The SODAR sensor was located at the geographic coordinates of 18°25’38" S latitude and 49°07’06” W longitude.
The SODAR sensor is an acoustic sensor (i.e., Doppler), classified as a remote sensing system capable of measuring wind characteristics at different heights (40–200 m) without the need to install an active sensor at each reading point [35]. The models used in this research are a sonic wind profiler, Triton, and ultrasonic wind sensor, WS425, both from manufacturer Vaisala. This study does not have the aim of addressing the acquisition techniques and data accuracy between the SODAR sensor and the meteorological tower. A comparison was made to evaluate the influence of the dam barrier on the meteorological tower.
Both wind datasets must be analyzed at the same height to compare the results; also, the fetch model from WAVES tool only considers a wind data at 10-meter elevation measurements to calculate wave potential. The wind speeds from the SODAR sensor, from a reference height of 40 m (zr), were converted to a height of 10 m (z) using the equation of the wind energy profile or power-law profile, as presented in Equation (1) [35]. Furthermore, the SODAR wind data measurements were modified from the minutes format to the hours format. The vectors (the direction and intensity of the wind) were defined as a classic arithmetic measure, preserving itself as an original measure.
The power law is a mathematical relationship for the vertical wind speed profile, which can be expressed as follows:
where U(z) is the wind speed at height z, U(zr) is the reference wind speed at height zr, and α is the power law exponent.
The power law exponent is dependent on many parameters. However, for a theoretical reservoir surface model, a value equal to 1/7 (0.143) was defined because this ratio indicates the correspondence between wind profiles and flow over flat plates [35].
Wind data were organized into spreadsheets that necessarily include the following information: the year, month, hour, wind direction (°) and wind speed (m/s). In addition, rainfall values in millimeters were also included in the wind data spreadsheets. It was possible to divide the analysis of the winds for the dry and rainy periods, in addition to a more comprehensive climatological analysis.
The Fetch model function of the WAVES tool features the following input data: the wind direction, wind frequency, and land raster (i.e., the digital elevation model (DEM)). The land raster contains information on both terrain surfaces on the shoreline and the water mass of the reservoir. A raster image is defined as a dot matrix data structure that represents a rectangular grid of pixels with a certain value, and each pixel has a vertical elevation value (i.e., altitude). The land raster was acquired from the TOPODATA Project database [36] of the Brazilian National Institute of Space Research (INPE), and its topographic data is generated from NASA’s Shuttle Radar Topography Mission (SRTM) and is resampled from 3 arc-seconds to 1 arc-second, or approximately 30 m of spatial resolution. It should be emphasized that a higher spatial resolution of the land raster produces a longer processing time and larger amount of stored data due to the higher level of perceptible details and classes of wind directions. Thus, it is important to establish an appropriate spatial resolution and number of classes before preprocessing.
2.2.2. Preprocessing
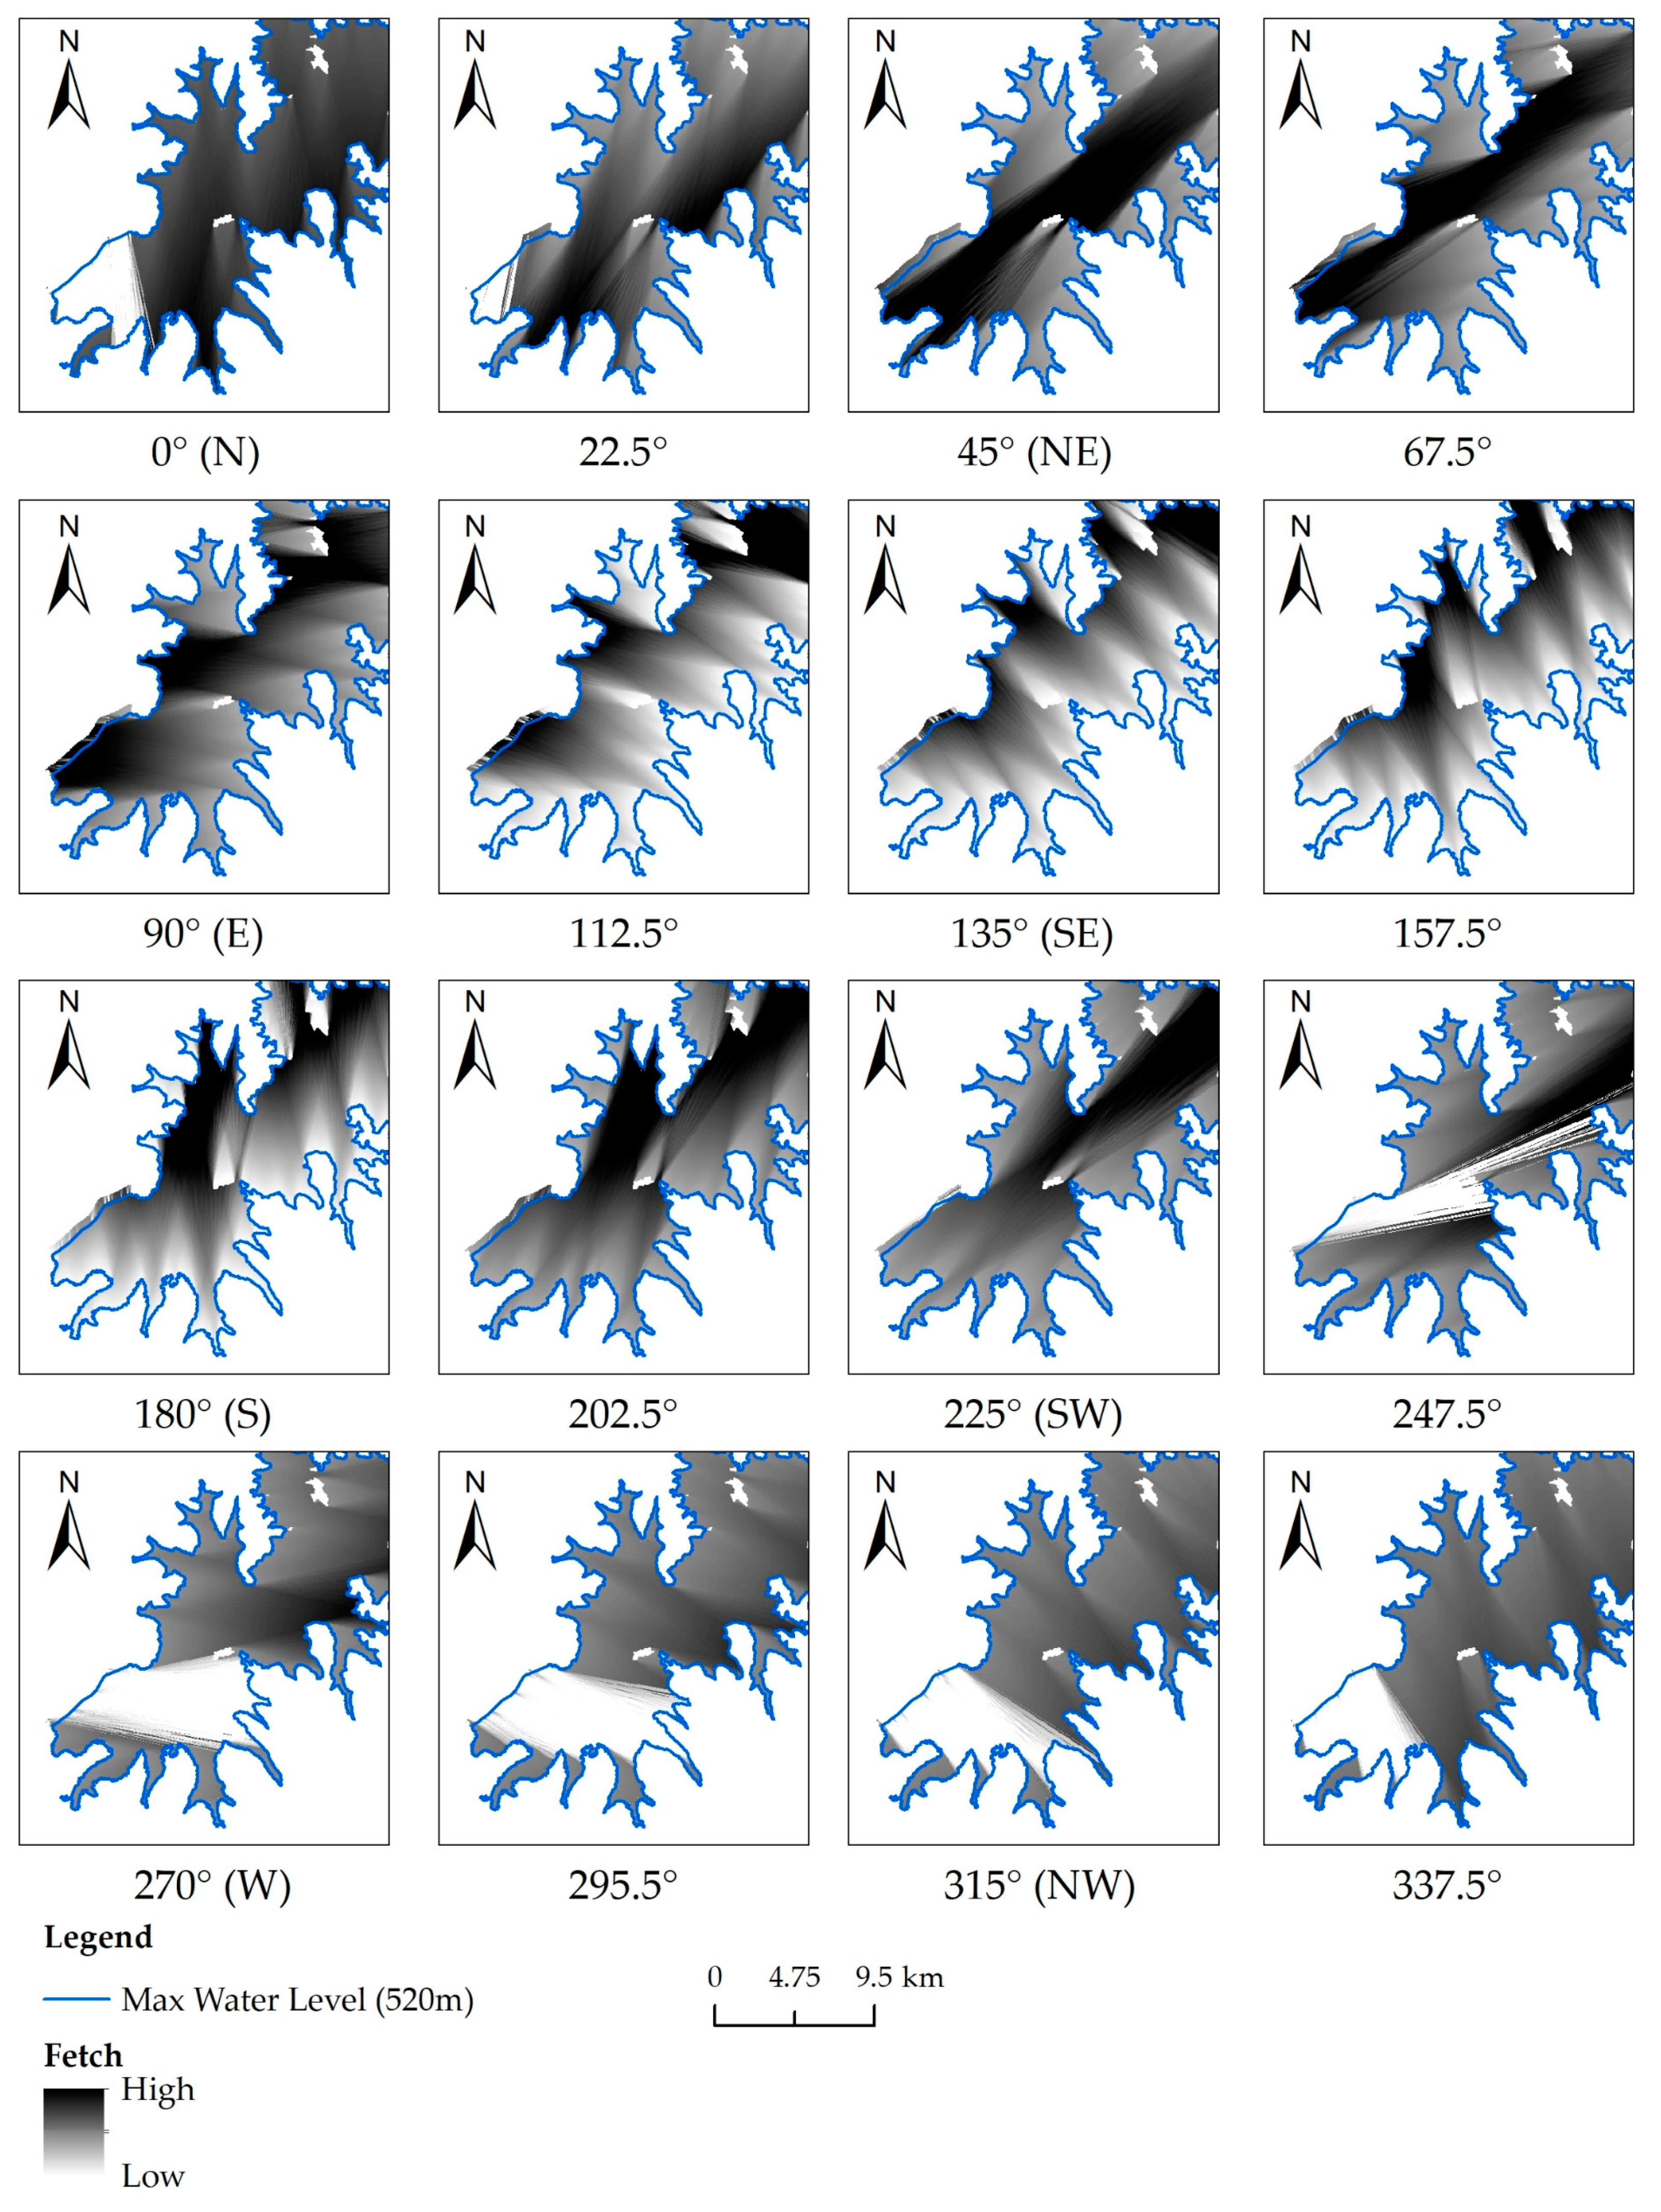
The wind patterns acquired from the SODAR sensor and ultrasonic anemometer are examined with WRPlot View (v.8.0.0, Lake Environmental, Waterloo, ON, Canada), and then generates wind rose plots and wind rose statistics (i.e., the frequency of wind directions and wind speed for a specific time period). The wind speeds (in m/s) were grouped into eight classes according to the Beaufort Scale (Table 1). The wind directions (in degrees) were grouped into 16 classes of wind directions, determined by dividing 360 degrees into 16 wind directions (of 22.5° each), to allow the analysis of the effective fetch, as follows: 0°, 22.5°, 45°, 67.5°, 90°, 112.5°, 135° 157.5°, 180°, 202.5°, 225°, 247.5°, 270°, 292.5°, 315°, and 337.5°.
The results were analyzed to determine which climate period (i.e., the dry and rainy season) is more severe in the Itumbiara reservoir. Olson and Ventura [29] showed an increase in the wind speed during the rainy season, leading to a higher wave height and wave energy on the shorelines. The wind data were separated by the acquisition source (i.e., the SODAR sensor and the weather station).
2.2.3. Overlay Analysis and Output Data
The original DEM raster data cover the watershed of the reservoir. Due to the processing time, the terrain raster format was limited by the shape of an input polygon feature at EL 520 m (the Maximorum water level), using the raster processing function (i.e., the Clip command) of ArcGIS. Before using the wind fetch model, it is necessary to reclassify the DEM using the ArcGIS Reclassify tool. This geospatial tool changes the raster values based on criteria producing specific intervals; and for applying the model, it was necessary to group the raster values into two separated classes: land, with values above 1; and water, for values equal to zero. Overlays analysis merge several rasters using a common measurement scale and weights each according to its importance. Therefore, the resolution of the DEM will have high or low relevance because of the scale of the reservoir.
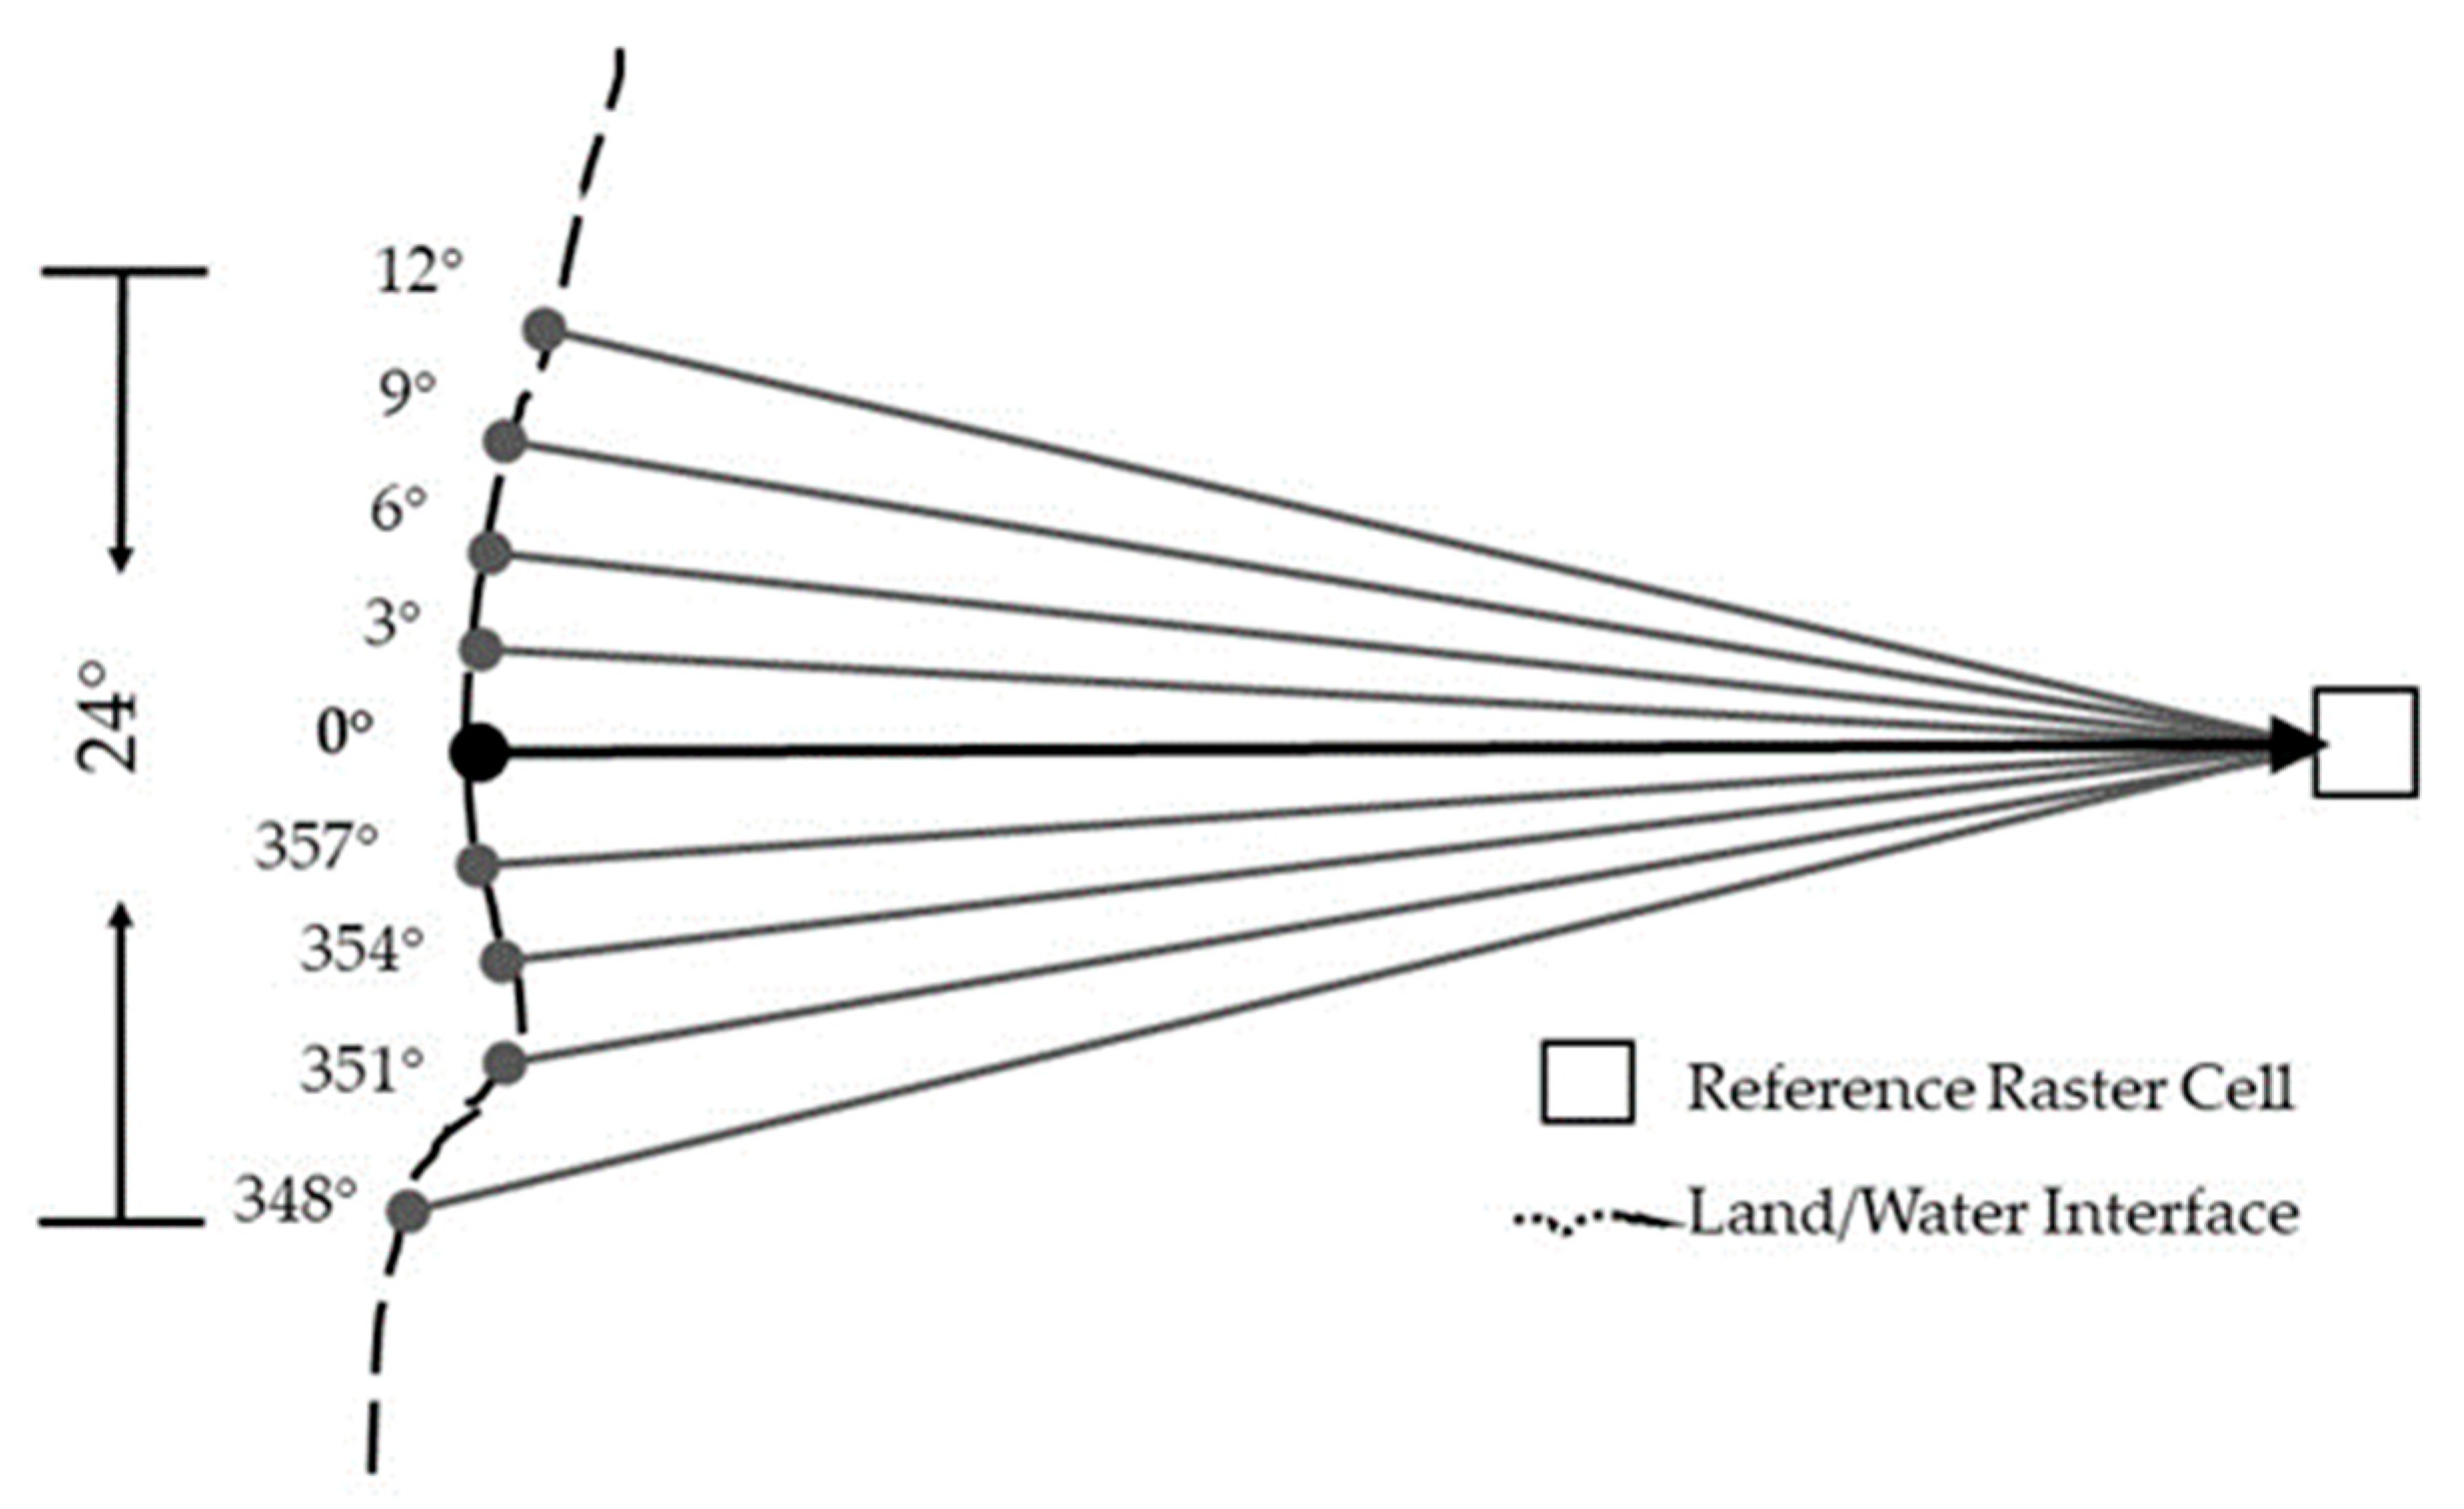
The fetches are estimated for 16 wind directions from the wind data and the reclassified land raster. This analysis was performed according to the method of the Shore Protection Manual (SPM), which calculates the arithmetic mean of the fetch lengths for each raster cell, spreading nine radials around the principal wind direction at 3° increments, forming a 24°-arc. In general, this larger arc represents a more realistic condition for shoreline evaluation. The wind-fetch model ignores any near-shore processes [20]. Figure 3 shows the SPM schematic.
This process produces 16 fetch raster files from each individual direction and wind class, previously analyzed by the wind rose plot. These files were reclassified into five classes to allow fetch values to be processed and combined. These rasters were combined with the Weighted Overlay tool, generating a single file with all the fetches weighted by the frequency of the winds in a certain period of time. This combination allowed us to estimate the energy potential of the waves, considering that strong winds on long fetches develop high waves. Thus, the action of the waves in the margin with greater energy will cause an erosive action of greater intensity.
A wave erosivity potential map was created by a new reclassified image of the wave potential using the natural breaks classification method in three classes: low, medium and high. In addition, the shoreline wave erosivity potential was compared with the Itumbiara soil erosion susceptibility (i.e., the sheet and rill erosions) from the work of Romão and Souza [33] and Jesus et al. [38].
3. Results
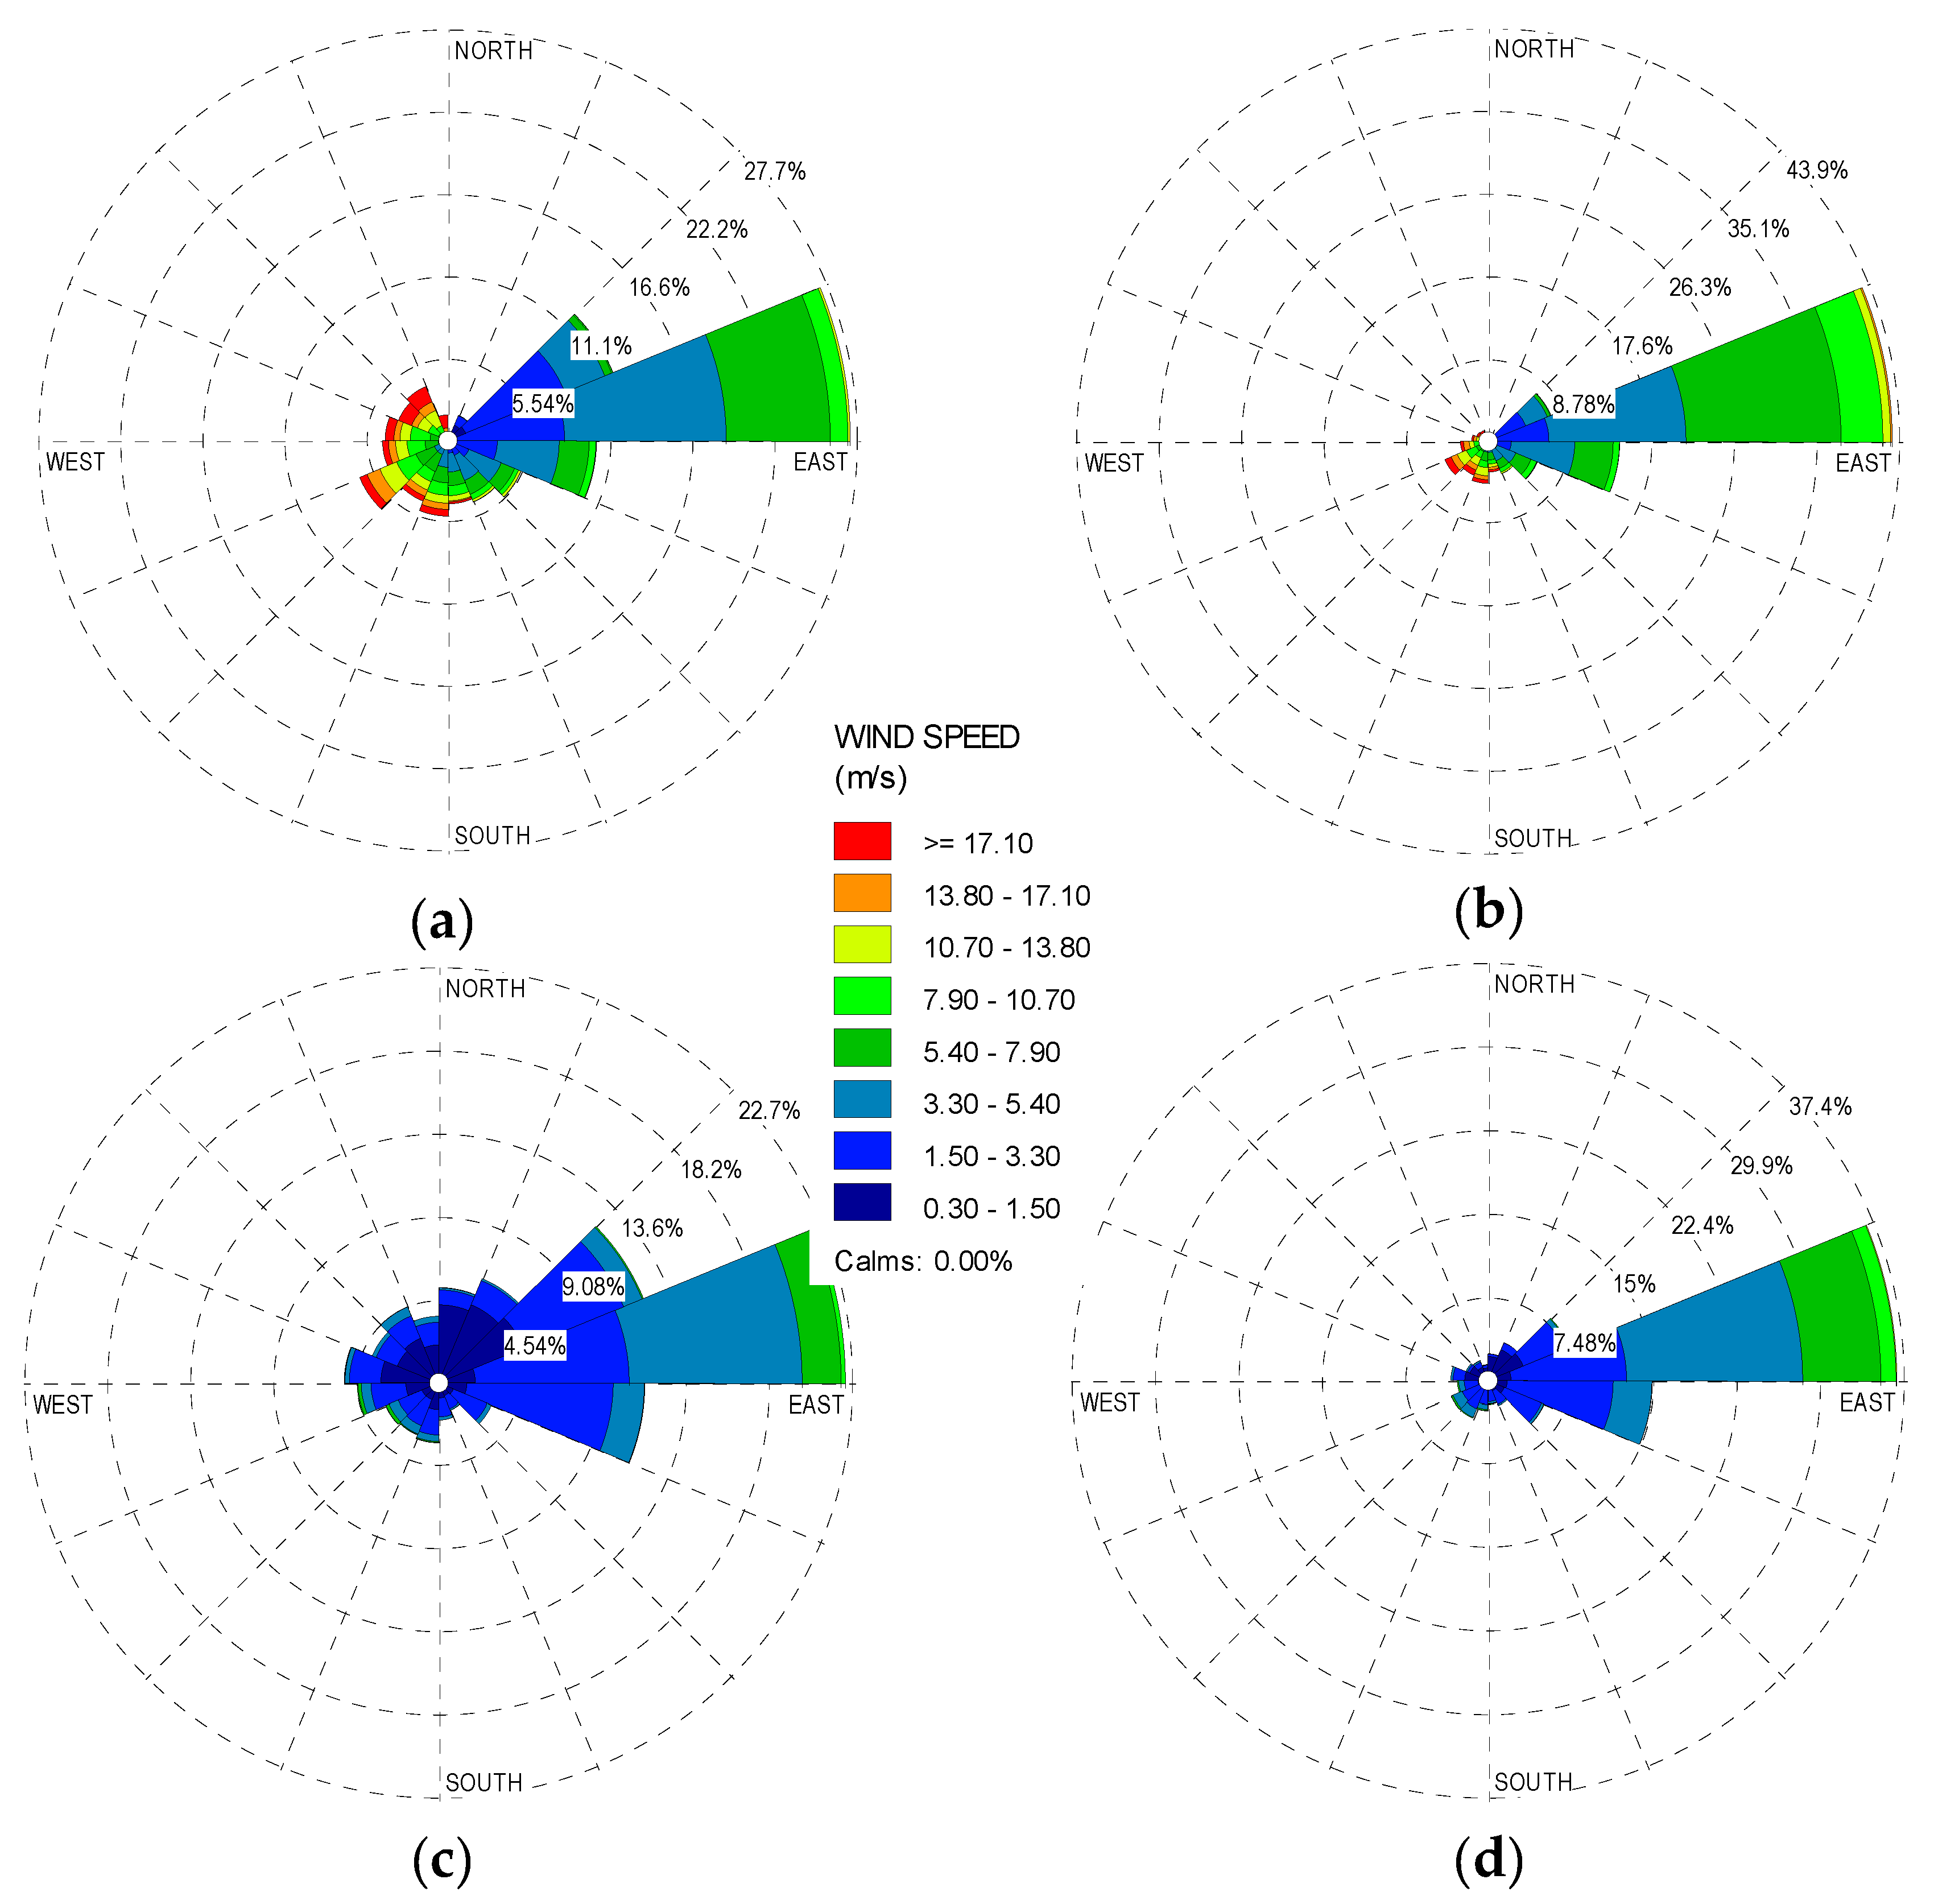
The wind data from the SODAR sensor and weather station were submitted to statistical climate analysis using a WRPlot View. This software generated wind rose plots, which allowed us to observe the behavior of the wind speed and frequency of occurrence in a range of directions. Figure 4 presents a comparison between the wind rose plots of the statistical evaluations of the wind data from 23 September 2014 to 23 December 2015 of the SODAR sensor and the weather station. In addition, the wind rose plots were separated by dry (April 2014 to October 2015) and rainy (November 2014 to March 2015) seasons to determine the worst-case scenario for high wave generation.
It is also observed that the speeds obtained by the SODAR sensor (Figure 4a,b) are higher than those obtained by the weather station (Figure 4c,d), reaching speeds above 13.80 m/s. This is probably due to an attenuation in the wind speed caused by the position of the weather station downstream of the Itumbiara Dam. However, the wind direction distributions were consistent. Differences between wind speeds measured by the SODAR sensor and the tower sonic anemometer were verified [39] and justified by the methodology of device acquisition.
Statistical analysis shows that a preferred wind direction in the northeastern sector lies in the range of 67.5° to 90°. The wind speeds during the rainy season, as expected, show higher intensities, on average approximately 3%, in comparison to the dry season, independent of the measuring device. However, strong winds from the southwest (azimuth from 225° to 247.5°) were recorded. The most frequent wind speed values lie in the range of 3.30 to 5.40 m/s. Therefore, the wind data from the rainy season were selected to produce the wind fetch maps and wave erosivity potential maps. This is because the analyses have shown that rainstorms have a clear influence on the erosiveness and wave intensity [29,40]. Shoreline erosions are stronger in the tropical South American summer (i.e., the high water season) than in the winter (i.e., the low water season). Previous work on the Itumbiara reservoir [41,42,43] shows that the wind mainly blows from the northeast and east and that the wind speeds range between 3.0 and 8.0 m/s, thereby confirming the findings and conclusions presented in this study.
The shoreline that is affected by waves depends on the wind conditions (i.e., speed, duration, direction, and fetch) and the shape of the land. In most situations, the inland reservoir has small fetch lengths because the fetches are limited by the landforms surrounding the waterbody. In general, the Itumbiara reservoir has an irregular (i.e., not uniform) fetch length path, but this parameter, ranging from 45° to 70°, has a straight path showing longer fetches, allowing the wind to blow for a greater distance before reaching the shoreline reservoir. The main wind direction for the erosive process in the Itumbiara reservoir is 67.5°.
In general, the characteristics of the wind waves that approach the shoreline include the wind speed and direction, storm/wind duration, fetch length, and reservoir bathymetry [40]. The wave heights and wave periods are also lower if the waves are generated in shallow rather than deep water [40]. Thus, during periods of rainfall, the wave energies have different intensities in swallow and in deep water. The wave actions are more severe on the shore profile toe [40]. The longest fetch length, wind frequency, and wind speed result in greater shoreline erosion.
After the wind rose plot analyses, the original land raster (DEM) was modified with a new single file including a water body and shoreline at an elevation of 520 m. This raster file only has the objective of representing the interface between the land and water. Therefore, after preprocessing the input data, this study proceeds with the WAVES tool applications. A high-resolution land raster dataset allows a better definition of islands and shore boundaries. However, increasing the spatial resolution of land rasters requires more processing time. In the case of the Itumbiara reservoir, at least 12 hours were needed to calculate 16 fetches from the data with the 30-m spatial resolution.
The fetches were compiled for 16 azimuthal directions, including four cardinal directions shown in Figure 5. Wind speeds below 0.3 m/s were not observed in the rose plots. In addition, the Doppler sensor had difficulties acquiring speeds below 4 m/s and above 18 m/s [35]. It was observed that the wind directions of 45° and 67.5° are the main fetch lengths that affected the shoreline, especially in the right margin. The wind directions of 90° to 337.5° have the lowest fetch lengths compared with those of 0° to 67.5°.
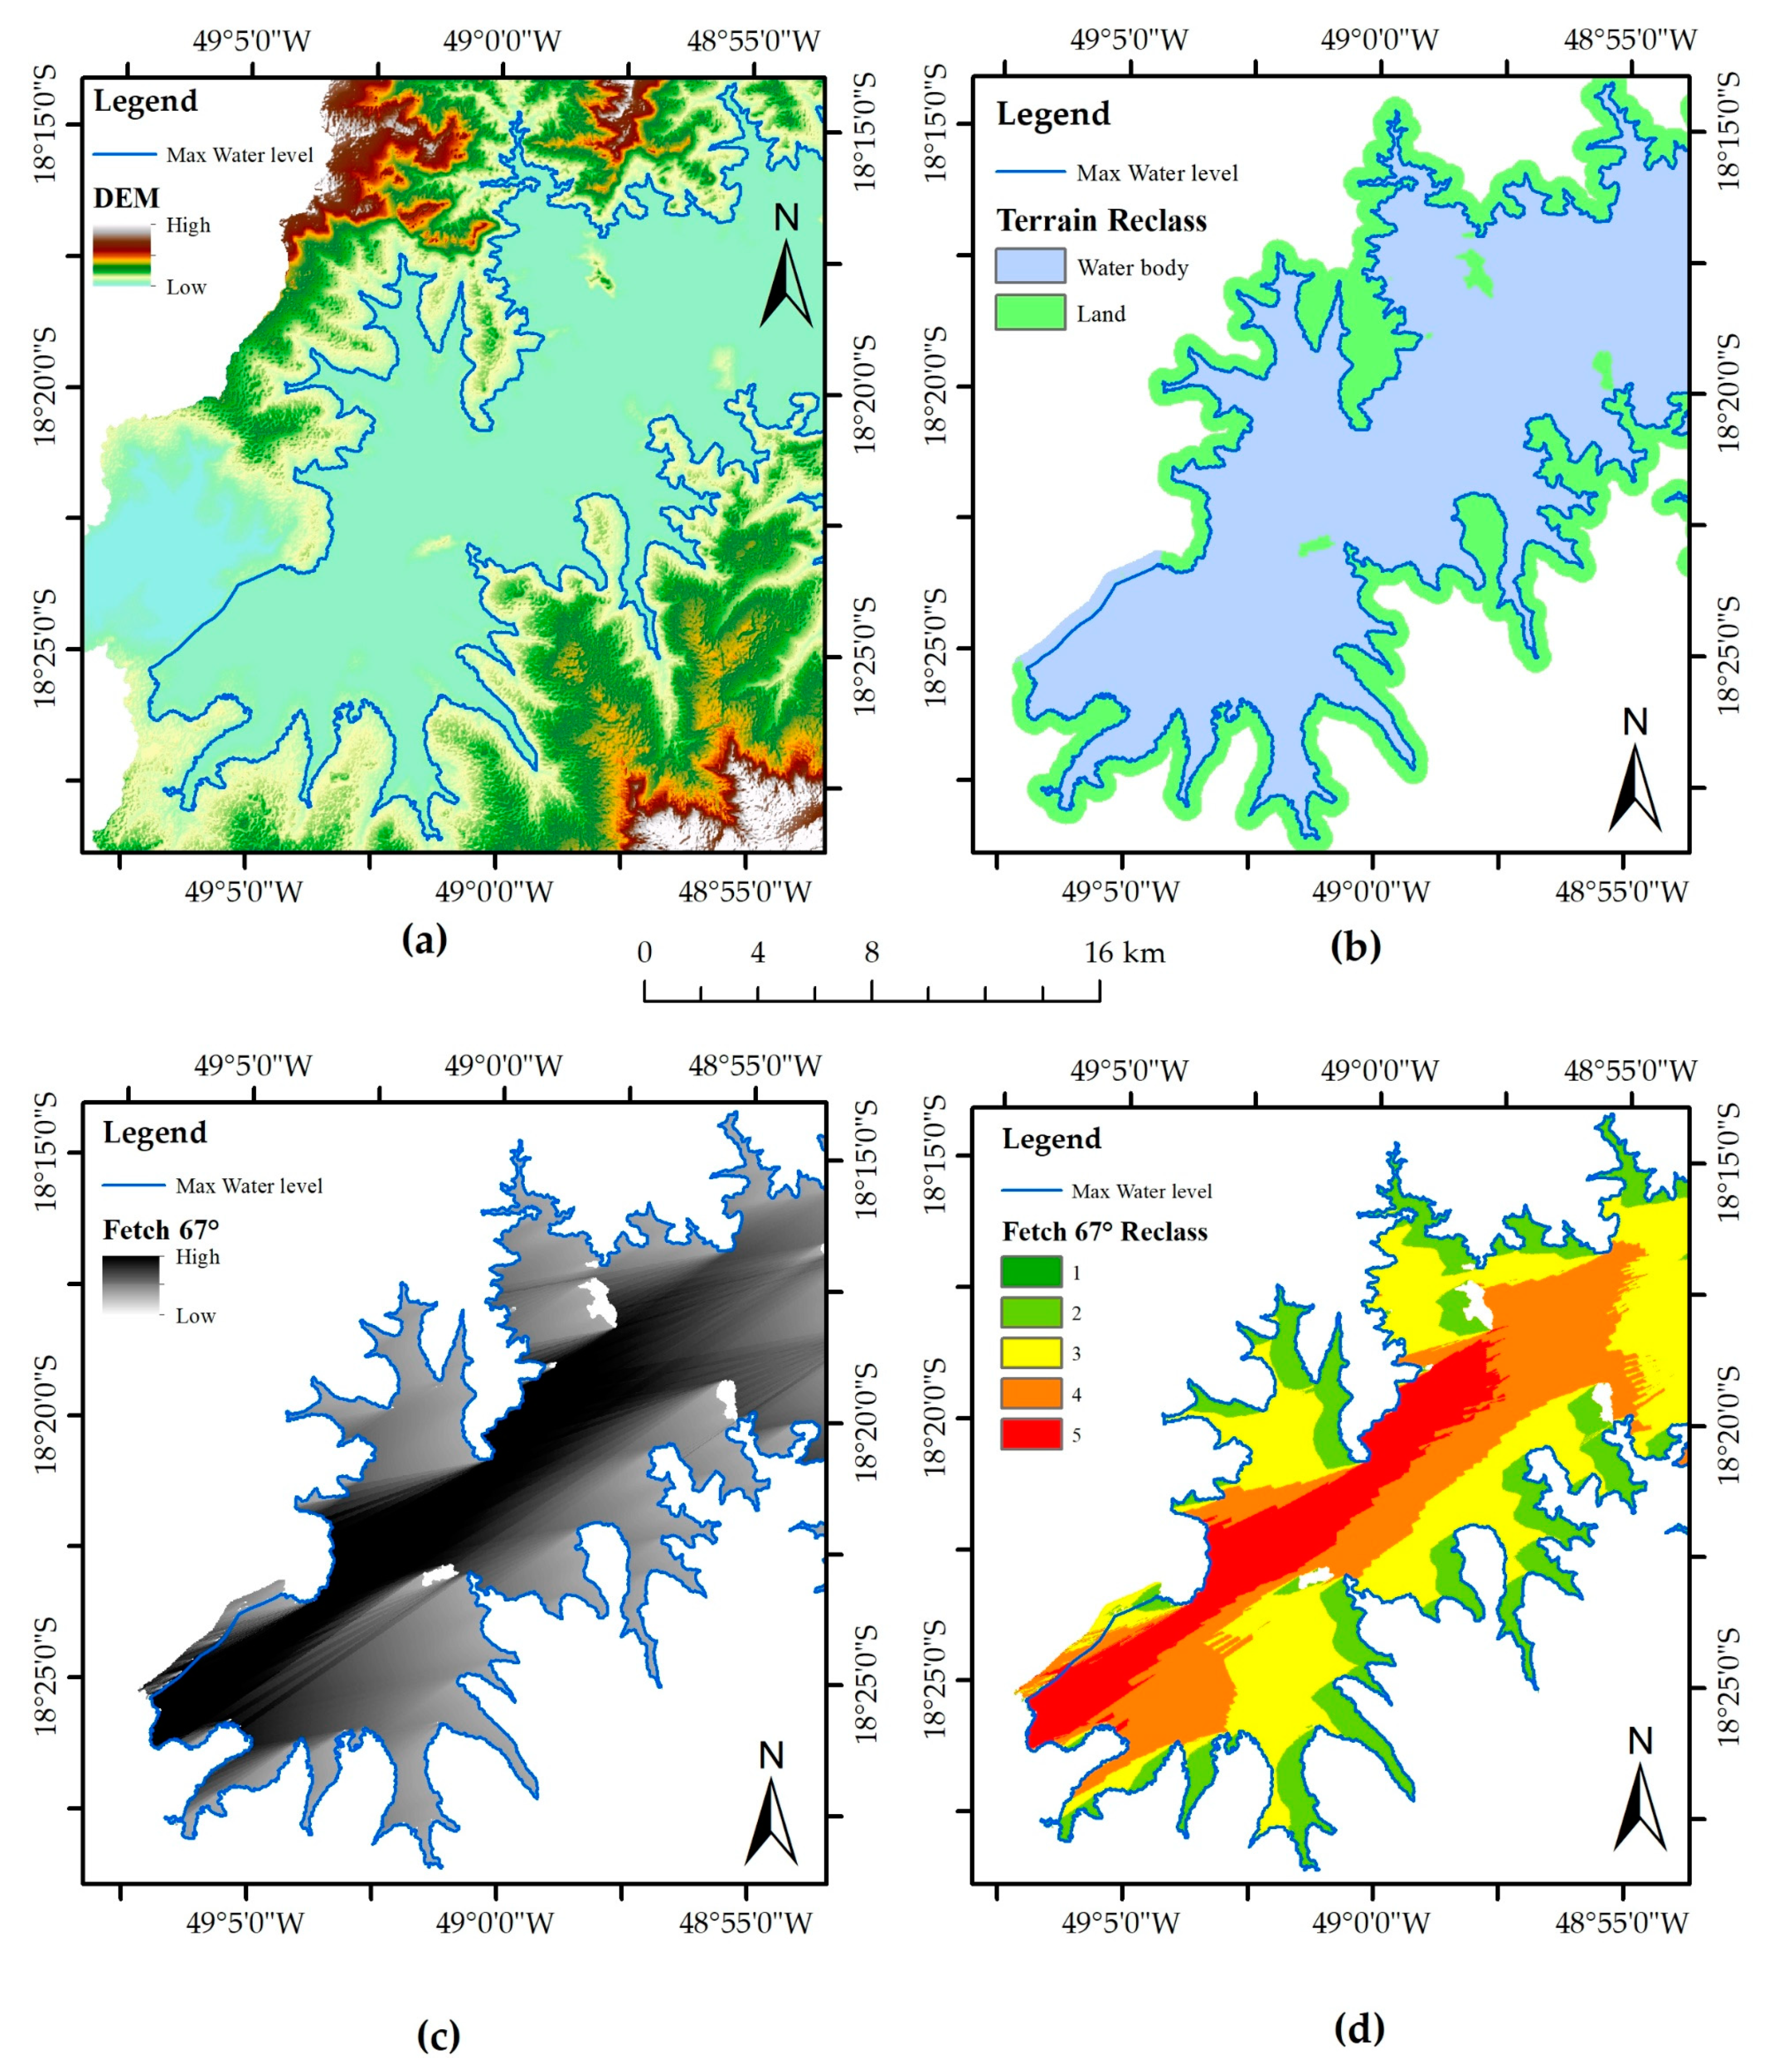
Figure 6 illustrates the raster image of the input data to the WAVES tool, such as the original DEM raster and land/water raster. Additionally, the preprocessed fetch model data and reclassified fetches were used to produce the wave potential. The DEM and reclassified land/water raster are shown in Figure 6a,b, respectively. Figure 6c presents the main fetch that affects the shoreline of the Itumbiara reservoir, and Figure 6d illustrates the reclassified main fetch.
The WAVES tool produce 16 fetch raster files, and each individual raster was reclassified by the manual method of classification into five classes to remove the negative data and reduce the processing time. These rasters were combined with the weighted overlay tool according to the corresponding wind frequency during a specific time period. Once again, the Reclassify tool was used on this single weighted file to generate three new classes of raster with the Natural Breaks classification method producing the wave erosivity potential of the Itumbiara reservoir. This method of classification (or Jenks method) is a GIS common criterion for dividing a significantly different dataset for a suitable arrangement of values into a certain number of homogenous classes reducing the variance within classes and maximizing the variance between each class.
The shoreline of the land/water raster buffer strip is 200 m wide, which represents the boundary of the reservoir limited to the left by the elevation of 520 m (the Maximorum water level) and to the right by the elevation of 510 m. This range was chosen because it corresponds to the maximum water level variations.
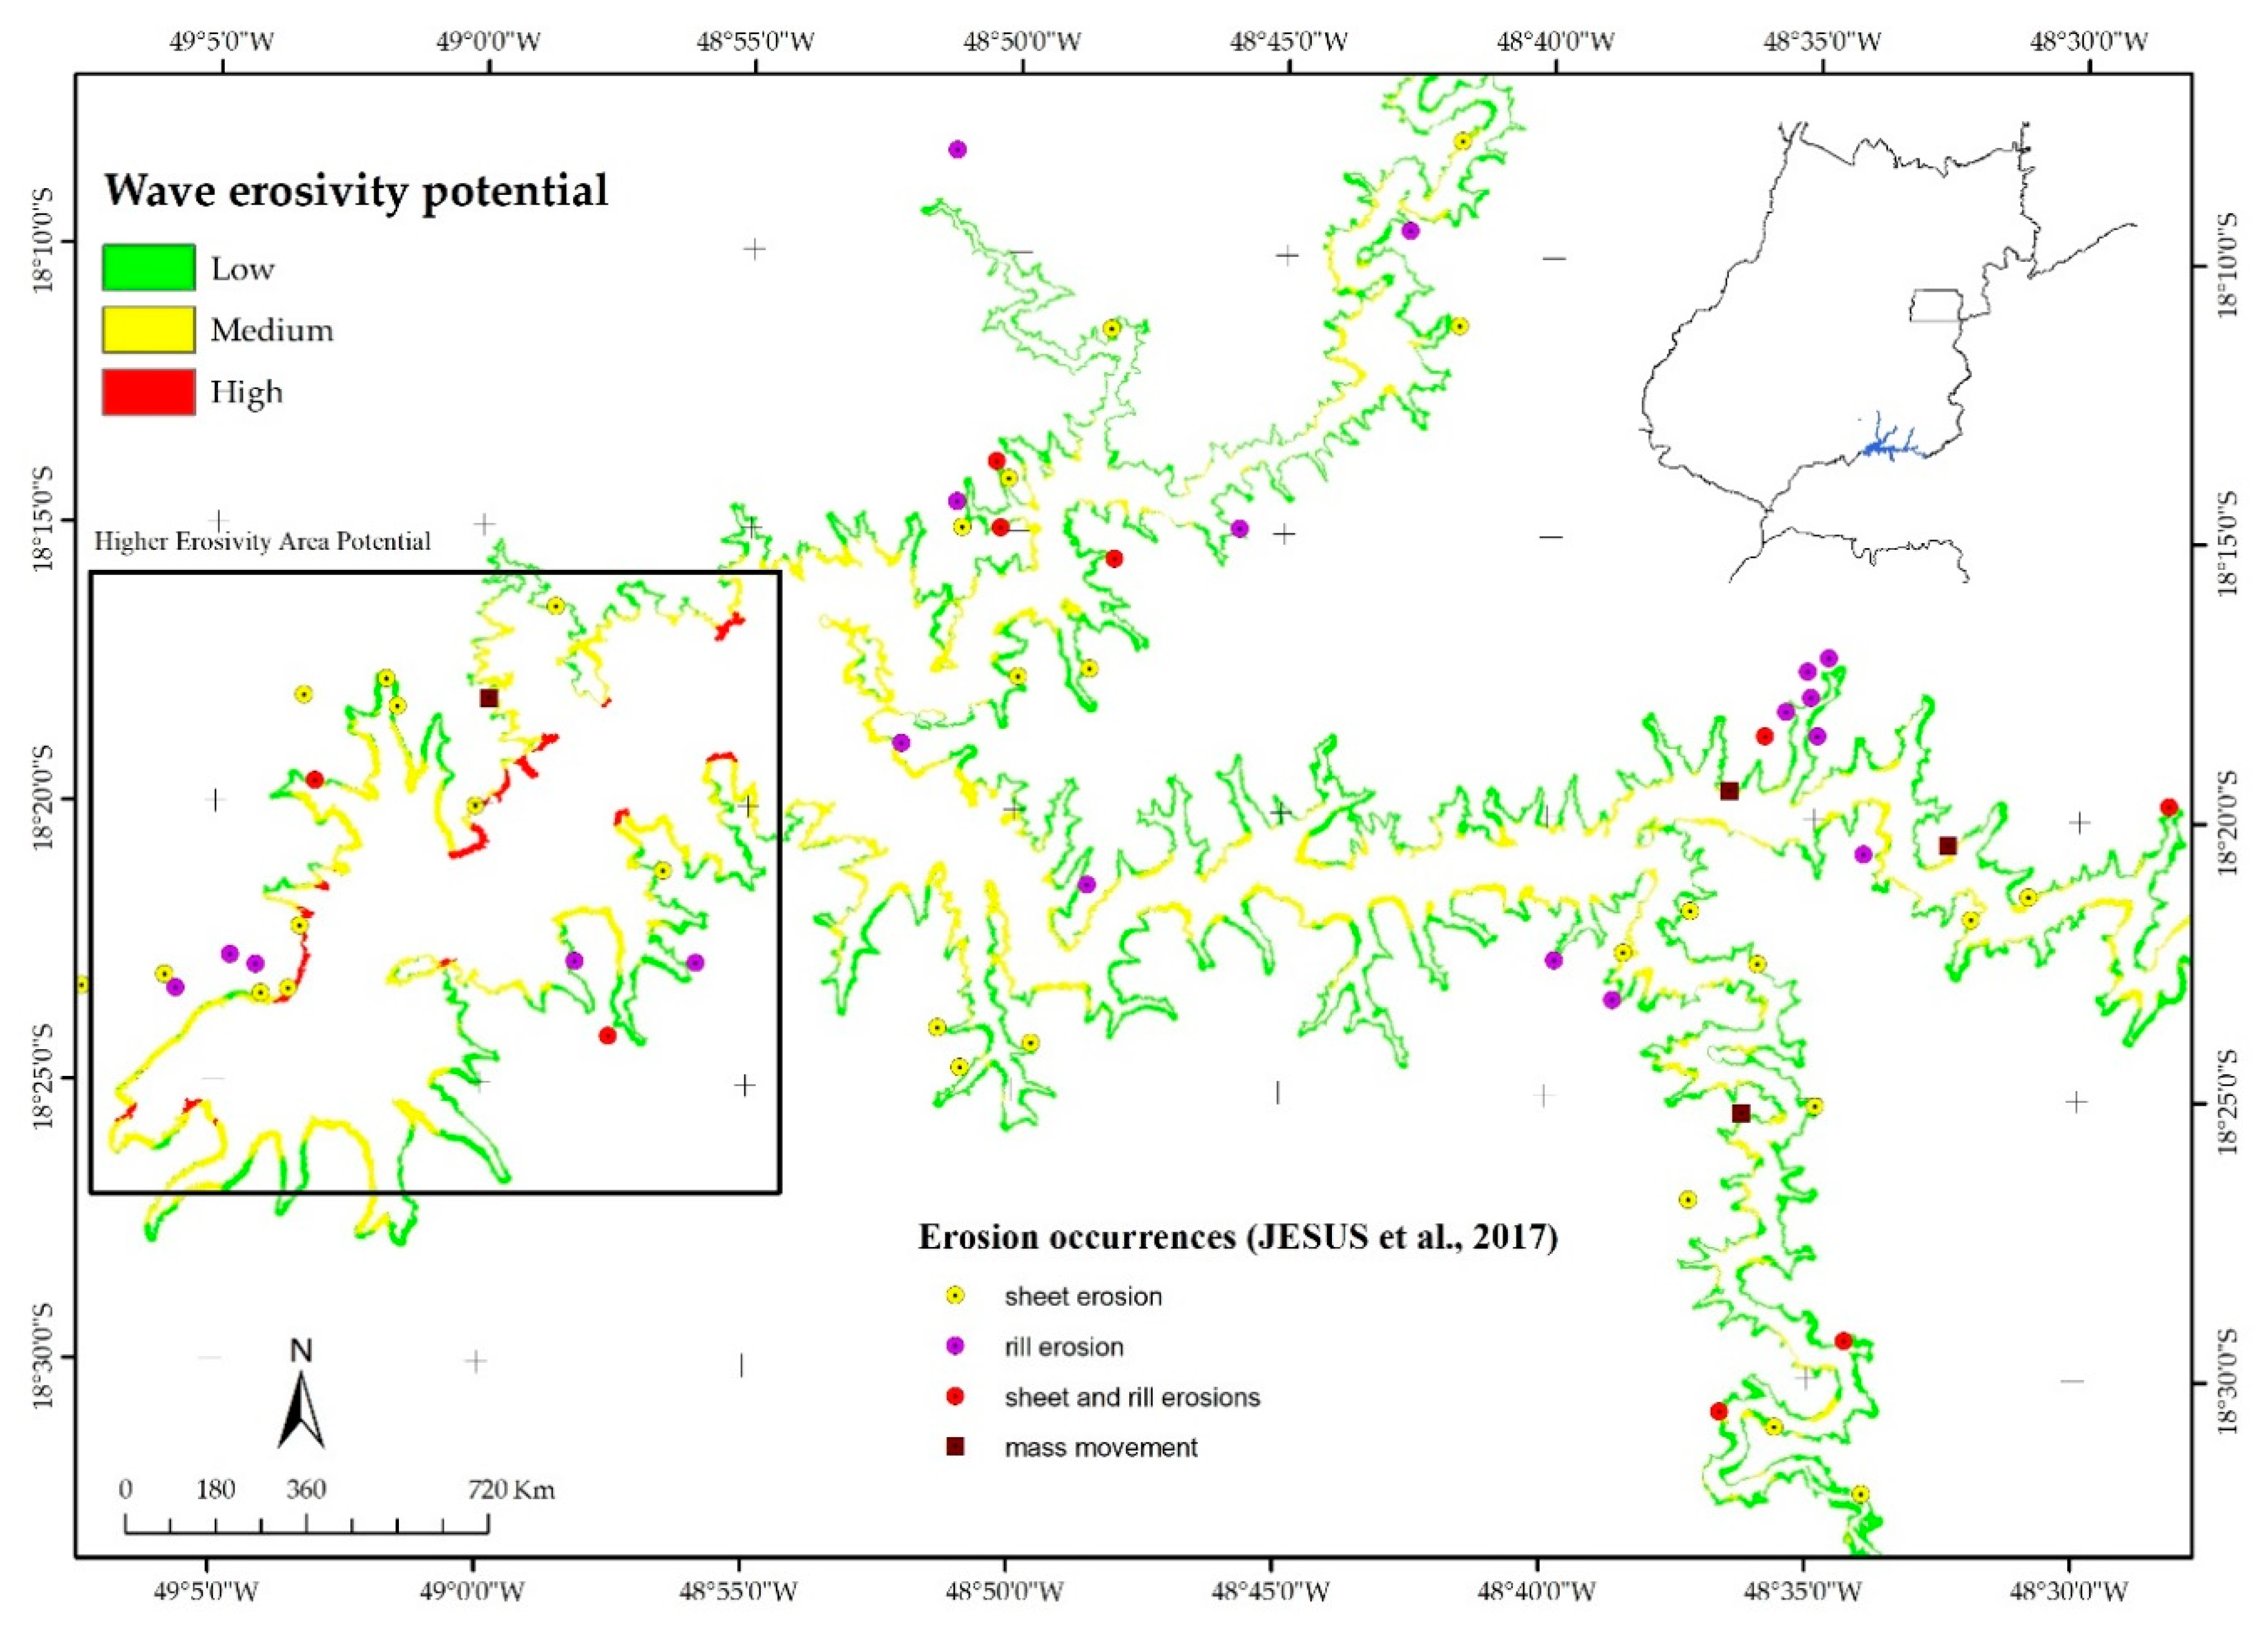
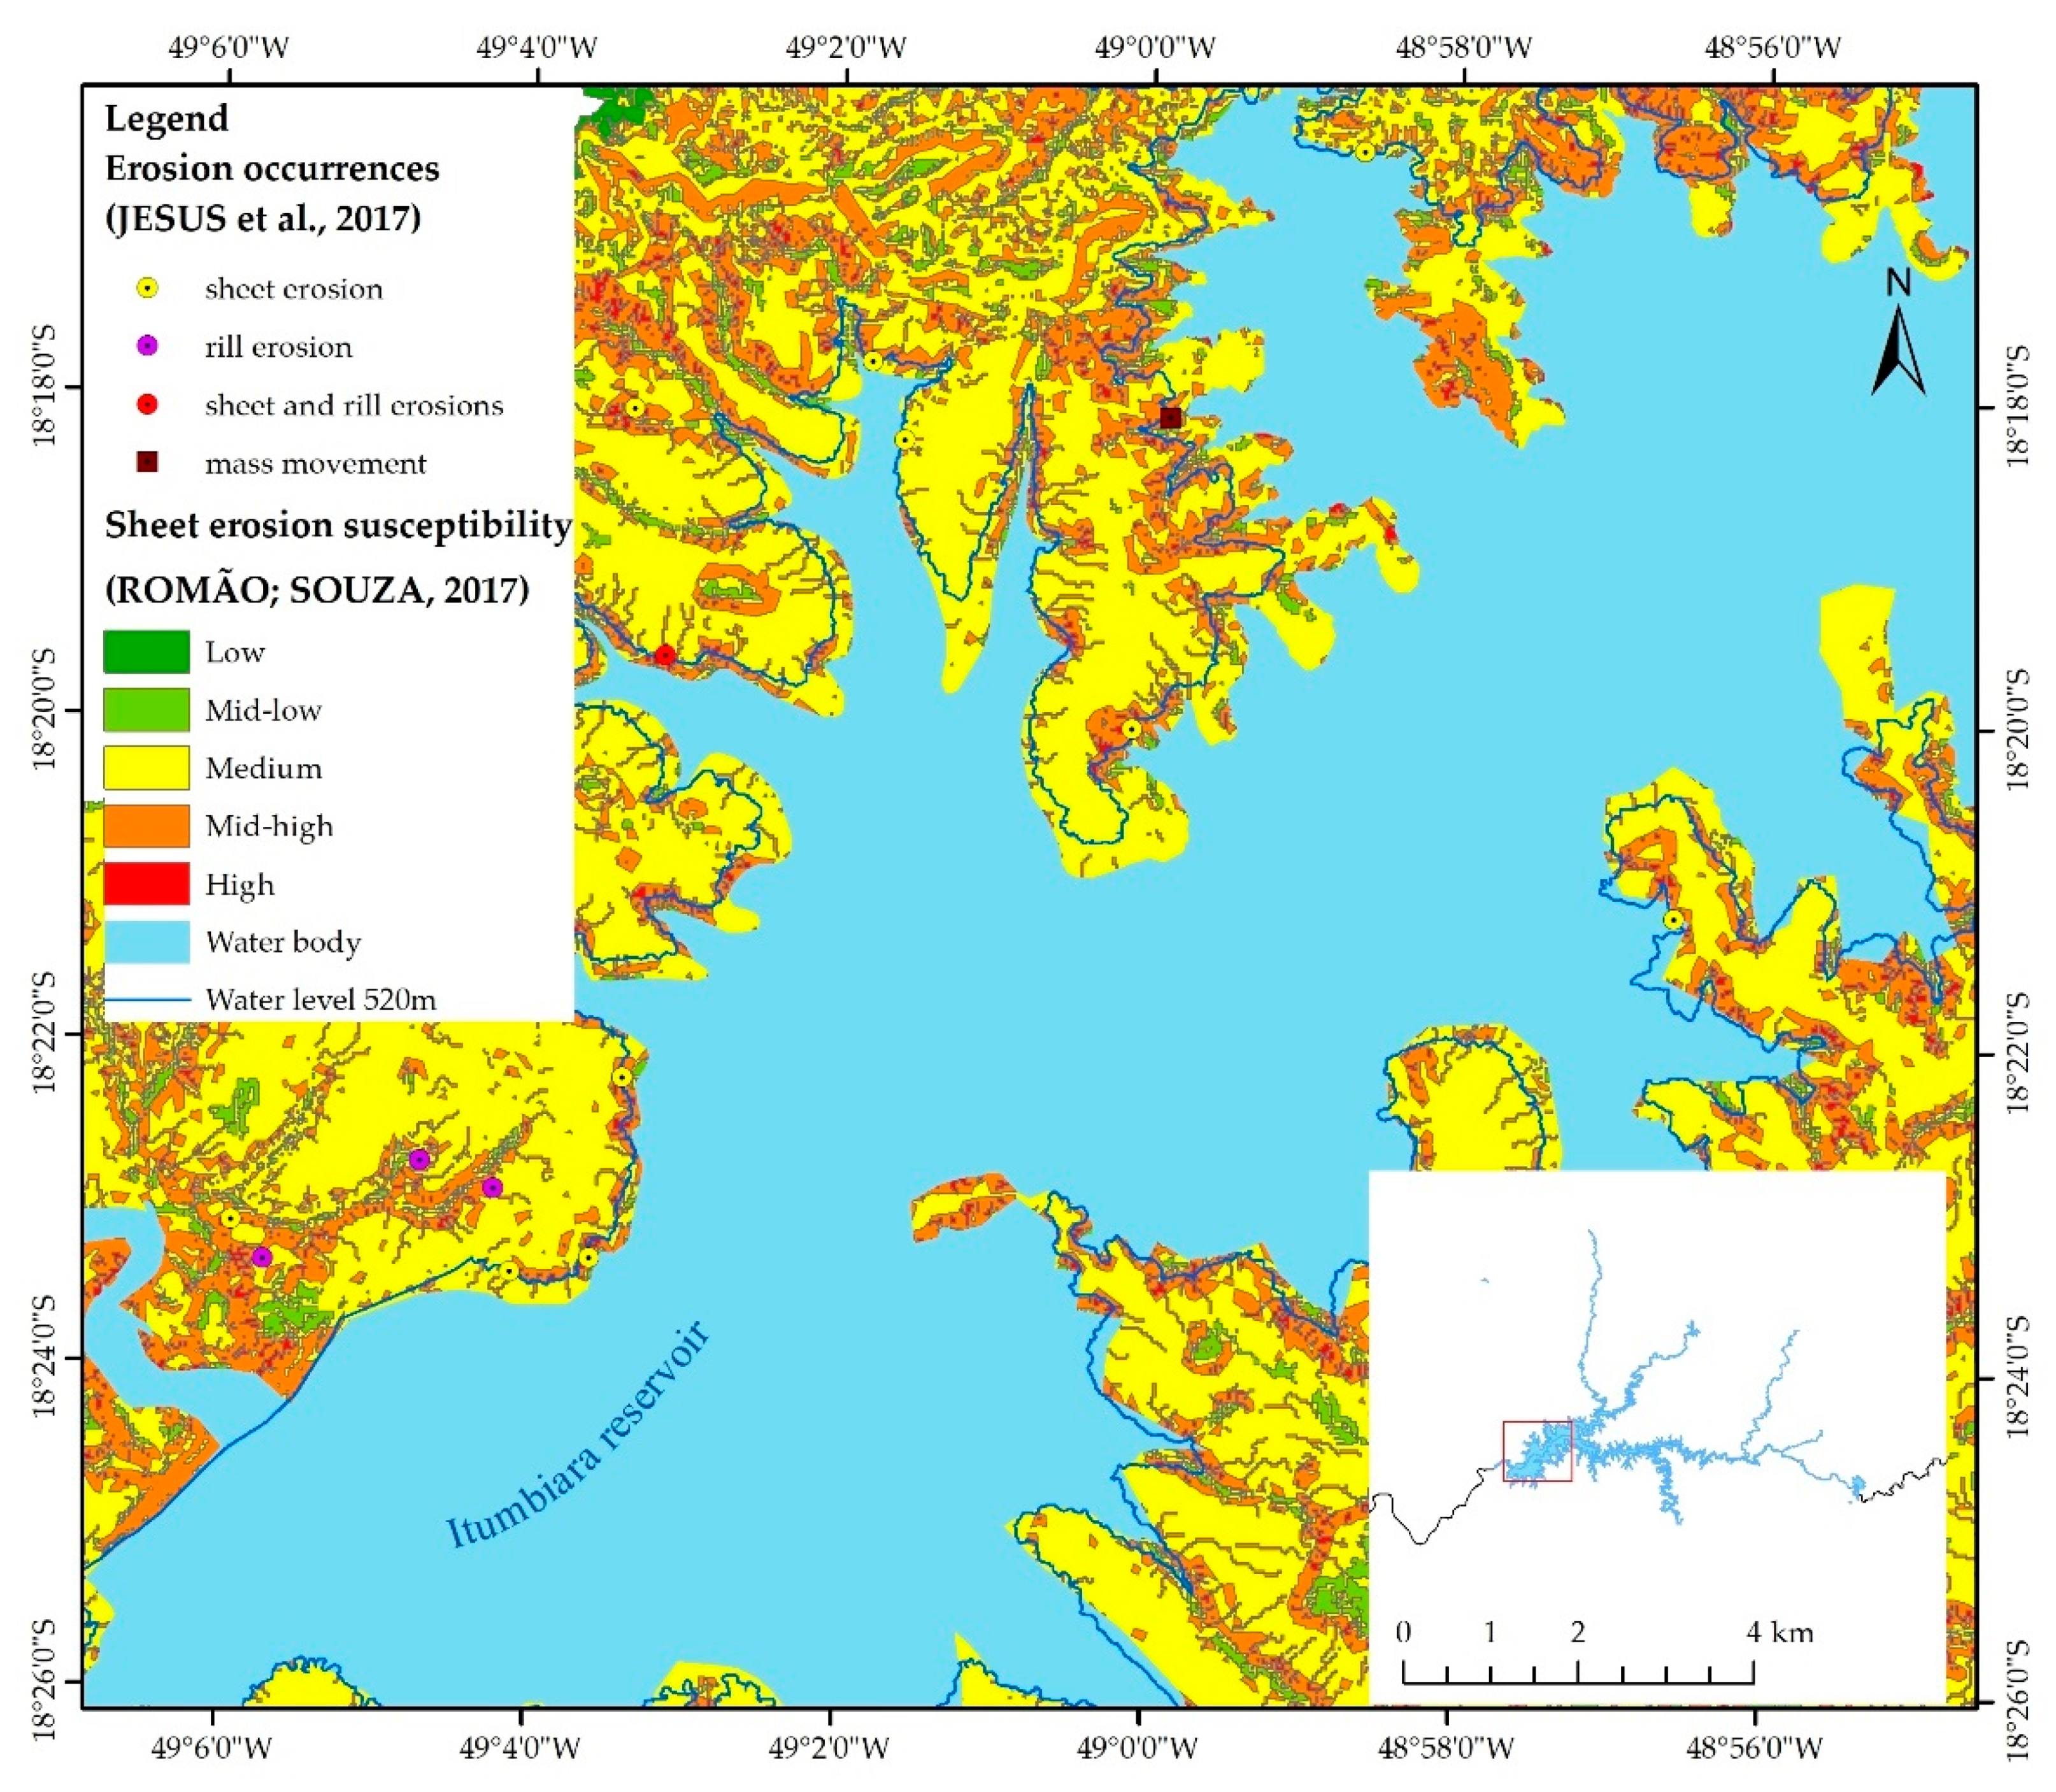
In addition, this wave erosivity potential was generated for both wind data obtained from the SODAR sensor and the weather station. The comparison between these maps presented very similar values. Only the map generated by the wind sound profiler data (i.e., the Doppler sensor) is illustrated in this paper and presented in Figure 7, which covers almost the entire Itumbiara reservoir. It is a small-scale map (i.e., 1:250.000) and indicates the area with the highest occurrence of highly erosive wave potential. This map also presents the occurrences of water erosion processes, mapped by field visits and satellite image analysis, according to Jesus et al. [37]. The erosion occurrence illustrated in Figure 7 includes sheet erosion, rill erosion and the association of those erosions, and mass movement. Some sheet erosion-mapped sites coincide with high shoreline wave erosion.
Table 2 presents the wave erosivity potential perimeter calculated in values of meters, kilometers and percent in ArcGIS. According to this estimation, the high impact of waves affects the shoreline of the Itumbiara reservoir only along 2% of its perimeter.
4. Discussion
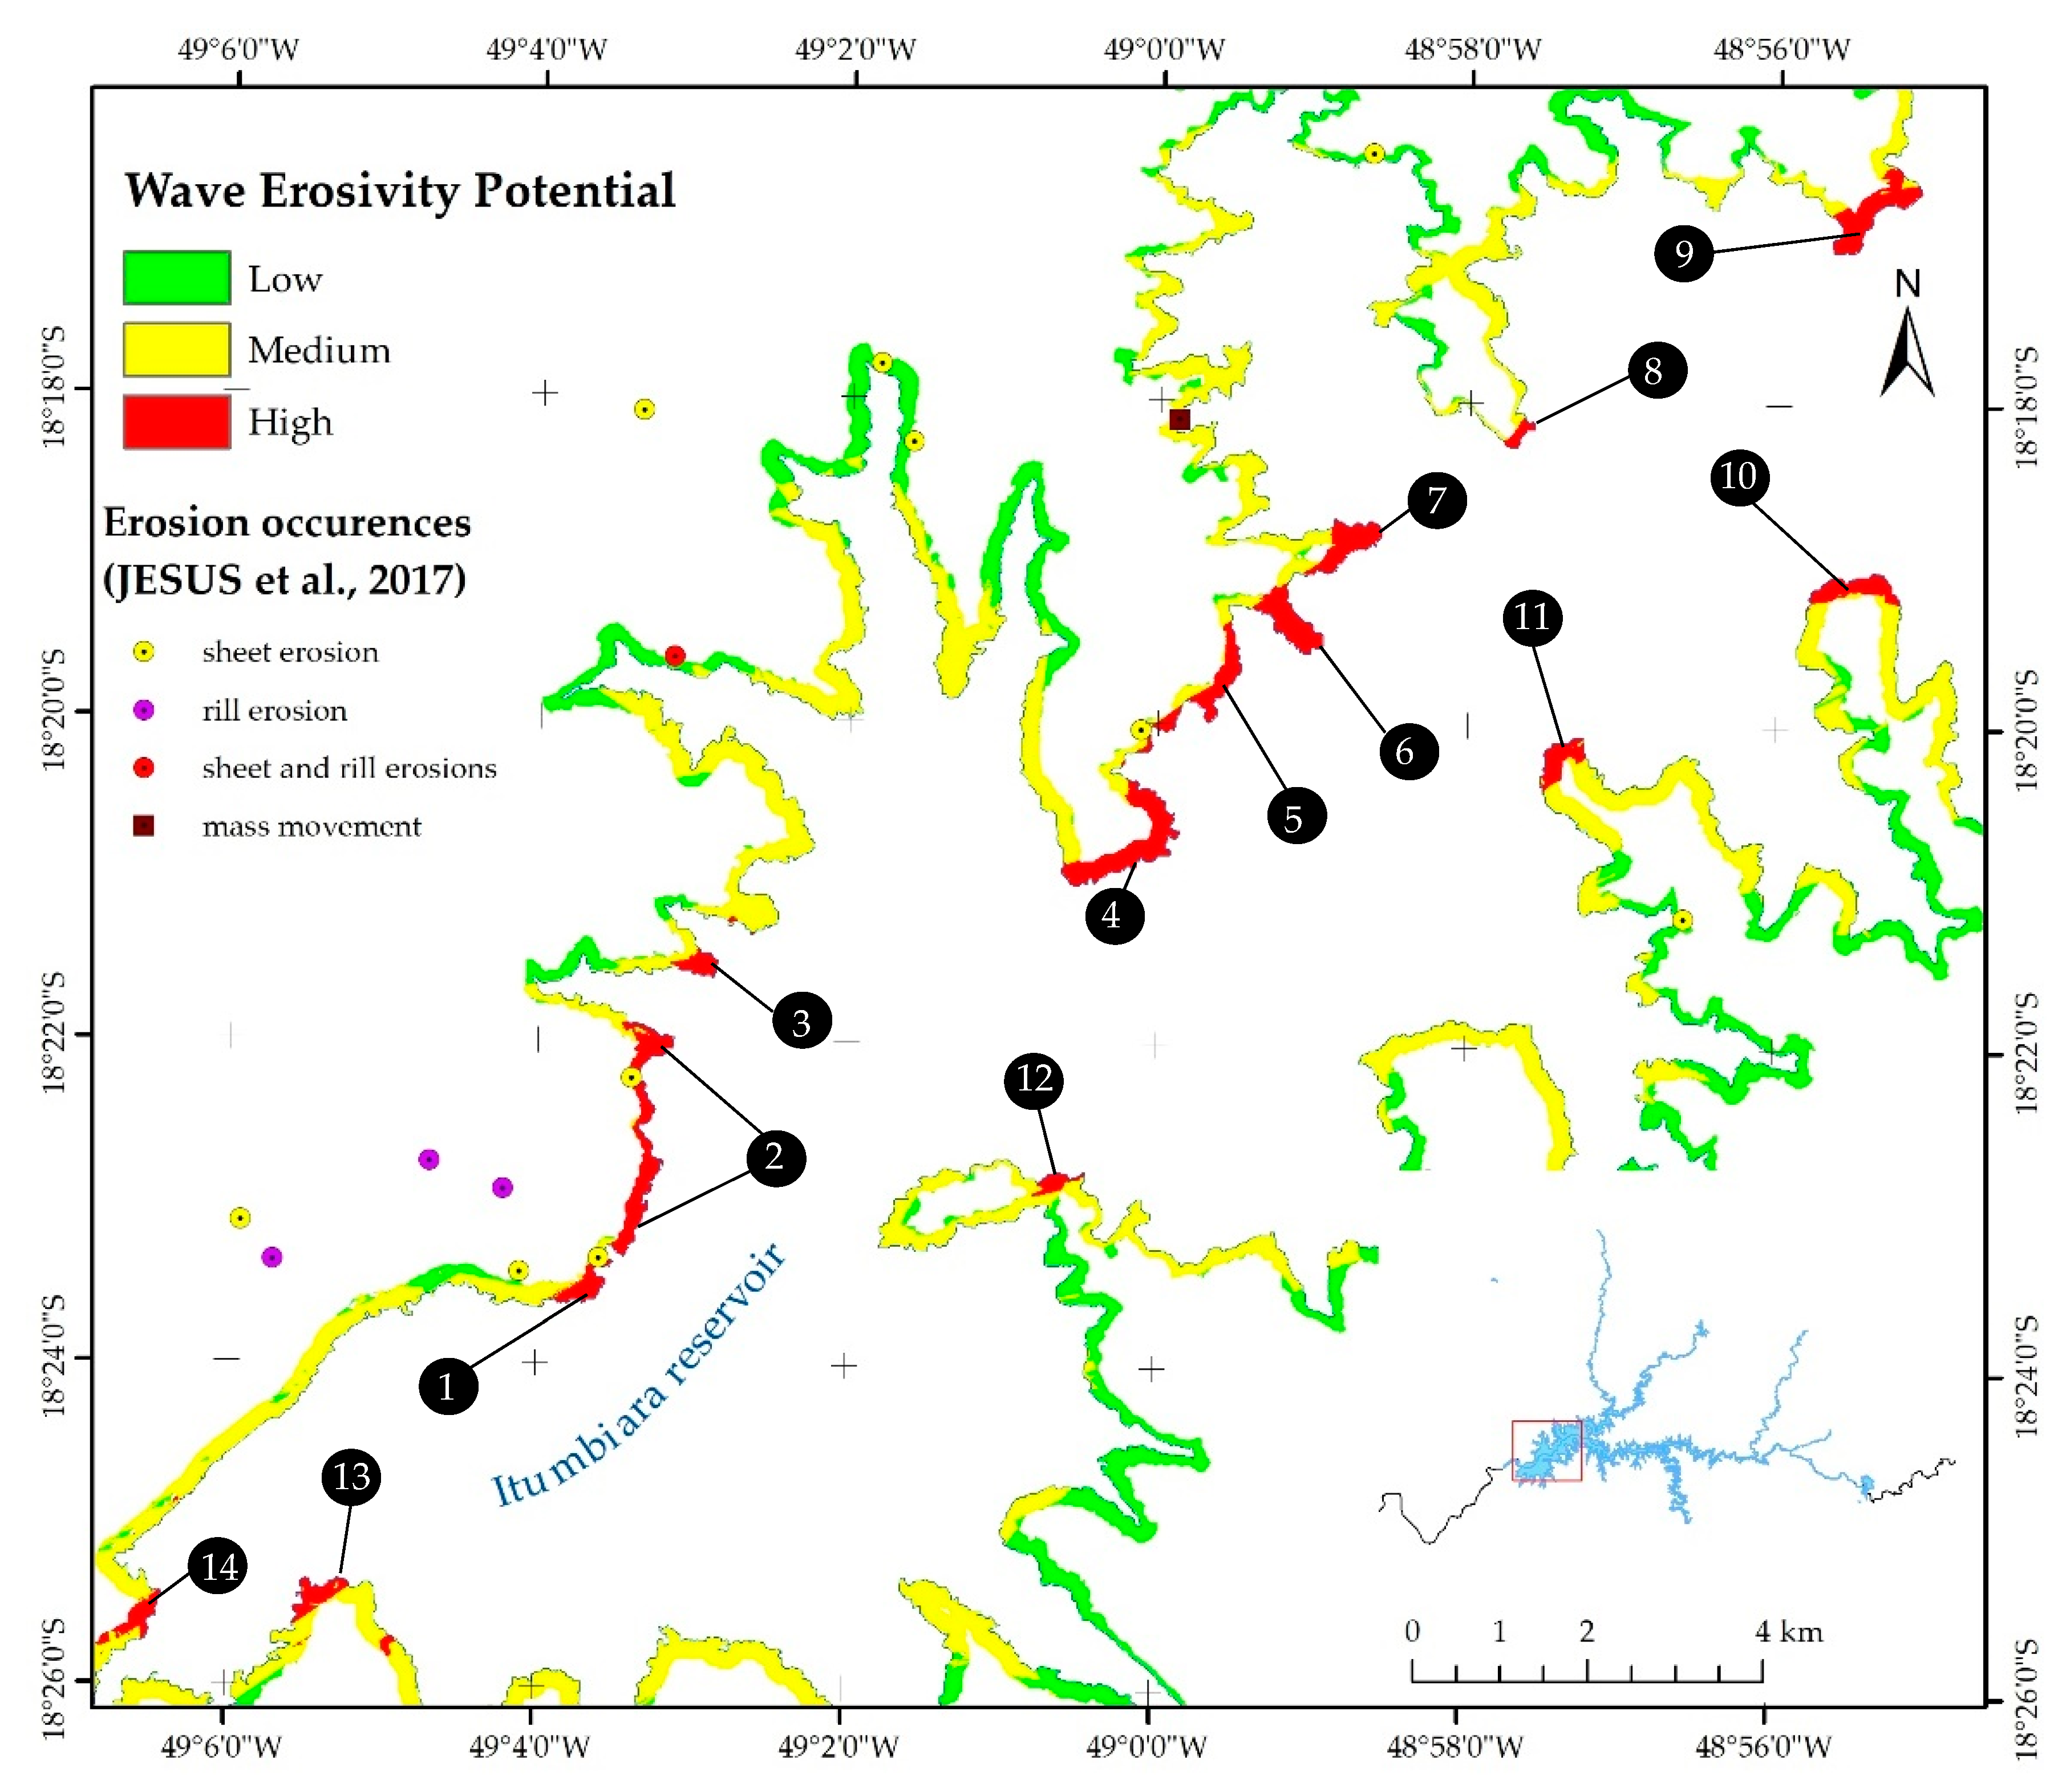
It was observed that the high values of shoreline wave erosion are concentrated near the Itumbiara Dam. Due to this, an area of high wave erosivity potential was delimited in Figure 7, and a large-scale map is illustrated in Figure 8. It was verified that the greatest influence of the waves occurs mainly in the right margin of the Itumbiara reservoir and is caused by the winds from the northeast. In addition, 14 buffer strips of high values are numbered and indicated in this figure for further analyses.
Figure 9 presents the sheet (inter-rill) erosion susceptibility to surface runoff [33,37]. High to moderately high values of susceptibility were observed along the shores. The shoreline of the Itumbiara-GO reservoir has medium to low wave erosivity along most of its perimeter and coincides with medium values of sheet erosion susceptibility from the comparison of Figure 9 and Figure 10. Additionally, the higher values of susceptibility to sheet erosion match the high values of wave erosivity potential. However, there is no direct correlation between erosion processes due to the complexity of the soil properties and the erosion agents. The correct correlation requires determination of the wave erosion susceptibility, which was not the object of this study and requires both field work and laboratory experiments.
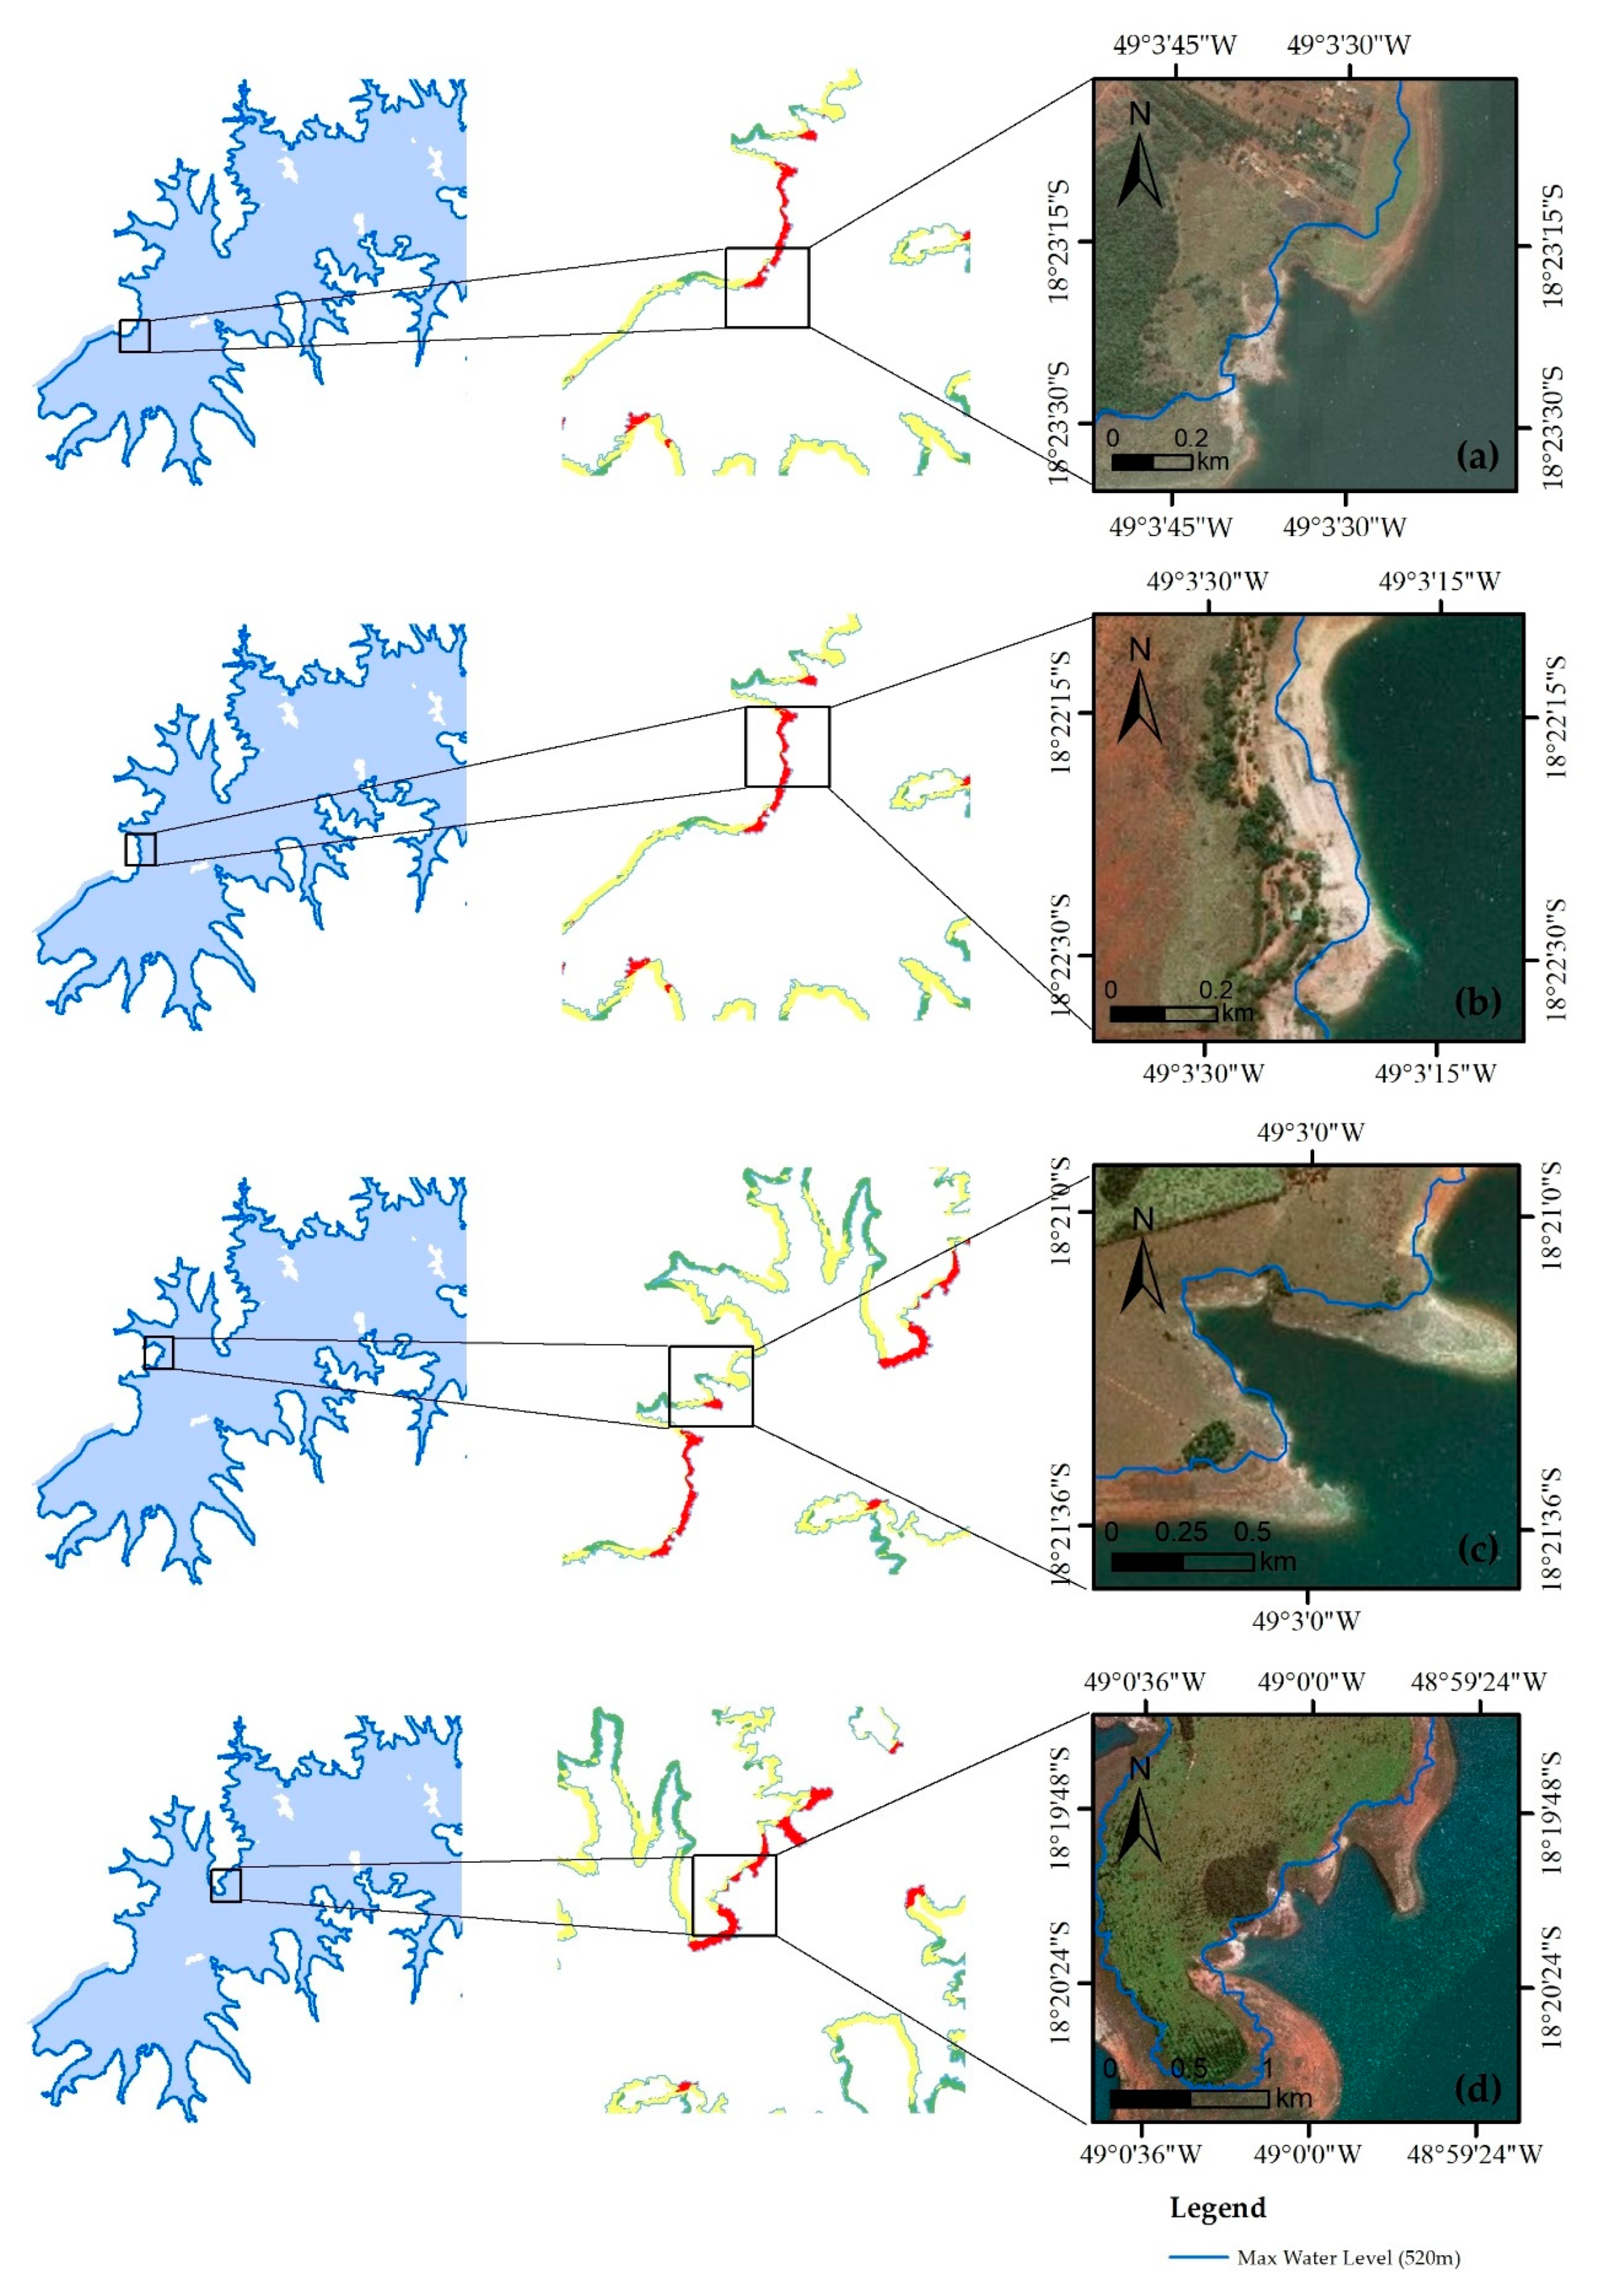
Remote sensing represents a powerful technique for wave erosion investigations, and it was used to confirm the high potential sites on the wave erosivity potential map. Satellite imagery was acquired in December 2015 at the ESRI/ArcGIS World Imagery platform from the GeoEye satellite owned by Digital Globe. Evidence of semicircular or a half ellipse form of small steep banks and exposed soil was verified on imagery as a shoreline erosion feature.Even the concentration of high wave erosivity values on the small buffer strip of the shoreline reservoir, according to Table 2, was found at large erosion sites from remote sensing analysis. Figure 10 shows four large areas with advanced erosive processes that coincide with higher wave erosive potentials.
These sites were denoted as Area 1 (Figure 10a), Area 2 (Figure 10b), Area 3 (Figure 10c), and Area 4 (Figure 10d). Areas 1 and 2 are located in a more critical position of the reservoir. Due to the most frequent occurrences of the main wind direction of 67.5°, the higher fetch and major erosive potential are on the shores. These areas lie in the buffer strips 1 and 2, as illustrated in Figure 8. Areas 3 and 4 were not as affected by the main fetch, and they are located in the buffer strips 3 and 4, as shown in Figure 8.
The management strategy of a shoreline erosion dam reservoir must have awareness of all the main sources of erosive agents, such as wave action [40] and surface runoff [44], which are increased by climate changes [45]. Reservoir managers should also include historical hydrometeorological data in their surveys to evaluate changes in the wind patterns and average precipitation [45]. Shoreline erosions [29] and sediment depositions are a consequence of climate changes [45].
Reservoir managers shall undertake impact assessments to evaluate wave erosivity on the shoreline and the adjacent land, thereby avoiding or reducing environmental problems. This study provides the knowledge with which to choose the effective shoreline erosion control installations, such as nonstructural, structural, bioengineering, and biotechnical [46]. Therefore, this geospatial analysis of shoreline erosion can be used to assist reservoir governance in civil or criminal liabilities for environmental damage.
5. Conclusions
Erosive processes are commonly studied using three different approaches: numerical modeling (GIS-based or non-geospatial analysis), field monitoring and laboratory tests. In this work, a GIS-based model was tested to evaluate the wave erosivity potential due to the wind-generated waves in a Brazilian dam reservoir.
The reservoir of the Itumbiara-GO was the object of this work since previous studies [33,34,37] have verified a high susceptibility to shoreline erosion caused by rainfall. However, it was also necessary to study the influence of the wind.
The conclusions obtained in this paper are as follows:
- The WAVES tool allows the examination of the reservoir shoreline erosion by wave potential and guide reservoir research and management.
- Higher wave erosivity potential areas must be examined with satellite imagery.
- In general, the wind anemometer and acoustic Doppler sensor are appropriate for estimating the wave erosivity potential.
- The method presented by Olson and Ventura [29] is applicable to reservoirs used as hydropower systems located in other countries.
The current work has some limitations, such as not including the qualitative erosion rate by wind-generated waves, the lack comparison from rainfall and runoff ratios with soil erosions, the punctual extrapolation of the wind data to analyses a large reservoir and the short period of time (1 year) for statistical analysis from two wind datasets. Besides, the current geospatial method [29] has successfully highlighted some higher erosivity wave potential areas which coincide with large erosions sites detected by satellite imagery. In addition, wave shoreline susceptibility is needed for better correlations. This research project will continue and estimation of the erosion rate will be included in the future.
The analysis of the wind behavior requires several years of the dataset for better understanding; therefore, a long time period of wind data should be included in upcoming work. However, in this paper, the aim was to compare the two sensors, although they did not show significant differences between wind direction data and wind frequency data, any of which is feasible for this method.
Finally, this methodology may support campaigns to collect soil samples for experimental research, to act as a basis for reservoir governance decisions and to promote interventions such as stabilization installations.
Author Contributions
R.M.V. wrote the paper and analyzed the data; All authors contributed to manuscript writing; M.M.d.A.M., M.M.S., P.d.A.R. and M.P.d.L. revised the manuscript; M.M.d.A.M. and P.d.A.R. contributed to research development; M.M.S. and M.P.d.L. managed the research and development projects.
Funding
This research was funded by Agência Nacional de Energia Elétrica-ANEEL (Brazilian Electricity Regulatory Agency), ANEEL PD.0394-1603/2016.
Acknowledgments
This paper is part of BioEngineering Project (0394-1603/2016) and is financially supported by the Furnas Centrais Elétricas SA, a state-owned company and subsidiary of Eletrobras, and the Agência Nacional de Energia Elétrica-ANEEL (Brazilian Electricity Regulatory Agency). The authors would like to thank the Gerência de Programação Energética e Hidrometeorologia of Eletrobras Furnas for providing the wind data. The authors also greatly appreciate the anonymous reviewers and editors for their constructive and insightful comments in relation to this manuscript.
Conflicts of Interest
The authors declare no conflict of interest.
References
- Huang, C.-C.; Lai, J.-S.; Lee, F.-Z.; Tan, Y.-C. Physical Model-Based Investigation of Reservoir Sedimentation Processes. Water 2018, 10, 352. [Google Scholar] [CrossRef]
- Edil, T.B. Erosion of Coastal Slopes and Landslides. In Proceedings of the Geo-Congress 2013, San Diego, CA, USA, 3–7 March 2013. [Google Scholar] [CrossRef]
- Zhang, Y.; Zhong, P.-A.; Chen, J.; Bing, J.; Xu, D.; Wang, M. Impacts of Climate Change and Human Activities on the Three Gorges Reservoir Inflow. Water 2017, 9, 957. [Google Scholar] [CrossRef]
- Enlow, H.K.; Fox, G.A.; Guertault, L. Watershed Variability in Streambank Erodibility and Implications for Erosion Prediction. Water 2017, 9, 605. [Google Scholar] [CrossRef]
- Ferreira, V.; Panagopoulos, T.; Andrade, R.; Guerrero, C.; Loures, L. Spatial variability of soil properties and soil erodibility in the Alqueva reservoir watershed. Solid Earth 2015, 6, 383–392. [Google Scholar] [CrossRef] [Green Version]
- Su, X.; Nilsson, C.; Pilotto, F.; Liu, S.; Shi, S.; Zenga, B. Soil erosion and deposition in the new shorelines of the Three Gorges Reservoir. Sci. Total Environ. 2017, 599–600, 1485–1492. [Google Scholar] [CrossRef]
- Kondolf, G.M.; Gao, Y.; Annandale, G.W.; Morris, G.L.; Jiang, E.; Zhang, J.; Cao, Y.; Carling, P.; Fu, K.; Guo, Q.; et al. Sustainable sediment management in reservoirs and regulated rivers: Experiences from five continents. Earth’s Future 2014, 2, 256–280. [Google Scholar] [CrossRef]
- Esmaeili, T.; Sumi, T.; Kantoush, S.A.; Kubota, Y.; Haun, S.; Rüther, N. Three-Dimensional Numerical Study of Free-Flow Sediment Flushing to Increase the Flushing Efficiency: A Case-Study Reservoir in Japan. Water 2017, 9, 900. [Google Scholar] [CrossRef]
- Shumba, A.; Gumindoga, W.; Togarepi, S.; Masarira, T.P.; Chikuni, E. A remote sensing and GIS based application for monitoring water levels at Kariba dam. In Proceedings of the EAI International Conference for Research, Innovation and Development for Africa (ACRID), Victoria Falls, Zimbabwe, 20–21 June 2017. [Google Scholar] [CrossRef]
- Abera, F.F.; Asfaw, D.H.; Engida, A.N.; Melesse, A.M. Optimal Operation of Hydropower Reservoirs under Climate Change: The Case of Tekeze Reservoir, Eastern Nile. Water 2018, 10, 273. [Google Scholar] [CrossRef]
- Liu, H.; Deng, B.; Liu, Y.; Jiang, C.; Wu, Z.; Long, Y. Preliminary Numerical Analysis of the Efficiency of a Central Lake Reservoir in Enhancing the Flood and Drought Resistance of Dongting Lake. Water 2018, 10, 225. [Google Scholar] [CrossRef]
- Rahmani, V.; Kastens, J.H.; deNoyelles, F.; Jakubauskas, M.E.; Martinko, E.A.; Huggins, D.H.; Gnau, C.; Liechti, P.M.; Campbell, S.W.; Callihan, R.A.; et al. Examining Storage Capacity Loss and Sedimentation Rate of Large Reservoirs in the Central U.S. Great Plains. Water 2018, 10, 190. [Google Scholar] [CrossRef]
- Forsythe, K.W.; Schatz, B.; Swales, S.J.; Ferrato, L.J.; Atkinson, D.M. Visualization of Lake Mead Surface Area Changes from 1972 to 2009. ISPRS Int. J. Geo-Inf. 2012, 1, 108–119. [Google Scholar] [CrossRef] [Green Version]
- Schleiss, A.J.; Franca, M.J.; Juez, C.; De Cesare, G. Reservoir Sedimentation. J. Hydraul. Res. 2016. [Google Scholar] [CrossRef]
- Elçi, S.; Bor, A.; Çalışkan, A. Using numerical models and acoustic methods to predict reservoir sedimentation. Lake Reserv. Manag. 2009, 25, 297–306. [Google Scholar] [CrossRef] [Green Version]
- Gelagay, H.S. RUSLE and SDR Model Based Sediment Yield Assessment in a GIS and Remote Sensing Environment: A Case Study of Koga Watershed, Upper Blue Nile Basin, Ethiopia. Hydrol. Curr. Res. 2016, 7, 2–10. [Google Scholar] [CrossRef]
- Heathcote, A.J.; Filstrup, C.T.; Downing, J.A. Watershed Sediment Losses to Lakes Accelerating Despite Agricultural Soil Conservation Efforts. PLoS ONE 2013, 8, e53554. [Google Scholar] [CrossRef]
- Lin, C.Y.; Lin, W.T.; Chouc, W.C. Soil erosion prediction and sediment yield estimation: The Taiwan experience. Soil Tillage Res. 2002, 68, 143–152. [Google Scholar] [CrossRef]
- Shen, Z.Y.; Gong, Y.W.; Li, Y.H.; Hong, Q.; Xu, L.; Liu, R.M. A comparison of WEPP and SWAT for modeling soil erosion of the Zhangjiachong Watershed in the Three Gorges Reservoir Area. Agric. Water Manag. 2009, 96, 1435–1442. [Google Scholar] [CrossRef]
- Rohweder, J.; Rogala, J.T.; Johnson, B.L.; Anderson, D.; Clark, S.; Chamberlin, F.; Potter, D.; Runyon, K. Application of Wind Fetch and Wave Models for Habitat Rehabilitation and Enhancement Projects—2012 Update; USACE and USGS-UMESC: La Crosse, WI, USA, 2012; pp. 1–52.
- Menezes, A.V. Proposta Metodológica Para Estudo de Perda de Massa de Solos Situados em Bordas de Reservatório Devido ao Efeito de Ondas Por Meio de um Canal Hidráulico. Masters’s Thesis, University of Goiás, Goiânia, Brazil, 2018. (In Portuguese). [Google Scholar]
- Zheng, J.-W.; Jia, Y.-G.; Liu, X.-L.; Sjan, H.-X.; Zhang, M.-S. Experimental study of the variation of sediment erodibility under wave-loading conditions. Ocean Eng. 2013, 68, 14–26. [Google Scholar] [CrossRef]
- Sandford, L.P.; Gao, J. Influences of Wave Climate and Sea Level on Shoreline Erosion Rates in the Maryland Chesapeake Bay. Estuar. Coast. 2018, 41, 19–37. [Google Scholar] [CrossRef]
- Marques, M.; Andrade, F.O.; Guetter, A.K. Conceito do Campo de Fetch e sua Aplicação ao Reservatório de Itaipu. RBRH 2013, 18, 243–253. (In Portuguese) [Google Scholar] [CrossRef]
- Fonseca, L.A.M.; Lani, J.L.; Fernandes Filho, E.I.; Marques, E.A.G.; Ferreira, W.P.M. Avaliação da erodibilidade de um cambissolo de Juiz de Fora, Minas Gerais. Geotecnia 2016, 136, 143–156. (In Portuguese) [Google Scholar] [CrossRef]
- Mattosinho, G.O. Dissipação de Energia de Ondas Geradas por Vento em Reservatórios de Barragens, Devido à Presença de Vegetação. Masters’s Thesis, UNESP, Ilha Solteira, Brazil, 2016. (In Portuguese). [Google Scholar]
- Kaliraj, S.; Chandrasekar, N.; Magesh, S. Impacts of wave energy and littoral currents on shoreline erosion/accretion along the south-west coast of Kanyakumari, Tamil Nadu using DSAS and geospatial technology. Environ. Earth Sci. 2014, 71, 4523–4542. [Google Scholar] [CrossRef]
- Bheeroo, R.A.; Chandrasekar, N.; Kaliraj, S.; Magesh, N.S. Shoreline change rate and erosion risk assessment along the Trou Aux Biches–Mont Choisy beach on the northwest coast of Mauritius using GIS-DSAS technique. Environ. Earth Sci. 2016, 75, 1–12. [Google Scholar] [CrossRef]
- Olson, E.R.; Ventura, S.J. Geospatial methods to examine shoreline erosion in the Chippewa Flowage: A case study. Lake Reserv. Manag. 2012, 28, 170–175. [Google Scholar] [CrossRef] [Green Version]
- Hernández, J.E.I. Avaliação da Fragilidade das Margens do Reservatório de Ilha Solteira—SP, Utilizando as Geotecnologias como Ferramentas de Análise Ambiental. Masters’s Thesis, UNESP, Ilha Solteira, Brazil, 2014. (In Portuguese). [Google Scholar]
- Luz, M.P.; Beevers, L.C.; Cuthbertson, A.J.S.; Medero, G.M.; Dias, V.S.; Nascimento, D.T.F. The Mitigation Potential of Buffer Strips for Reservoir Sediment Yields: The Itumbiara Hydroelectric Power Plant in Brazil. Water 2016, 8, 489. [Google Scholar] [CrossRef]
- Furnas Centrais Elétricas S/A. Aproveitamento Hidrelétrico de Itumbiara—Relatório Final do Projeto Básico—Volume I—Texto; n°. HE-161-R02-0975; HIDROSERVICE Engenharia Ltda: São Paulo, Brazil, 1974; pp. 1–55. (In Portuguese) [Google Scholar]
- Romão, P.A.; Souza, N.M. Aspectos geológicos e hidrogeológicos na deflagração e evolução da erosão hídrica em margens de reservatórios. In Erosão em Bordas de Reservatório, 1st ed.; Sales, M.M., Camapum de Carvalho, J., Mascarenha, M.M., Luz, M.P., Angelim, R.R., Souza, N.M., Eds.; Gráfica UFG: Goiânia, Brazil, 2017; pp. 153–170. ISBN 978-85-495-0118-9. (In Portuguese) [Google Scholar]
- Sales, M.M. Monitoramento e Estudo de Técnicas Alternativas na Estabilização de Processos Erosivos em Reservatórios de UHEs, 2nd Work Report; FUNAPE: Goiânia, Brazil, 2014; pp. 1–40. (In Portuguese) [Google Scholar]
- Manwell, J.F.; Mcgowan, J.G.; Roges, A.L. Wind Energy Explained: Theory, Design, and Application, 2nd ed.; John Willey and Sons Ltd.: West Sussex, UK, 2010; pp. 46–85. ISBN 978-0-470-01500-1. [Google Scholar]
- Topodata. Available online: http://www.dsr.inpe.br/topodata/ (accessed on 10 January 2018).
- The Beaufort Wind Force Scale. Available online: https://en.wind-turbine-models.com/winds (accessed on 28 August 2018).
- Jesus, A.S.; Sousa, M.S.; Nascimento, D.T.F.; Romão, P.A.; Camapum de Carvalho, J. A influência de aspectos geomorfológicos, de cobertura do solo e climáticos no surgimento e evolução de processos erosivos no entorno de reservatório. In Erosão em Bordas de Reservatório, 1st ed.; Sales, M.M., Camapum de Carvalho, J., Mascarenha, M.M., Luz, M.P., Angelim, R.R., Souza, N.M., Eds.; Gráfica UFG: Goiânia, Brazil, 2017; pp. 172–192. ISBN 978-85-495-0118-9. (In Portuguese) [Google Scholar]
- Kelley, N.D.; Jonkman, B.J.; Scott, G.N.; Pichugina, Y.L. Comparing Pulsed Doppler LIDAR with SODAR and Direct Measurements for Wind Assessment. In Proceedings of the AWEA’s 2007 WindPower Conference, Los Angeles, CA, USA, 3–6 June 2007; pp. 1–21. [Google Scholar]
- Lawson, D.E. Erosion of Northern Reservoir Shores, an Analysis et Application of Pertinent Literature; CRREL, Monograph 85-1; USACE: Hanover, NH, USA, 1985; pp. 35–37.
- Assireu, A.; Pimenta, F.; Souza, V. Assessment of wind power potential of hydroelectric reservoirs. In Energy Resources: Development, Distribution and Exploitation, 1st ed.; Alcantara, E.H., Ed.; INPE: Sao Paulo, Brazil, 2011; pp. 1–28. ISBN 978-1-61324-520-0. [Google Scholar]
- Assireu, A.; Pellegrini, C.C.; Pimenta, F. Intensificação do vento devido a influências do relevo: Evidências a partir de modelos numéricos e medidas in situ. Ciência e Natura 2013. (In Portuguese) [Google Scholar] [CrossRef]
- Pellegrini, C.C.; Neto, A.V.L.; Assis, J.V.B.; Assireu, A. Um Estudo Numérico da Intensificação do Vento em Reservatórios de Centrais Hidroelétricas da Região Sudeste do Brasil. Ciência e Natura 2016, 38, 197–203. (In Portuguese) [Google Scholar] [CrossRef]
- Li, Y.; Huang, T.; Ma, W. Correlation Analysis of Rainstorm Runoff and Density Current in a Canyon-Shaped Source Water Reservoir: Implications for Reservoir Optimal Operation. Water 2018, 10, 447. [Google Scholar] [CrossRef]
- De Souza Dias, V.; Pereira da Luz, M.; Medero, G.M.; Tarley Ferreira Nascimento, D. An Overview of Hydropower Reservoirs in Brazil: Current Situation, Future Perspectives and Impacts of Climate Change. Water 2018, 10, 592. [Google Scholar] [CrossRef]
- Northwest Regional Planning Commission. Shoreline Stabilization Handbook for Lake Champlain and Other Inland Lakes; Lake Champlain Basin Program and US Environmental Protection Agency: St. Albans, VT, USA, 2004; pp. 1–49. ISBN 0-9754546-0-9.
Figure 1.
The study area of the Itumbiara Dam reservoir.

Figure 2.
Shoreline Wave Erosivity Potential flowchart.

Figure 3.
Schematic SPM method to evaluate the wind fetch model.

Figure 4.
The wind rose plots, separated by rainy (a) and dry (b) seasons of SODAR, and rainy (c) and dry (d) seasons for the weather station.
Figure 4.
The wind rose plots, separated by rainy (a) and dry (b) seasons of SODAR, and rainy (c) and dry (d) seasons for the weather station.

Figure 5.
The fetches of the 16 normal wind directions.

Figure 6.
(a) Digital Elevation Model, (b) reclassified Land/Water raster, (c) fetch of 67.5° wind direction, and (d) reclassified raster of the fetch of 67.5°.
Figure 6.
(a) Digital Elevation Model, (b) reclassified Land/Water raster, (c) fetch of 67.5° wind direction, and (d) reclassified raster of the fetch of 67.5°.

Figure 7.
Wave erosivity potential map of the Itumbiara Dam reservoir.

Figure 8.
The area at the shoreline with higher wave erosivity potential from the SODAR sensor data.
Figure 8.
The area at the shoreline with higher wave erosivity potential from the SODAR sensor data.

Figure 9.
Soil erosion susceptibility of the Itumbiara reservoir with field erosion occurrences.

Figure 10.
Satellite imagery of the shoreline of erosion sites that have a direct relationship with high values of wave erosivity potential. (a) Area 1. (b) Area 2. (c) Area 3. (d) Area 4.
Figure 10.
Satellite imagery of the shoreline of erosion sites that have a direct relationship with high values of wave erosivity potential. (a) Area 1. (b) Area 2. (c) Area 3. (d) Area 4.


Table 1.
Beaufort Wind Scale 1.
| Force | Wind Speed (m/s) | Wind Descriptive Terms |
|---|---|---|
| 0 | <0.3 | Calm |
| 1 | 0.3 to 1.5 | Light air |
| 2 | 1.6 to 3.3 | Light breeze |
| 3 | 3.4 to 5.4 | Gentle breeze |
| 4 | 5.5 to 7.9 | Moderate breeze |
| 5 | 8.0 to 10.7 | Fresh breeze |
| 6 | 10.8 to 13.8 | Strong breeze |
| 7 | 13.9 to 17.1 | High wind |
| 8 | ≥17.1 | Gale |
Notes: 1 Winds on the Beaufort scale [37].
Table 2.
Wave Erosivity Potential of the Itumbiara-GO reservoir perimeter.
| Class | m | km | (%) |
|---|---|---|---|
| Low | 1,088,811 | 1089 | 64% |
| Medium | 590,483 | 590 | 34% |
| High | 33,820 | 34 | 2% |
© 2019 by the authors. Licensee MDPI, Basel, Switzerland. This article is an open access article distributed under the terms and conditions of the Creative Commons Attribution (CC BY) license (http://creativecommons.org/licenses/by/4.0/).
Share and Cite
MDPI and ACS Style
Vilhena, R.M.; Mascarenha, M.M.d.A.; Sales, M.M.; Romão, P.d.A.; Luz, M.P.d. Estimating the Wind-Generated Wave Erosivity Potential: The Case of the Itumbiara Dam Reservoir. Water 2019, 11, 342. https://doi.org/10.3390/w11020342
AMA Style
Vilhena RM, Mascarenha MMdA, Sales MM, Romão PdA, Luz MPd. Estimating the Wind-Generated Wave Erosivity Potential: The Case of the Itumbiara Dam Reservoir. Water. 2019; 11(2):342. https://doi.org/10.3390/w11020342
Chicago/Turabian StyleVilhena, Ricardo Moreira, Márcia Maria dos Anjos Mascarenha, Maurício Martines Sales, Patrícia de Araújo Romão, and Marta Pereira da Luz. 2019. "Estimating the Wind-Generated Wave Erosivity Potential: The Case of the Itumbiara Dam Reservoir" Water 11, no. 2: 342. https://doi.org/10.3390/w11020342
Note that from the first issue of 2016, this journal uses article numbers instead of page numbers. See further details here.