Article

A Study of the Impact of Different Flow Velocities and Light Colors at the Entrance of a Fish Collection System on the Upstream Swimming Behavior of Juvenile Grass Carp

1
State Key Laboratory of Simulation and Regulation of Water Cycle in River Basin, China Institute of Water Resources and Hydropower Research, Beijing 100038, China
2
China Water International Engineering Consulting Co., LTD, Beijing 100053, China
*
Author to whom correspondence should be addressed.
Xiangpeng Mu and Wanyue Zhen contributed equally to this work.
Water 2019, 11(2), 322; https://doi.org/10.3390/w11020322
Submission received: 17 January 2019 / Revised: 4 February 2019 / Accepted: 12 February 2019 / Published: 14 February 2019
(This article belongs to the Section Water Quality and Contamination)

Abstract

:
When designing a fish collection system for fishpass facilities, considering the approach–avoidance behavior of fish under different flow velocities and light colors, is essential to ensure a good fishpass efficiency. In this study, a generalized physical model for a fish collection system entrance, including the fish collection system channel, the fish luring channel, and the mainstream channel was designed. Grass carp, a representative fish of “four major Chinese carps”, was selected as the research object, and the approach–avoidance behavior of 660 juvenile grass carps (8–12cm), under different flow velocity and light color at a water temperature of 28 ± 1 °C, were investigated. Three general indicators that reflect the fish-luring ability of a fish collection system were proposed, including the optimal flow velocity at the fish collection system entrance, the optimal ratio between the flow velocities at the entrances of the fish luring channel and the fish collection system channel, and the optimal light colors for approach–avoidance behaviors of the fish. Results indicate that (1) there was an optimal flow velocity (approximately 0.3 m/s) at the fish collection system entrance; (2) there existed an optimal ratio (approximately 2.3:1) between the flow velocities at the entrances of the fish luring channel and the fish collection system channel; (3) there were different approach–avoidance behaviors of the fish to various light colors, and the percentages of successful migration of the juvenile grass carps were 0.4%, 0.57%, 0.88%, and 1.43% of that obtained under natural light, when red, white, green, and blue light were used, respectively, at the fish collection system entrance, indicating that the juvenile grass carps would avoid the red light while approaching the blue light. The three proposed general indicators are the keys in the design of a fish collection system entrance, for successful migration of grass carps. The generalized physical model and the experimental devices and methods will provide important references for studying a fish collection system entrance for other fish species.

1. Introduction

China has about 98,000 reservoir dams, which is the highest number for any country in the world. More than 270,000 of these water conservancy facilities, such as water gates and weirs have a flow rate of over 1 m3/s [1]. The connectivity of rivers and lakes has been destroyed, and the passage of migratory fish in the original rivers has been intercepted as a result of these water conservancy facilities, which have been designed to meet the requirements of flood control and power generation, resulting in the fragmentation of rivers and fish habitats, which, in turn, leads to a decline of fish in rivers [2,3,4,5,6]. In the 1960s, the construction of the Chao Lake Gate blocked the migration route of fish, from the Yangtze River to the Chao Lake, which led to a 93% reduction in fishery production in the Chao Lake. The production of freshwater fish in the Yangtze River had reduced by 40%–80%, as a result of the construction of the Gezhouba Dam in the 1980s, and the Chinese Sturgeon, which is a Class I nationally protected animal in China, is on the verge of extinction [7]. The ecological crisis of fish populations, caused by the obstruction of migratory channels, is not only serious in China, but it is also widespread, around the world. According to the UN World Water Development Report in 2003, the global freshwater fish species has gradually been reduced to about 70% of the level that existed in the 1970s, due to the development of hydropower industries [8]. Therefore, it is imperative to improve river connectivity and improve the living environment of the fish. Fishpass facilities are important pathways for fish to pass through migration obstacles, such as water conservancy hubs, and they are of great importance for the protection of fish resources and the restoration of river ecosystem services [9].
As early as more than 300 years ago, the concept of fishways has been proposed in Western Europe [10]. Since 1909, after the first use of the hydraulics principles in Belgium for designing the Denil Fishway, the importance of hydraulics in the design of fishways has received attention, and studies on fishway hydraulics, and related behaviors of fish have been developed [11,12]. Developed countries in Europe and America have successively built a series of fishways, fish locks, fish elevators, fish ladders, and other fishpass facilities. Compared to these countries, the construction of fishpass facilities and research in this area started a little later in China. In 1958, the first fishway in China was built during the construction of the Fuchunjiang Project in the Zhejiang Province of China. In 1960 and 1962, the Xinkailiu Fishway and the Liyugang Fishway were built in the Heilongjiang Province, in China. In 1980, a fishway with a fish collection system was built in the Hunan Province, China. After entering the 21st century, research on, and construction of fishpass facilities, have rapidly advanced with the development of water conservancy and hydropower industries, as well as the enhancement of eco-environmental awareness in China.
According to current statistics, less than 50% of the fishpass facilities in the world can be effectively used. The main reason for this is that it is difficult for the fish to overcome water flow obstacles, when passing through fishpass facilities [12,13,14,15]. This is explained by two facts. First, there are water flow obstacles inside the fishpass facilities, including flow velocities which exceed the swimming capacities of the fish and cause unfavorable flow patterns, which cause the fish to lose their sense of direction while swimming. Second, there also exist water flow obstacles near the fish collection system entrance of the fishpass facilities, which mainly include complicated flow patterns at the entrance that prevent the fish from finding the entrance, thus, leading to a failure of migrations. Indeed, if the fish cannot be lured into the fishpass facilities, even if there are good fishpass conditions inside the facilities, the fishpass efficiency will not be improved. Attracting fish into the fishpass facilities is a major problem. Therefore, the fish collection system is very important for these facilities, as it determines the success or failure of the facility.
During an engineering practice, the most common fish collection method is to use water flow to attract the fish. The entrance of the fish collection system is often arranged near the spillway or the tailwater of a hydropower station to take advantage of the luring effect of the discharge flow of the hydropower station. Bunt [16] remodeled the position of the entrance of the fishway at the Mannheim Weir and improved the flow pattern near the fishway entrance by changing the shape of the entrance; this has achieved good results. Earlier, Power [17] had found that fish were easily attracted by a flow of water over water-blocking obstacles or a hydraulic drop. The fishway entrance of the Isohaara Dam at the Kemijoki estuary in northern Finland was modified by changing the shape of the entrance, forming a hydraulic drop to attract the fish [18]. In addition, it was demonstrated that a good fish-luring effect was obtained by adjusting the cross-sectional area of the fishway entrance to increase the flow velocity at the entrance [19,20,21]. The fishway at the Shangzhuang Gate in Beijing had two pressurized water pumps on both sides of the entrance to spray water along both sides of the fishway, to attract fish into the fishway. An auxiliary water system was installed at the fish inlet and the fish outlet, to improve the fishpass efficiency [22]. Two water-spraying pipes were installed on both sides of the fishway, at the Laolongkou Project in Jilin Province, China, and water was sprayed along both sides of the fishway, to attract fish [23]. The Nanxi River Barrier Gate in the Zhejiang Province, China had a partition wall between the tailrace and the entrance of the fishway, and the shape of the entrance was set to a narrow slit to increase the flow velocity at the entrance of the fishway [24]. Although people have realized that the water flow near the fish collection system entrance plays an important role in attracting fish and collecting fish, and many engineering applications have been conducted, current research results on the flow that attracts fish are still based on engineering experience, with a lack of support from theoretical quantitative research results. Therefore, it is still difficult to guide the design of the entrance of fish collection systems directly, based on the existing research results.
Fish luring technology using light has shown good results in the fishery industry, and it has been widely used in fish farming and trapping, including the use of light luring technology in the Gulf of Mexico, to improve on traditional fishing capacities [25]. Therefore, the known approach and avoidance behavior of fish under different light colors, also show a technical feasibility of being applied to the design of the fish collection system entrances. For example, the second hydropower station of the Bonneville Dam has utilized light to attract fish into a bypass fish collection system [26]. However, different fish species have different approach–avoidance behavior under different light colors, light intensities, and stroboscopic light, and research on this area is still rare.
In view of the above problems, the objective of this study is to use controllable laboratory conditions to carry out research on the response of fish swimming behavior to water flow and light color, to propose and quantify the general indicators that reflect the fish-luring ability of a fish collection system, and to develop general experimental methods for design of a fish collection system entrance. A generalized physical model of a fish collection system was designed in this study. Juveniles of grass carp, a representative fish of each the four major Chinese carp categories (i.e., black carp, grass carp, silver carp, and bighead carp) were studied, to explore the impacts of flow velocity and light color at a fish collection system entrance, on the upstream swimming behavior of juvenile grass carps. The optimal flow velocity at the fish collection system entrance, as well as the optimal ratio between the flow velocity at the entrance of the fish-luring channel and at the fish collection system entrance, were quantified. The approach–avoidance behavior of juvenile grass carp, under different light colors, were revealed and quantitatively identified. This study provides theoretical support for the design and engineering practices of a fish collection system entrance at fishpass facilities, in which the four major Chinese carps are the main fishpass target. Moreover, the experiment can help create a protocol that can be useful in many other projects on a fish collection system entrance. The structure of this paper is as follows—the experimental section in Section 2 includes the test equipment, the test fish, and the environment and test methods; the results are presented and discussed in Section 3, in which the impacts of flow velocity and light color at the fish collection system entrance on the upstream swimming behavior of juvenile grass carps were quantitatively identified; the conclusions are presented in Section 4.

2. Materials and Methods
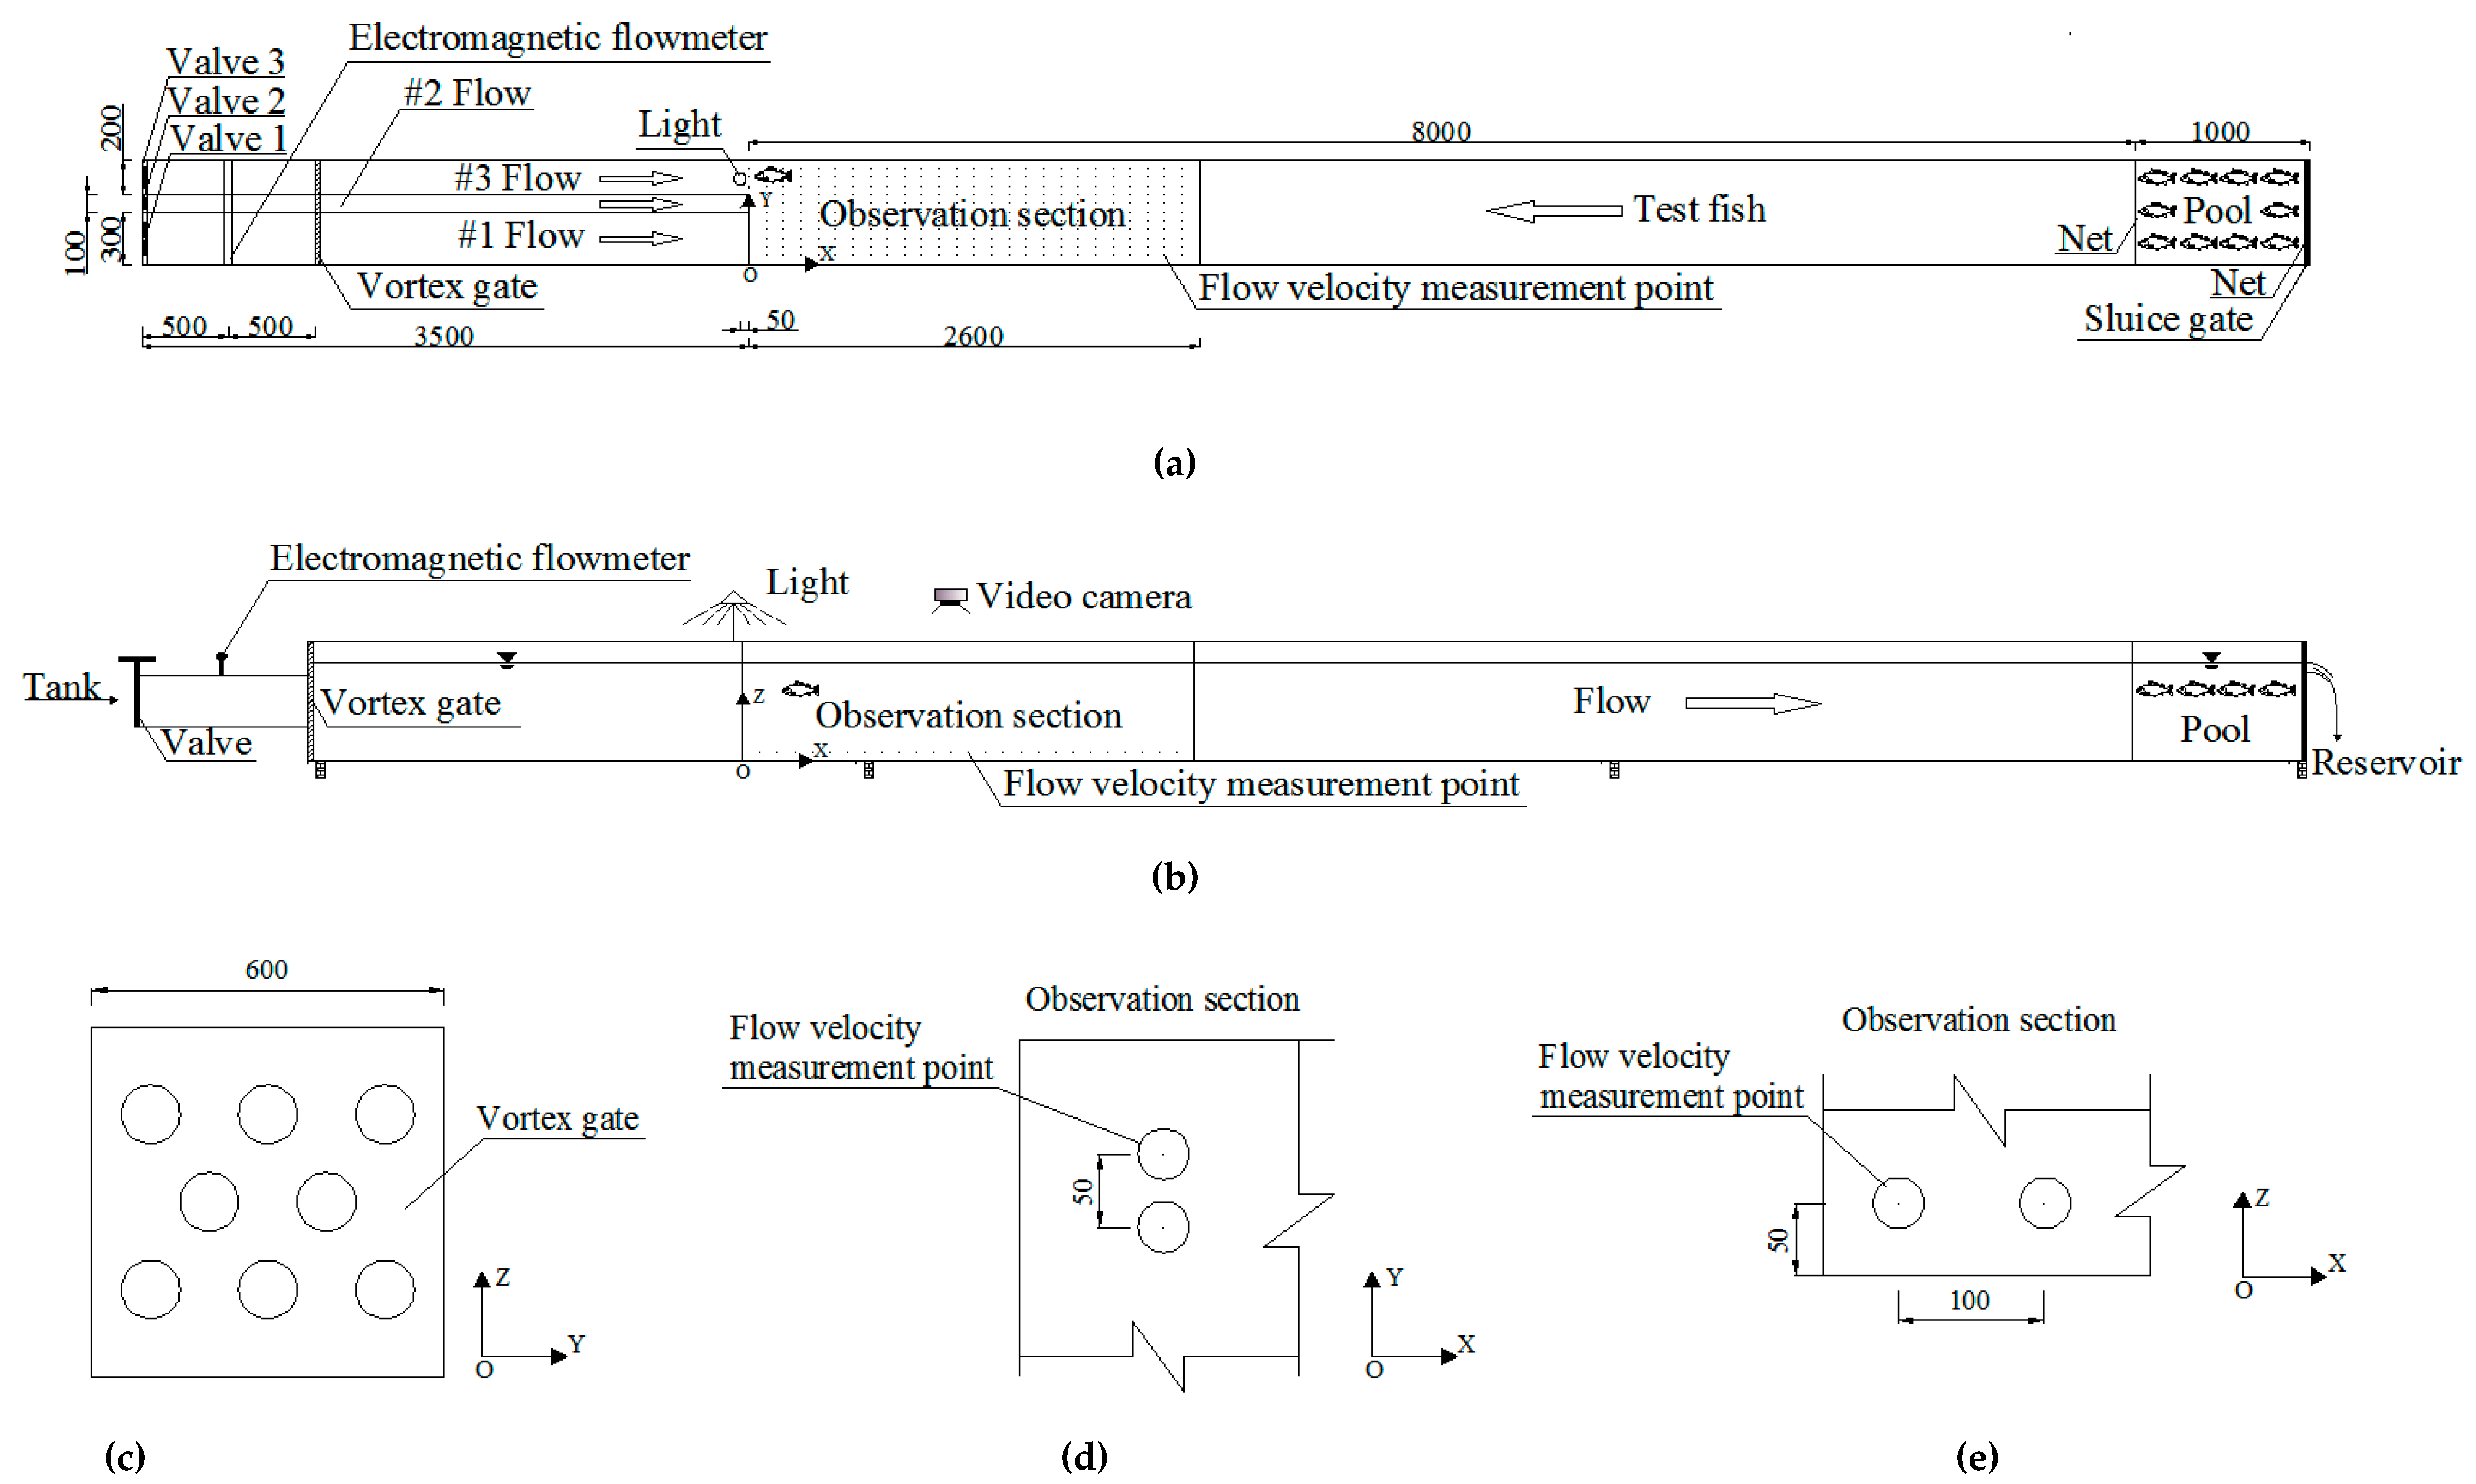
2.1. Test Equipment

When designing a fish collection system entrance, it is usually necessary to add an auxiliary water system to increase the flow velocity at this location, so that the fish can find the entrance via the stimulation from the water flow. Generally, there are three types of auxiliary water systems for the fishpass facilities [27,28,29]. In the first type, the water flow at the fishpass facility is merged with the fish-luring flow, in the flow mixing pool, which is discharged at the fish collection system entrance. In the second type, a fish collection corridor system is set up at the entrance of the tailwater of the hydropower station, supplemented by the fish-luring flow, so that the fish are guided to enter the fish collection system, along the fish collection corridor. In the third type, the fish-luring channel is set beside the fish collection system, and the fish luring flow changes the distribution of flow velocity at the entrance, by submerging the jets, so as to attract the fish to gather near the fish collection system entrance. The first two types of auxiliary water systems have special requirements for terrain and engineering conditions and so lack universality, while the third type is relatively simple and can be applied to any type of fishpass facility [13].
Our generalized model of a fish collection system was designed according to the third type of auxiliary water system, in view of its wide applicability. The mainstream channel (#1), the fish collection system channel (#3), and the fish-luring channel (#2) were generalized into three flow channels, with different widths and adjustable flow velocities arranged in parallel. An illustration of the overall arrangement is shown in Figure 1. As shown in the figure, a circulating water supply system was applied in the model. The area upstream of the device was supplied by a tank with a maximum flow rate of 0.3 m3/s, and the water flowing out from the end of the device entered the underground reservoir. Each flow channel was supplied with water through a pressurized pipe, and their flow rates were measured by an electromagnetic flowmeter. A vortex gate was used to obtain a uniform and stable flow field, downstream of the orifice plate. The flow rate and flow velocity of each flow channel were adjusted by the control valves on the three pipes. There was a fish pool at the end of the sink, and there was a net, before and after the fish pool. The water level sluice gate was installed downstream of the fish pool, to adjust the water depth of the sink. The water depth in the experiment was controlled at 12 ± 0.5 cm.
Flow channel #3 was 200 mm wide and was placed on the left side of the sink, to simulate the flow at the fish collection system entrance, so as to attract the fish to enter the fish collection system. The range of flow velocity was 0–1.0 m/s. Flow channel #2 was arranged in the middle, with a width of 100 mm, simulating the fish-luring flow in the form of a submerged jet, and the range of flow velocity was 0–1.2 m/s. Flow channel #1 was 300 mm wide, simulating the main stream of the river or the tailwater of the hydropower station, and the range of flow velocity was 0–0.6 m/s. The area downstream of the three flow channels, with a flow length of 2,600 mm, was the observation section, and was used for the observation and analysis of the impacts of flow velocity at the fish collection system entrance, on the upstream swimming behavior of the fish.
The flow field in the observation section was measured by the Doppler electromagnetic current meter. The coordinate system is shown in Figure 1. The direction along the water flow was the x-axis, the direction perpendicular to the water flow was the y-axis, and the direction along the water depth was the z-axis. The flow velocity measurement points were arranged every 50 mm, in the y direction, and the measuring points were arranged every 100 mm, in the x direction. Each flow velocity measuring point was 50 mm from the bottom of the sink, in the direction along the z-axis. A camera was placed above the test area to record the entire upstream migration process. A monochrome LED light was placed 50 mm above the entrance of flow channel #3, and the illumination was about 1–150 lx.

2.2. Test Fish and Environment

In China, more attention has been paid to the rare freshwater migratory species, such as Chinese sturgeon, schizothorax, and the mullet, than the economic fish species, such as the “four major Chinese carps”, which belong to the typical freshwater semi-migratory species. The migration of the “four major Chinese carps” can be divided into three categories—spawning migration, feeding migration, and wintering migration, according to the purpose of migration. From March to June, the “four major Chinese carps” cluster and migrate to the spawning grounds of the mainstream of the rivers, for reproduction, usually up to 500–1000 kilometers along the Yangtze and the Xijiang rivers. From July to October, they migrate to river bays, tributaries, or river-connected lakes where food is abundant, for feeding and fattening after reproduction. From November to February of the following year, when water levels of the lakes decline, they return to the deep water areas or deep rock pits in the mainstream of rivers, for wintering. At present, there are few fishway projects built for connecting the habitats of the “four major Chinese carps”, resulting in a sharp fall of the Chinese carp resources, year by year. The Bulletin on Ecological and Environmental Monitoring of the Three Gorges Project of the Yangtze River showed that from May to July 2012, the fry-runoff of the four major Chinese carps in the Jianli Section, decreased by 96.2%, compared to the average before the start of water storage (1997–2002) [30]. In recent years, the fry-runoff of the four carps has recovered partially, due to the proliferation and release policies in China, but the fry-runoff of these carps in the Jianli Section in 2016 was still only 53.1%, which was same as the numbers before the water storage began in the Three Gorges [31]. Moreover, artificial breeding and inbreeding, for multiple generations, have resulted in premature sexual maturity, small individuals, poor disease resistance, and the germplasm being seriously degraded. These led to a decline of the economic traits of the Chinese carps. Therefore, it is imperative to protect these four Chinese carps and conduct researches on the fishpass facilities that house them.
As the swimming capabilities of fish are directly proportional to their body lengths, the swimming capabilities of juvenile fish are weaker than those of adult fish [32], so it is more practical to conduct research on fishpass facilities for juvenile fish. Hu et al. [33] conducted a survey and found that the body length of the juveniles of “four major Chinese carps”, ranged from 5 cm to 15 cm, and the average water temperature of the lake estuaries was 28–30 °C, from mid-July to the end of August, when the Chinese carps migrated into the Poyang Lake for feeding. Therefore, in this study, the juvenile Chinese carps that were about 5 cm—15 cm long during the feeding migration period, were selected as the research object. Additionally, because the swimming capabilities of the “four major Chinese carps”—all of which belong to the Cyprinidae family—are similar (with a similar body length), these juvenile grass carps were investigated in this study, to explore the general indicators that reflect the fish-luring ability of the fish collection system and the test methods for promotion, which will be extended to other species in the future.
The test fish were collected using a fishing net, in a fishery in Beijing, and were transported to the test site through professional aquatic transport container. The test fish were collected in mid-August, and the test was conducted in late August. The body length ranged from 8 cm to 12 cm. The body length of the test fish and the test time were in accordance with the conditions of the juvenile Chinese carps in the period of feeding migration. The total number of juvenile grass carps was 660.
According to the domestication and holding requirements for fish physiological tests, the test fish were placed in a rectangular pool (2.0 m × 1.5 m × 1.0 m) for two weeks before the test. The holding water was tap water, with five days of aeration, and the water temperature was 28 ± 1 °C. The concentration of dissolved oxygen was maintained above 6.50 mg/L, and the concentration of ammonia nitrogen was below 0.01 mg/L. Indoor natural light was used as the light source. Feeding was stopped two days before the test. The conditions of holding and testing were basically consistent with the conditions of natural water environments, during the feeding migration of the fish, in the period of July–August.

2.3. Test Methods

2.3.1. Measuring the Optimal Flow Velocity at the Entrance of the Fish Collection System

An appropriate flow velocity at the entrance of a fish collection system, is a priority for determining the hydraulic design of a fish collection system. The test was divided into two cases. In both cases, the flow velocity of flow channel #1 was fixed, the flow channel #2 was closed, and the flow velocity was gradually increased in flow channel #3, within a certain range. In Case 1, the flow velocity of the flow channel #1 was set to 0.1 m/s, and a range of the flow velocity of the flow channel #3 was set to 0.2–0.7 m/s. The flow velocity of flow channel #3 was continuously varied, and the percentage of successful migration of the test fish in flow channel #3 was recorded. In Case 2, the flow velocity of flow channel #1 was set to 0.2 m/s, and the range of the flow velocity of flow channel #3 was set to 0.2–0.7 m/s. The flow velocity of flow channel #3 was continuously varied, and the percentage of successful migration of the test fish in flow channel #3 was recorded. The flow velocities in each channel, for the two cases, are shown in Table 1. The optimal flow velocity at the fish collection system entrance was determined on the basis of the percentage of successful migration of the test fish, through flow channel #3. According to the selection of test time reported by Aoki et al. [34], this study also found that the percentages of successful migration were almost the same when the test time was set at 20 min or 300 min. Therefore, the longest observation time of each test in this study, under each combination of flow velocities, was set at 20 min. Ten fish were used in each test, and the test was repeated three times, for each combination of flow velocities. The test fish were not reused. Therefore, the total number of tests was 10, and the total number of fish used was 2 × 5 × 10 × 3 = 300. The percentage of successful migration in each flow channel, was recorded, and its average was obtained. The percentage of successful migration of each channel was calculated as R r = F C / F T × 100 % , where F C was the number of fish successfully entering a channel in each test, and F T was the total number of fish per test (i.e., 10).

2.3.2. Measuring the Optimal Ratio between the Flow Velocities at the Fish-Luring Channel and at the Entrance of the Fish Collection System

When designing the fish-luring flow, an appropriate flow velocity of the fish-luring channel is the key to ensure the fishpass efficiency of the fish collection system. In order to increase the luring efficiency, flow channel #2 was used to release the fish-luring flow of water. In this test, the flow velocities of flow channel #1 and flow channel #3 were fixed (determined according to the optimal flow velocity at the fish collection system entrance). The range of the fish-luring flow velocity was set to 0.1–0.8 m/s, and the test was carried out in groups, to observe the fishpass efficiency of flow channel #3. The flow velocities of each channel in Case 3 are shown in Table 2. We used 10 fish in each test, and the maximum observation time of each test was 20 min. The experiment was repeated three times for each combination of flow velocities. The test fish were not reused. A total of 6 trials and 6 × 10 × 3 = 180 fish were used. The percentage of successful migration of the test fish in flow channel #3 was recorded. The ratio between the flow velocity in flow channel #2 and that in flow channel #3, when the highest percentage of successful migration was obtained, was calculated. This was the optimal ratio between the flow velocities at the entrance of the fish-luring channel and at the fish collection system entrance.

2.3.3. Measuring Approach–Avoidance Behavior of Fish under Different Light Colors

The experiment of attracting fish using light was further conducted, on the basis of the above results. In order to minimize the influence of water flow, the velocities of flow channel #1 and flow channel #3 were set on the basis of Case 1 and Case 2. The red, white, green, and blue lights were arranged near the entrance of flow channel #3. The fishpass efficiency in flow channel #3 was observed, and the percentage of successful migration of the test fish in flow channel #3 was calculated. The results were compared with those obtained using natural light. Ten fish in each test were used. The recording and timing were started when the fish were released. The maximum observation time of each test was 20 min; the number of test fish that entered the fish collection system successfully and the corresponding time for each successful migration were recorded. The percentage of successful migration was calculated, and the migration path was drafted. Each test was repeated three times. The test fish were not reused. There was a total of six trials, using 6 × 10 × 3 = 180 fish. The average of the percentage of successful migration of each test was calculated. These results were compared with each other and evaluated.

3. Results and Discussion

3.1. Impact of Flow Velocity

3.1.1. Measurement of the Optimal Flow Velocity at the Entrance of the Fish Collection System

A flow velocity barrier is formed when the flow velocity of the mainstream channel is too large. When this happens, fish generally choose to complete their upstream migration along the shore [35], as shown in Figure 7. The range of the flow velocity, along the shore of the mainstream channel was about 0.1–0.2 m/s. Therefore, the flow velocity at the fish collection system entrance must be higher than that along the shore of the mainstream channel, in order to attract fish into the fish collection system, thereby, improving the fishpass efficiency of the fishpass facilities. Therefore, the test was divided into two cases.
The results in the two cases showed that when the flow velocity of flow channel #1 was constant, the percentage of successful migration of the test fish in flow channel #3 first increased, and then decreased as we increased the flow velocity of flow channel #3, as shown in Figure 2. When the flow velocity of flow channel #3 was 0.2 m/s, the percentages of successful migration of the test fish in flow channel #1 and flow channel #3 were almost the same, and the upstream migration of the test fish had a certain randomness; when the flow velocity of flow channel #3 was 0.3 m/s, the highest percentage of successful migration was observed. When the flow velocity of the flow channel #3 was 0.3 m/s, and the flow velocities of flow channel #1 were set to 0.1 m/s and 0.2 m/s, the percentages of successful migration of the test fish were 68% and 63%, respectively. These were higher than the percentages obtained when the flow velocities of flow channel #3 were 0.2 m/s and 0.4 m/s, by 20%–32% and 25%–27%, respectively. When the flow velocity of flow channel #3 was greater than 0.3 m/s, the percentage of successful migration of the test fish in flow channel #3 decreased, gradually, with increasing flow velocity. When the flow velocity of flow channel #3 was 0.7 m/s, the percentage of successful migration of the test fish was only 3%–7%. In this situation, the flow velocity of flow channel #3 was close to the critical swimming speed of the test fish, and most of the test fish could not migrate in flow channel #3; some fish were forced downstream, and some entered flow channel #1.

3.1.2. Measurement of the Optimal Ratio between the Flow Velocities at the Entrance of the Fish-Luring Channel and at the Entrance of the Fish Collection System.

The flow velocity of flow channel #1 was set to 0.1 m/s, and the flow velocity of flow channel #3 was set to 0.3 m/s, which was the optimal flow velocity at the fish collection system entrance. According to the above results, the percentage of successful migration of the test fish in flow channel #3 was 68%.
The ratios between the flow velocities at the entrance of the fish-luring channel and at the fish collection system entrance were obtained. The relationship between the percentage of successful migration in flow channel #3 and the ratio of the flow velocity is shown in Figure 3. The percentage of successful migration of the test fish in flow channel #3 increased gradually; as the ratio of the flow velocity increased, the percentage of successful migration of the test fish in flow channel #3 increased, gradually. When the ratio was increased to 2.3:1, the highest fish-luring efficiency of the flow at the fish collection system entrance was obtained with a percentage of successful migration of 84%, which was about 1.2 times that obtained without the fish-luring channel. When the ratio was further increased to 2.7:1, the flow velocity at the entrance of the fish-luring channel was close to the critical swimming speed of the test fish. The fish-luring flow formed a strong jet, mixed with the water flow of flow channels #1 and #3, downstream of the exit of the channel, forming a water flow barrier before the entrance of flow channel #3. The percentage of successful migration of the test fish in flow channel #3 decreased to, approximately, 10%, which was 74% lower than that obtained when the ratio was 2.3:1. It could be seen that a suitable fish-luring flow helped to increase the attractiveness of the fish collection system entrance to the fish, and there existed an optimal ratio between the flow velocities at the entrance of the fish-luring channel and at the fish collection system entrance; this ratio was 2.3:1 for the test fish in this study.

3.2. Impact of Light Color

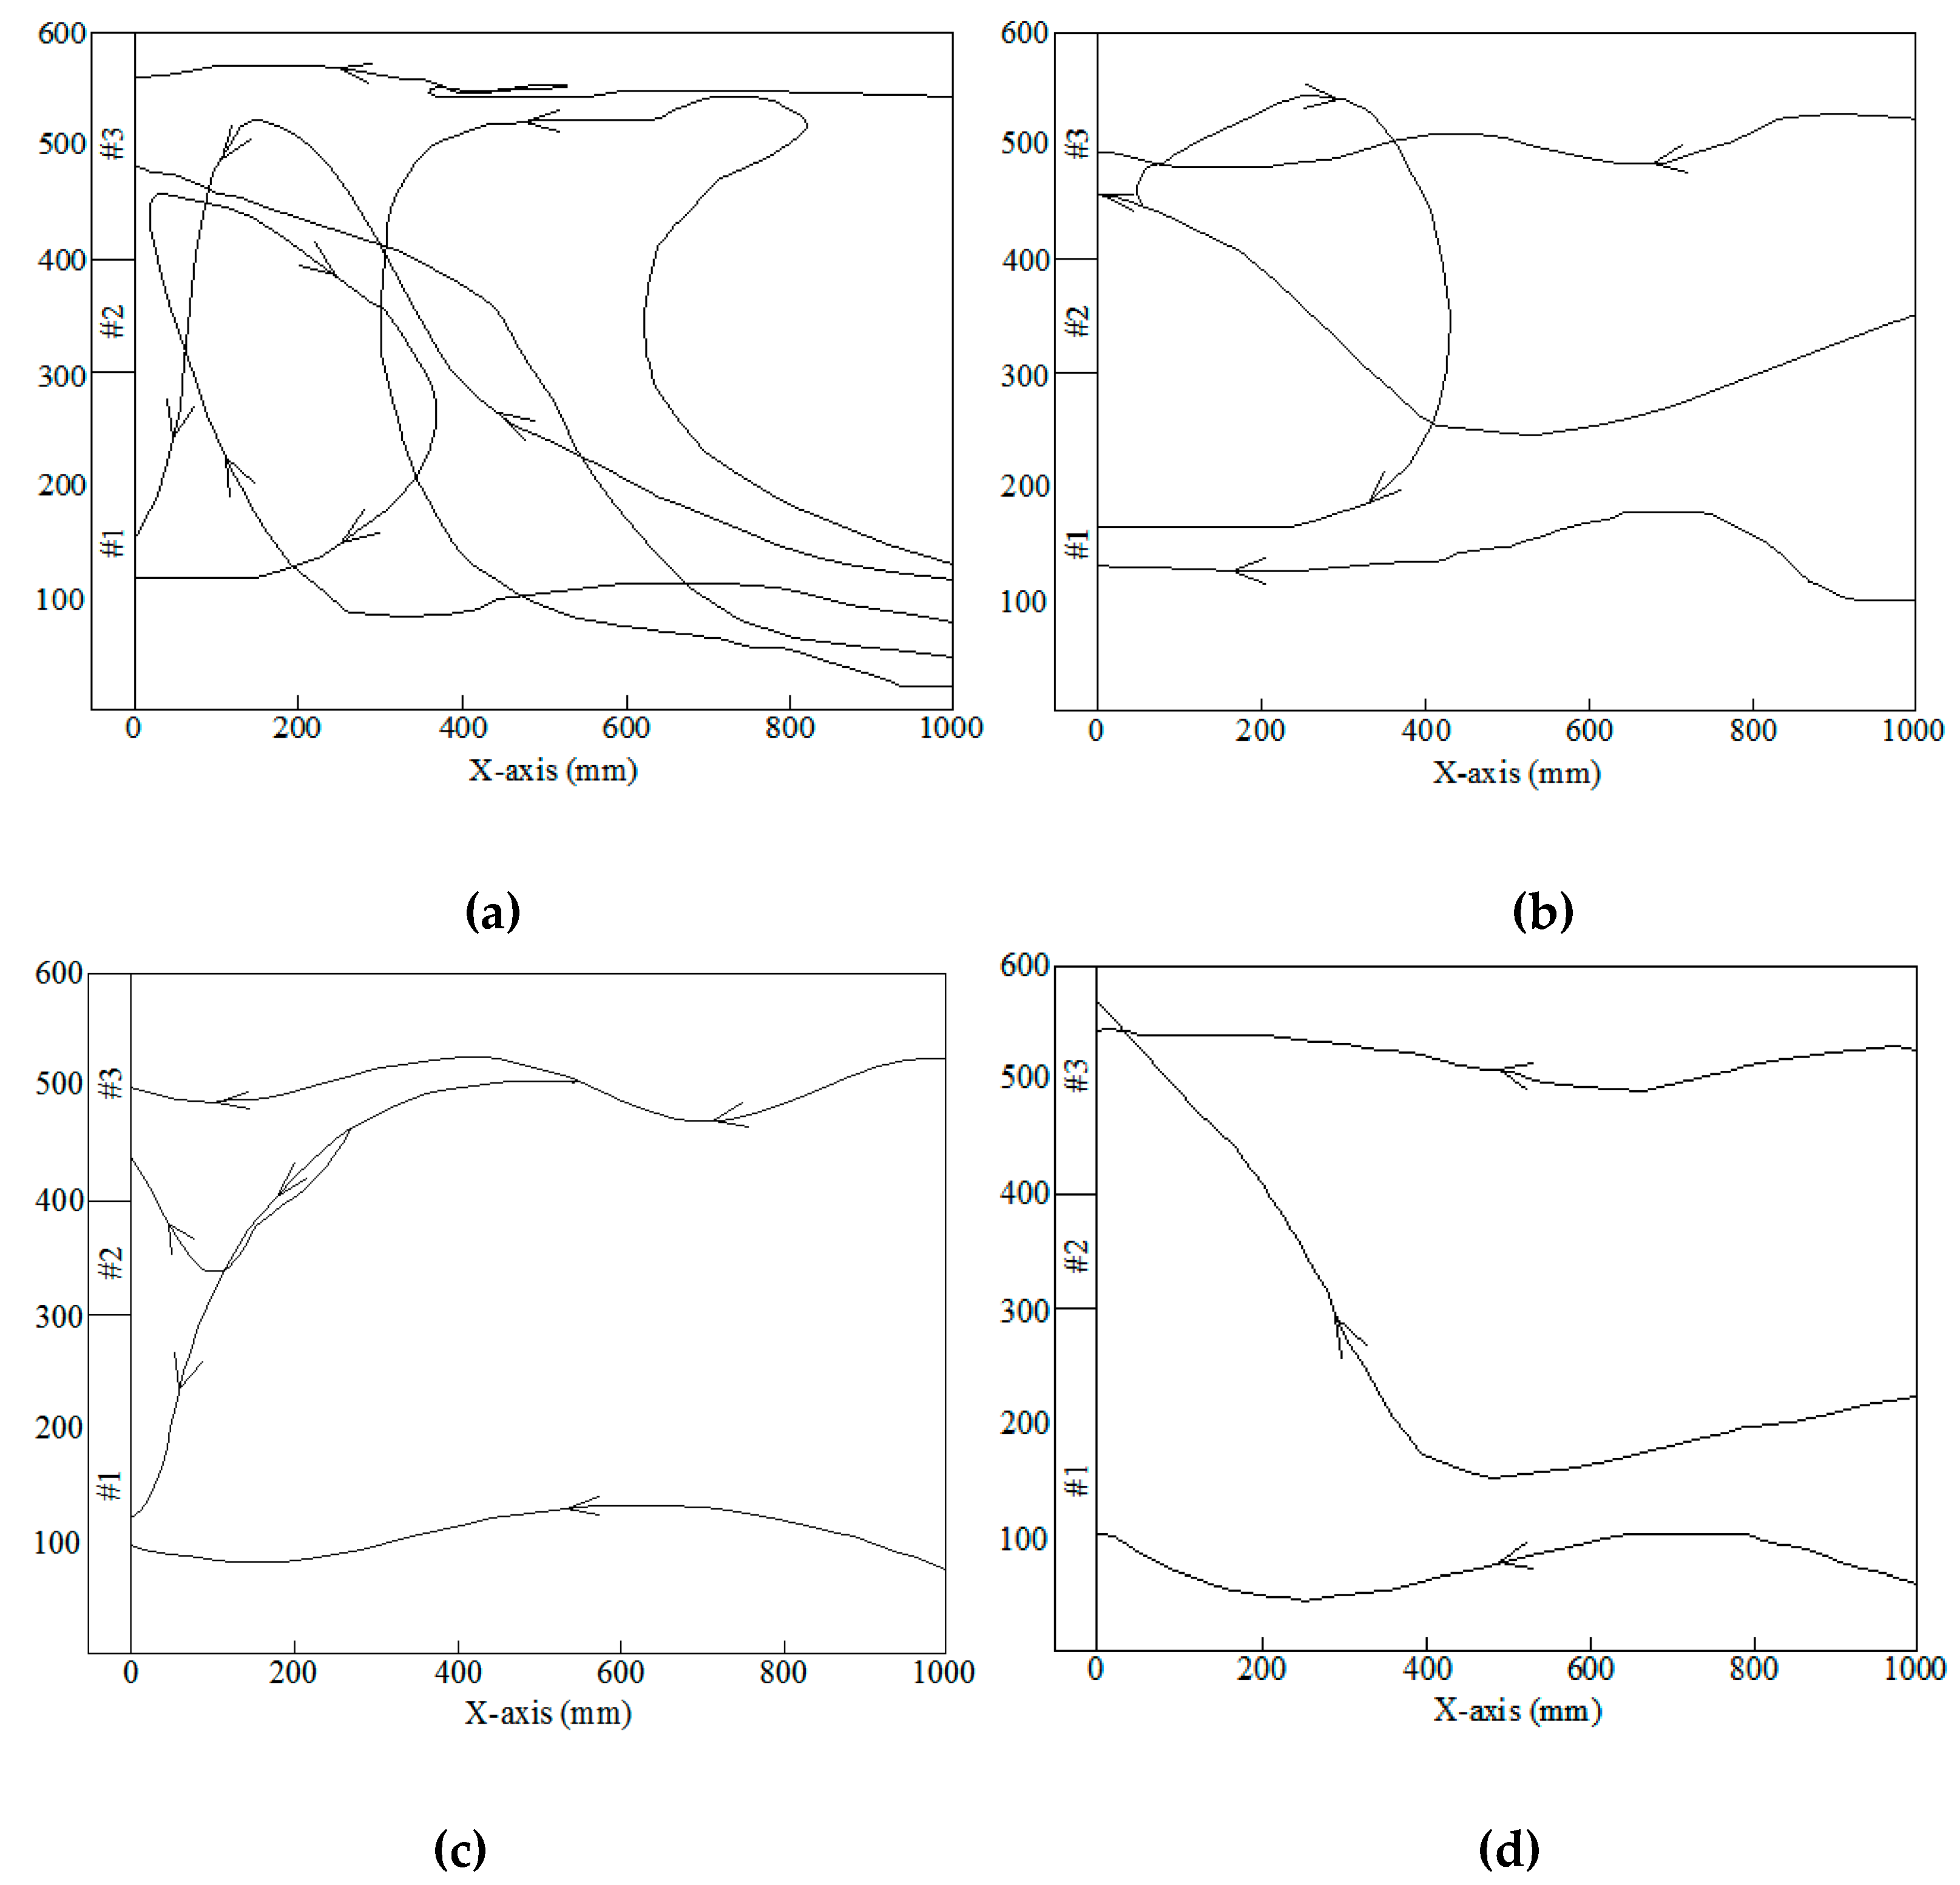
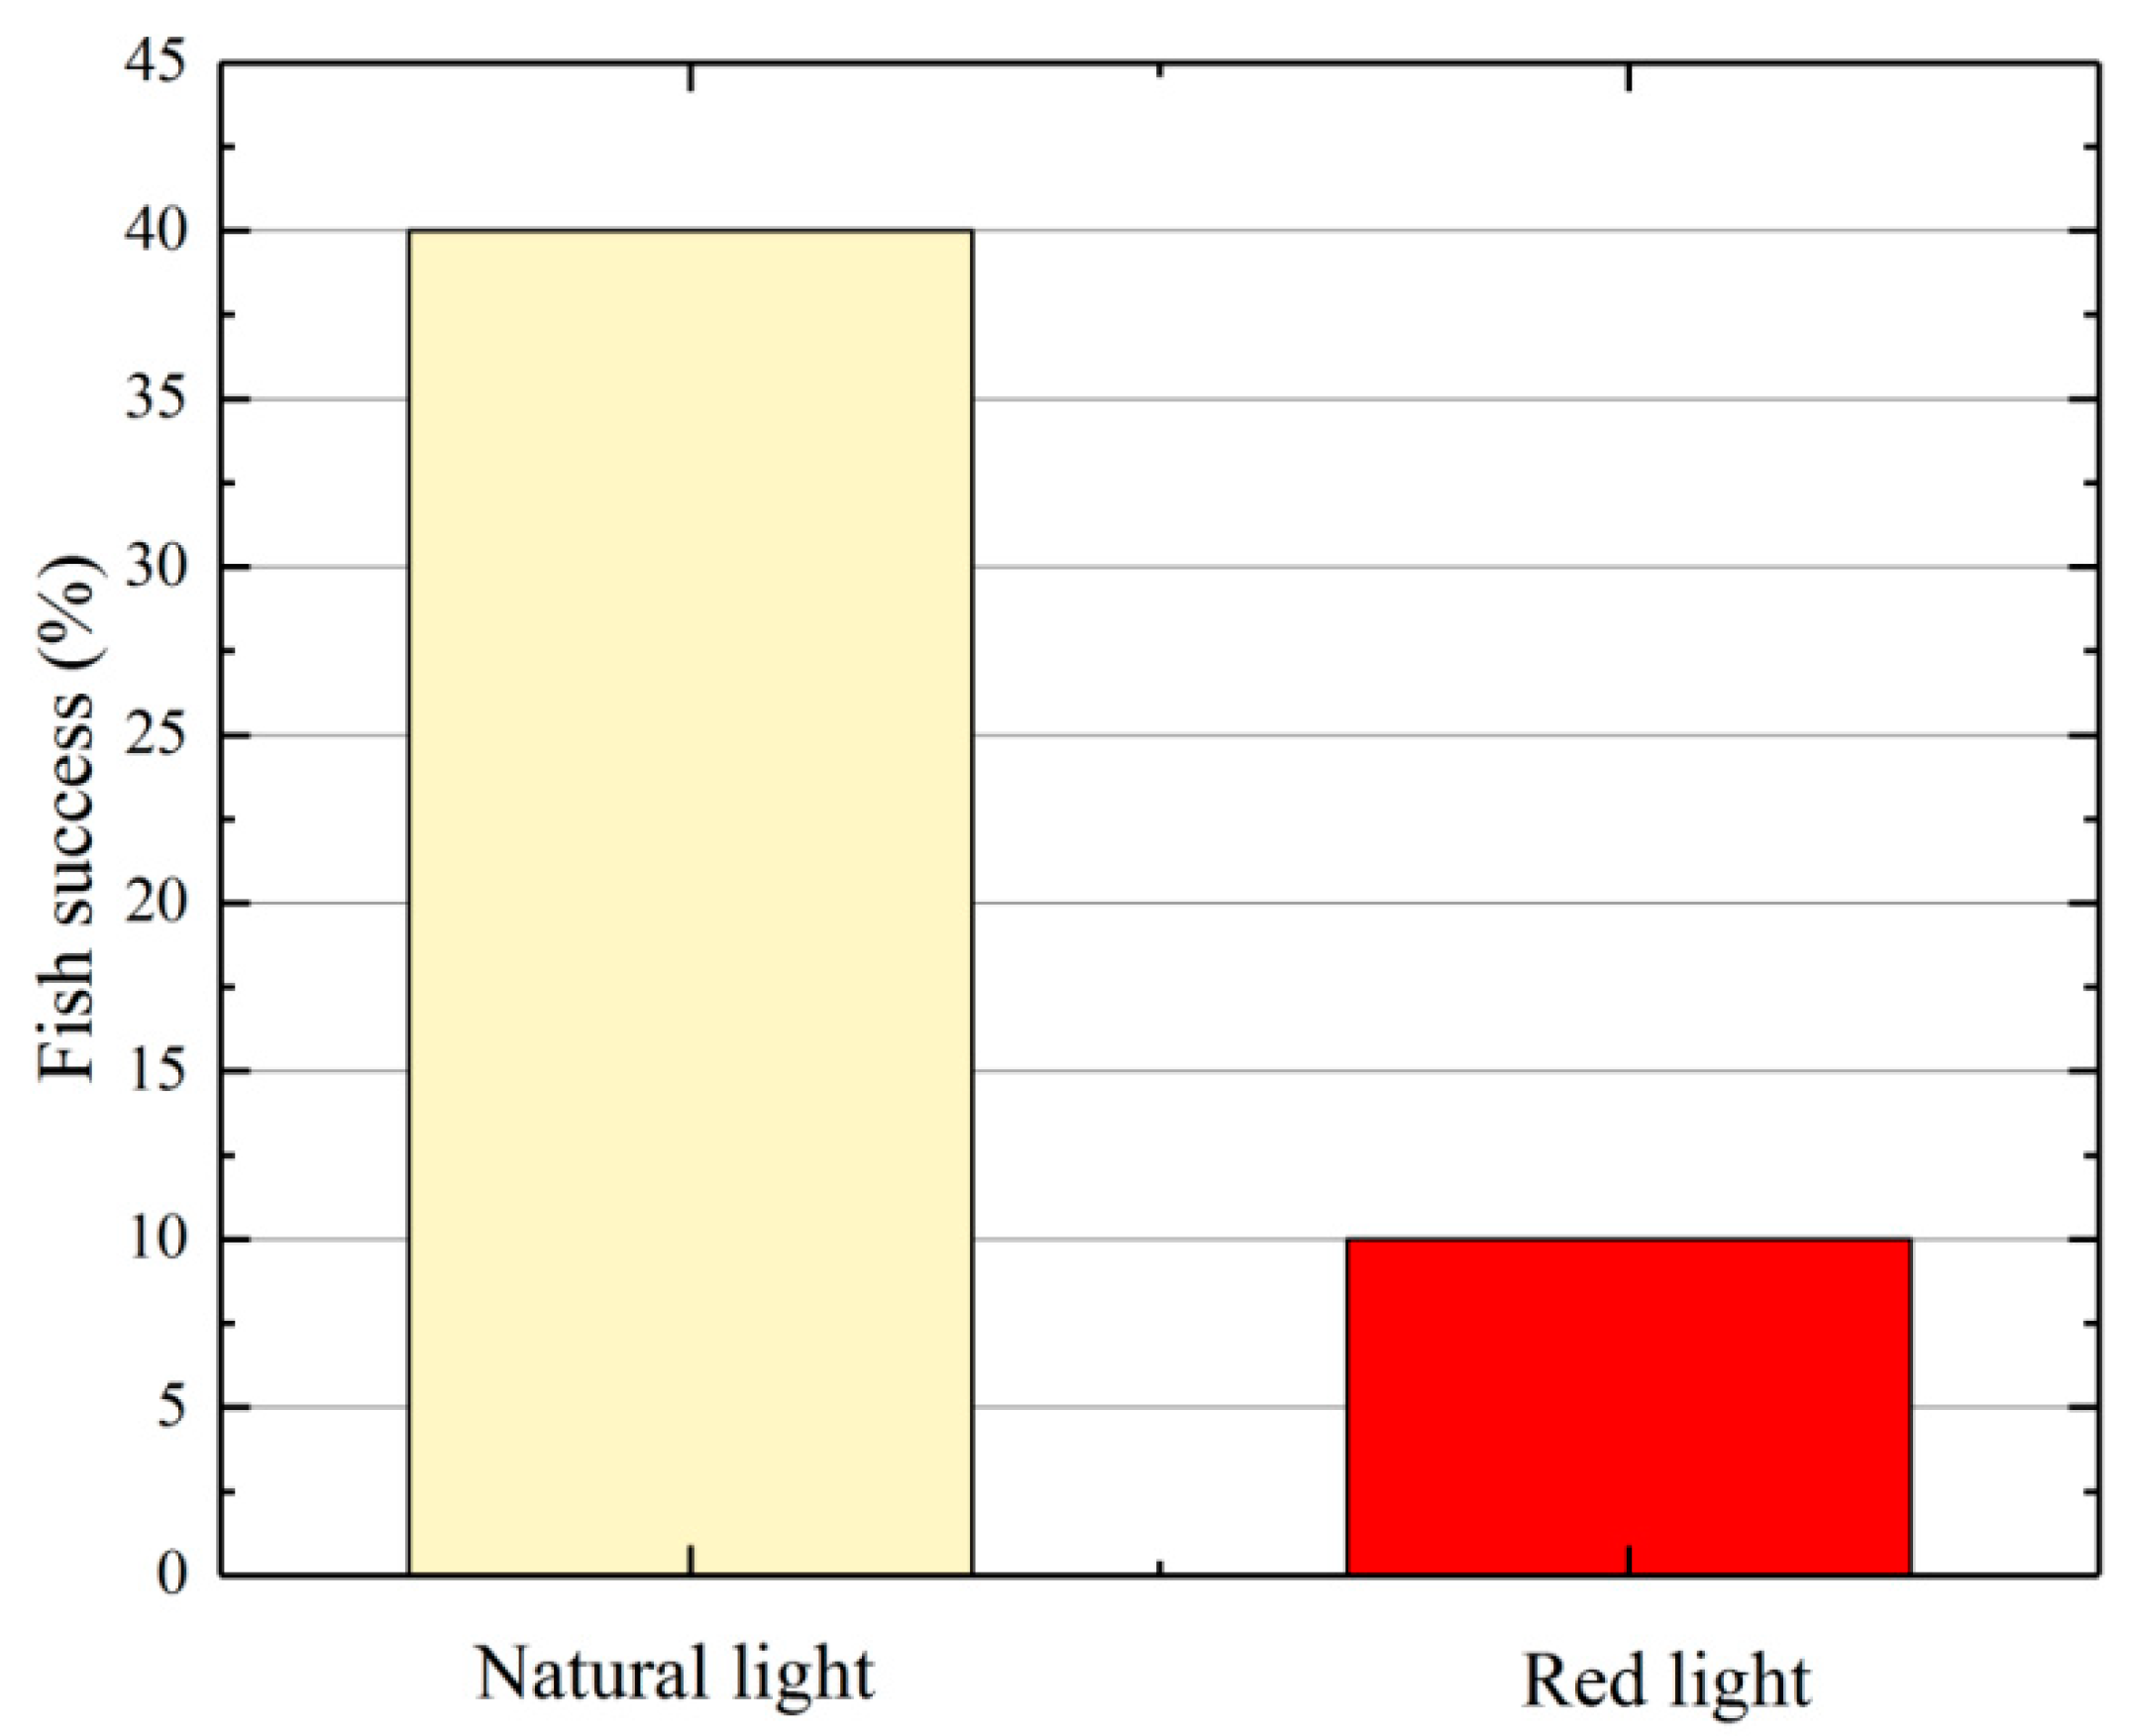
Measurement of the Approach–Avoidance Behaviors of Fish under Different Light Colors

According to the above results, the percentages of successful migration of the test fish in flow channel #1 and flow channel #3 were similar, when the flow velocities in these channels were 0.2 m/s and water was not discharged in flow channel #2. Therefore, these flow conditions were applied in order to minimize the influence of water flow and to investigate the impacts of different light colors. Four different colors of red, white, green, and blue light were arranged at the entrance of flow channel #3. The percentage of successful migration of the test fish in flow channel #3 was observed and recorded, and these results were compared with that obtained using natural light. The impacts of light-luring methods on the upstream migration of the fish were analyzed.
Figure 4 shows the percentages of successful migration of the test fish, under different light colors. Under natural light conditions, the percentage of successful migration of the test fish in flow channel #3 was approximately 42%. A very large decrease was observed for the percentage of successful migration of the test fish in flow channel #3, under the red light (17%). When the white light was used, the percentage of successful migration of the test fish in flow channel #3 was approximately 24%. Under the green light, the percentage of successful migration of the test fish in flow channel #3 was approximately 37%. When the blue light was used, the percentage of successful migration of the test fish in flow channel #3 was significantly increased to 60%, which was about 1.5 times that obtained under natural light. This indicated that blue light was a good option for attracting the test fish.
Using the videos obtained in this study, the main swimming trajectories (1,000 mm from the three flow channels) of the test fish, under different light colors, were drafted (see Figure 5). It should be noted that, according to the experimental observations, the test fish chose to swim close to the side wall, more than a 1,000 mm from the entrance of the three flow channels. Under the red light, the migration path of the test fish was the most complicated (as shown in Figure 5a). Some of the test fish arrived at the vicinity of the entrance of flow channel #3 and then returned to the downstream area or bypassed the light area in flow channel #1, which further indicated that the test fish were evading the red light. Under other light colors, the migration paths of the test fish were relatively simple. Especially under blue light conditions, the migration path of the test fish was the most direct (as shown in Figure 5d), further illustrating that the blue light had the best fish-luring effect for the test fish.
In order to further verify the avoidance behavior of the test fish under red light, the red light source was placed at the entrance of flow channel #1, and the entrance of flow channel #3 was illuminated with natural light. The upstream swimming behaviors of the test fish were recorded, and the percentage of successful migration was calculated. The results are shown in Figure 6. When the red light was placed at the entrance of flow channel #1, the percentage of successful migration of the test fish in flow channel #1 was reduced from the 40%, seen under natural light conditions, to 10%.

4. Conclusions

Consideration of the approach–avoidance behavior of fish under different flow velocity and light color, is essential, to ensure the fishpass efficiency of fishpass facilities, when designing the fish collection system entrance for these facilities. In this study, a generalized physical model of a fish collection system entrance was designed. The grass carp, representative of the “four major Chinese carps”, was investigated. At a water temperature of 28 ± 1°C, the approach–avoidance behavior of six hundred and sixty juvenile grass carps (with body lengths ranging from 8 cm to 12 cm) under different flow velocity and light color, were investigated. The following conclusions could be drawn.
(1)
Three general indicators that reflected a good fish-luring ability of a fish collection system were proposed. These include an optimal flow velocity at the fish collection system entrance, an optimal ratio between the flow velocities at the entrance of the fish-luring channel and the fish collection system channel, and an optimal light color for the approach–avoidance behavior of the fish. These were found to be key factors in the design of a fish collection system entrance.
(2)
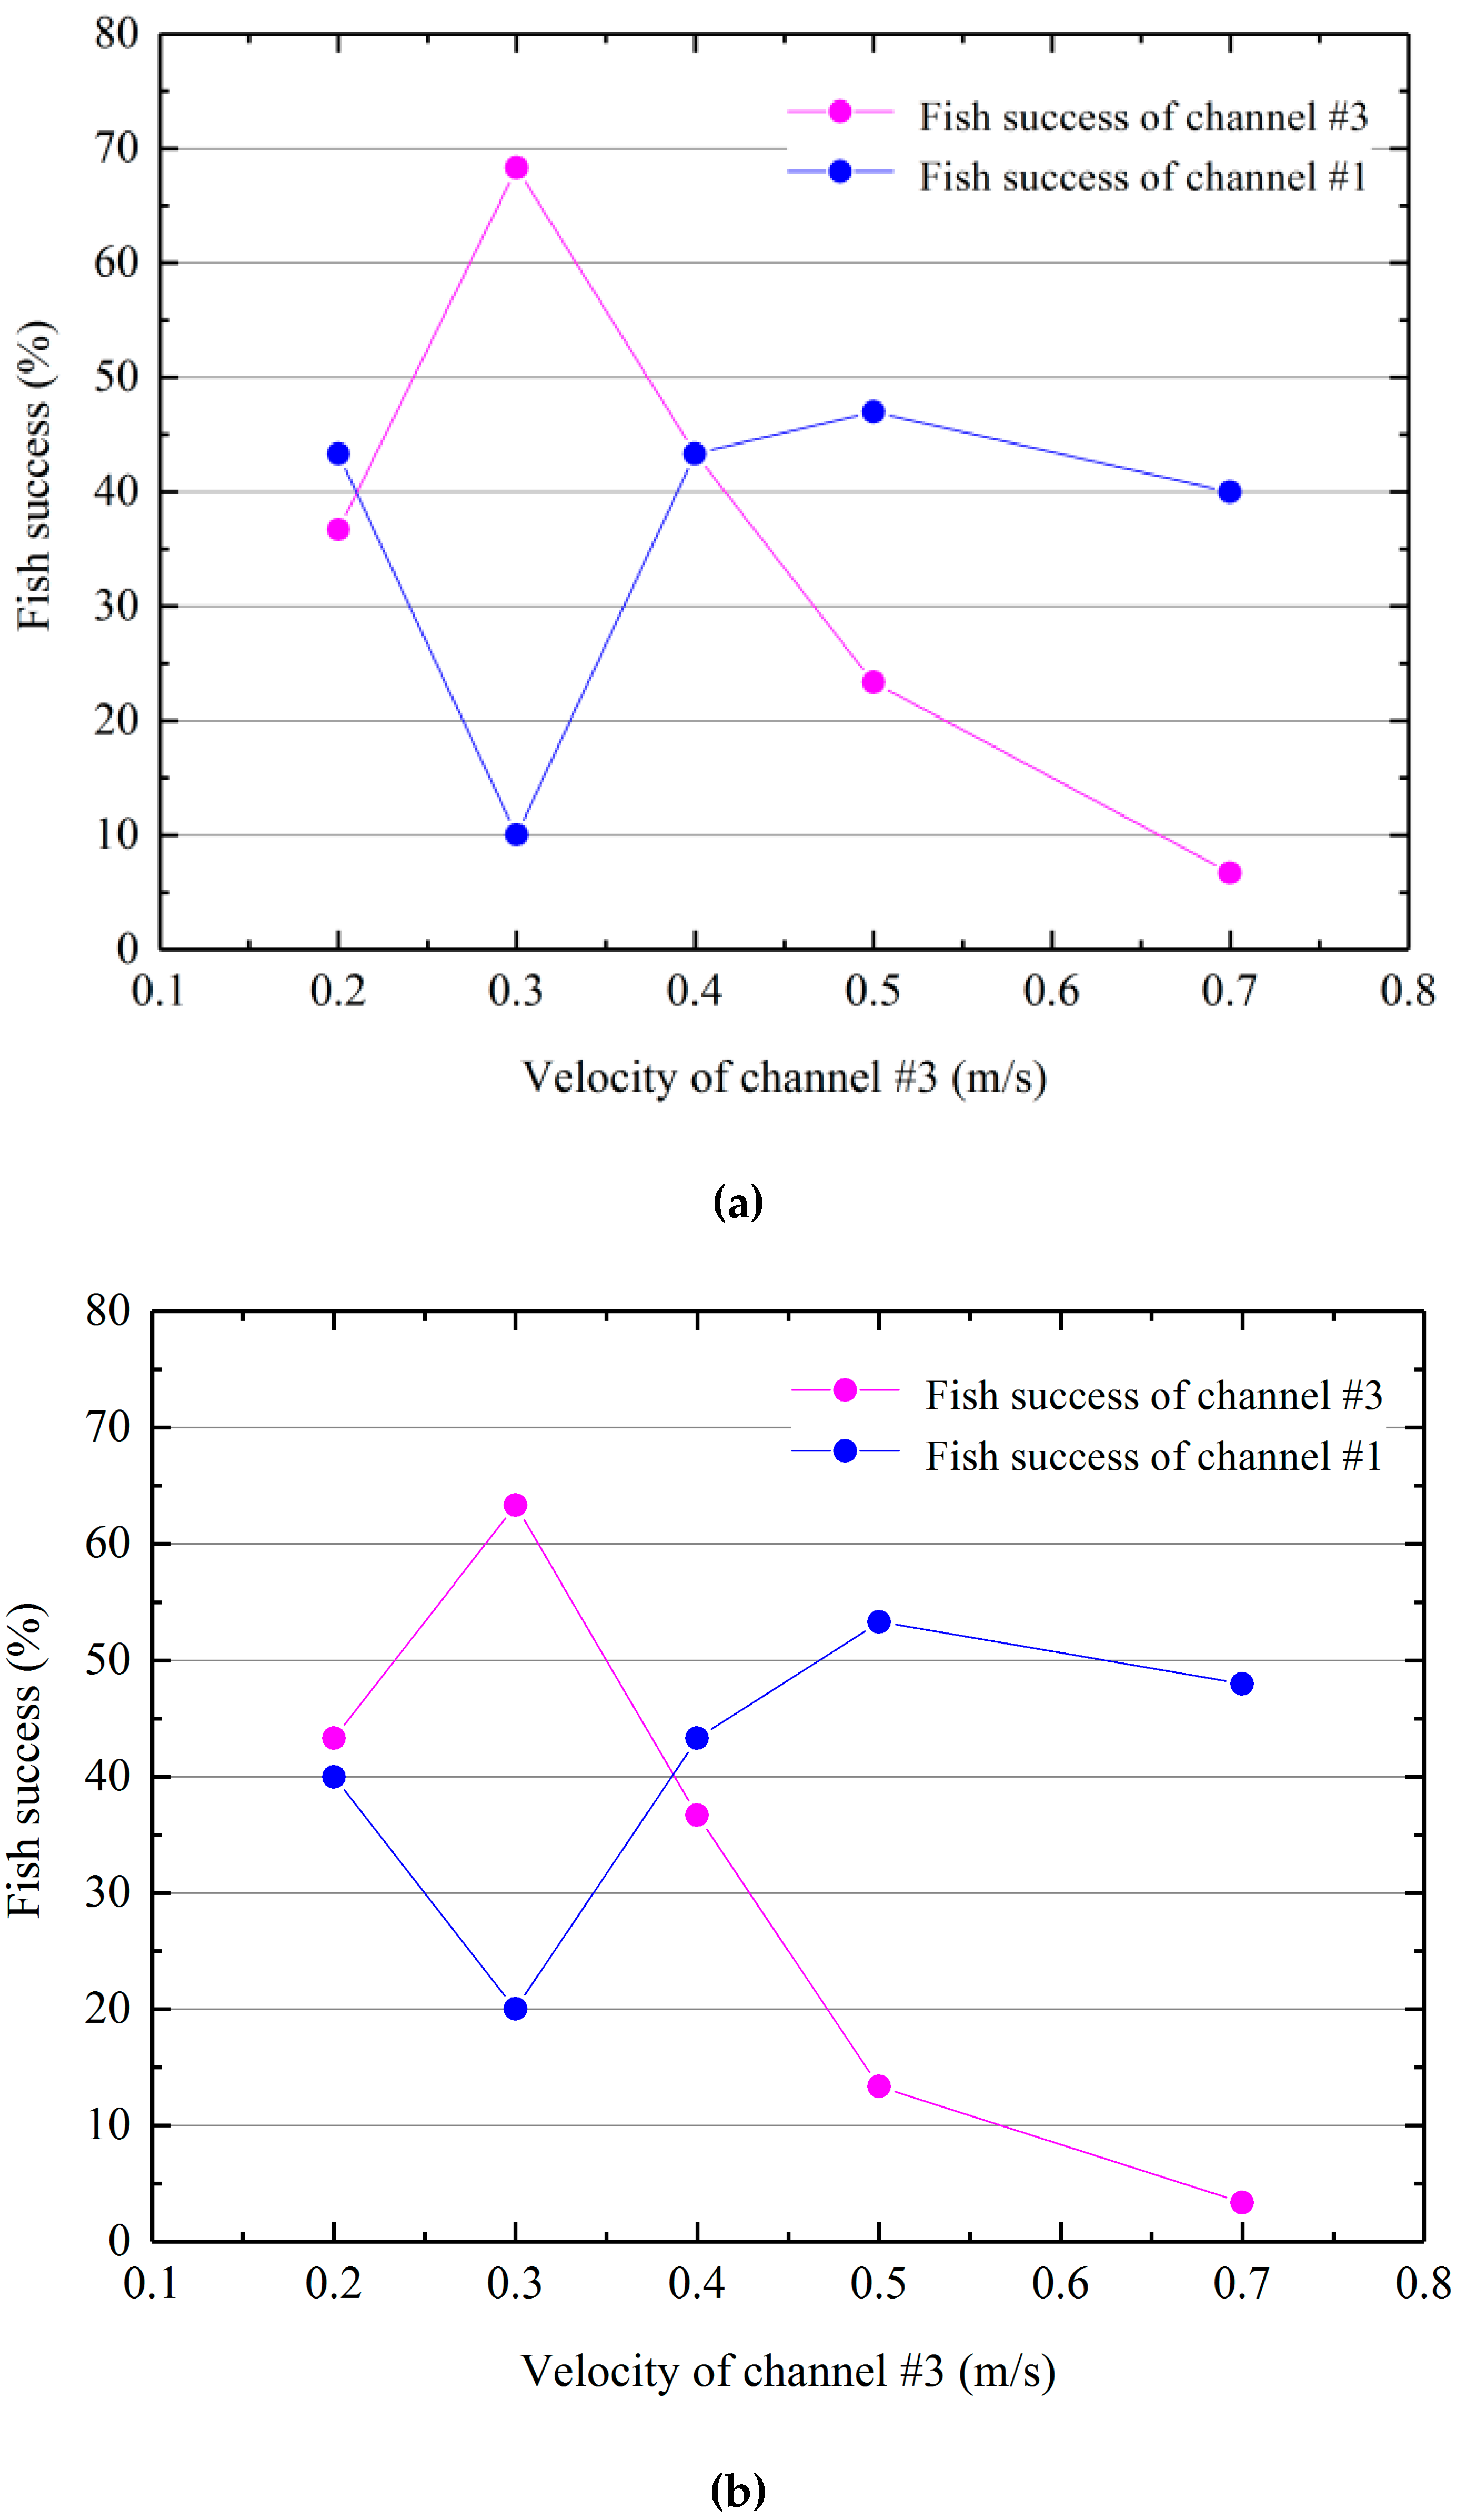
At the optimal flow velocity at the fish collection system entrance, the fish were most efficient at finding and going into the fish collection system. The ranges of the percentages of successful migration of juvenile grass carps were 36–43%, 63–68%, 37–43%, 13–23%, and 3–6% when the flow velocities at the fish collection system entrance were 0.2 m/s, 0.3 m/s, 0.4 m/s, 0.5 m/s, and 0.7 m/s, respectively. Thus, the optimal flow velocity at the fish collection system entrance was approximately 0.3 m/s, and the percentage of successful migration of the juvenile grass carps was greater than 60%.
(3)
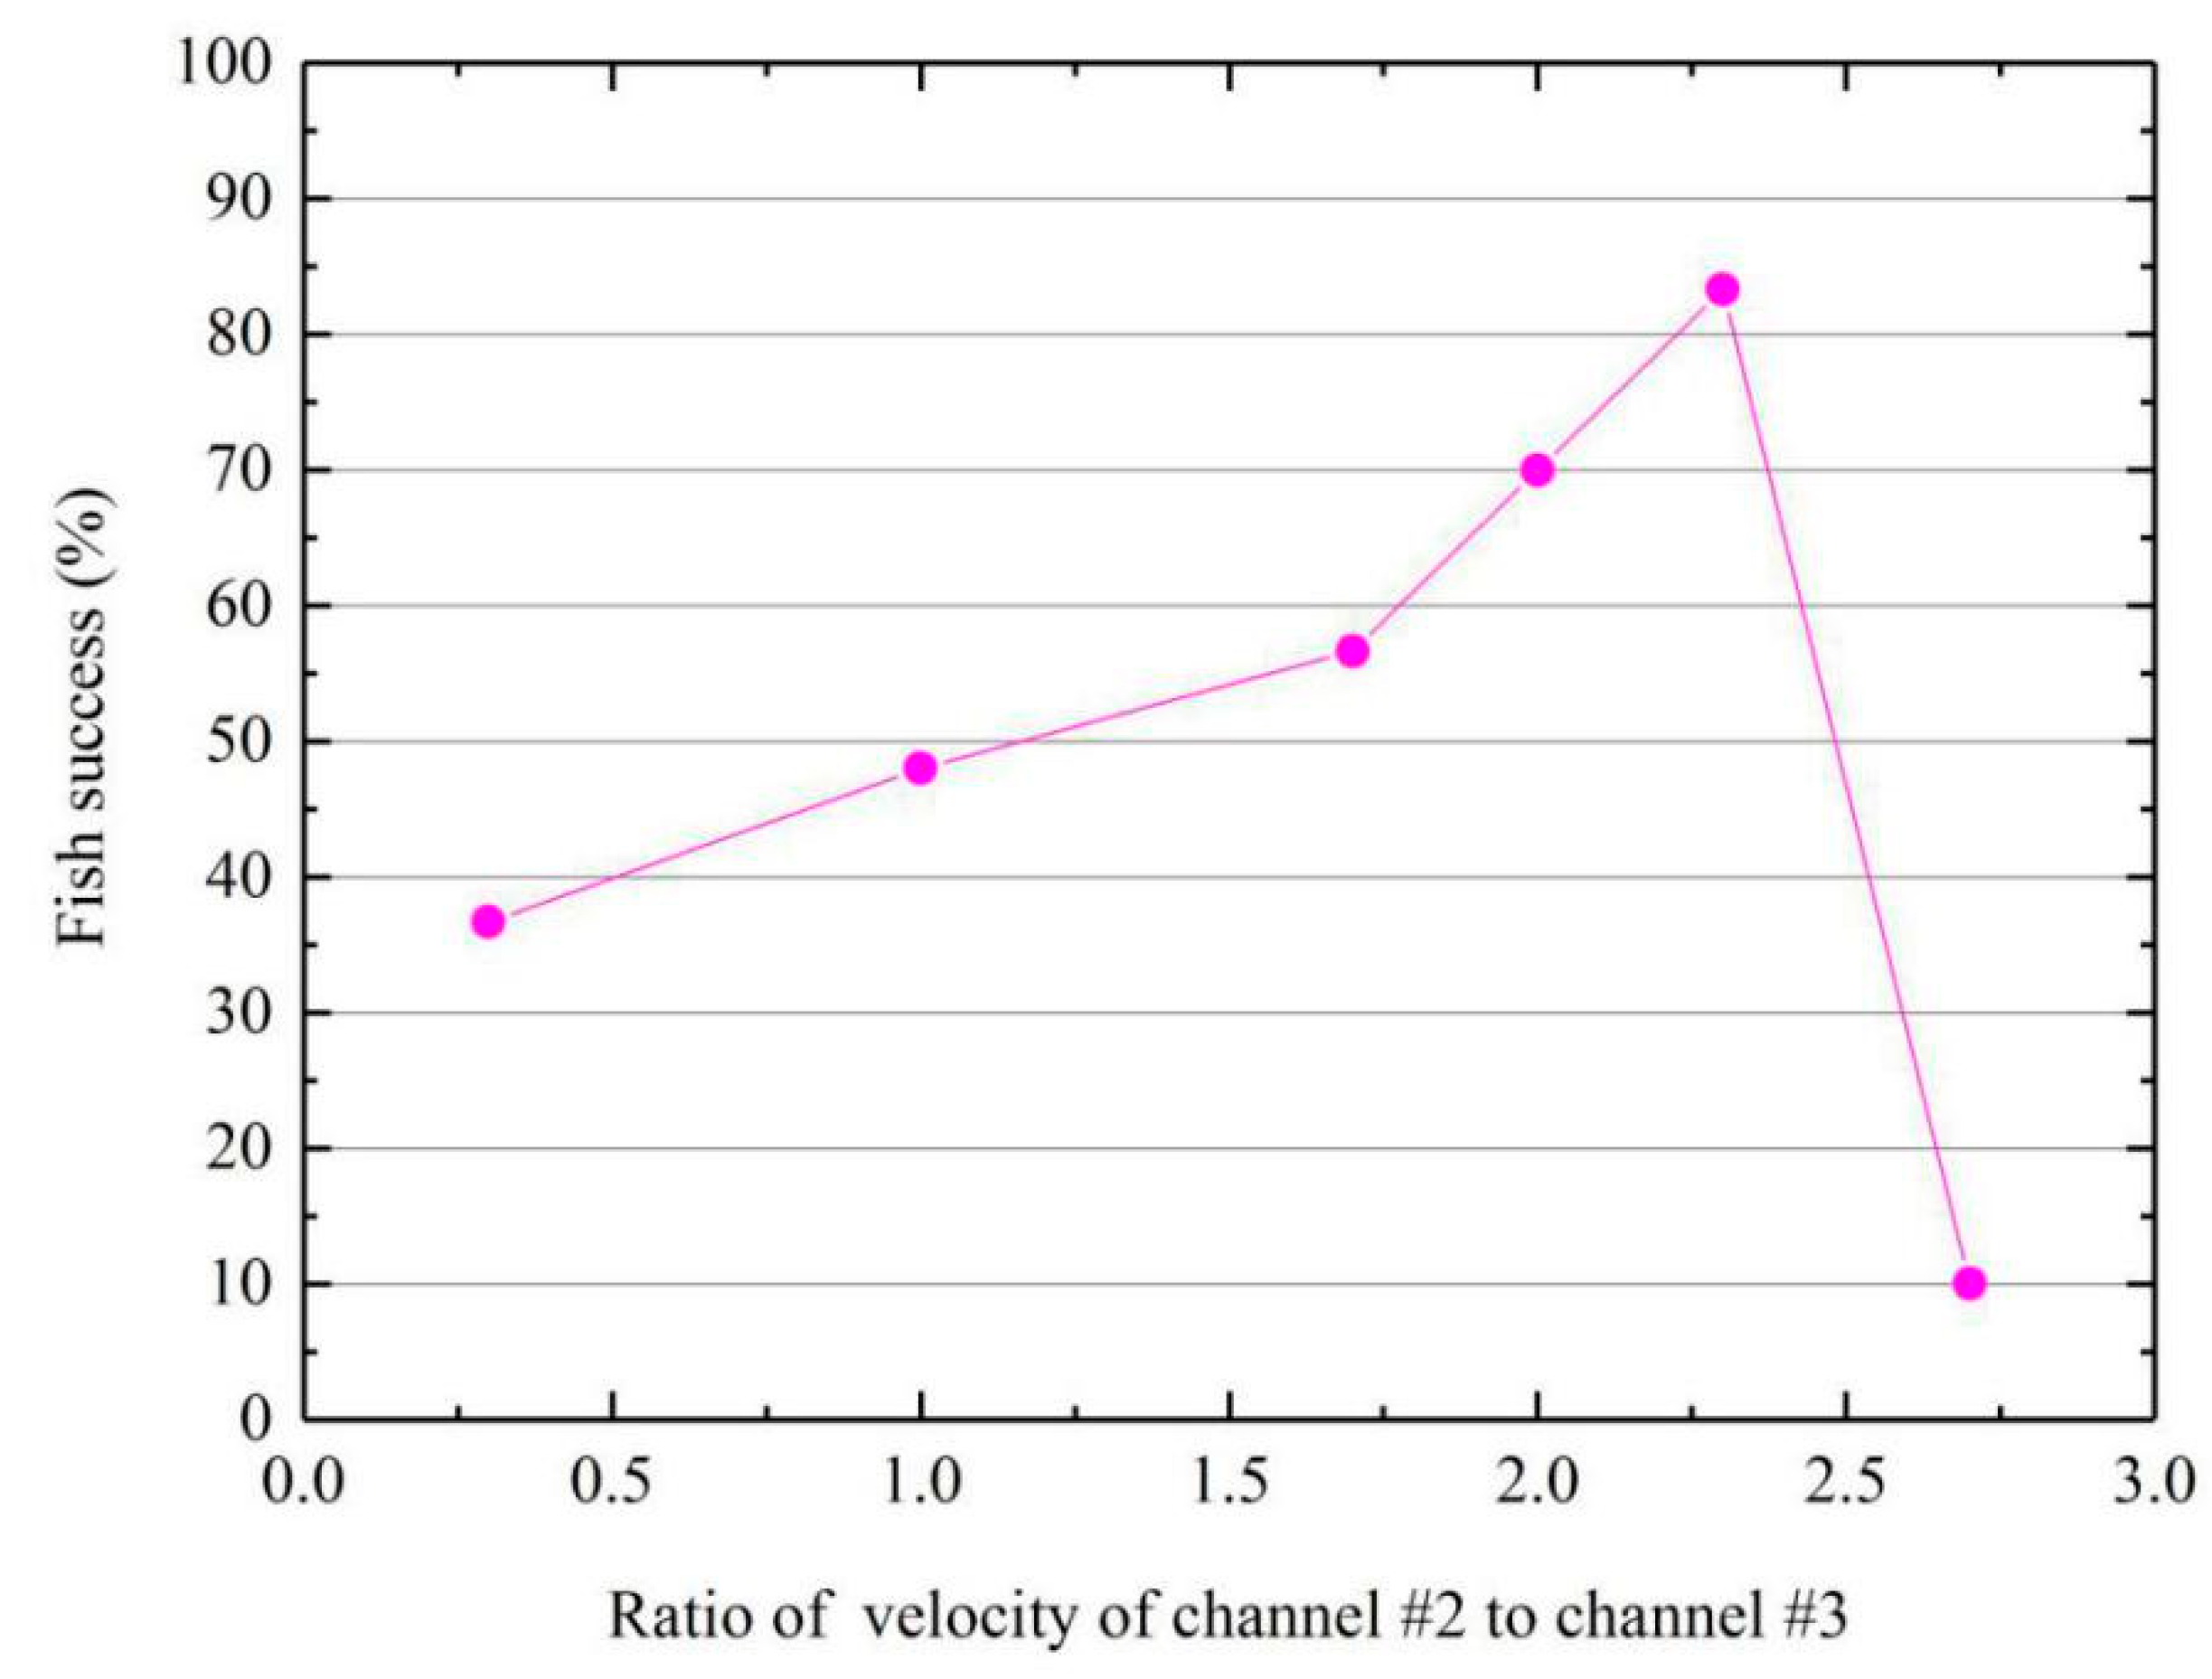
Adding suitable fish-luring flow near the fish collection system entrance could further improve the fishpass efficiency of the fish collection system. There existed an optimal ratio between the flow velocities at the entrance of the fish-luring channel and at the fish collection system entrance. The percentages of successful migration of the juvenile grass carps were 37%, 48%, 57%, 70%, 84%, and 10% when the ratios were 0.3:1, 1:1, 1.7:1, 2:1, 2.3:1, and 2.7:1, respectively. Thus, the optimal ratio was 2.3:1, and the highest percentage of successful migration of the juvenile grass carp was 84%, which was about 1.2 times that obtained without the fish-luring flow.
(4)
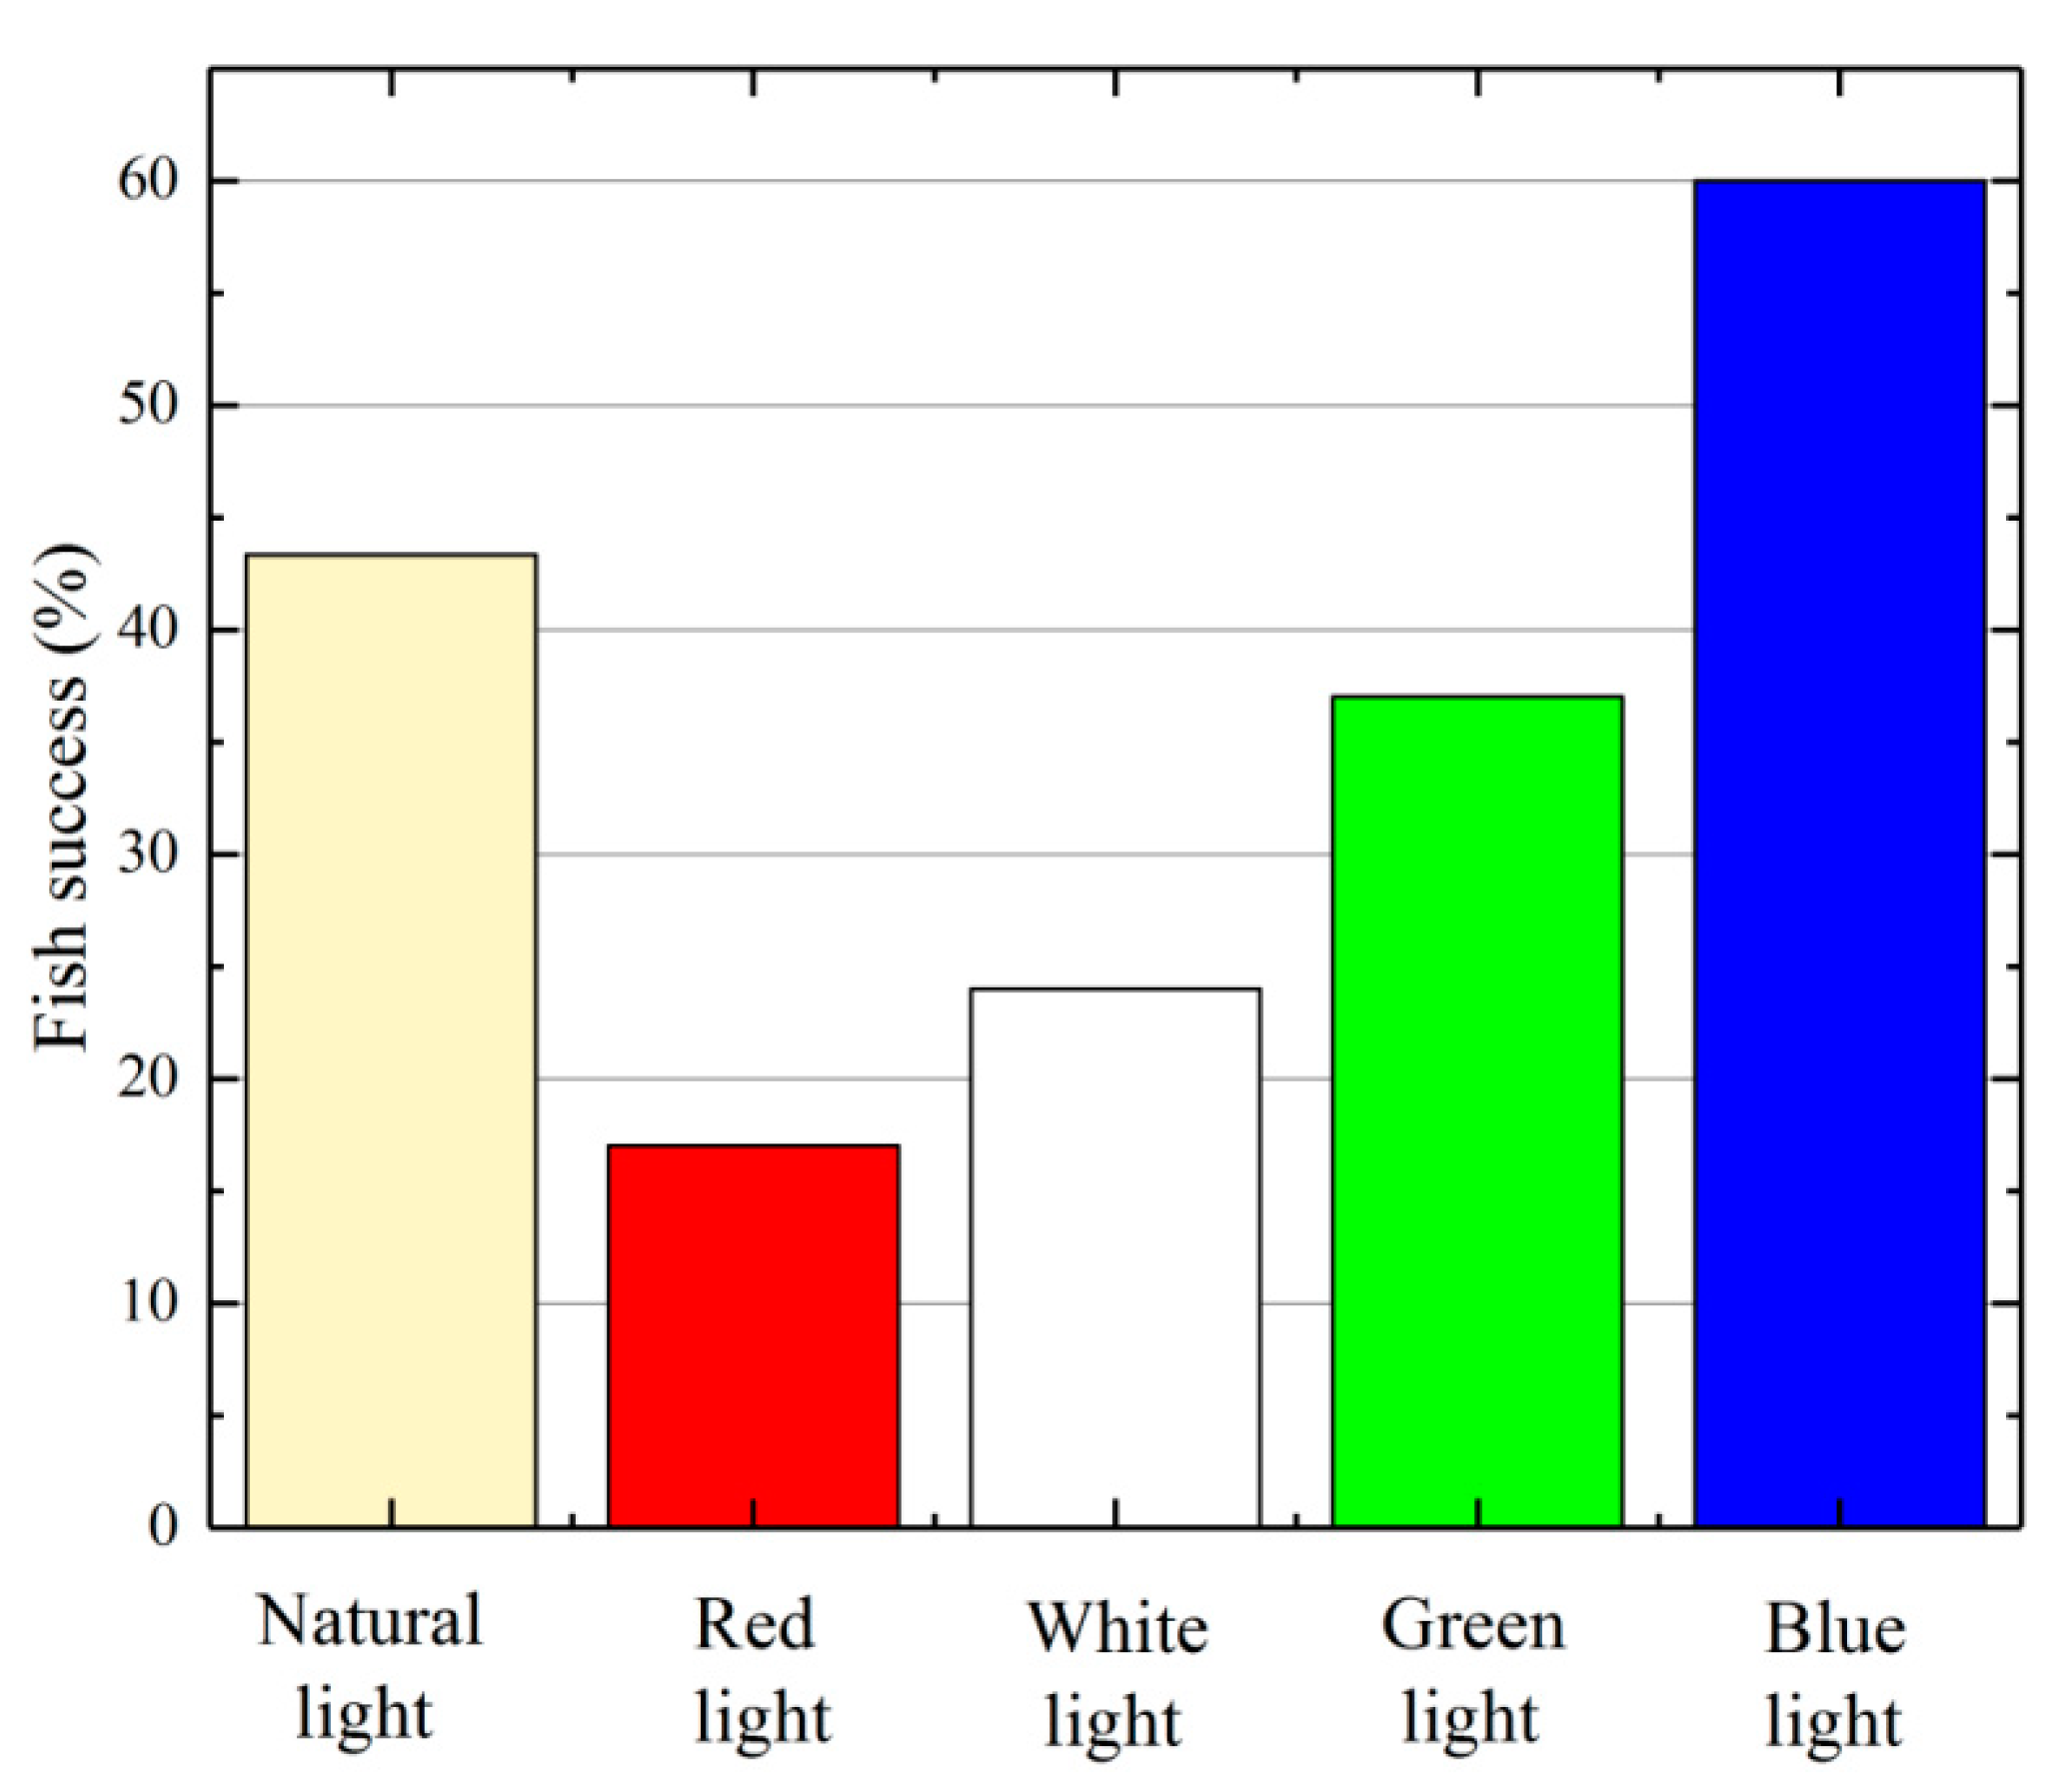
Different approach–avoidance behavior of the fish under different light colors were observed. The juvenile grass carps avoided the red light, while preferring the blue light. The blue light showed the best fish-luring effect. The percentages of successful migration of the juvenile grass carps were 0.4, 0.57, 0.88, and 1.43 of that obtained under natural light, when red, white, green, and blue light were used, respectively, at the fish collection system entrance. Therefore, blue light could be placed at the fish collection system entrance to improve the fishpass efficiency of fishpass facilities. Red light could be placed at the tailwater of the hydropower station to drive the grass carp away and weaken the attraction of the tailwater to the grass carps, thus helping to improve the fishpass efficiency of the fishpass facilities.
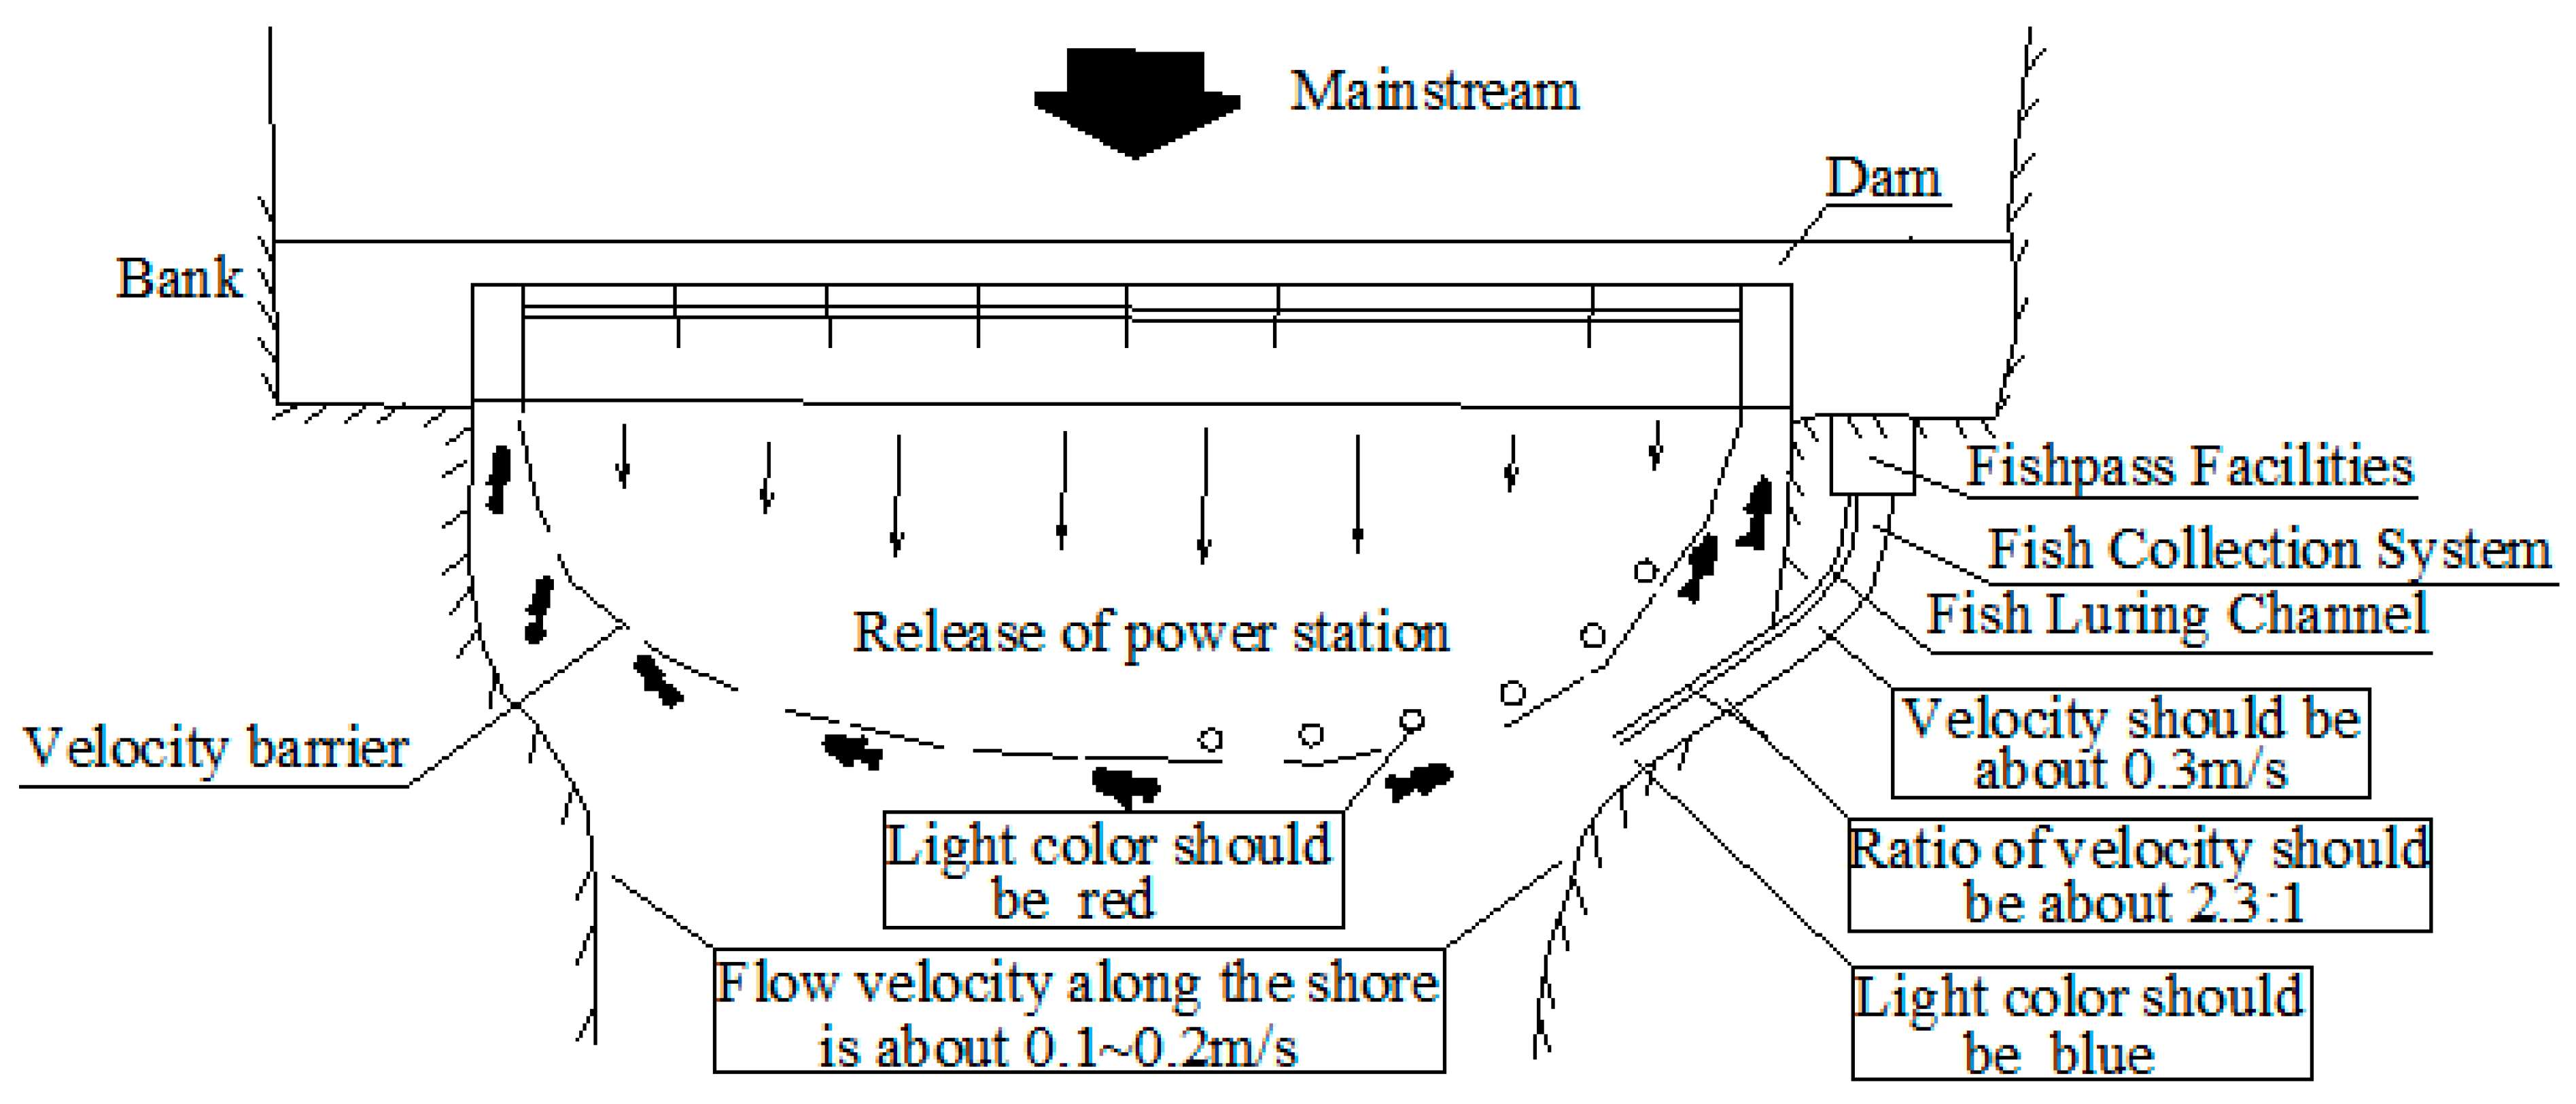
(5)
The results of this study could be used to guide engineering practice, as shown in Figure 7. The three general indicators proposed and obtained in this study could be directly used in the design of a fish collection system entrance, for a successful migration of grass carps. In this study, juvenile grass carps were investigated. The optimal flow velocity at the fish collection system entrance, the optimal ratio between the flow velocities at the entrance of the fish-luring channel and at the fish collection system entrance, as well as the preferences of light colors, might be different for other fish species. However, the experimental devices and methods designed in this study will provide important references for the study of fish collection system entrances for other fish species.
Future works could include the following aspects: (1) Future studies need to be conducted on the impacts of light intensity and flashing frequency on the upstream swimming behavior of fish. For example, Bai et al. [36] found that the Pelteobagrus vachelli prefers to appear in areas with a light intensity of 0–10 lx. (2) Sound is also an important impact factor on the upstream swimming behavior of fish. For example, to lure fish, the fishway at the Shangzhuang Gate in Beijing uses spray water to make a splash sound; fisheries also lure fish by simulating the sound of fish foraging. Therefore, the upstream swimming behaviors of fish under the influence of different sounds also needs to be studied in future research. (3) This study was only carried out in a laboratory scale, at this stage. Since environmental parameters have important impacts on the fish migration, field investigations will be done at the entrance of the fishway at the Shangzhuang Gate in Beijing, to further enrich and improve these research results.

Author Contributions

X.M., W.Z. and X.L. conceived and designed the manuscript; X.M. supervised the research; L.G. conducted the experiment and collected the data; W.Z., L.G., and P.C. analyzed the data and results and drew the figures; W.Z. and L.G. wrote the manuscript; X.L., X.M., and F.X. reviewed the manuscript.

Funding

This study was supported by the National Key Research and Development Program of China (2016YFC0502207, 2016YFC0401401), the National Natural Science Foundation of China (51609256), the Special Program of China Institute of Water Resources and Hydropower Research (HY0145B372016). Partial support was also received from the Young Elite Scientists Sponsorship Program by the China Association for Science and Technology (2017QNRC001).

Conflicts of Interest

The authors declare no conflict of interest.

References

  1. Ministry of Water Resources of the People’s Republic of China (MWR). Bulletin of first national census for water. China; 2013. Available online: http://www.mwr.gov.cn/sj/tjgb/dycqgslpcgb/201701/t20170122_790650.html (accessed on 14 February 2019).
  2. Kim, J.H.; Yoon, J.D.; Baek, S.H.; Park, S.H.; Lee, J.W.; Lee, J.A.; Jang, M.H. An efficiency analysis of a nature-like fishway for freshwater fish ascending a large Korean river. Water 2016, 8, 3. [Google Scholar] [CrossRef]
  3. Tan, J.; Tao, L.; Gao, Z.; Dai, H.; Shi, X. Modeling Fish Movement Trajectories in Relation to Hydraulic Response Relationships in an Experimental Fishway. Water 2018, 10, 1511. [Google Scholar] [CrossRef]
  4. Liu, Z.X.; Zhou, C.; Huang, M.H. Situation and development of fishway research and application. J. Yangtze River Sci. Res. Inst. 2010, 27, 28–31. [Google Scholar]
  5. Cao, Q.L.; Yang, W.J.; Zhou, L.J. Review on study of fishery facilities at home and abroad. J. Yangtze River Sci. Res. Inst. 2010, 27, 39–43. [Google Scholar]
  6. Xu, F.R.; Baiyin, B.; Chen, X.R.; Li, X.; Deng, H.H.; Shang, X. Quantitative assessment of acute impacts of suspended sediment on carp in the Yellow River. River Res. Appl. 2018. [Google Scholar] [CrossRef]
  7. Yu, Z.T.; Xu, Y.G.; Zhou, C.S.; Deng, Z.L.; Zhao, Y. Opinions on the influence of gezhouba water conservancy project on the fish resources of the Yangtze river and the protection of sturgeon resources. Reserv. Fish. 1981, 2, 18–24. [Google Scholar]
  8. Dong, Z.R.; Sun, D.Y. Principles and techniques of ecological water conservancy engineering; China Water Power Press: Beijing, China, 2007. [Google Scholar]
  9. Romão, F.A.; Santos, J.M.; Katopodis, C.; Pinheiro, A.N.; Branco, P. How does season affect passage performance and fatigue of potamodromous Cyprinids? An Experimental Approach in a vertical slot fishway. Water 2018, 10, 395. [Google Scholar] [CrossRef]
  10. Nanjing Hydraulic Research Institute (NHRI). Fishway; Water Resources and Electric Power Press: Beijing, China, 1982. [Google Scholar]
  11. Katopodis, C.; Williams, J.G. The development of fish passage research in a historical context. Ecol. Eng. 2012, 48, 8–18. [Google Scholar] [CrossRef]
  12. Zheng, J.X.; Han, D.J.; Hu, W.B.; Wang, X.; Zhang, X.M. Fish swimming performance related to fishway design. J. Hydroecol. 2010, 3, 104–110. [Google Scholar]
  13. Bates, K.; Whiley, A.J. Fishway Guidelines for Washington State: Draft; Washington Department of Fish and Wildlife: Washington, DC, USA, 2000. [Google Scholar]
  14. Peake, S.; McKinley, R.S.; Scruton, D.A. Swimming performance of various freshwater Newfoundland salmonids relative to habitat selection and fishway design. J. Fish Biol. 1997, 51, 710–723. [Google Scholar] [CrossRef]
  15. Shi, X.T.; Chen, Q.W.; Huang, Y.P.; Liu, D.F.; Zhuang, P. Review on the methods to quantify fish’s ability to cross velocity barriers in fish passage. Acta Ecol. Sin. 2011, 31, 6967–6972. [Google Scholar]
  16. Bunt, C.M. Fishway entrance modifications enhance fish attraction. Fish. Manag. Ecol. 2001, 8, 95–105. [Google Scholar] [CrossRef]
  17. Power, G. One rung at a time. Atl. Salmon J. 1989, 38, 30–32. [Google Scholar]
  18. Laine, A.; Jokivirta, T.; Katopodis, C. Atlantic salmon, Salmo salar L., and sea trout, Salmo trutta L., passage in a regulated northern river-fishway efficiency, fish entrance and environmental factors. Fish. Manag. Ecol. 2002, 9, 65–77. [Google Scholar] [CrossRef]
  19. Wassvik, E. Model test of an efficient fish lock as an entrance to fish ladders at hydropower plants. In International Symposium on Ecohydraulics: 12 September 2004–17 September 2004 (Vol. 2, pp. 915–920); International Association for the History of Religions (IAHR): Madrid, Spain, 2004. [Google Scholar]
  20. Wassvik, E. Attraction channel as entrance to fishways. Doctoral dissertation, Luleå University of Technology, Luleå, Sweden, 2006. [Google Scholar]
  21. Lindmark, E.; Gustavsson, L.H. Field study of an attraction channel as entrance to fishways. River Res. Appl. 2008, 24, 564–570. [Google Scholar] [CrossRef]
  22. Sun, S.K.; Deng, M.Y.; Li, Y.Y. Hydraulic research on the layout of vertical slot fishway in Shangzhuang Gate. In Proceedings of the third national congress of hydraulics and hydraulic informatics; Hohai University Press: Nanjing, China, 2007. [Google Scholar]
  23. Song, D.J.; Jiang, H.; Guan, C.T.; Chen, Q.S. Design of a fishway for Lao Long Kou hydro-junction project. Mar. Fish. Res. 2008, 29, 92–97. [Google Scholar]
  24. Shi, B.; Wang, B.; Xu, G.; Tu, X.G. Research on optimization of fishway entrance of sluice on Nanxi River in Zhejiang Province. Yangtze River 2011, 42, 69–71. [Google Scholar]
  25. Wickham, D.A. Attracting and controlling coastal pelagic fish with nightlights. Trans. Am. Fish. Soc. 1973, 102, 816–825. [Google Scholar] [CrossRef]
  26. Mueller, R.P.; Simmons, M.A. Characterization of gatewell orifice lighting at the bonneville dam second powerhouse and compendium of research on light guidance with juvenile salmonids. Tech. Rep. 2007. [Google Scholar] [CrossRef]
  27. Moser, M.L.; Ogden, D.A.; Cummings, D.L.; Peery, C.A. Development and evaluation of a lamprey passage structure in the Bradford Island Auxiliary Water Supply Channel, Bonneville Dam, 2004; Northwest Fisheries Science Center: Seattle, WA, USA; National Marine Fisheries Service: Portland District, USA, 2006. [Google Scholar]
  28. Ministry of Water Resources of the People’s Republic of China (MWR). Guideline for fishway in water conservancy and hydropower project; Ministry of Water Resources of the People’s Republic of China: Beijing, China, 2013.
  29. Zhou, X.B. Design of water supplying system for the entrance of fishway at zangmu hydropower Station. Des. Hydroelectr. Power Stn. 2017, 33, 81–85. [Google Scholar]
  30. Ministry of Environmental Protection of the People’s Republic of China (MEP). Bulletin on ecological and environmental monitoring of the Three Gorges Project of the Yangtze River. Available online: http://www.tgenviron.org/monbulletin/pdf/2013monjournal.pdf (accessed on 14 February 2019).
  31. Ministry of Environmental Protection of the People's Republic of China (MEP). Bulletin on ecological and environmental monitoring of the Three Gorges Project of the Yangtze River. Available online: http://www.tgenviron.org/monbulletin/pdf/2017monjournal.pdf (accessed on 14 February 2019).
  32. Hammer, C. Fatigue and exercise tests with fish. Comp. Biochem. Physiol. Part A: Physiol. 1995, 112, 1–20. [Google Scholar] [CrossRef]
  33. Hu, M.L. Characteristics of water level, water environment and effects on fish communication and migration in the Hukou area of Poyang Lake. Doctoral dissertation, Nanchang University, Jiangxi, China, 2009. [Google Scholar]
  34. Aoki, M.; Yoshino, T.; Fukui, Y. Flow in the downstream of a fish-way with a priming water and fish behavior to it. J. Jpn. Soc. Fluid Mech. 2009, 28, 485–494. [Google Scholar]
  35. Williams, J.G.; Armstrong, G.; Katopodis, C.; Larinier, M.; Travade, F. Thinking like a fish: a key ingredient for development of effective fish passage facilities at river obstructions. River Res. Appl. 2012, 28, 407–417. [Google Scholar] [CrossRef]
  36. Bai, Y.Q.; Wang, X.; Liu, D.F.; Tu, Z.Y.; Lu, B.; Wang, B.; Luo, J.; Shi, X.T. The preferable light intensity and color for darkbarbel catfish and silver carp. Acta Hydrobiol. Sin. 2014, 38, 216–221. [Google Scholar]
Figure 1. Schematic plan of the general arrangement of the model (Unit: mm). (a) Top view; (b) Front view; (c) Vortex gate; (d) X–Y coordinate system; and (e) Z–X coordinate system.
Water 11 00322 g001
Figure 2. Relationship between velocity of channel #3 and fish success (%) in channel #1 and channel #3: (a) Case 1; (b) Case 2.
Water 11 00322 g002
Figure 3. Relationship between ratio of velocity of channel #2 to channel #3 and fish success (%) of channel #3.
Water 11 00322 g003
Figure 4. Fish success (%) in channel #3 under various light colors.
Water 11 00322 g004
Figure 5. Fish swimming trajectories in the observation section under various light colors: (a) Red light; (b) White light; (c) Green light; and (d) Blue light.
Water 11 00322 g005
Figure 6. Fish success (%) in channel #1 under natural light and red light.
Water 11 00322 g006
Figure 7. Schematic diagram of test results for guiding engineering practice.
Water 11 00322 g007
Table 1. Velocity of each channel in Case 1 and Case 2.
Case 1Velocity (m/s)Case 2Velocity (m/s)
#1#2#3#1#2#3
1-10.100.22-10.200.2
1-20.100.32-20.200.3
1-30.100.42-30.200.4
1-40.100.52-40.200.5
1-50.100.72-50.200.7
Table 2. Velocity of each channel in Case 3.
Case 3Velocity (m/s)v2/v3
#1#2#3
3-10.10.10.30.3
3-20.10.30.31.0
3-30.10.50.31.7
3-40.10.60.32.0
3-50.10.70.32.3
3-60.10.80.32.7

