A Multi-Dimensional Hydro-Climatic Similarity and Classification Framework Based on Budyko Theory for Continental-Scale Applications in China


1
State Key Laboratory of Hydrology-Water Resources and Hydraulic Engineering, Hohai University, Nanjing 210098, China
2
College of Hydrology and Water Resources, Hohai University, Nanjing 210098, China
3
School of Earth Sciences and Engineering, Hohai University, Nanjing 211100, China
4
State Key Laboratory of Hydrology-Water Resources and Hydraulic Engineering, Nanjing Hydraulic Research Institute, Nanjing 210029, China
*
Author to whom correspondence should be addressed.
Water 2019, 11(2), 319; https://doi.org/10.3390/w11020319
Submission received: 19 January 2019
/
Revised: 3 February 2019
/
Accepted: 12 February 2019
/
Published: 14 February 2019
(This article belongs to the Section Hydrology)
Abstract
:Our knowledge of the similarities and differences in ecological systems is vital to understanding the co-evolution of ecological factors. This study proposes a multi-dimensional hydro-climatic similarity and classification framework based on Budyko theory. The framework employs the dryness index (DI), evaporative index (EI), and an empirical parameter (ω) to further sub-divide four climatic zones (humid, semi-humid, semi-arid, and arid zones) in terms of DI. A criterion that define the similarities between stations is proposed to verify the classification to obtain optimal results. This method is applied to Mainland China, and 637 stations are adopted for continental-scale classification experiments. The point cloud of the Budyko curve for all the stations in Mainland China is plotted. We find that the hydrothermal conditions of the vertically distributed stations on the Budyko curve can be quite different in the same climatic zone when DI < 4.0. The higher the vertical locations of the stations on the Budyko curve are, the drier and colder the climates and corresponding natural landscapes. Under the proposed hydro-climatic classification framework, the four climatic zones are further divided into 17 sub-regions, and the hydrothermal conditions for each sub-region are discussed. The results suggest that regional differences of long-term water balance are resulted by not only mean annual hydrothermal factors and catchment forms but also annual distribution of hydrothermal factors. Our framework can provide hydrologically-based classification across continental scale and, thus, provide a profound understanding of hydrothermal conditions of continental-scale hydrological cycles.
1. Introduction
The ecological systems are an open, relatively stable hierarchical system in space-time [1]. Similarities and differences in ecological systems have attracted widespread attention in recent years, suggesting that there is considerable interest in extending our understanding of the co-evolution of terrain, climate, soil, vegetation, human activities and numerous other factors [2,3,4,5,6]. Climate is an important factor that has a strong impact on ecology [7,8,9], and understanding environmental conditions and regional differences is the basis of the study of ecological systems. Thus, hydro-climatic classifications are of great significance for ecological zoning, resource and environment evaluation, and ecosystem change and management.
Initially, studies of natural regional differences mostly focused on a single factor such as temperature, precipitation, soil, and vegetation [10] but individual natural factors are in a state of interaction and mutual restraint [11,12]. The classification of differences among single factors is one-sided, and many other factors should be taken into account [13]. For example, Fernandez and Sayama [14] proposed a classification framework for large river basins based on temporal patterns of precipitation, evaporation, storage and runoff utilizing a global dataset. Another famous approach is the Köppen Climate Classification, which considers temperature and precipitation [15] and offers clear standard boundaries, but its operation is tedious, and it lacks hydrologically relevant details in the form of the interaction between water and energy availability and so on [3,16].
In addition, many hydro-climatic classification studies have been conducted by examining synthetic climate indices [17], such as the humidity index [18], potential evaporation and dryness tolerance [19,20], latent potential evaporation, moisture levels [21], biological temperature, dryness index (DI, which is often refer to as aridity index) [22], and temperature and humidity/aridity values [23]. Budyko [24] found that the DI drives the partitioning of precipitation into runoff and evaporation across the large-scale long-term average water balance, and the DI is widely applied as an indicator to large-scale climate classifications [25,26,27]. For instance, Wu et al. [27] classified China into four climatic zones using the DI. But hydro-climatic classifications based on a synthetic climate index still involve one-dimensional mapping, which cannot reflect overall regional differences [28]. Recent studies (e.g., [16,29,30]) all show that three climatic indices can help characterize flow regimes. As pointed by Knoben et al. [16], at least two aspects, e.g., available water (precipitation) and energy (temperature and evaporation) should be considered to conceptualize regional hydro-climatic characteristics. Understanding of this principle has led to the Budyko curve for assessing annual water balance [16].
In 1974, Budyko [24] proposed a well-known hydro-climatic scheme based on the DI and evaporative index (EI). He found that the relationship between the DI and EI is basically represented as a single line though he acknowledged that small variations around the curve can arise depending on local conditions. Subsequent studies have further detected the deviations from the Budyko curve, indicating that the DI and EI do not purely reflect a single line relationship, which indicates that, in addition to the DI, other variables besides the DI can influence variability in the regional water balance [13,31,32,33]. Land surface conditions [32,34,35,36,37,38,39,40,41] and climate variability [42,43,44,45,46,47,48] have been identified as responsible for such deviations. In fact, Fu [49] found a theoretical non-monomial relationship between the DI and EI and derived Fu’s equation in which parameter ω was introduced to the Budyko hypothesis to reflect deviations from the Budyko curve. In other words, parameter ω can reflect similarities and differences among regions. The parameter (ω) is assumed to represent the synthesized effects of vegetation cover, soil properties, and catchment topography on water balance [31,32].
Based on Fu’s theoretical works, the physical significance of parameter ω has been widely discussed. For example, Zhang et al. [31] found that parameter ω is higher for forested catchments than grass-covered catchments. Merz and Blöschl [50] manually divided Austria into five hydro-climatic regions through an assessment of the hydro-climatic variability of catchments and found that each region is plotted differently on the Budyko curve. Yang et al. [32] analyzed 108 catchments in the Yellow River basin and found that parameter ω presents significant regional distribution characteristics. In fact, the value of parameter ω can be directly estimated through long-term mean water balance and average climate using Fu’s equation. Furthermore, Yang et al. [32] suggested an empirical formula for estimating it in terms of the dimensionless landscape parameters.
Above studies have shown that different values of parameter ω on the Budyko curve represent different hydro-climatic attributes. However, so far it is only used to reveal the differences of hydro-climatic conditions caused by different land covers in regional scale. In continental scale, Greve et al. [51] assessed the predictability of water availability in regions by using a probabilistic Budyko framework assuming a certain distribution of the parameter ω. While as noted by Greve et al. [51], ω is not a constant and differs between catchments that are characterized by different land surface and climatic conditions. That is to say ω varies according to climatic conditions. Hence, Budyko theory should have the potential to be used for continental-scale classifications.
Our objective is to develop a theoretical framework for hydrologic classification by assessing mean annual water balance based on Budyko theory. The suggested multiple-dimensional classification strategy applied in this study uses three climatic indices, i.e., the DI, EI, and parameter ω, to repartition a traditional climatic zone in terms of the DI. To verify the classification results, a similarity standard is proposed: optimal partition results are obtained when most similar stations within each sub-region are selected. In this study, the multi-dimensional classification framework is applied to Mainland China to obtain optimal partition results, and the hydrothermal conditions for each type of station and differences and similarities among stations in the same climatic zone are discussed. Finally, we evaluate the results of our hydro-climatic classification for Mainland China.
2. Data and Methods
2.1. Study Area and Data
China is located in eastern Asia on the west bank of the Pacific Ocean, which is heavily affected by the monsoon climate. Climatic patterns range from tropical, subtropical, warm–temperate, and temperate to cold–temperate from south to north in the eastern regions of the country. Moreover, due to the continental climate, climatic patterns shift from humid to arid from east to west. At the same time, more than half of China is occupied by mountains and plateaus, and these local climates and complex physiognomic features produce a large variety of biomes across the country.
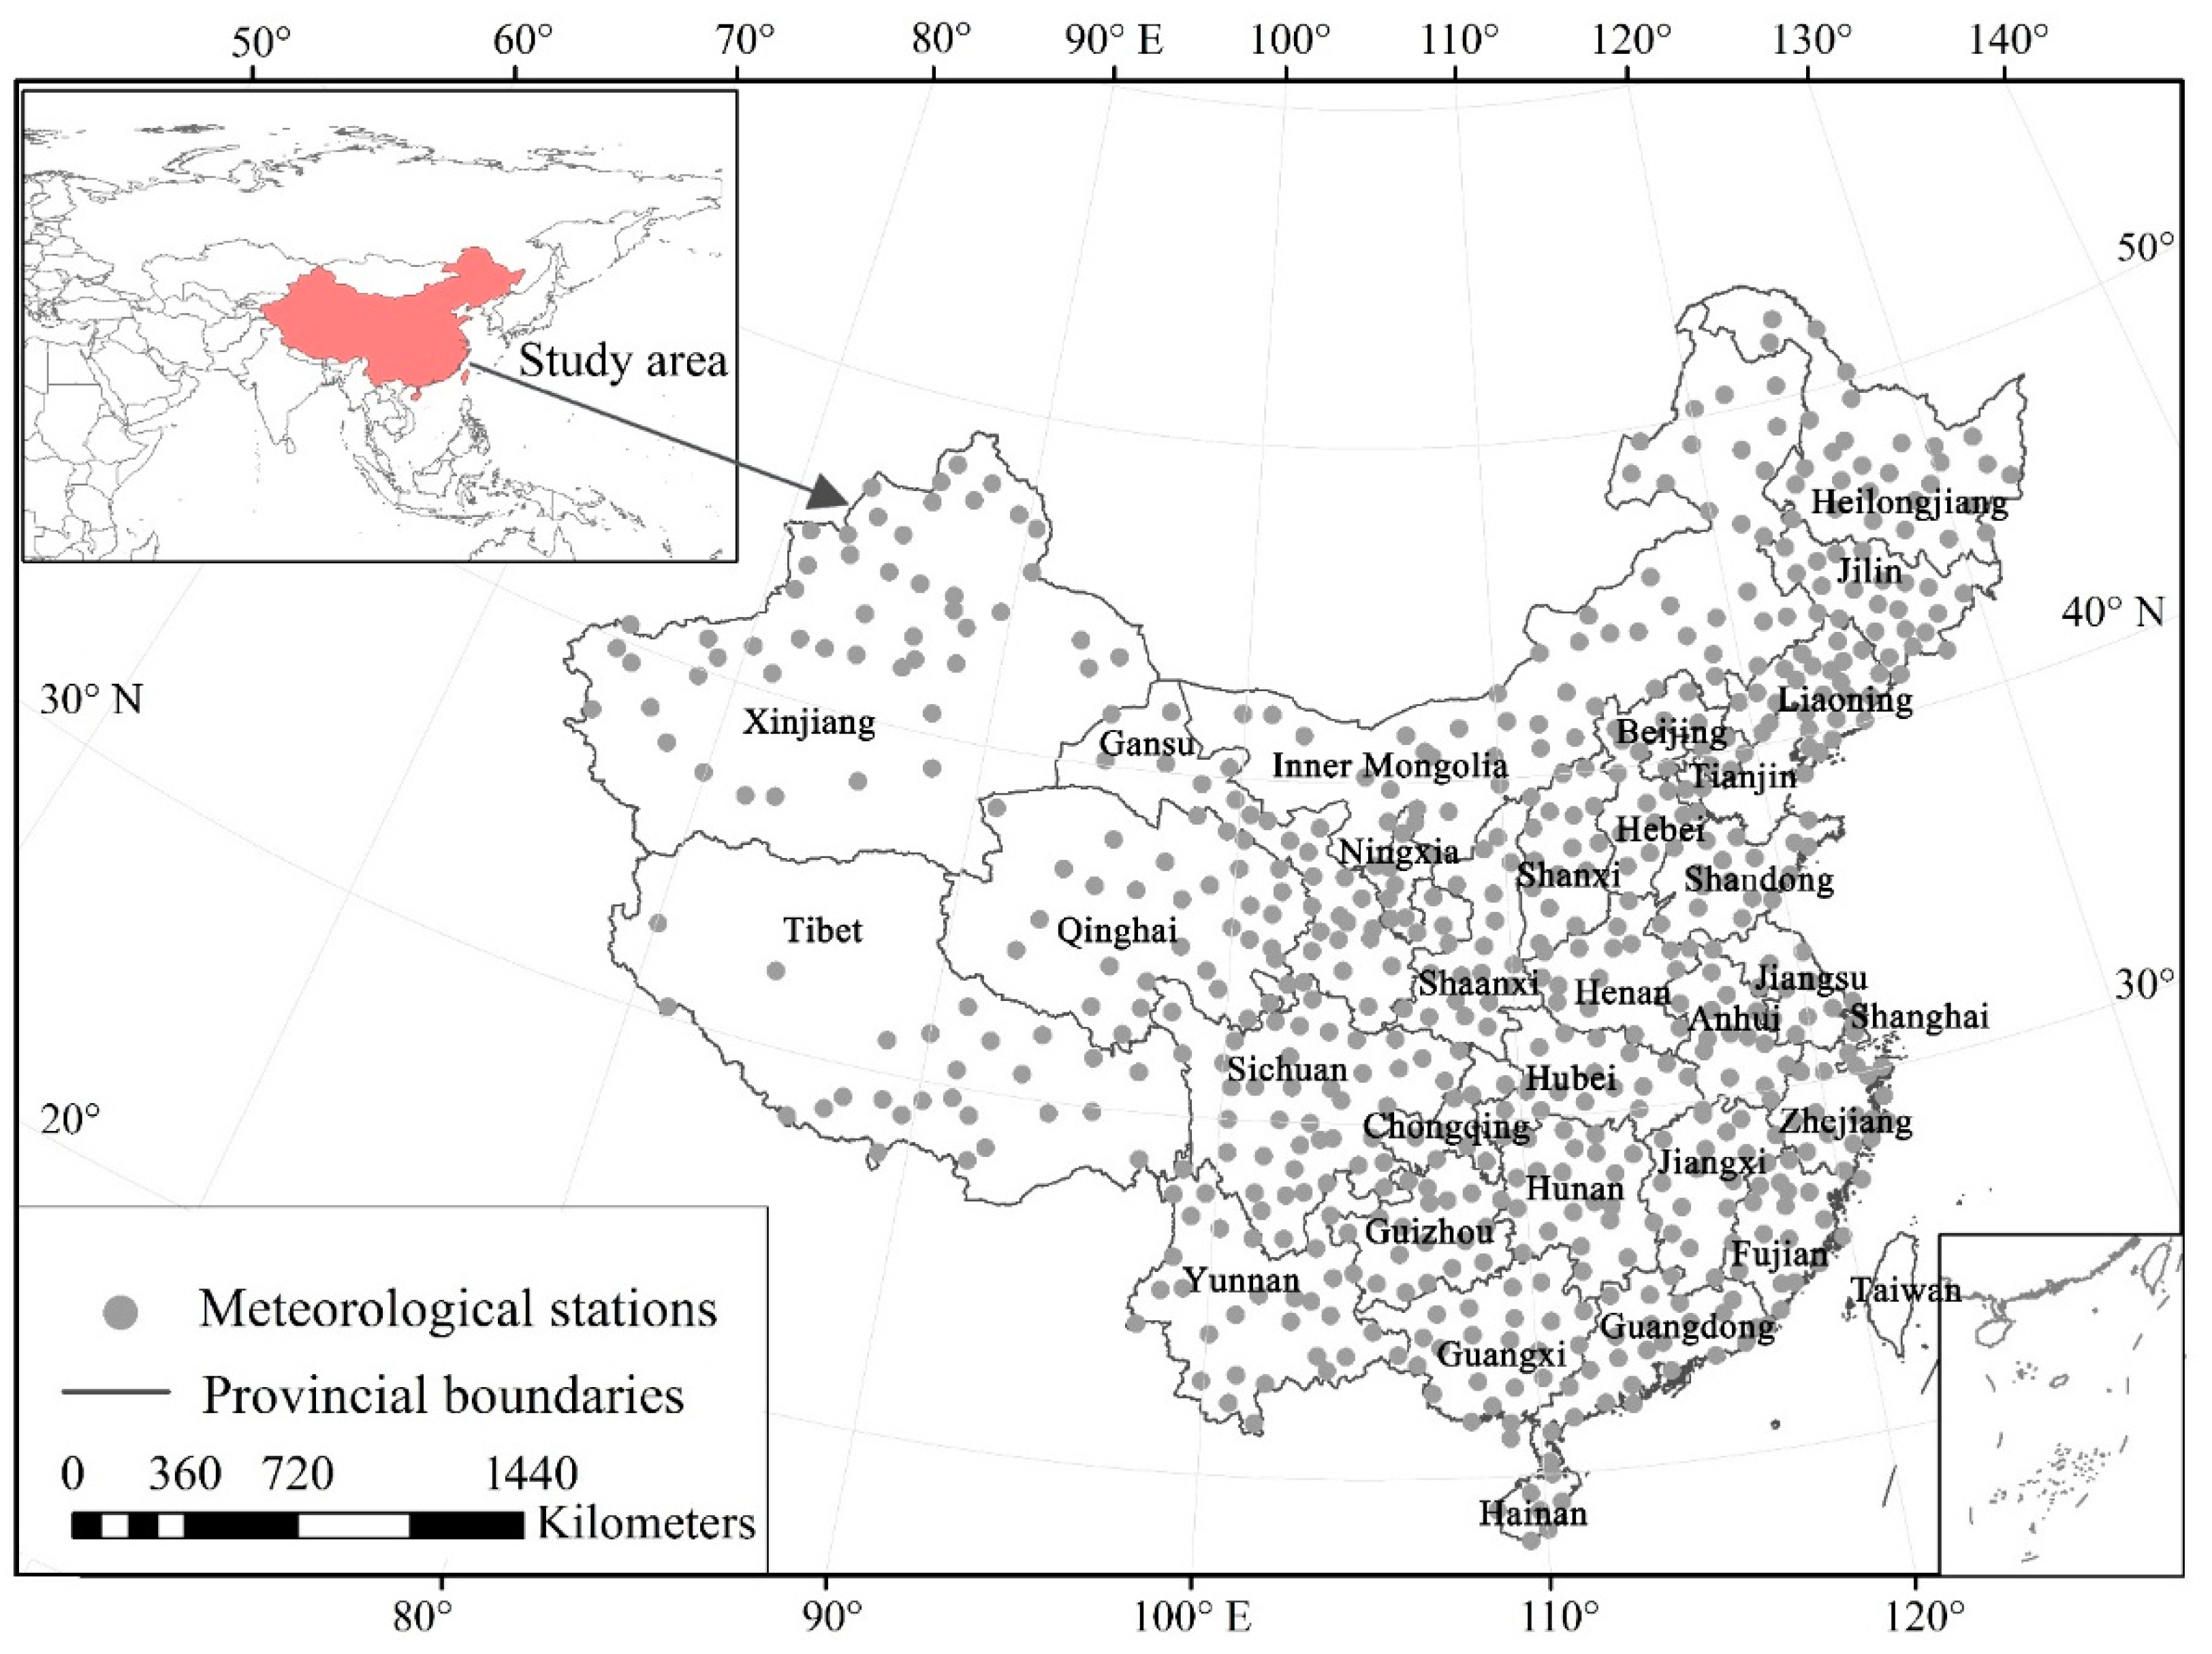
The climate data considered (1961–2012) include the observed monthly mean temperature, precipitation, relative humidity, wind speed and sunshine period values (from the National Data Center of the China Meteorological Administration) from 637 stations across Mainland China (Figure 1). Thus, Mainland China is selected as the study area and islands without data are not considered in sub-region classification in this study. (Figure 1). The 90 m Advanced Spaceborne Thermal Emission and Reflection Radiometer Global Digital Elevation Model (ASTER GDEM) data was obtained from the Geographical Spatial Data Cloud of the Computer Network Information Center of the Chinese Academy of Sciences [52]. Soil types were provided by the Institute of Soil Science of the Chinese Academy of Sciences [53], and soil texture data were collected from the Data Center for Resources and Environmental Sciences of the Chinese Academy of Sciences (RESDC) [54].
2.2. Budyko Theory
The general form of Budyko theory is given as follows:
where DI is the dryness index; EI is the evaporative index; P is the mean annual precipitation (mm); E0 is the mean annual potential evapotranspiration (mm), and Ea is the mean annual actual evapotranspiration (mm).
Based on the Budyko hypothesis, Fu [49] obtained a theoretical analytical formula for the Budyko curve through dimension analysis and mathematical derivation [31] that is referred to as Fu’s equation:
where ω > 1 is a dimensionless parameter. As has been documented (e.g., [31,32]), parameter ω represents the synthesized effects of catchment characteristics on water balance, and its value can be calibrated through long-term mean water balance and average climate using Fu’s equation. As is impacted not only by climate but also catchment factors, local long-term water balance should not vary along a single Budyko curve and, thus, only a group of such curves can be able to represent the regional differences.
2.2.1. Potential Evapotranspiration
According to the FAO [55], the Penman-Monteith method for potential evapotranspiration can be expressed as:
where G is the soil heat flux density (MJ m−2 d−1); T is the air temperature measured at a height of 2 m (°C); u2 is the wind speed measured at a height of 2 m (m s−1); es is the saturation vapour pressure (kPa); ea is the actual vapour pressure (kPa); es − ea is the saturation vapour pressure deficit (kPa); Δ is the slope vapour pressure curve (kPa °C−1); γ is the psychrometric constant (kPa °C−1); and Rn is the net radiation measured from the crop surface (MJ m−2 d−1).
Rn is calculated as follows:
where Ab is the ground reflectance, which is related to surface conditions and soil moisture content levels; s denotes periods of sunshine; S is the maximum possible length of sunny periods; as and bs are dimensionless parameters, as is a regression constant that expresses the fraction of extraterrestrial radiation reaching the earth on overcast days (s = 0), as + bs represents the fraction of extraterrestrial radiation reaching the Earth on clear days (s = S); Ra is the solar shortwave radiation; and Rnl is the net long wave radiation.
The computation of all the data required to calculate of E0 followed Chapter 3 of FAO Paper 56 [55]. Moreover, recommended values for parameters as and bs for Mainland China were used to calculate solar radiation levels [56]. The monthly accumulated values of potential evapotranspiration are used for estimating actual evapotranspiration in the following section.
2.2.2. Actual Evapotranspiration
Actual evapotranspiration is estimated through a water balance model is based on the Thornthwaite-Mather approach [21] in this study. Here Ea is calculated as follows:
where Wfc is the field capacity, Wp is the wilting point, and W is the soil water content (Wp ≤ W ≤ Wfc). The field capacity (Wfc) and wilting point (Wp) data can be estimated from soil texture data. The soil moisture retention function β is based on the ratio of the available soil water content to the maximum available soil water content and expressed as . Accordingly, β will decrease linearly until all available water is used.
The governing equation of the water balance model is written as follows:
where L is the water surplus; ∆W is the monthly change in W; and ∆t is the time step. Soil moisture content levels measured at the beginning and end of each month are used to calculate ∆W. In the model, the soil depth of the model is set to 1 m.
Gao et al. [56] used this method to estimate monthly actual evapotranspiration for 686 stations over China. According to their suggestions, as the initial soil water content for each station is unknown a 60 months warm-up period (balancing routine) is used to force the net change in soil moisture from the beginning to the end of a specified balancing period to zero. They also suggested that the actual evapotranspiration can be assumed to be 0 mm when the monthly air temperature is less than or equal to 0°C as frozen soil or snow cover prevents effective evapotranspiration from the ground surface.
2.3. The Multi-Dimensional Classification Framework
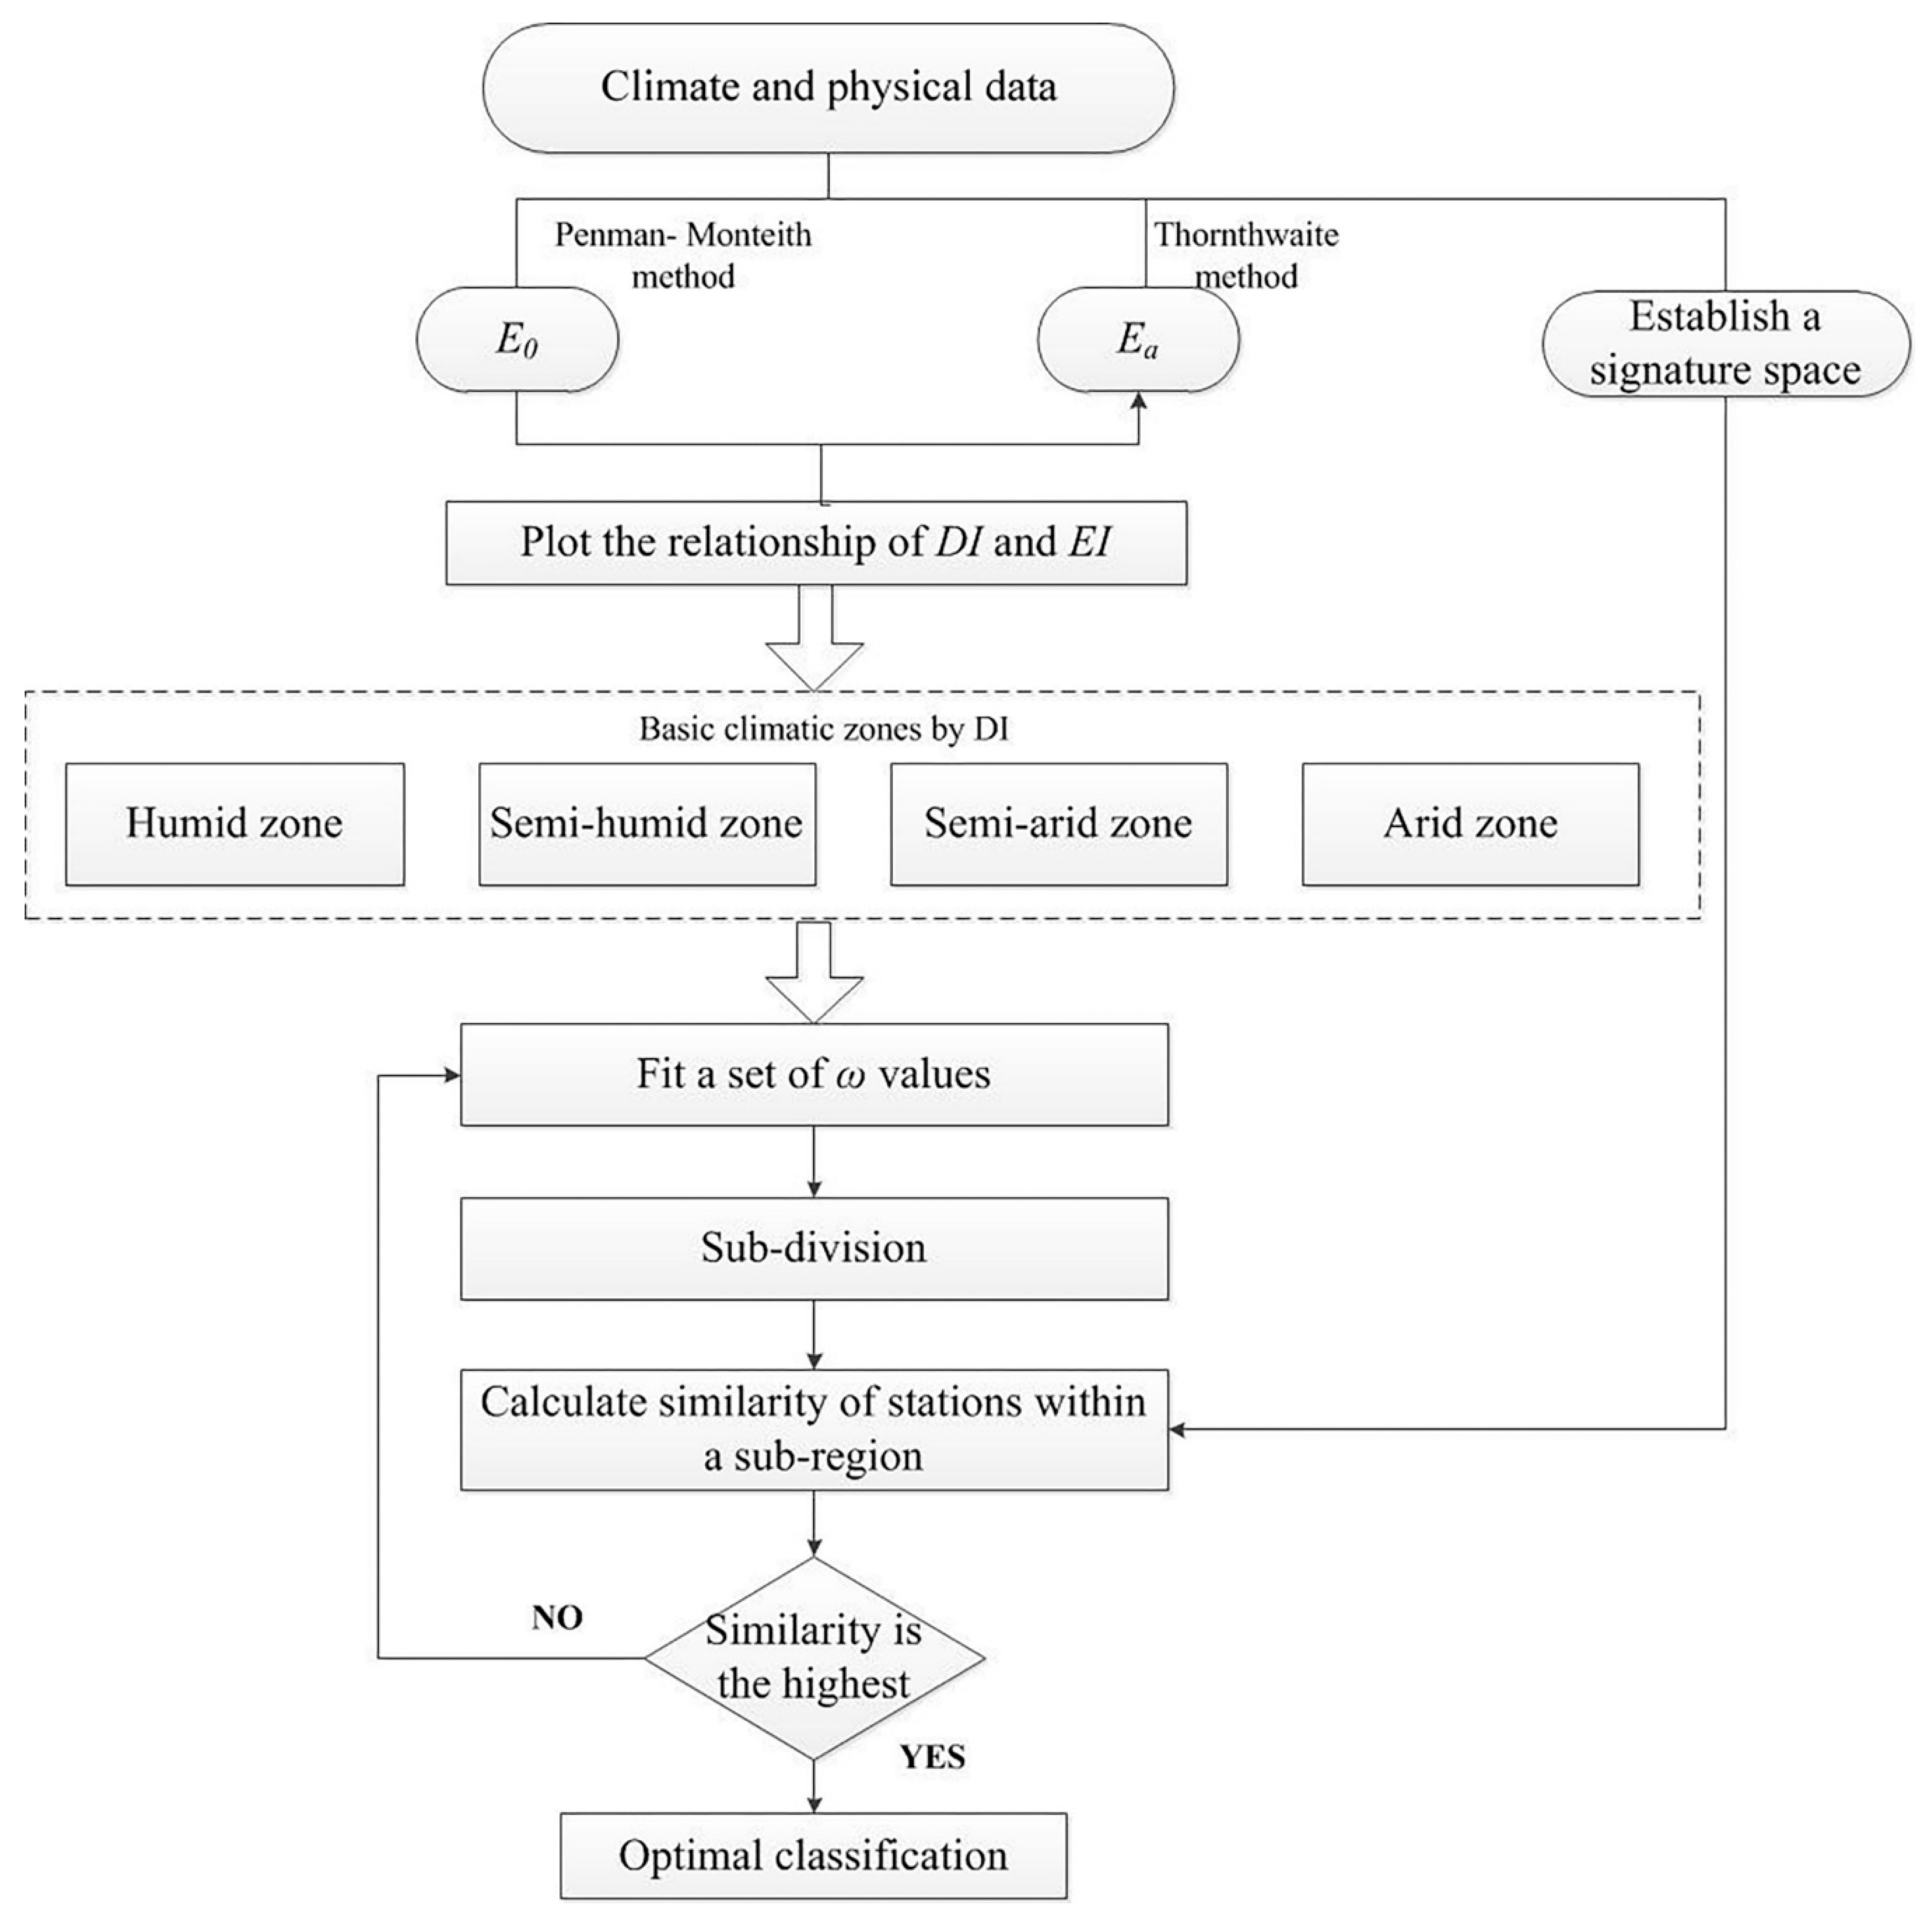
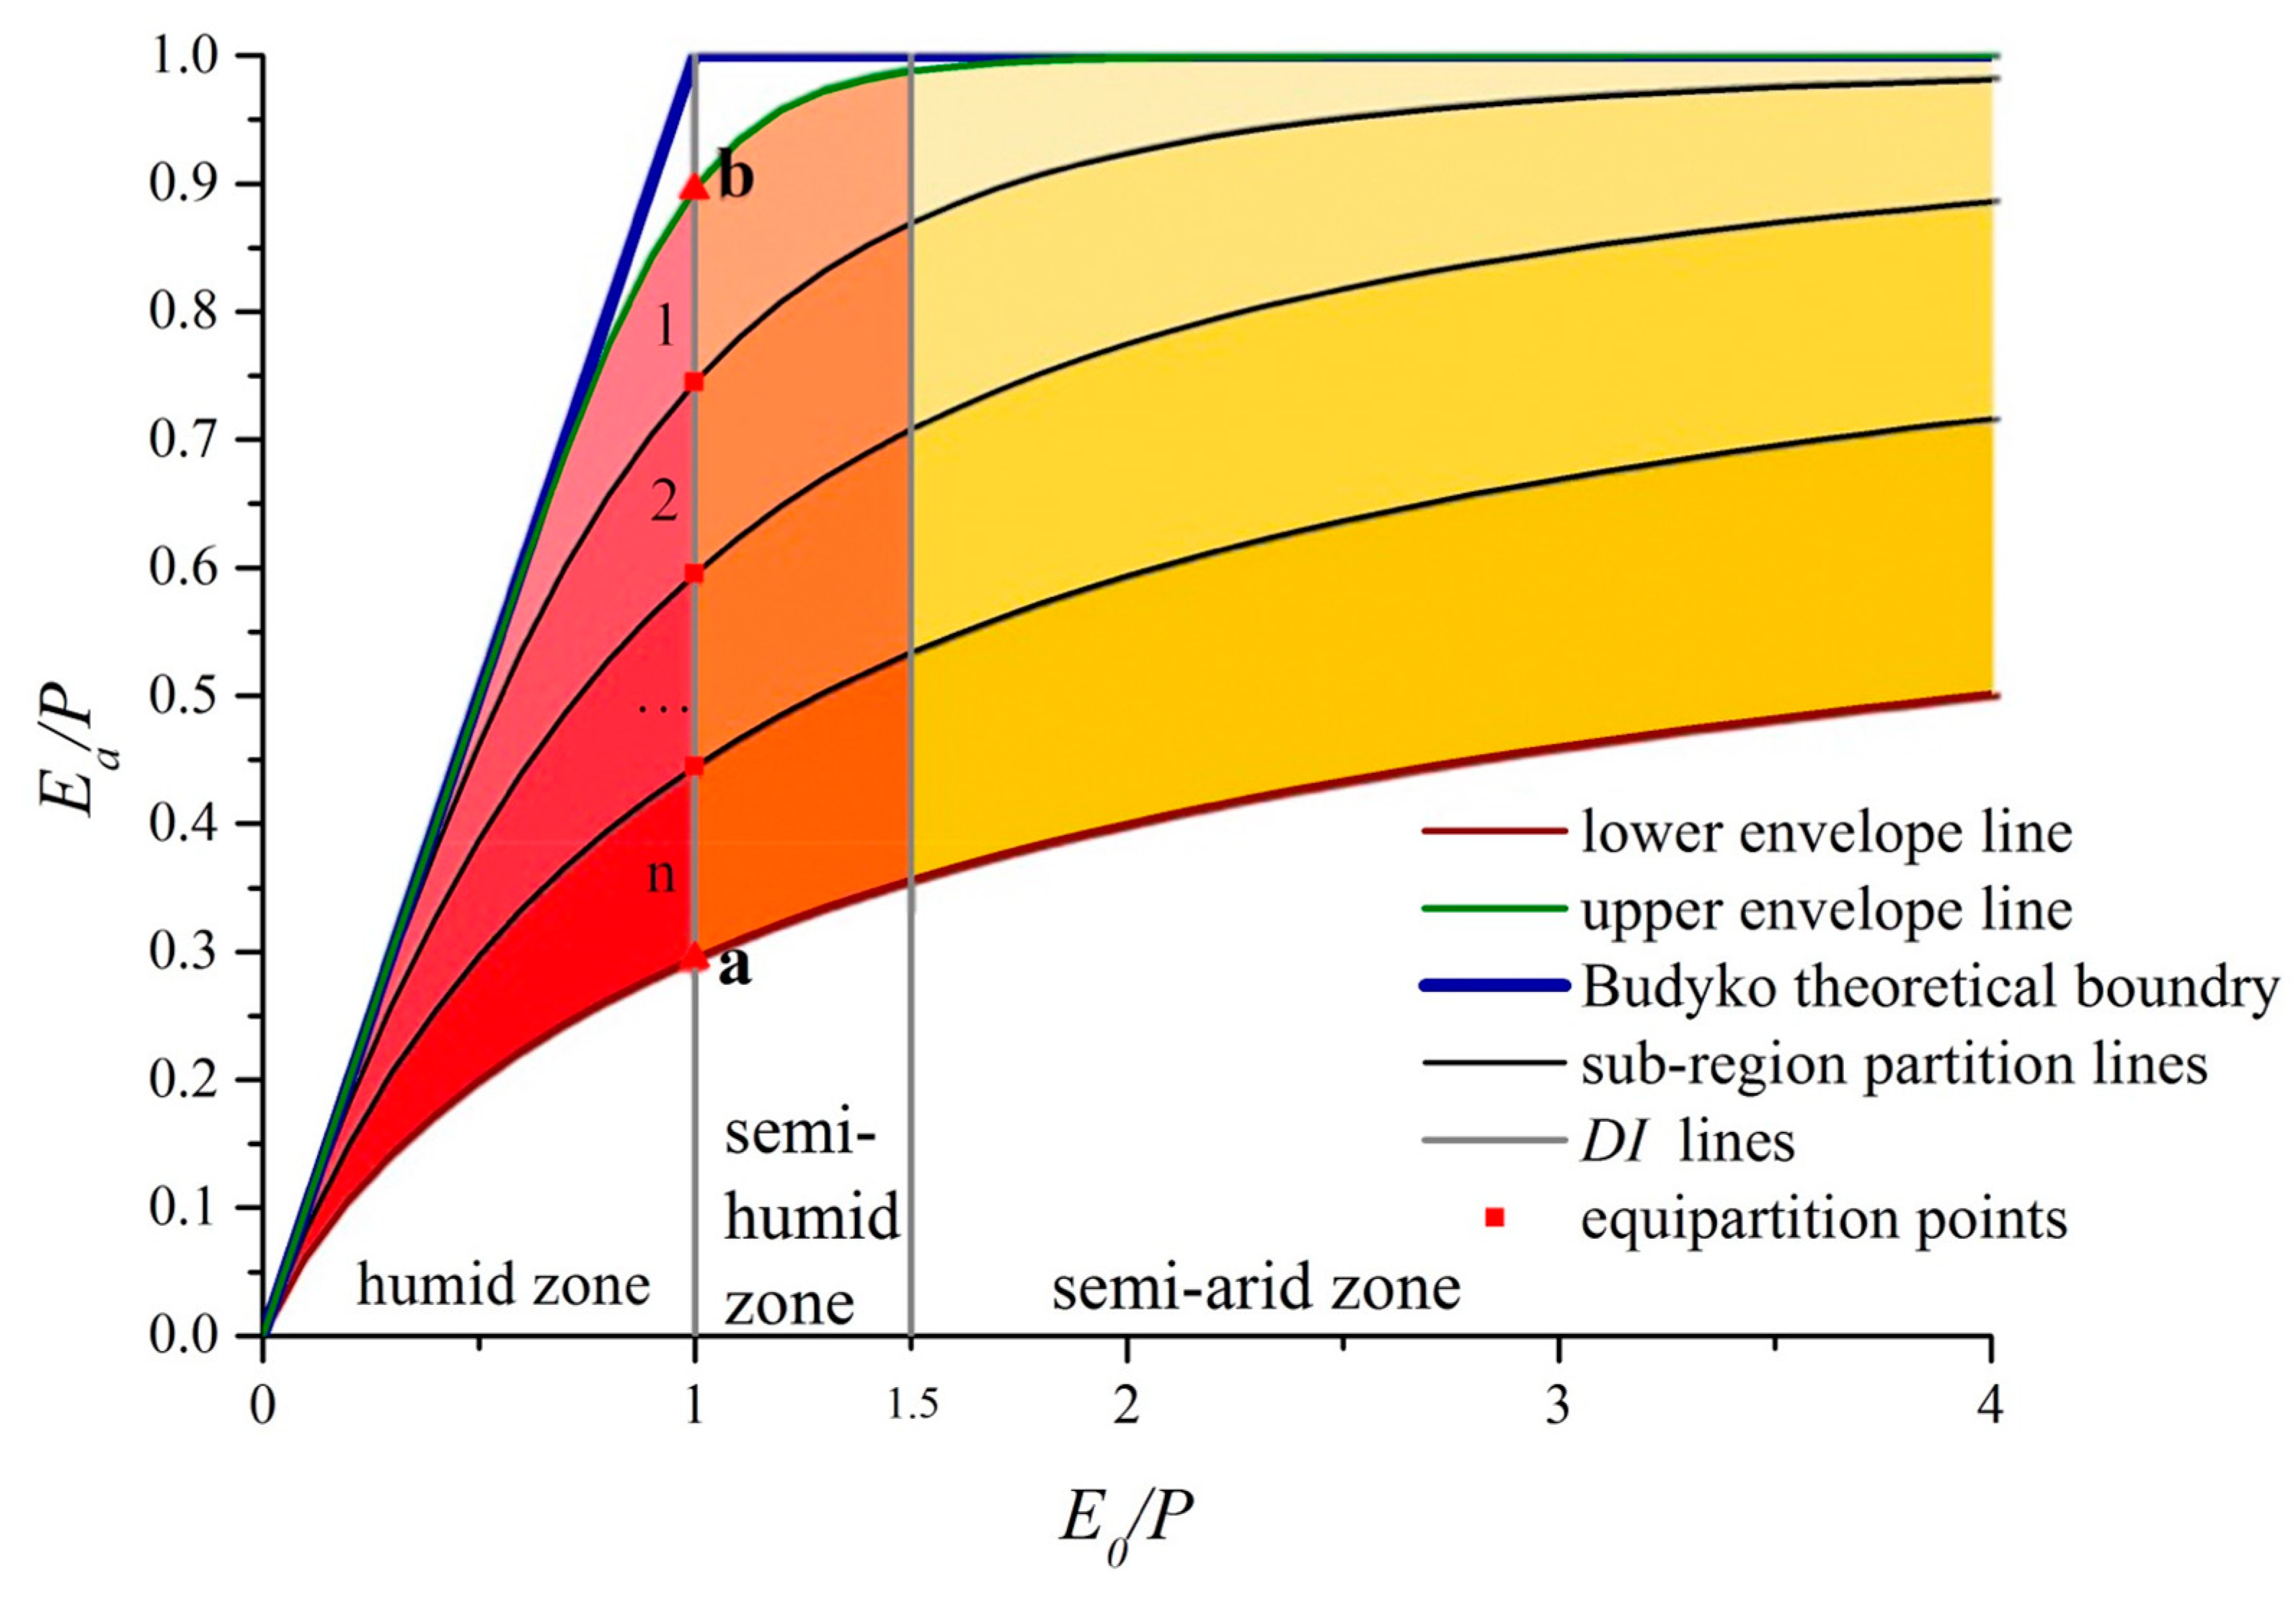
From the traditional climate classification framework in terms of the DI, Wu et al. [27] classified Mainland China into four climatic zones: a humid zone with DI ≤ 0.99, a semi-humid zone with DI∈(1.00, 1.49), a semi-arid zone with DI∈(1.50, 3.99), and an arid zone with DI ≥ 4.00. In this study, EI and parameter ω are further employed to repartition climatic zones. As shown in Figure 2, five main procedures are applied under the classification framework. First, the mean annual DI and EI values are calculated for each station, and point clouds for these values are plotted on the Budyko curve. Second, four climatic zones are classified based on the DI according to the method of Wu et al. [27]. Third, by setting different values of ω, a cluster of Fu’s curves is obtained, which divide each climatic zone into n sub-regions (see Figure 3). Here, the values of ω are determined to make Fu’s curves cross equipartition points on the line segment between intersections of the lower and upper envelope lines, namely, EI = a and EI = b while DI = 1 (Figure 3). Line DI = 1 was used as it forms the turning point of the Budyko theoretical boundary, and it is the dividing line between the humid zone and the non-humid zone. Moreover, as the EI is close to 1 when DI > 4, the arid zone is classified into two sub-regions with DI = 20 used as an indicator [57].
The similarities of stations derived from multivariate statistics are used to verify the classification results. Traditionally, multivariate statistical tools based on hydro-climatic and physical characteristics [6,58,59] have been used in hydro-climatic classification and regionalization studies. Thus, eight climatic and physical factors that can comprehensively characterize climatic, topographical, and surface conditions for each station were adopted in this study to establish an eight-dimensional vector space as follows:
where x1 to x5 represent average annual values of climatic factors (i.e., wind speed, vapour pressure, temperature, sunshine, and precipitation), x6 is station altitude, and x7 and x8 denotes the soil textures (namely, sand and clay content, respectively).
Similarities between any two stations are characterized by the distance in the vector space, namely, the Euclidean distance. The Euclidean distance between two meteorological stations can be obtained from Equation (10):
where and are normalized values of the eight-dimensional vectors Xi and Xk for the ith and kth stations, respectively, and ρ(Xi,Xk) and ρ(Xi,Xk) are the Euclidean distances of Xi and Xk, respectively. When this value is larger, the two stations are less similar. Optimal classification results can be obtained when the mean level of similarity between stations within each sub-region is the highest.
3. Results and Discussion
3.1. General Classification Results
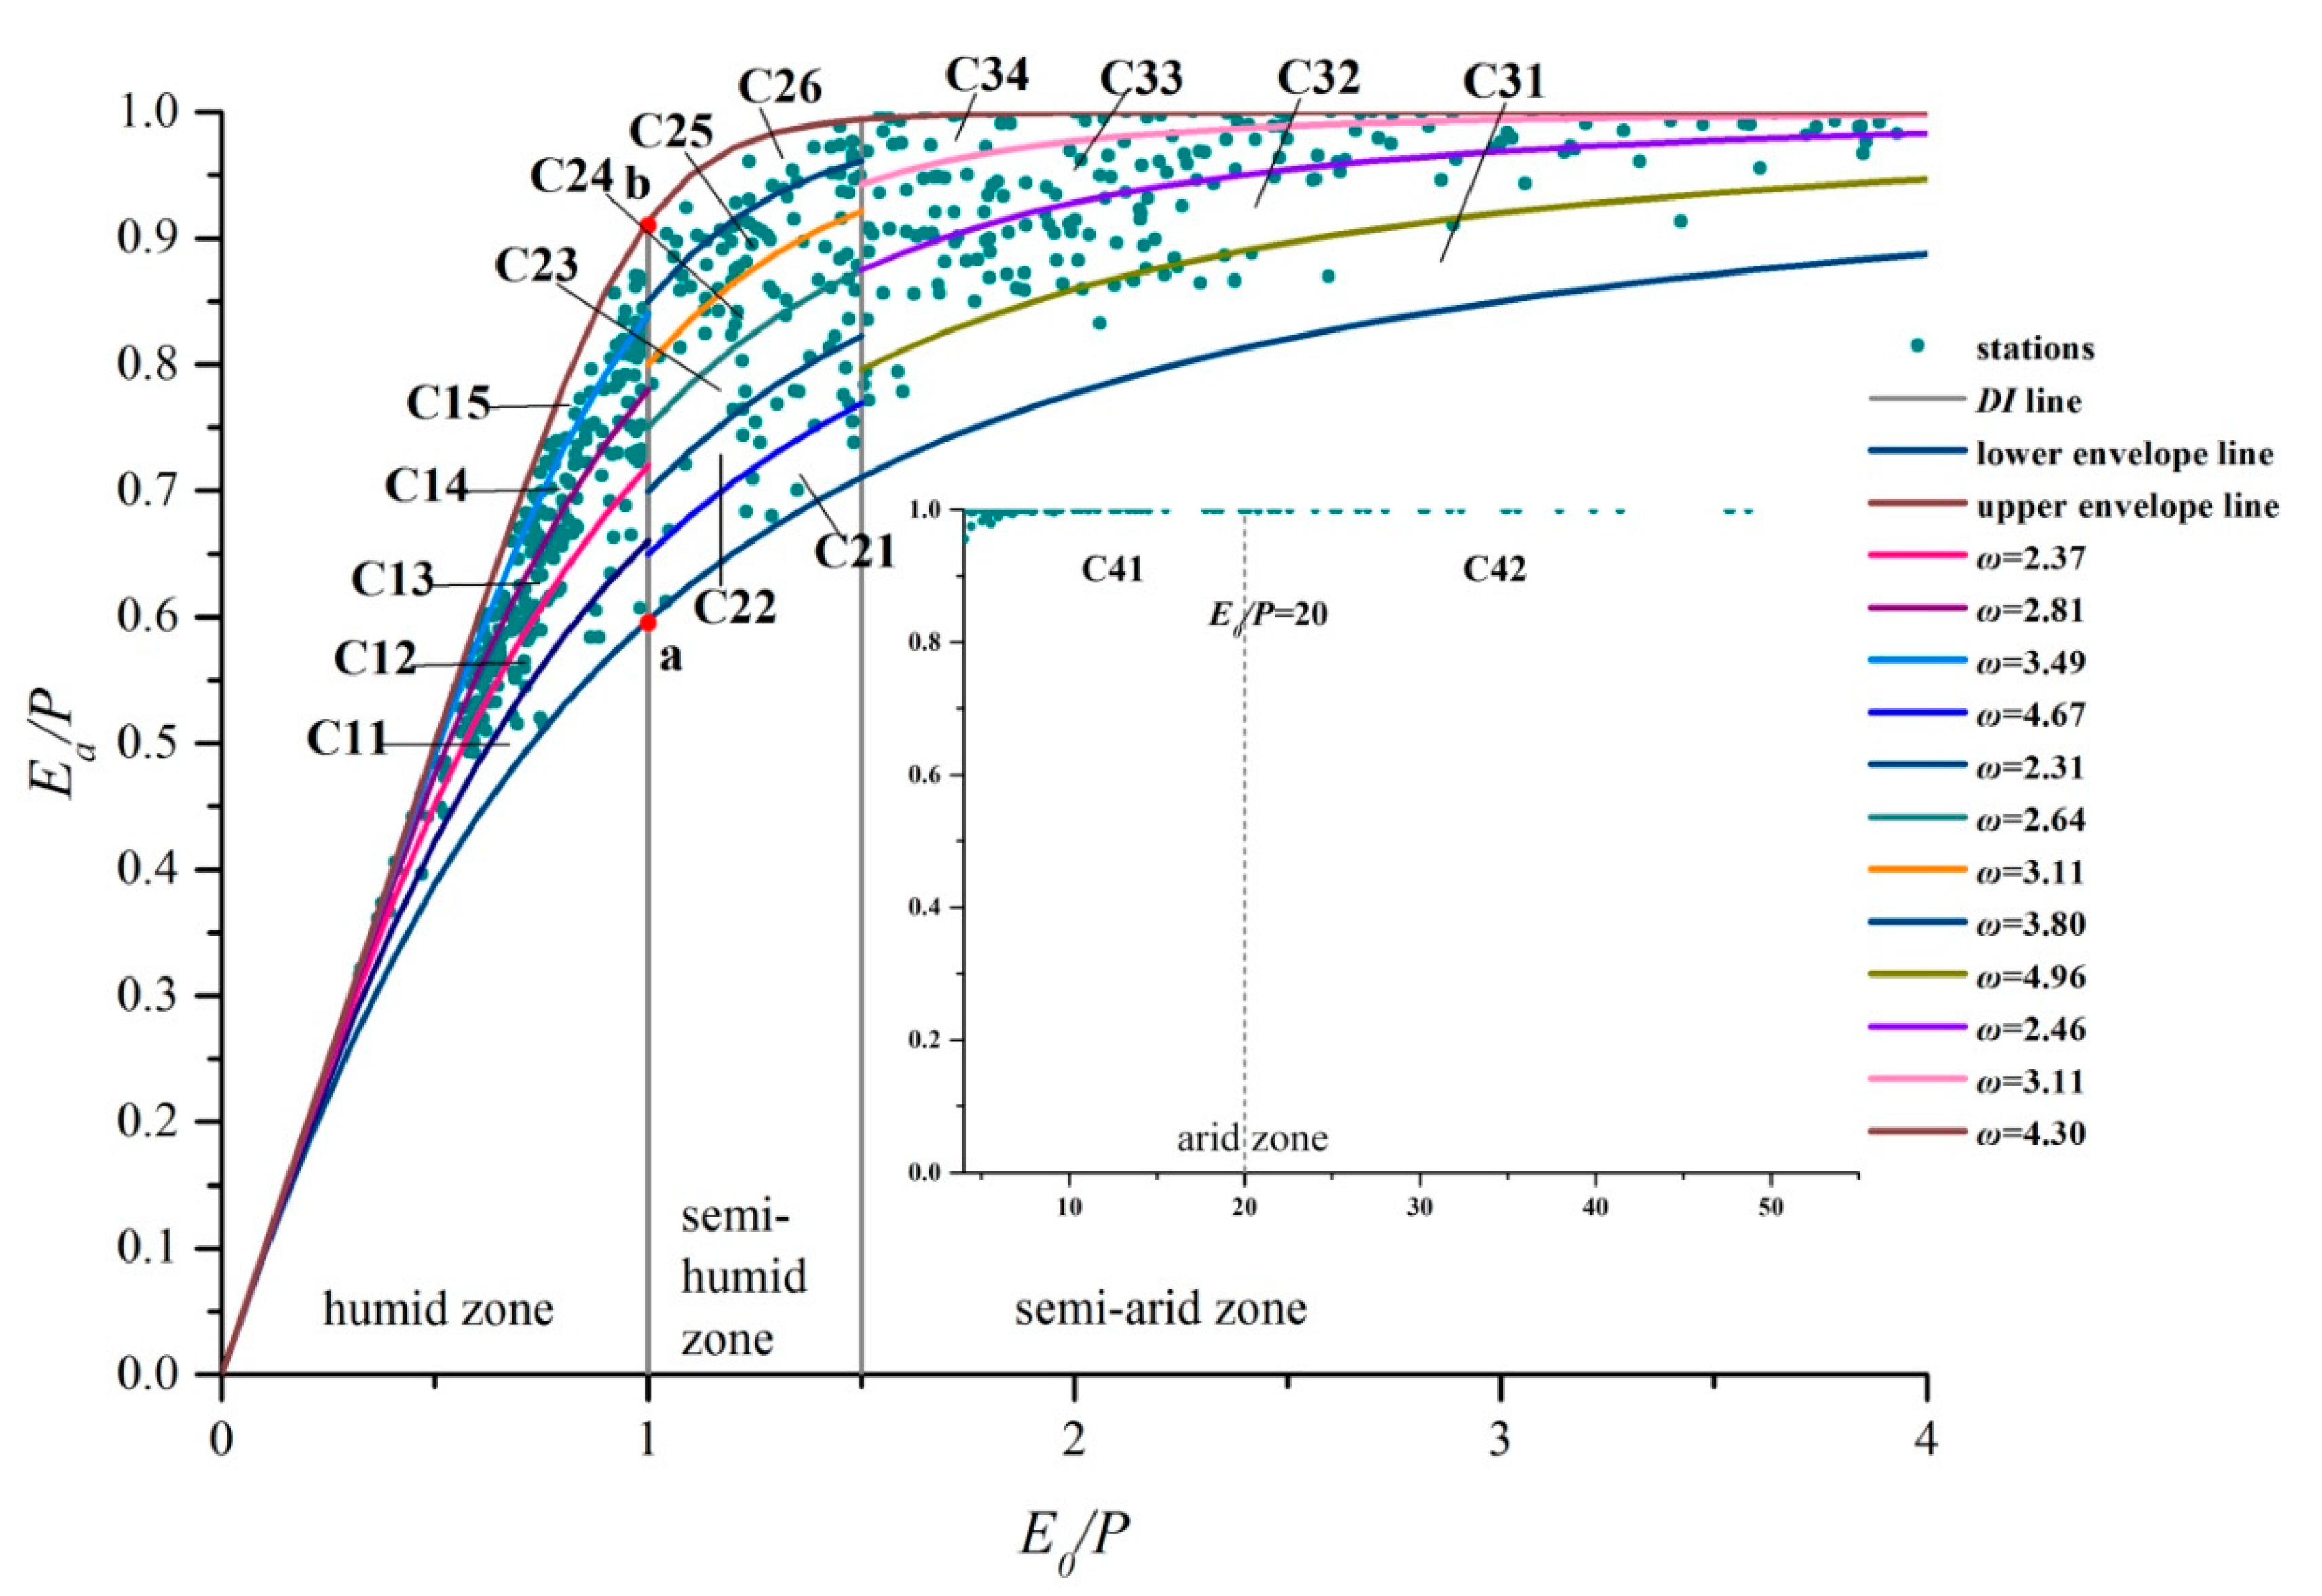
All 637 meteorological stations across Mainland China were used for the classification experiment. Mean annual E0 and Ea values for each station were calculated using long-term climatic data and the point cloud of the Budyko curve was plotted for all stations in Mainland China (Figure 4). First, four basic climatic zones—humid, semi-humid, semi-arid and arid—were classified based on the DI according to the method of Wu et al. [27]. It was found that stations from the same climatic zone cover a broad range of the Budyko curve (see Figure 4), with the exception of the arid zone. EI is close to 1, but DI covers a broad span of values ranging from 4 to 57 in the arid zone.
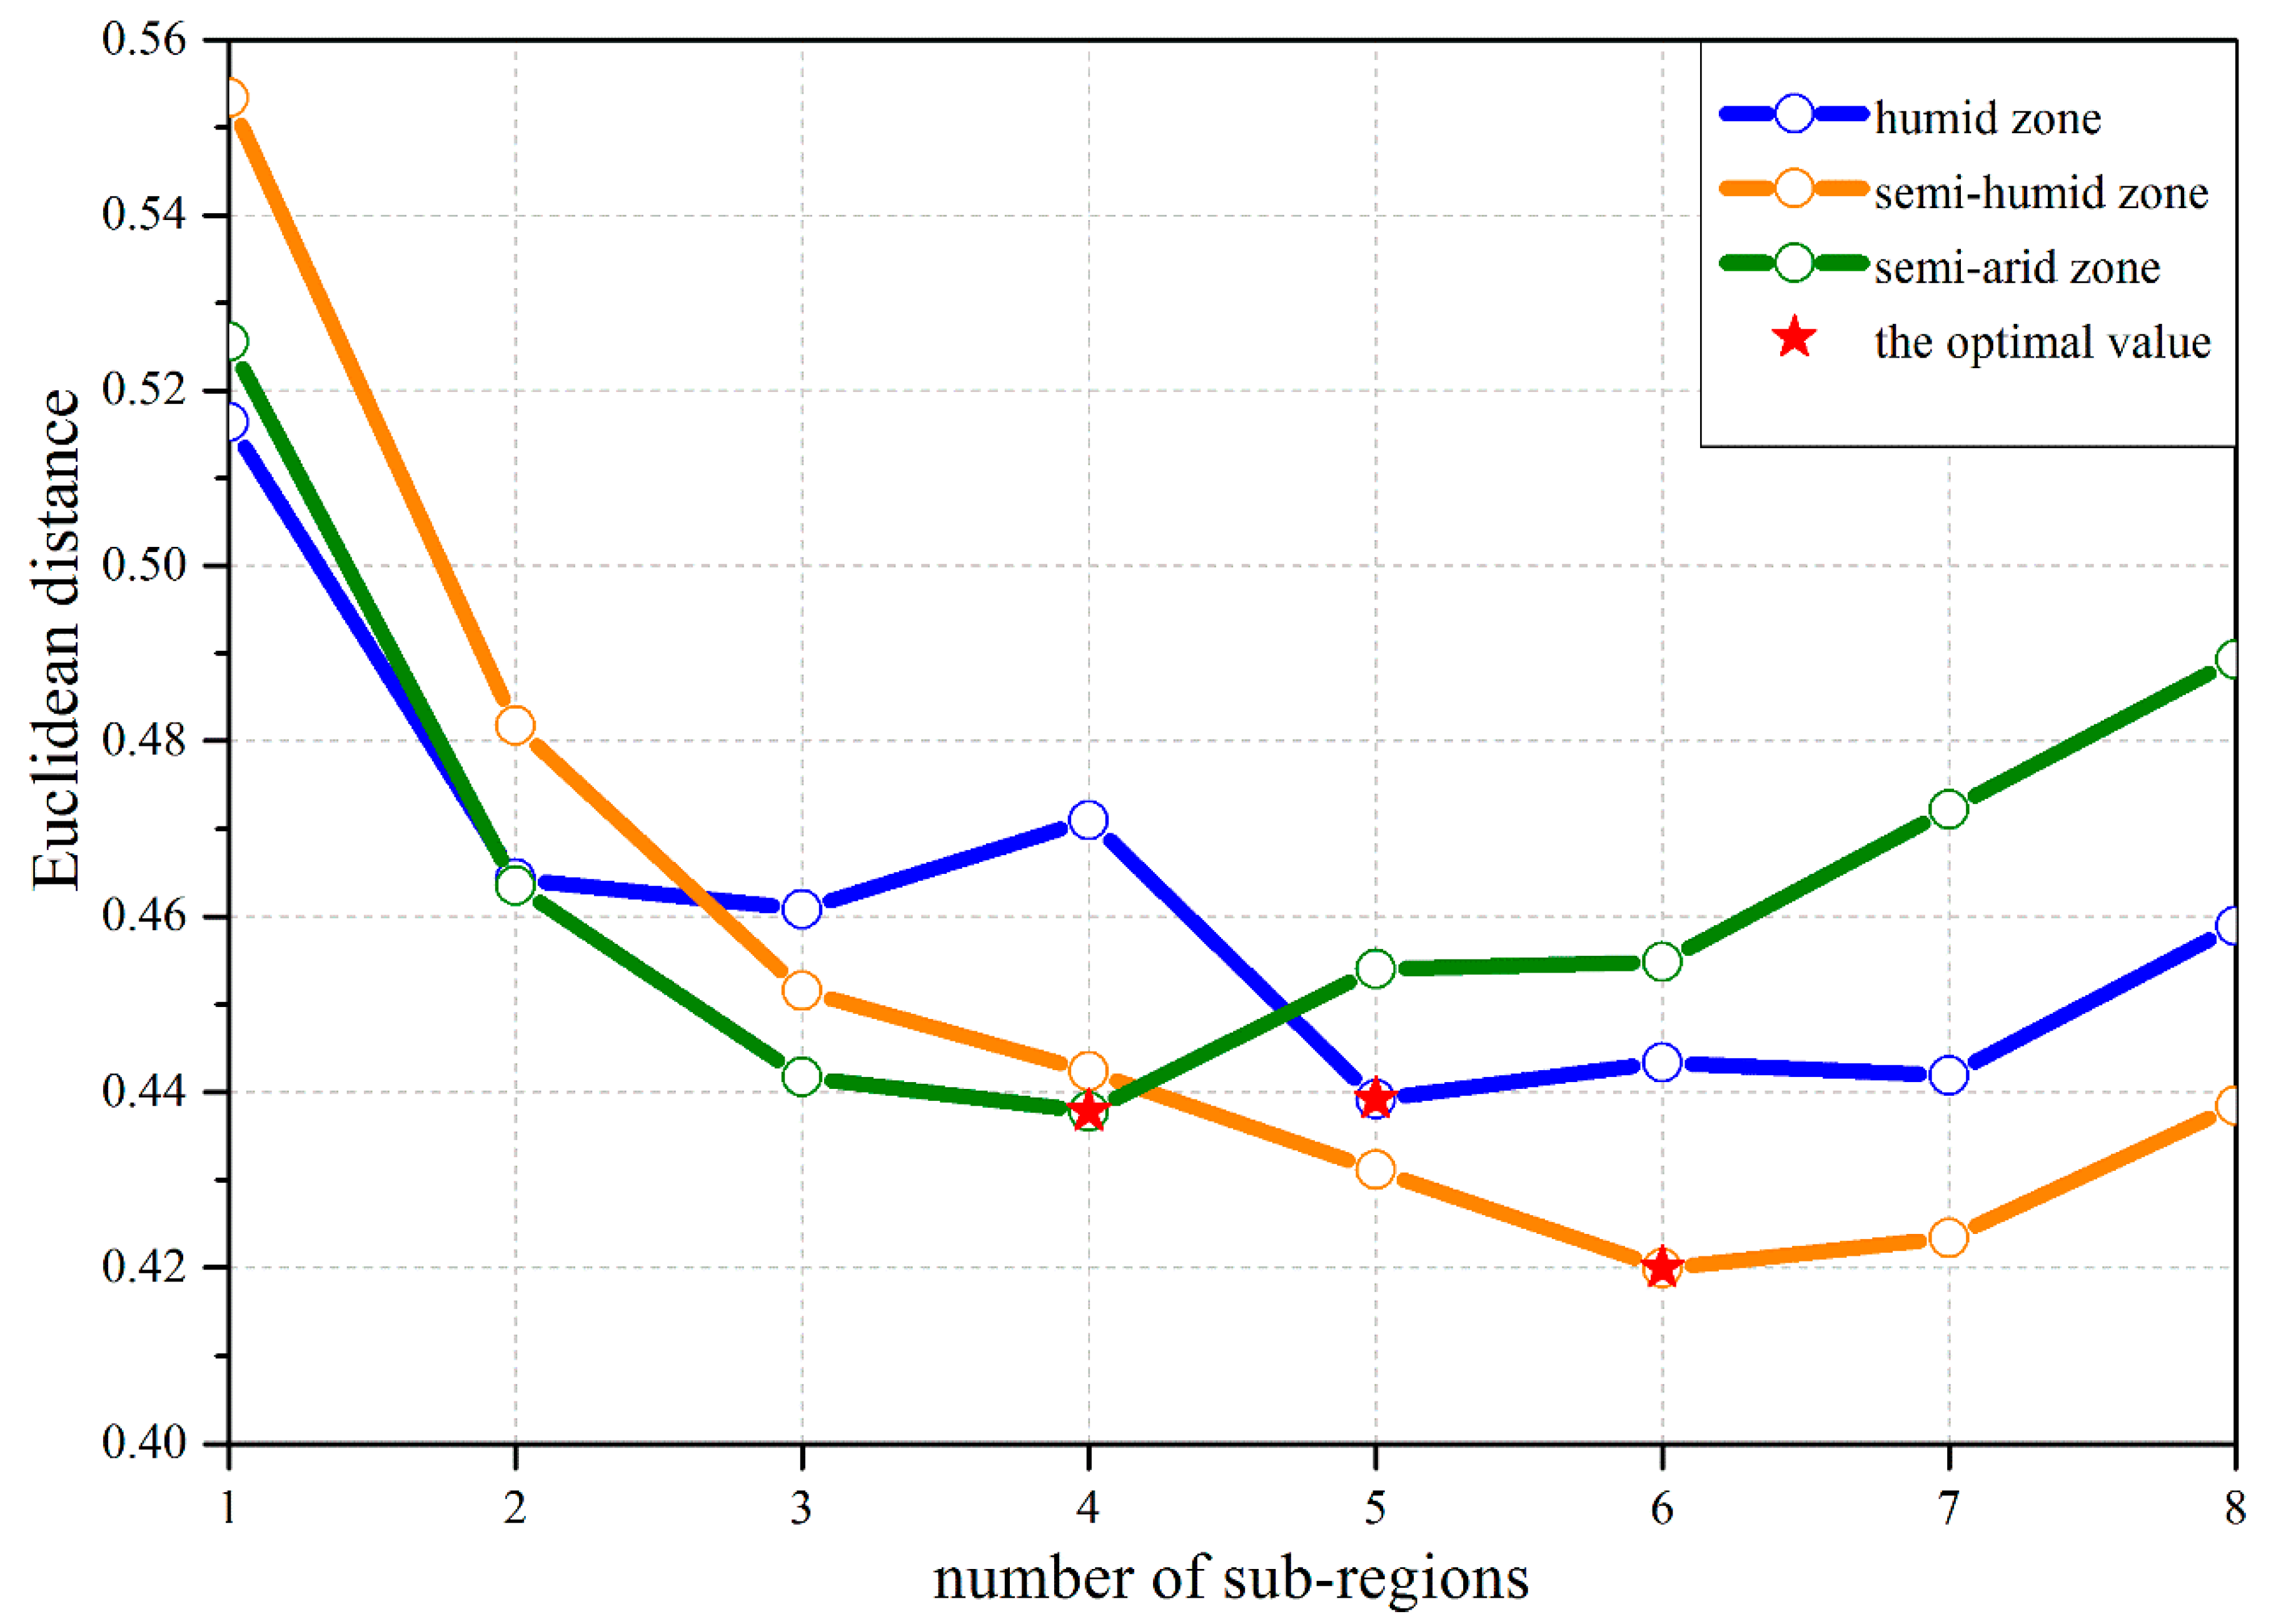
The large range of point clouds found on the Budyko curve at DI < 4.0 (in which EI has a relatively larger span) shows that the hydrothermal conditions are quite different within the same climatic zone, so EI can be used as an indicator to further sub-divide of each zone. Firstly, the lower envelope line with ω = 2.05 and the upper envelope line with ω = 8.40 were fitted according to Fu’s equation on the Budyko curve. As shown in Figure 4, when DI = 1, EI is in the range of 0.59–0.91, a = 0.59, and b = 0.91. Thus, equipartition points of the EI interval (0.59 ≤ EI ≤ 0.91) at DI = 1 can be obtained by setting different numbers of sub-regions. For this classification experiment, the default maximum number of sub-regions is set as 8, which is sufficiently large for an optimal classification through trial and error tests. The three climatic zones (humid, semi-humid, and semi-arid) were then sub-divided from one sub-region (the initial climatic zone in terms of the DI) to eight sub-regions, and eight experiments were conducted on each climatic zone.
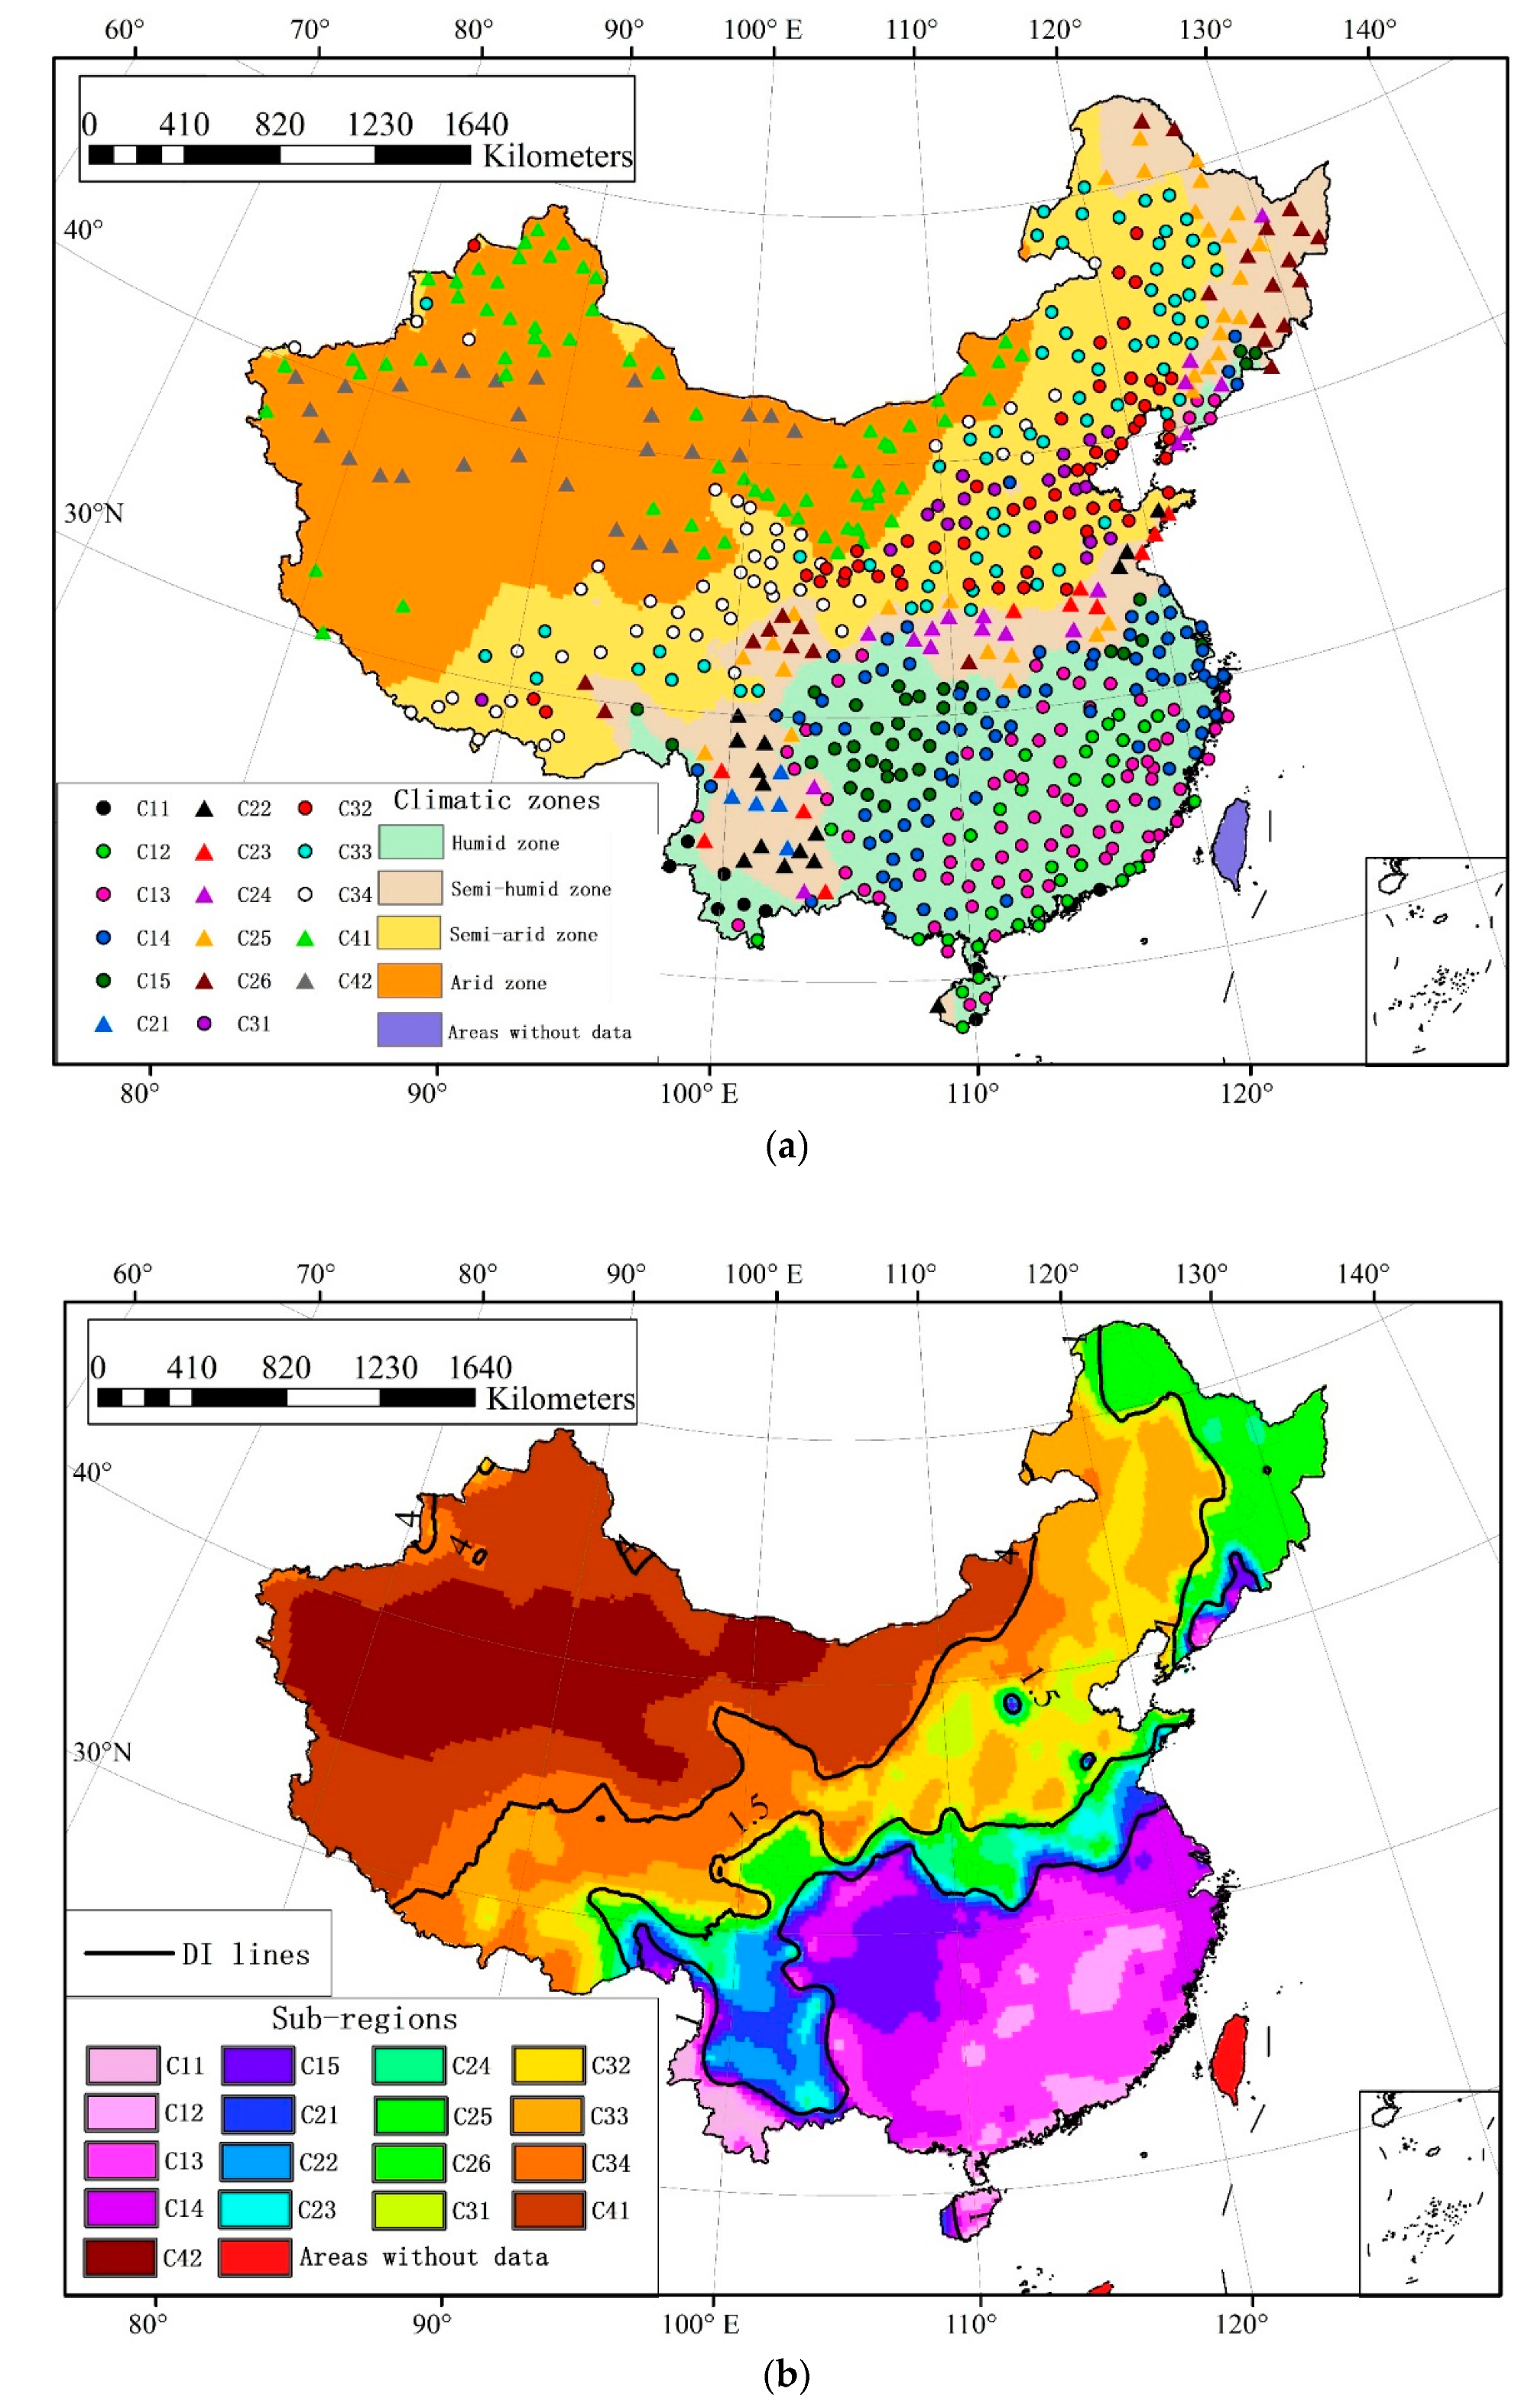
For each experiment, the average Euclidean distance between any two stations within a climatic zone was obtained, and the number of sub-regions as a function of the average Euclidean distance within a climatic zone is shown in Figure 5. As shown in the figure, the Euclidean distance for the humid zone is shortest when it is sub-divided into five sub-regions, and the optimal quantities of semi-humid and semi-arid zones are measured as 6 and 4, respectively. Using DI = 20 as an indicator, the arid zone is sub-divided into two sub-regions, so all 637 stations across China can be divided into 17 groups under the hydro-climatic classification framework (Figure 6a). Therefore, the four basic climatic zones of Mainland China are classified into 17 sub-regions (Figure 6b).
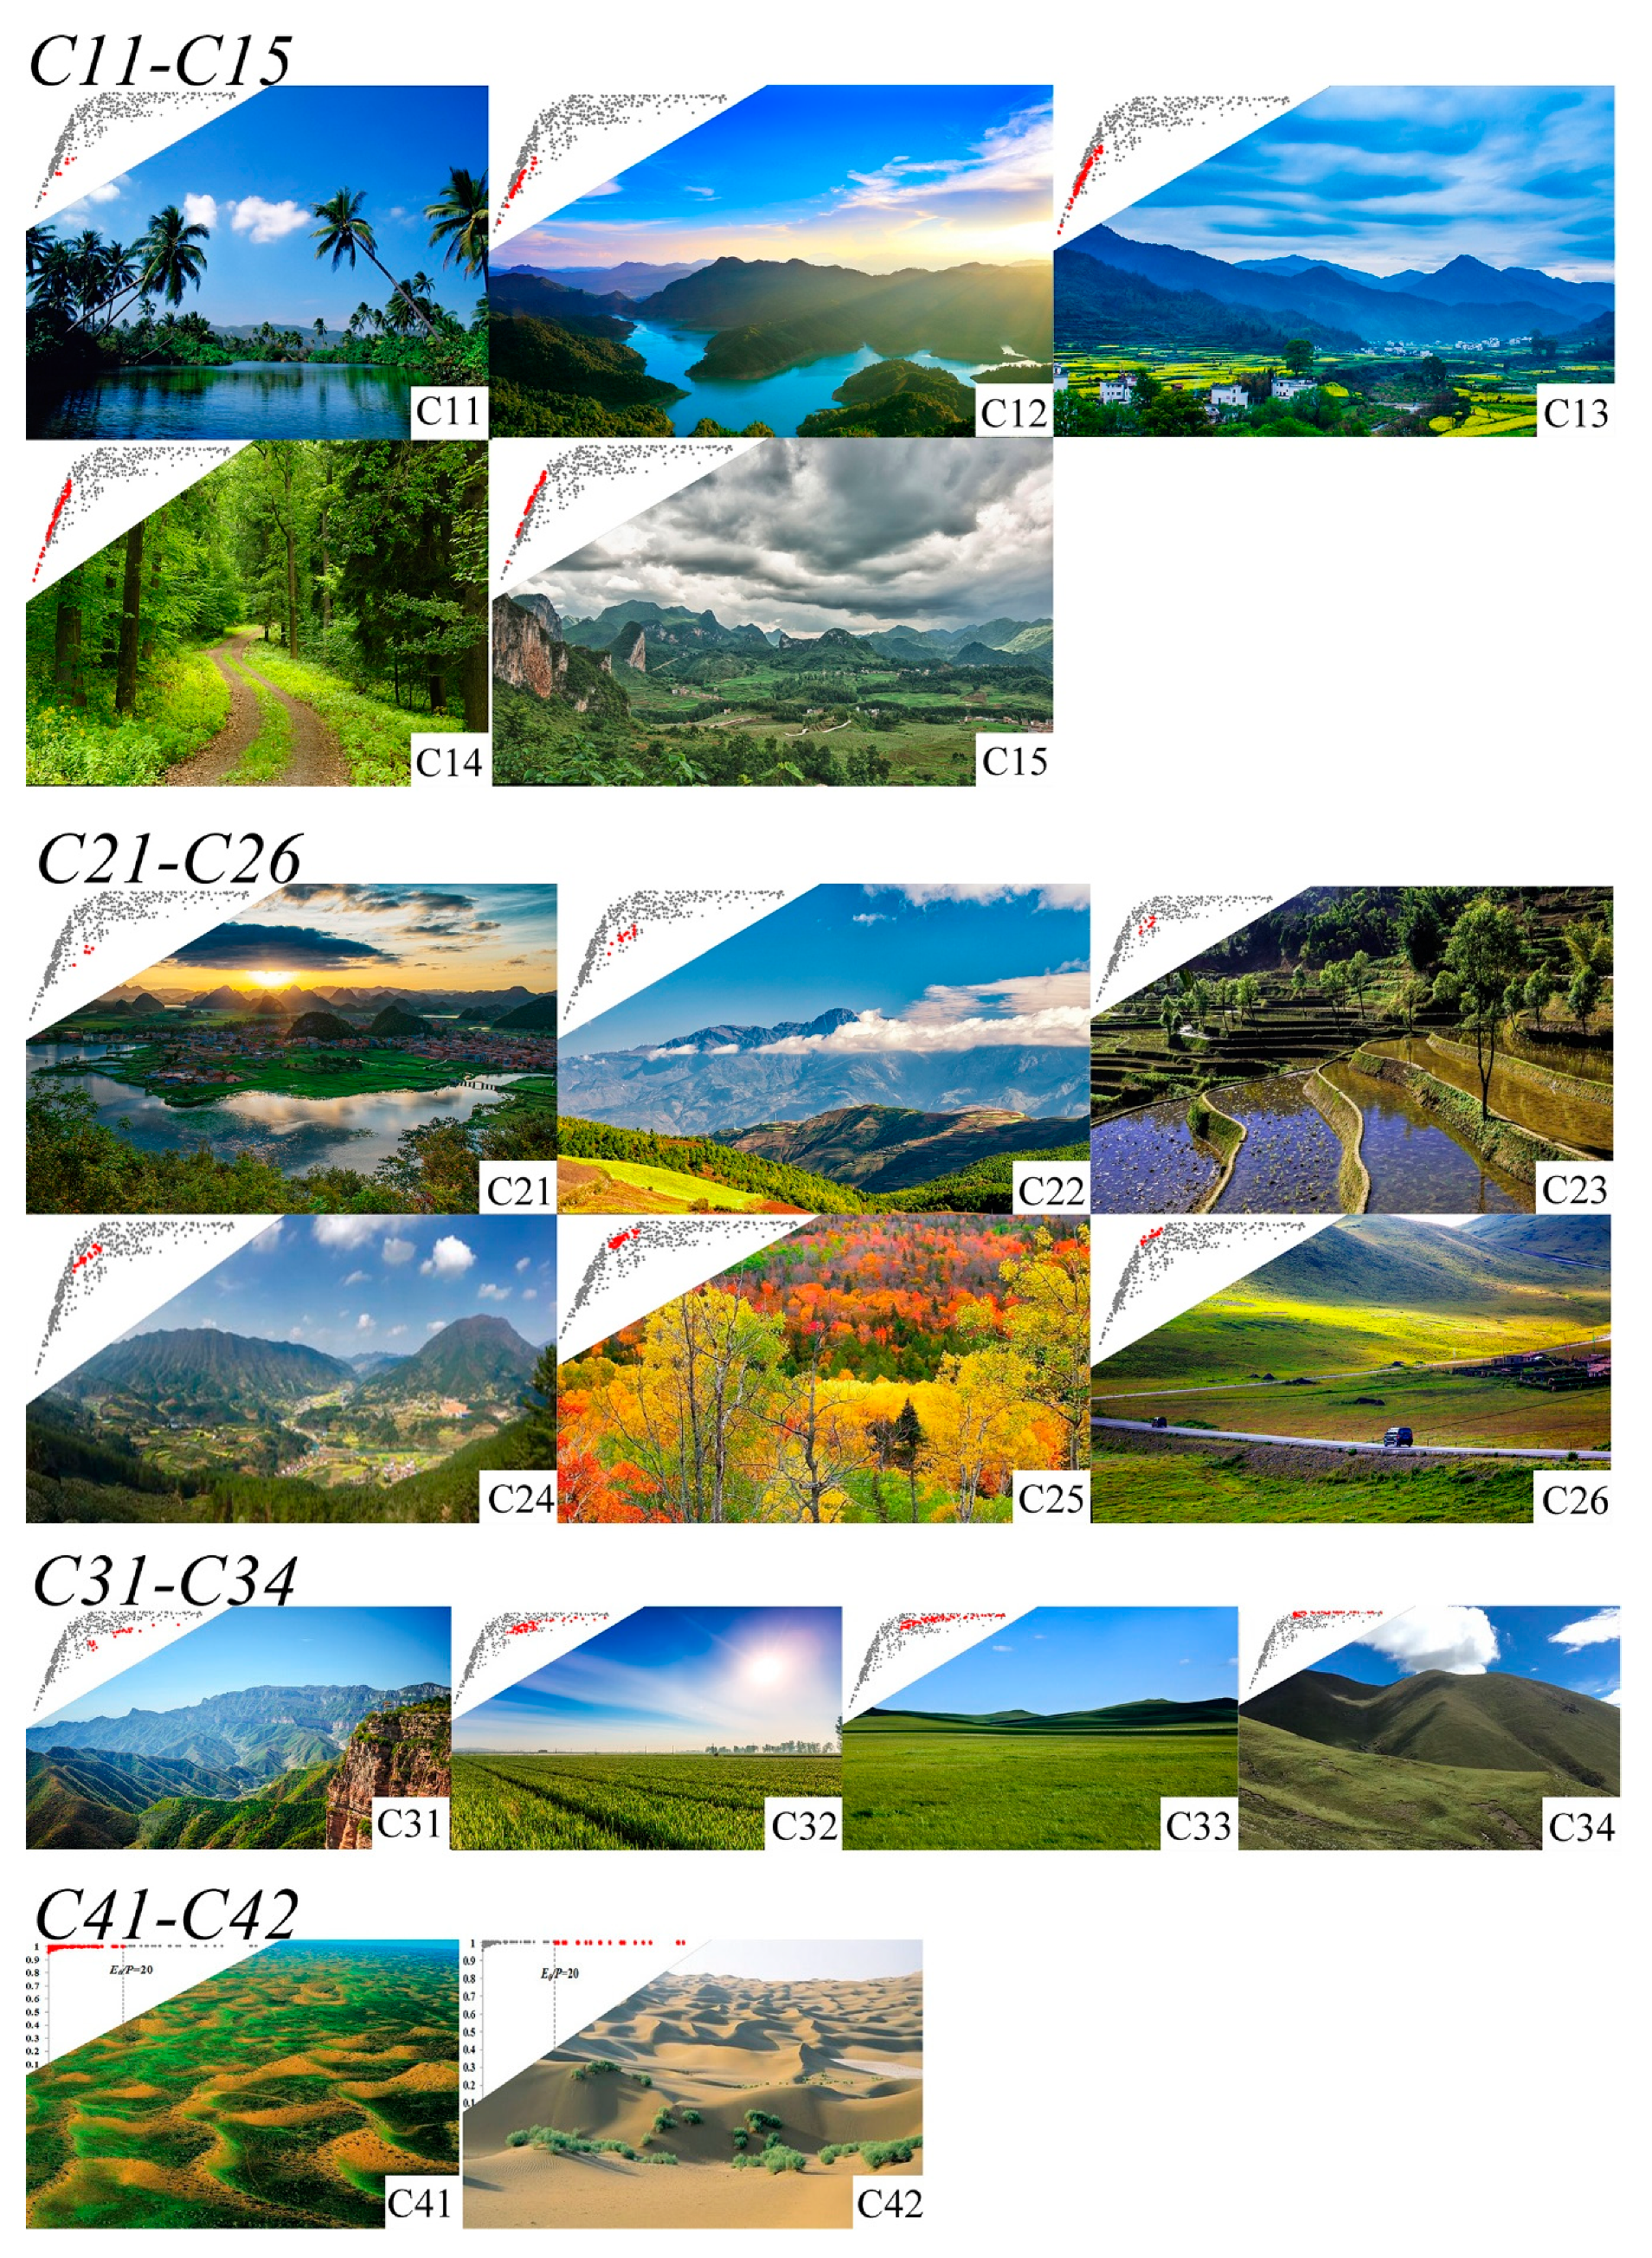
As shown in Figure 6, the 17 sub-regions cover vast areas from the west coast of the Pacific Ocean to central Asia and from the tropical South China Sea to the harsh Mongolian Plateau. As shown in Figure 7, different hydrothermal conditions shape and affect the landscape characteristics of sub-regions, and the relative positions of sub-regions on a point cloud are also provided. In the humid, semi-humid, and semi-arid zones, we find that the higher the vertical locations of stations on the Budyko curve, the drier and colder the climate and corresponding natural landscapes. For example, the semi-arid zone is divided into four sub-regions (C31, C32, C33, and C34) from the bottom to the top of the Budyko curve, and the related stations are typical of the North China Plain, the Inner Mongolia Grassland and the alpine region with the average precipitation and temperature decreasing from 570 mm to 449 mm and from 11.2 °C to 1.9 °C, respectively, as shown in Table 1.
There are various climate classifications across Mainland China. First, dry-wet climate zones based on DI index were compared with other similar studies. It was found that the four basic climatic zones, i.e., humid, semi-humid, semi-arid and arid are comparable with the results of Yuan et al. [60] that employs data from 1961 to 2015. However, there are some biases especially in sub-dividing semi-humid and semi-arid zones while comparing with the regionalization results of Zheng et al. [61] which used climate data over 1981–2010. It is believed that China has experienced obviously climate wetting as the climate warming due to the significantly decreasing E0 over the period of 1961 to 2014 [61]. This can partly explain why the transitional zones between dry and wet climates have alternated over the past 50 years. The results were also compared with the China climate classification based on Köppen method [62], and a similar transition of climate zones was found. However, accurate assessments of our framework with other methods, e.g., the Köppen climate classification [62] and the so-called standard method for China climate regionalization [61], are difficult. The reasons are that they are always different in methods and criterions. For instance, all the climate classification will focus on mean annual characteristics of climatic factors. In those methods, the temporal variations of some factors especially precipitation cannot be considered adequately, let alone actual evapotranspiration and runoff, which determine to a great extent regional dry-wet conditions [56]. However, our framework can provide hydrologically based classification by considering annual distribution of hydrothermal factors and actual evapotranspiration.
3.2. Effects of Hydrothermal Relationships on Sub-Region Classification
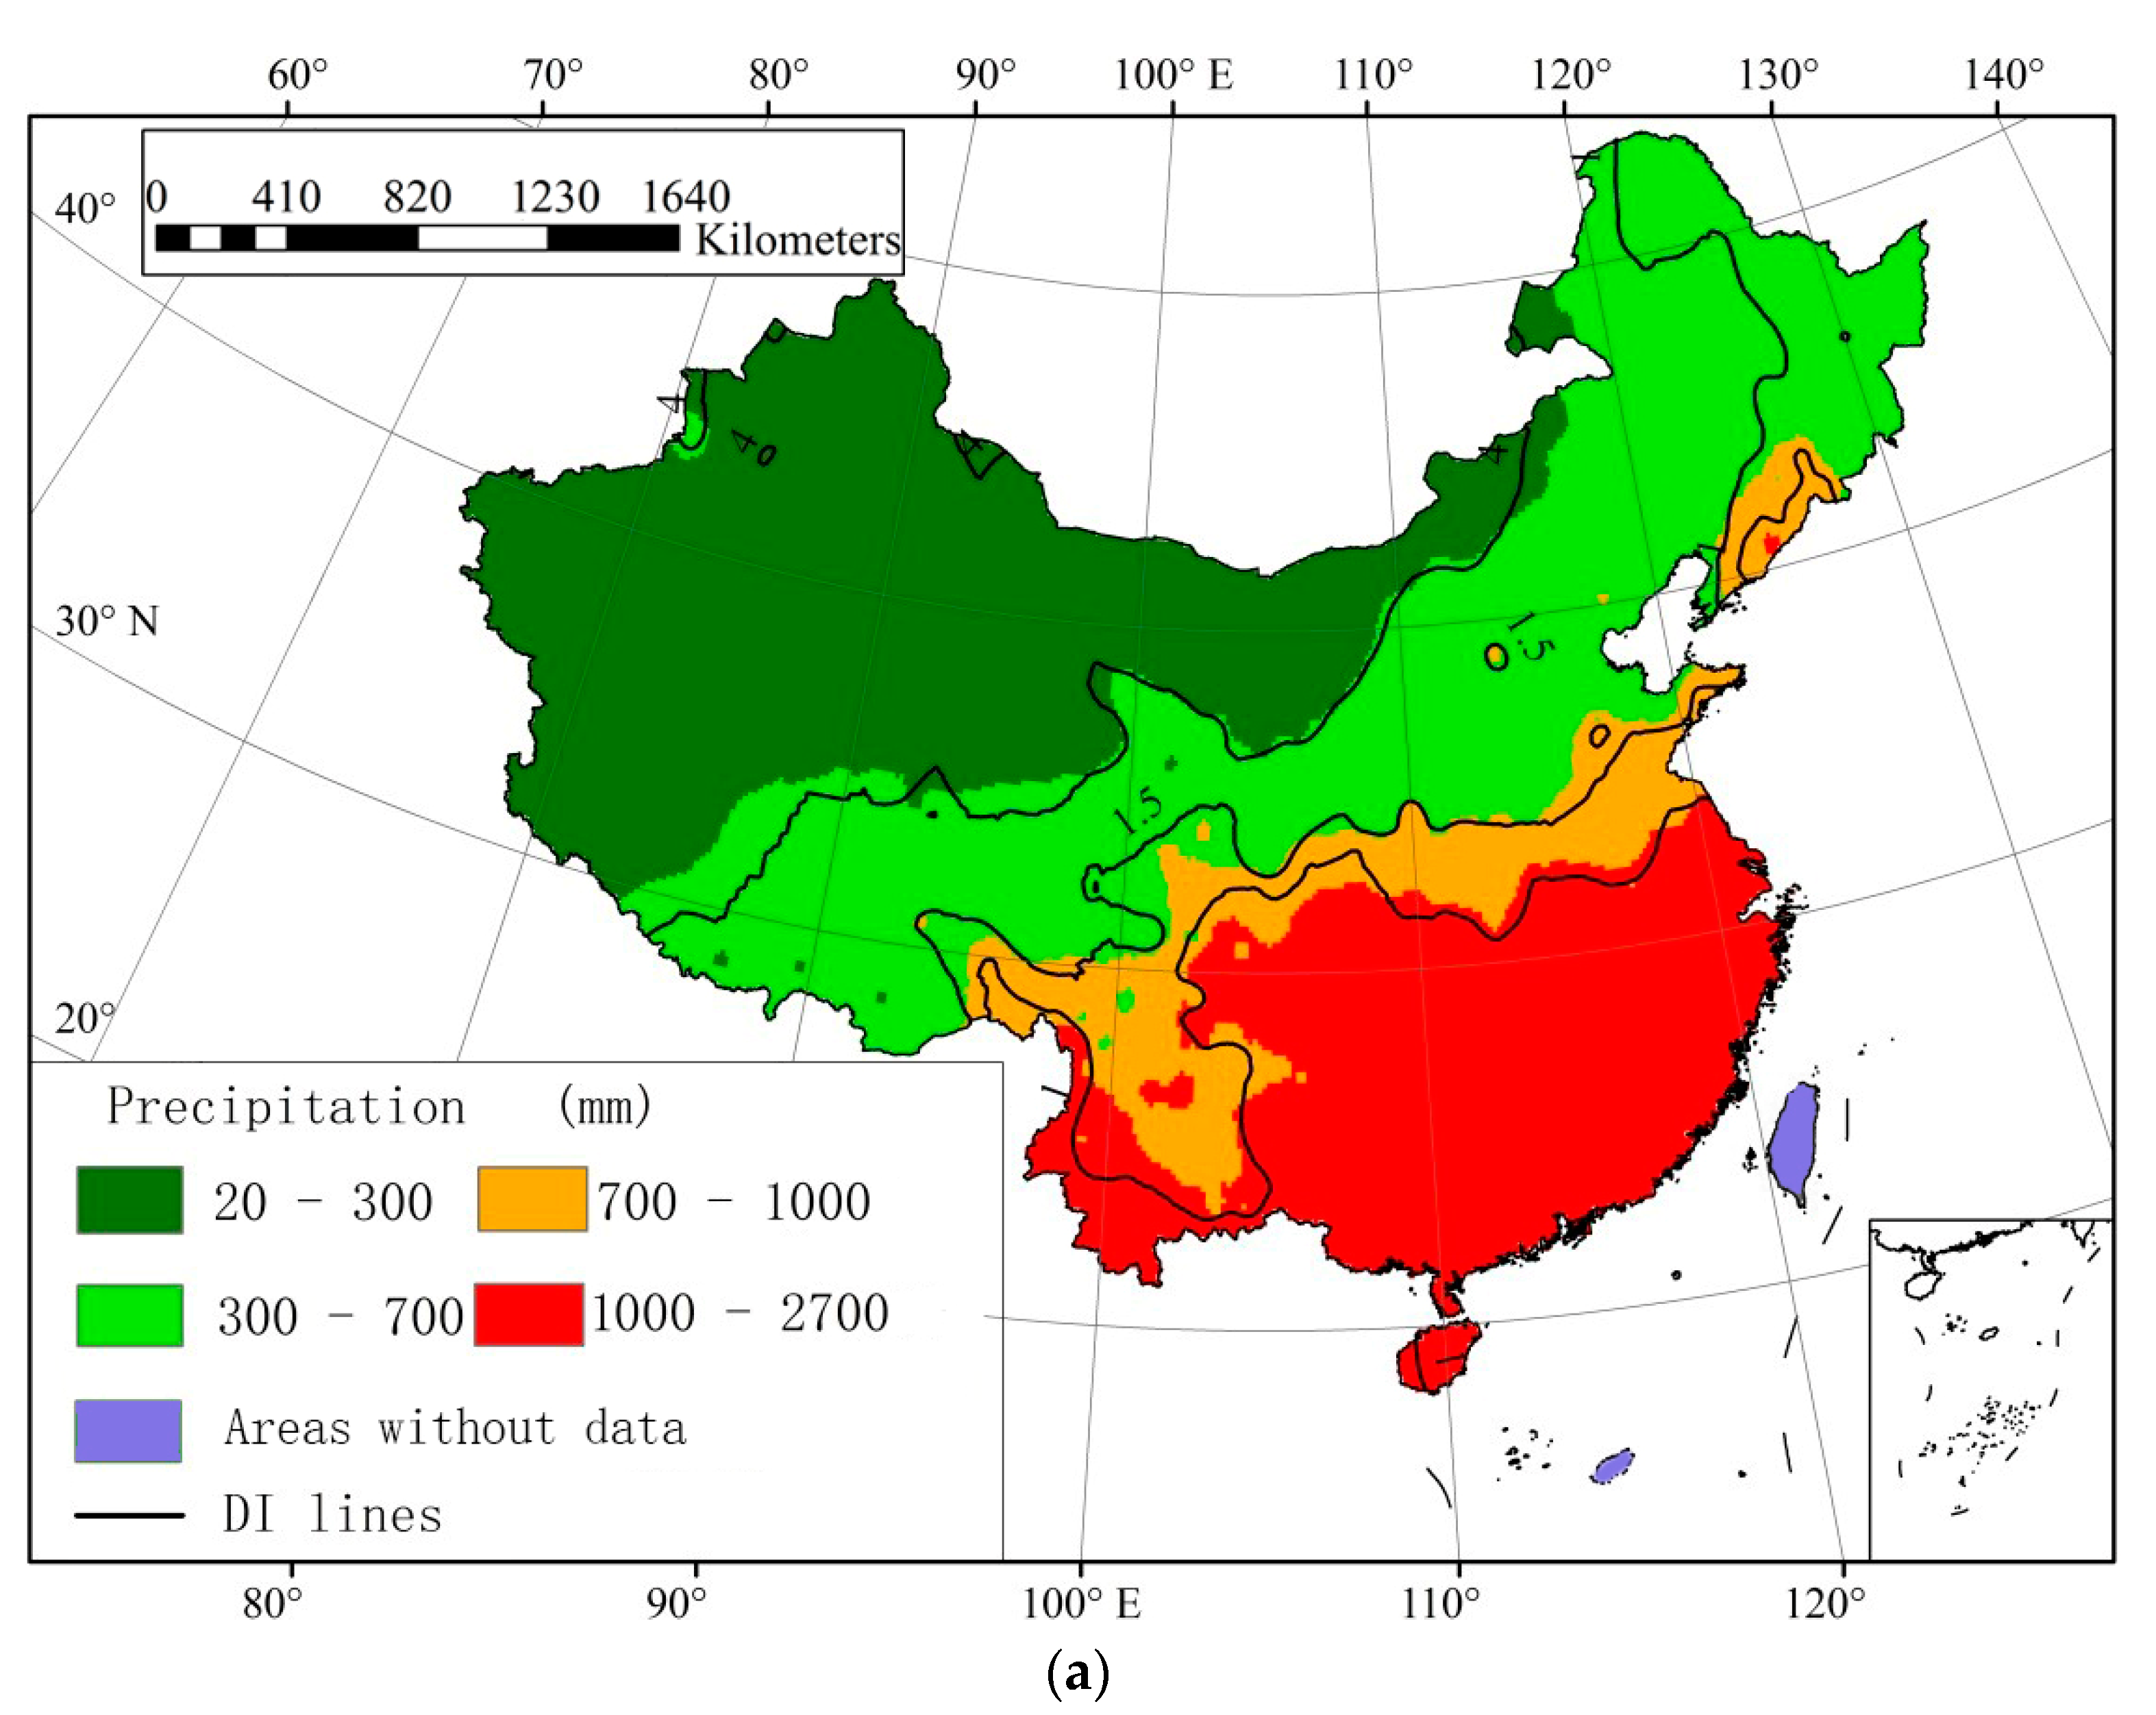
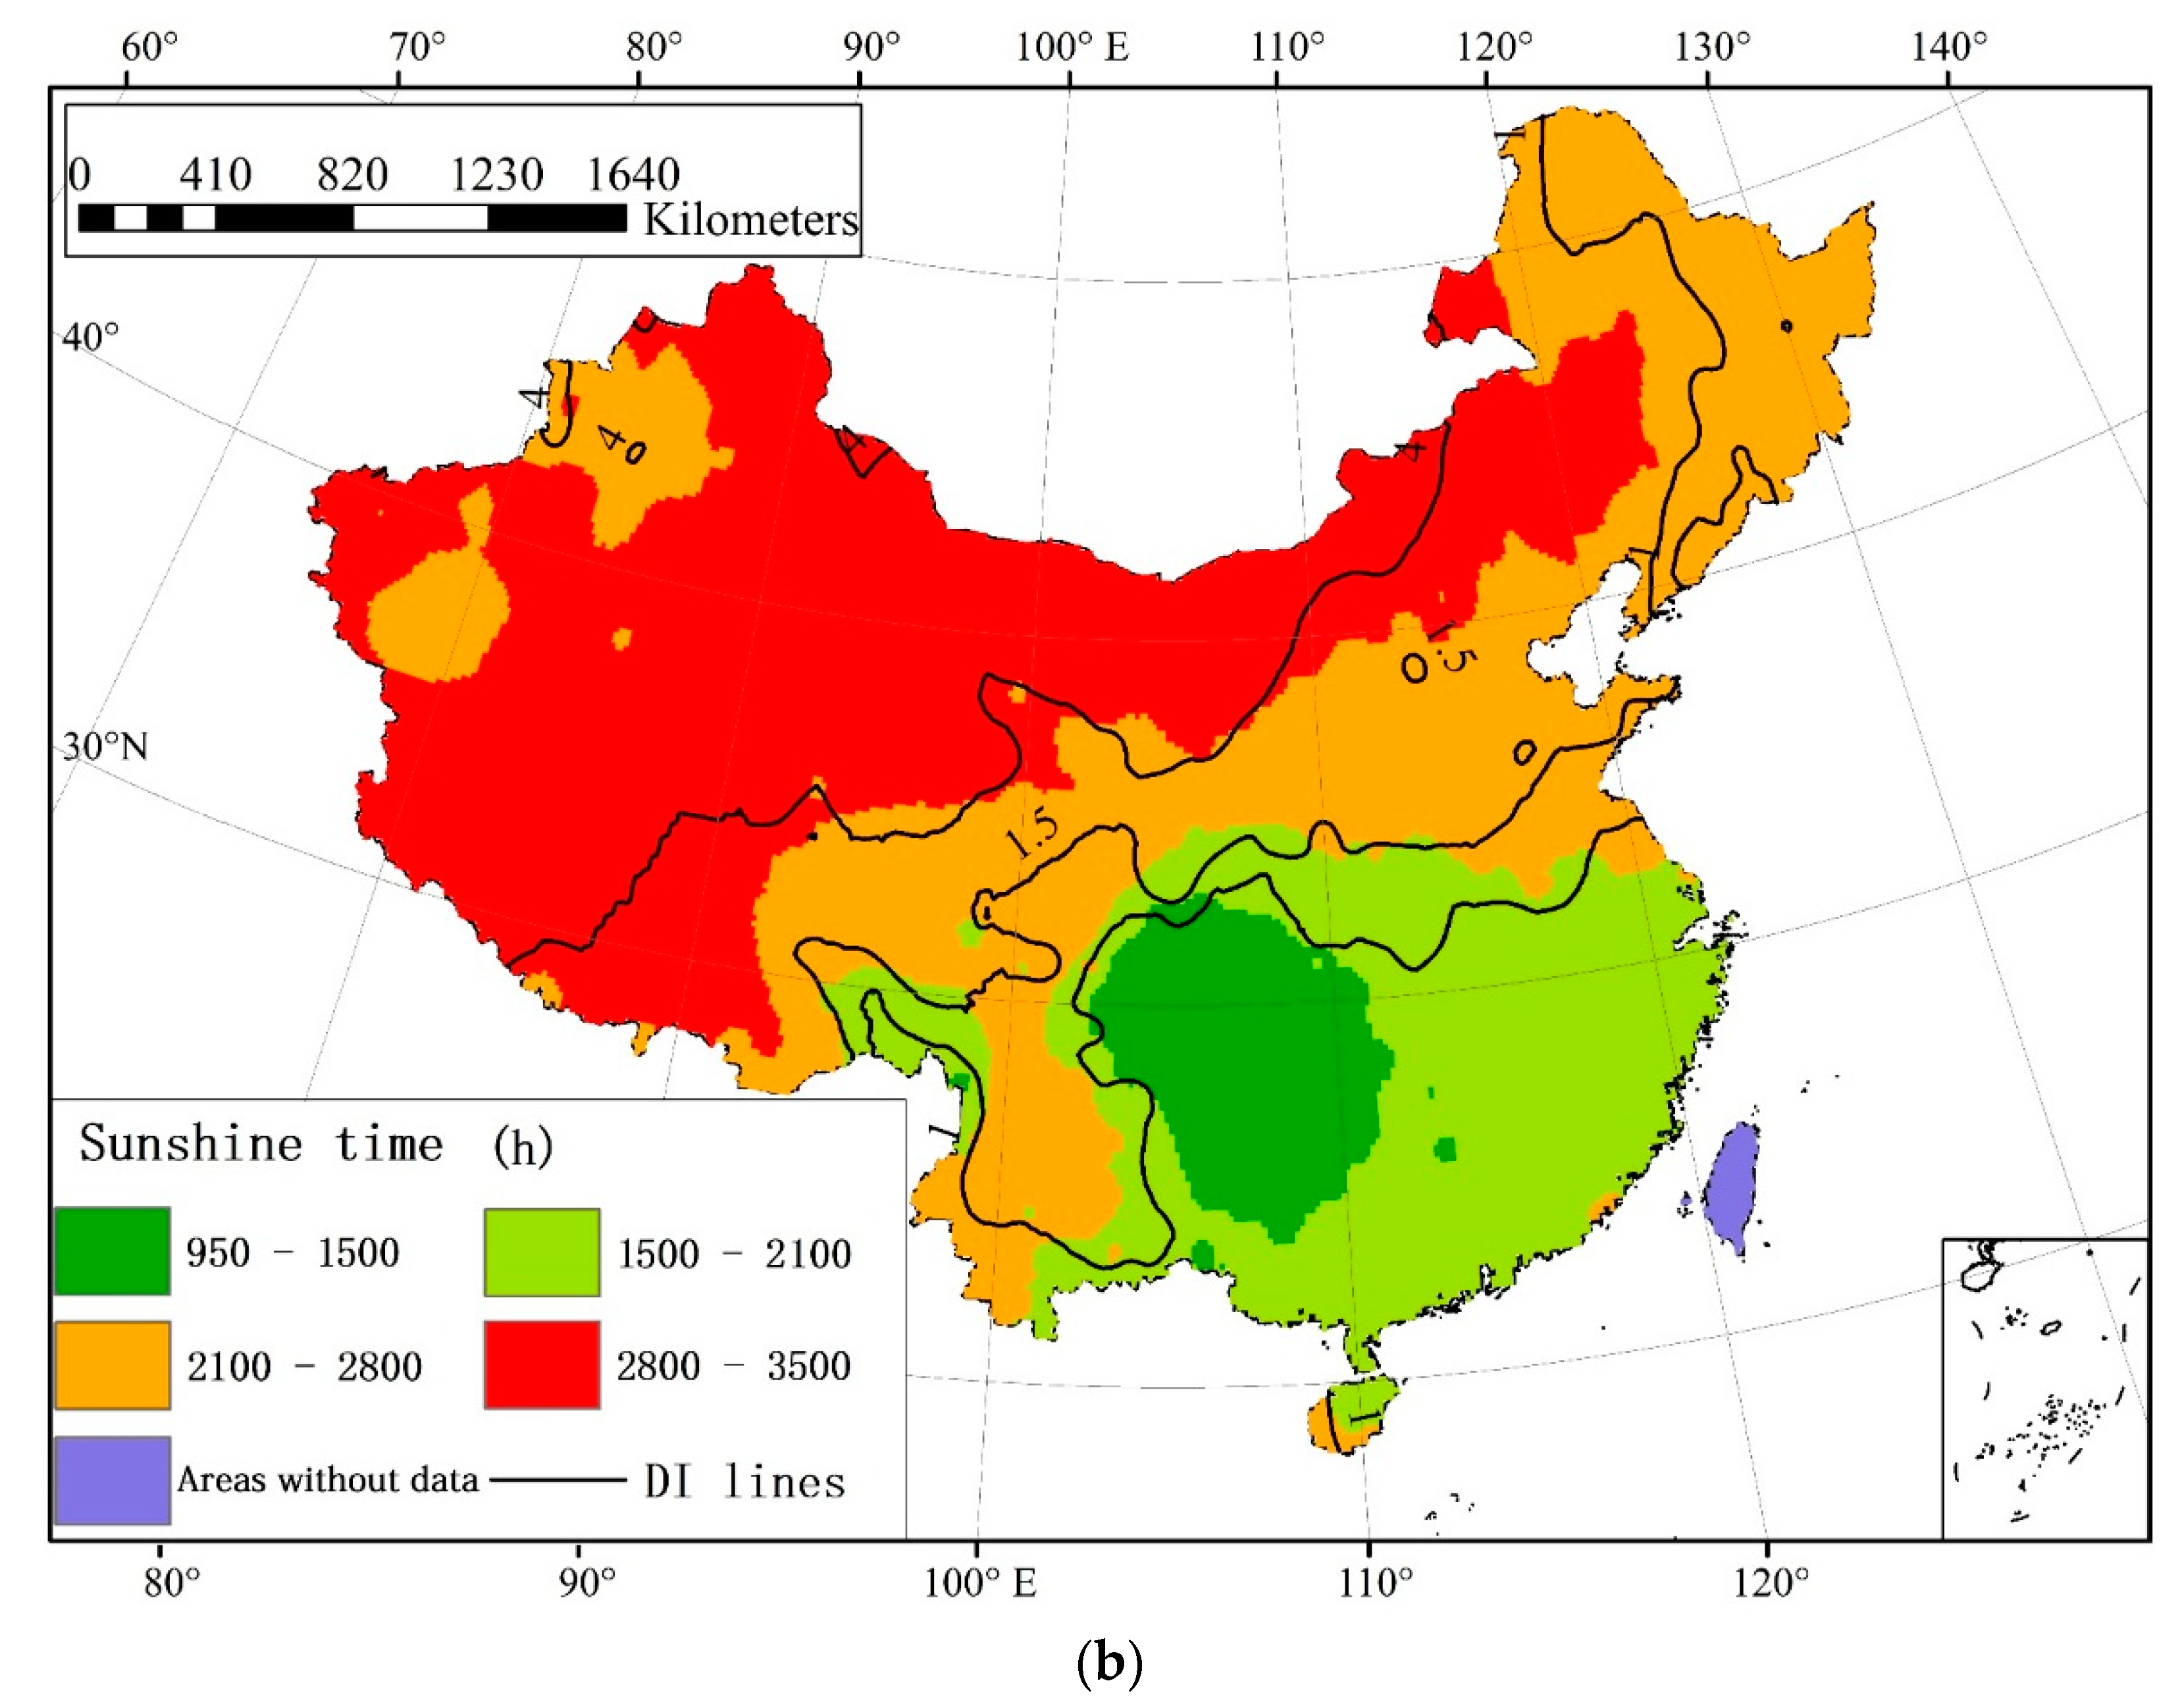
As stated in the section above, Mainland China was divided into 17 sub-regions according to hydrothermal conditions under the Budyko framework. The results shown in Figure 8 illustrate that the hydrothermal factors, e.g., precipitation and sunny periods, that characterize Mainland China are strongly related with climatic zones. As shown in Figure 8, DI = 1 and DI = 4 contour lines can roughly coincide with the 1000-mm and 300-mm isohyetal lines, and precipitation heavily shapes the sub-region classifications. However, some obvious deviations are observed; e.g., in Northeastern China, DI = 1.5 and the 700-mm isohyetal line do not overlap, as is found for the southeastern part of Mainland China. In Northeastern China, precipitation levels in most parts of Heilongjiang Province range from 300–700 mm, while due to relatively low levels of radiation, the value of DI (<1.5) is small, which may explain why these areas receiving relatively little precipitation belong to the semi-humid zone. It is evident that the classification results are affected by both hydrological and thermal factors (e.g., precipitation, temperature, and sunny periods). The spatial and temporal distributions of hydrothermal factors are essential for categorizing a sub-region, and their distributions are basically analogous in many areas of Mainland China. A correlation diagram of the hydrothermal conditions for each sub-region is presented below (Figure 9).
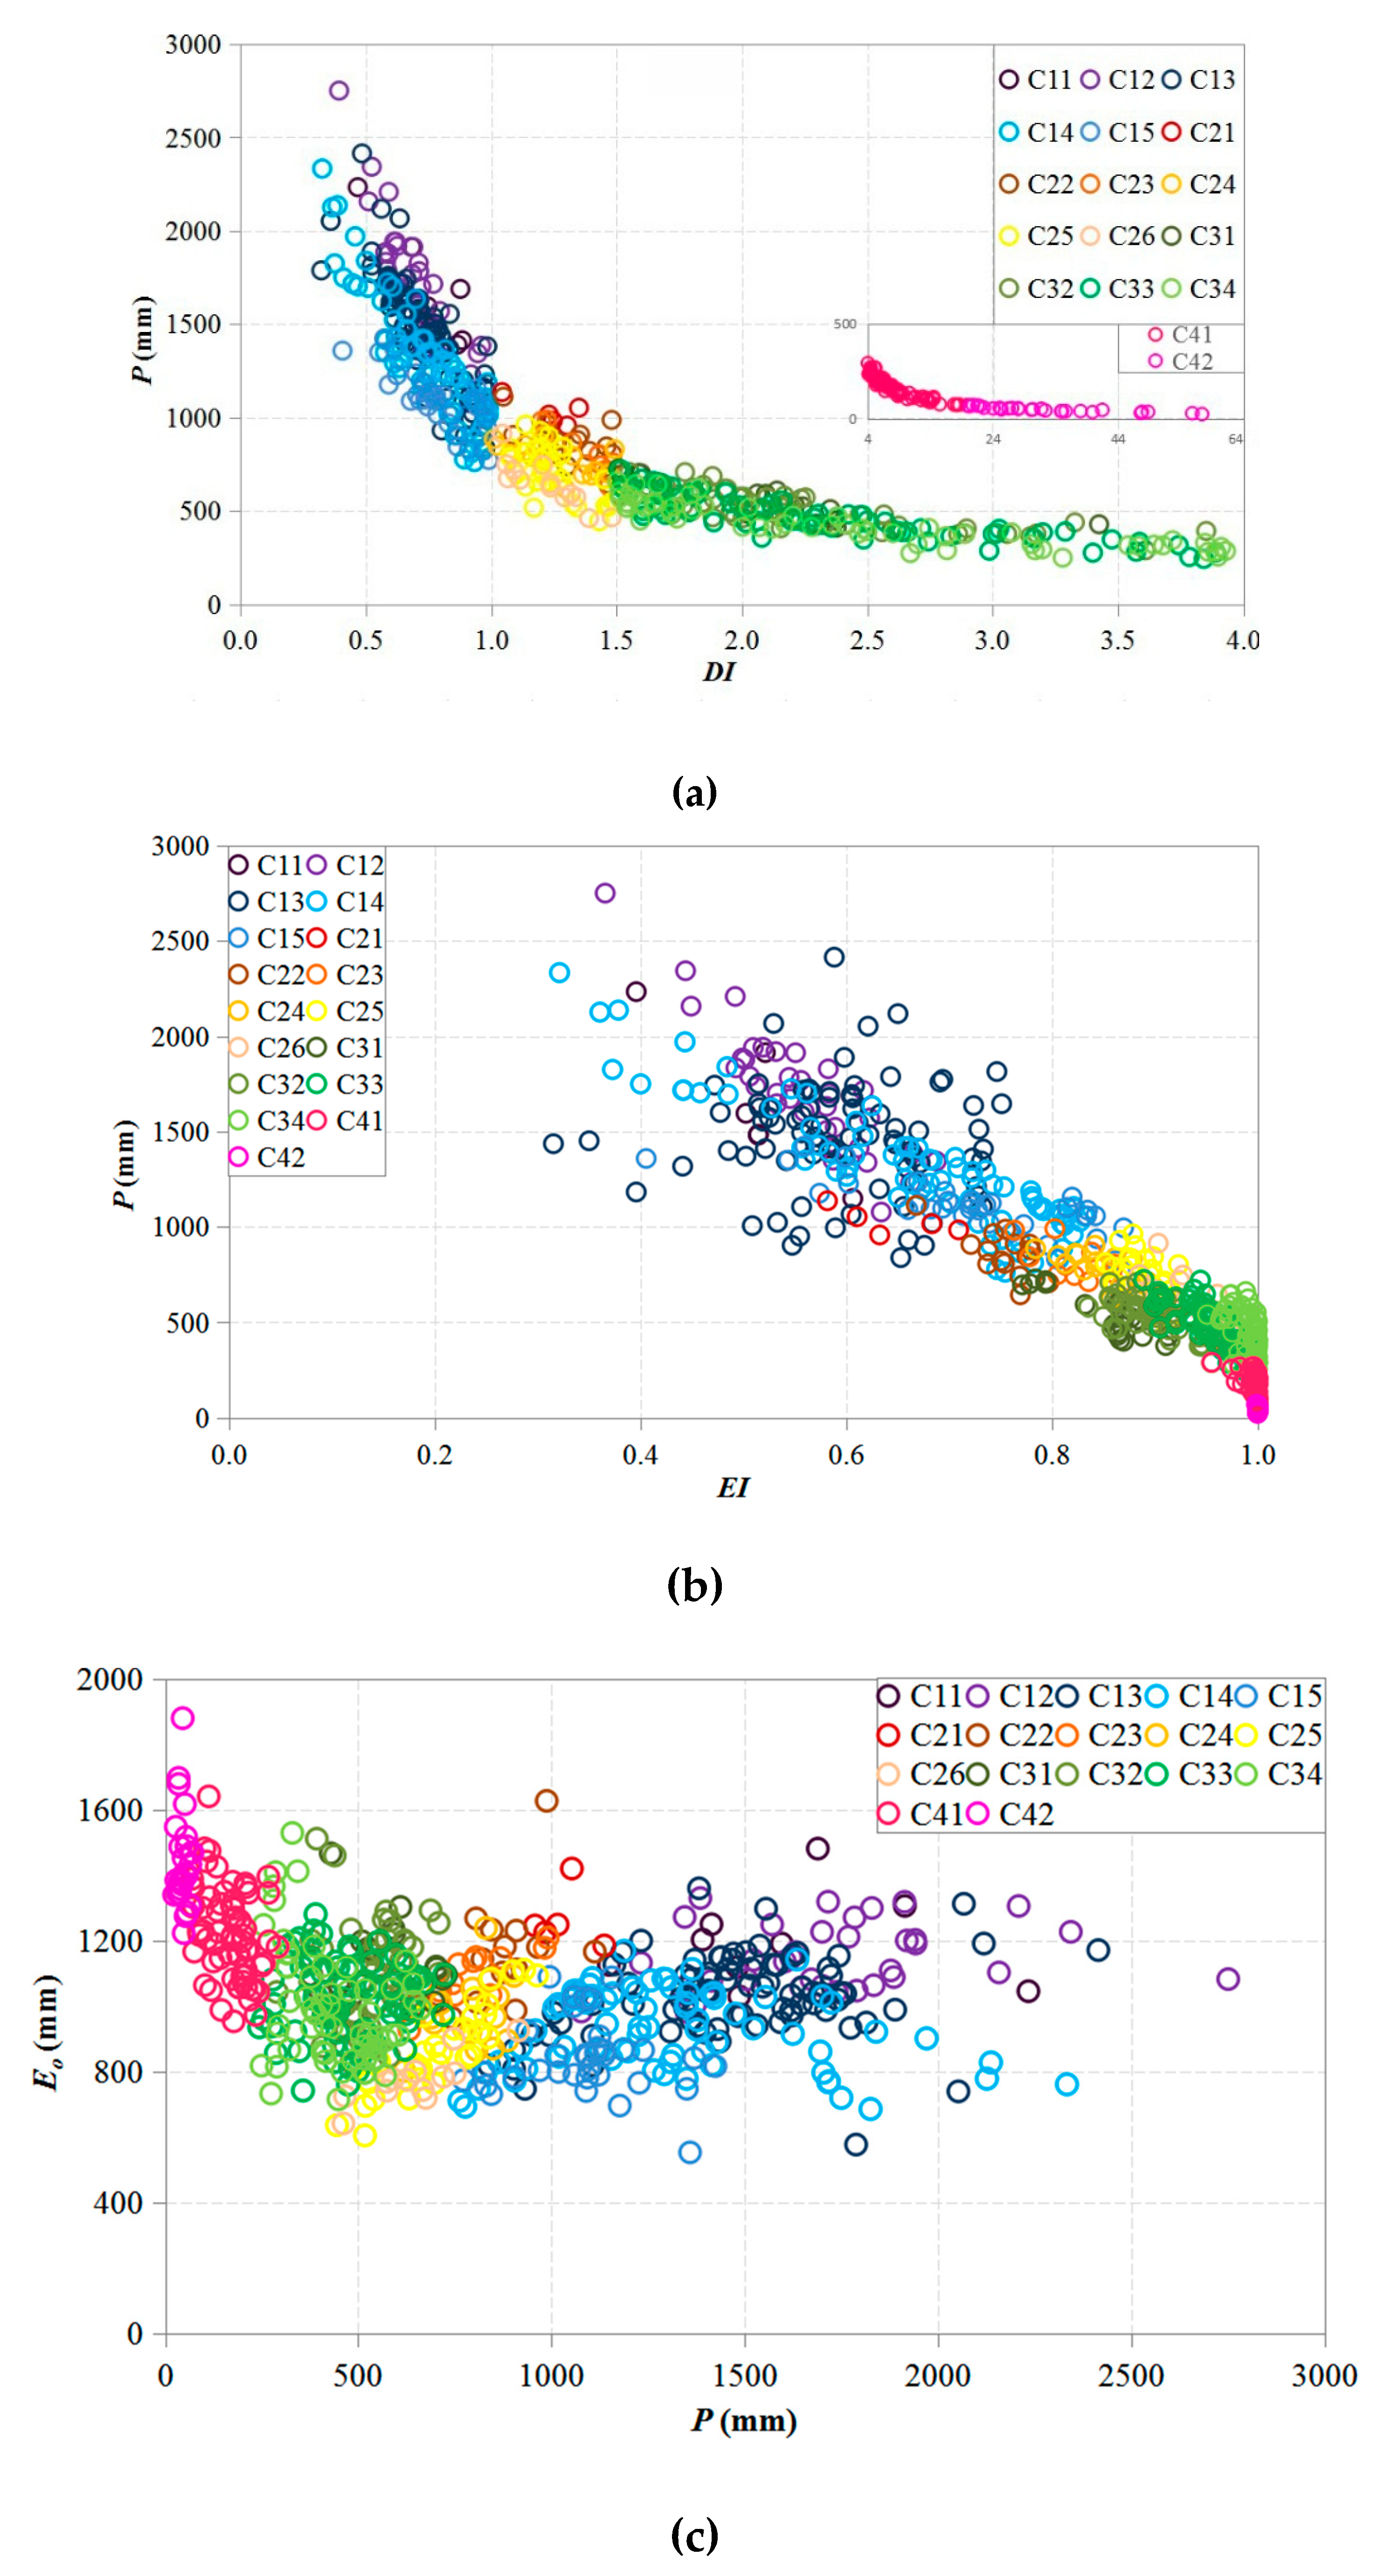
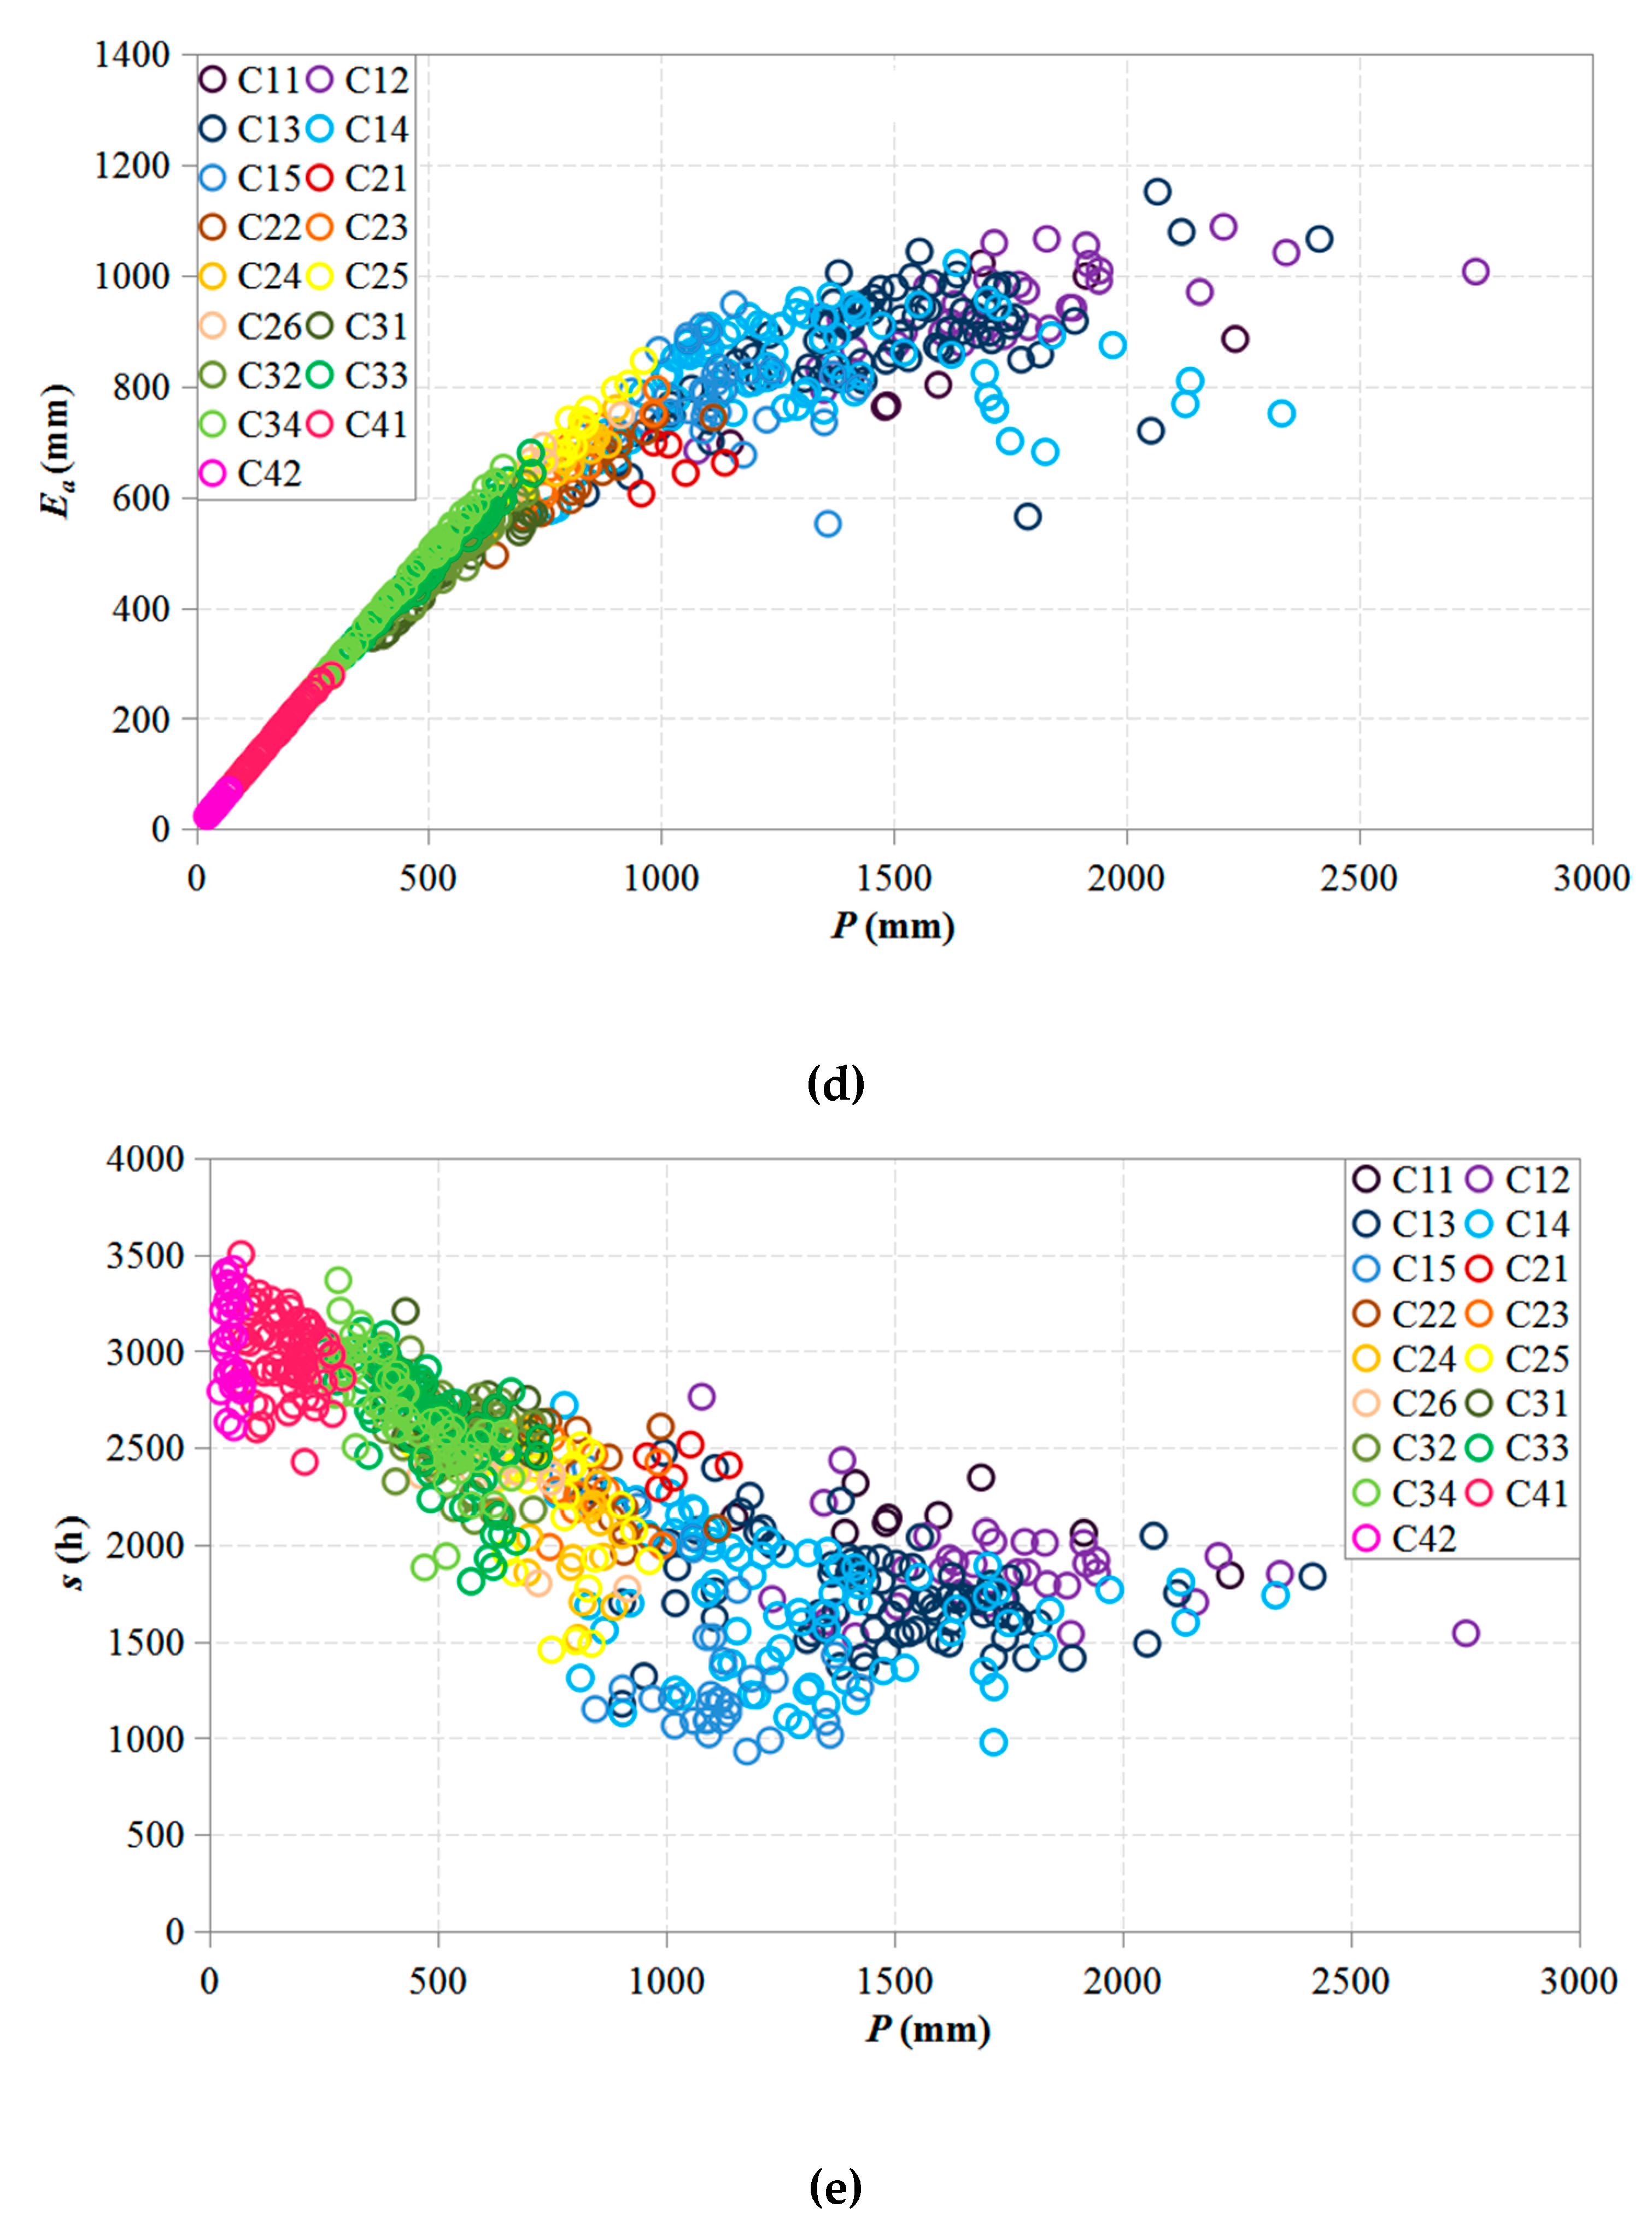
As precipitation is a controlling factor of the sub-region classification, the relationships between mean annual precipitation and other hydrothermal indices were explored (Figure 9). Average annual precipitation values for each sub-region decrease from 1717 mm in C12 to 47 mm in the arid C42, and total precipitation levels decrease accordingly with DI and EI (Figure 9a,b). Compared to Figure 9a, the diagram for P and EI shown in Figure 9b is more scattered. In addition, as the DI values for climatic zone classification are set according to Wu et al. [27], the point cloud of every climatic zone does not overlap (Figure 9a). A similar phenomenon can be observed in Figure 9c. It was found that E0 tends to remain constant (1030 mm on average) as precipitation levels increase in the semi-arid, semi-humid, and humid zones. However, the P and EI point clouds for the sub-regions of different climatic zones seem to present several intersections (Figure 9b). For instance, the mean EI values are 0.67 and 0.73 for C14 and C15, respectively, and 0.64 for C21, creating overlap between these sub-regions because Ea is not only impacted by precipitation (Figure 9d) but also by sunny periods (Figure 9e) and other heat factors. For all stations in Mainland China, mean annual precipitation and sunny periods are inversely related. In fact, the inverse relationship between mean annual precipitation and heat conditions causes these variables to perform distinct functions in the hydrologic cycle. In heat-rich arid and semi-arid zones, actual evapotranspiration is mainly controlled by precipitation. As is shown in Figure 9d, Ea is nearly equal to P in arid zones and some semi-arid zones. These regions are characterized by low levels of precipitation and by relatively high heat conditions (e.g., sunny periods as shown in Figure 9e). However, for the semi-humid and humid zones, the point cloud is scattered, showing that once precipitation levels reach a certain value, actual evapotranspiration is dominated by heat conditions. In humid sub-regions, Ea is typically less than P; for example, the average value of Ea for the humid zone is approximately 850 mm, while the average value of P exceeds 1400 mm.
As shown by the station cloud of the Budyko curve (Figure 4) as well as the correlation diagrams of the hydrothermal conditions (Figure 9), although the scatter diagram of the values of DI, EI, and other hydrothermal indices can be fitted by a parabolic curve, the parameters are not related by a single valued relation. It is consistent with the findings presented in most of the catchment studies, e.g., in the non-humid regions of China [32]. As suggested by Zhang et al. [31] and Yang et al. [32], local long-term water balance is impacted not only by climate but also catchment factors. Thus, inter-differences of long-term water balance across a very large scale should be represented by a group of Budyko curves. Regions located between top curves (e.g., C15, C26) on the Budyko scatterplot in Figure 4 are characterized by evaporation favorited and the evaporation rates are determined by precipitation and potential evapotranspiration. Regions on bottom areas of the Budyko curves (e.g., C11, C21) are generally not favourable for evaporation. For example, the evapotranspiration efficiencies (Ea/E0) for C15 and C26 are 0.92 and 0.76, which are higher than 0.70 and 0.52 for C11 and C21. The values of Ea/E0 decrease accordingly from the humid zone to the semi-humid zone, which indicates that the E0-forced evaporation in C1 zones is transiting to the P-forced evaporation in C2 zones. These findings are consistent with the results of Zhang et al. [31]. Moreover, through comparisons of monthly hydrothermal factors in typical stations for each sub-region, it was found that stations with closely annual values (e.g., C22 and C23 as listed in Table 1) can behave quite differently in hydrological characters due to the different annual distribution of precipitation and sunshine (Figure 10c,d).
3.3. Hydro-Climatic Characteristics of the Sub-Regions
In this section, the hydro-climatic characteristics of each sub-region in the humid, semi-humid, semi-arid, and arid zones are discussed. Within each zone, several climatic factors (e.g., precipitation, sunshine time, temperature, etc.) measured as the mean values for stations in each sub-region are determined (Table 1), and eight typical stations that represents the average hydro-climatic conditions of the given sub-region is used to further explore the relationships among precipitation, sunny periods, and temperature (see in Figure 10).
3.3.1. Humid Zone
Average precipitation for C11–C15 of the humid zone range from 1090 to 1717 mm, and the potential evapotranspiration, actual evapotranspiration, air temperature, and sunny period values range from 845–1195 mm, 779–934 mm, 14.8–20.0 °C, and 1402–2131 h, respectively. In the humid zone, temperature, annual sunny periods and potential evapotranspiration decrease from C11 to C15. Figure 9e shows that C15, located in the Sichuan Basin and the Guizhou Plateau (dark green area in Figure 8b), where “no three days are clear” (a Chinese adage), receives the least amount of sunlight among the sub-regions and that average annual sunny periods measured at some C15 stations are even less than 1000 h.
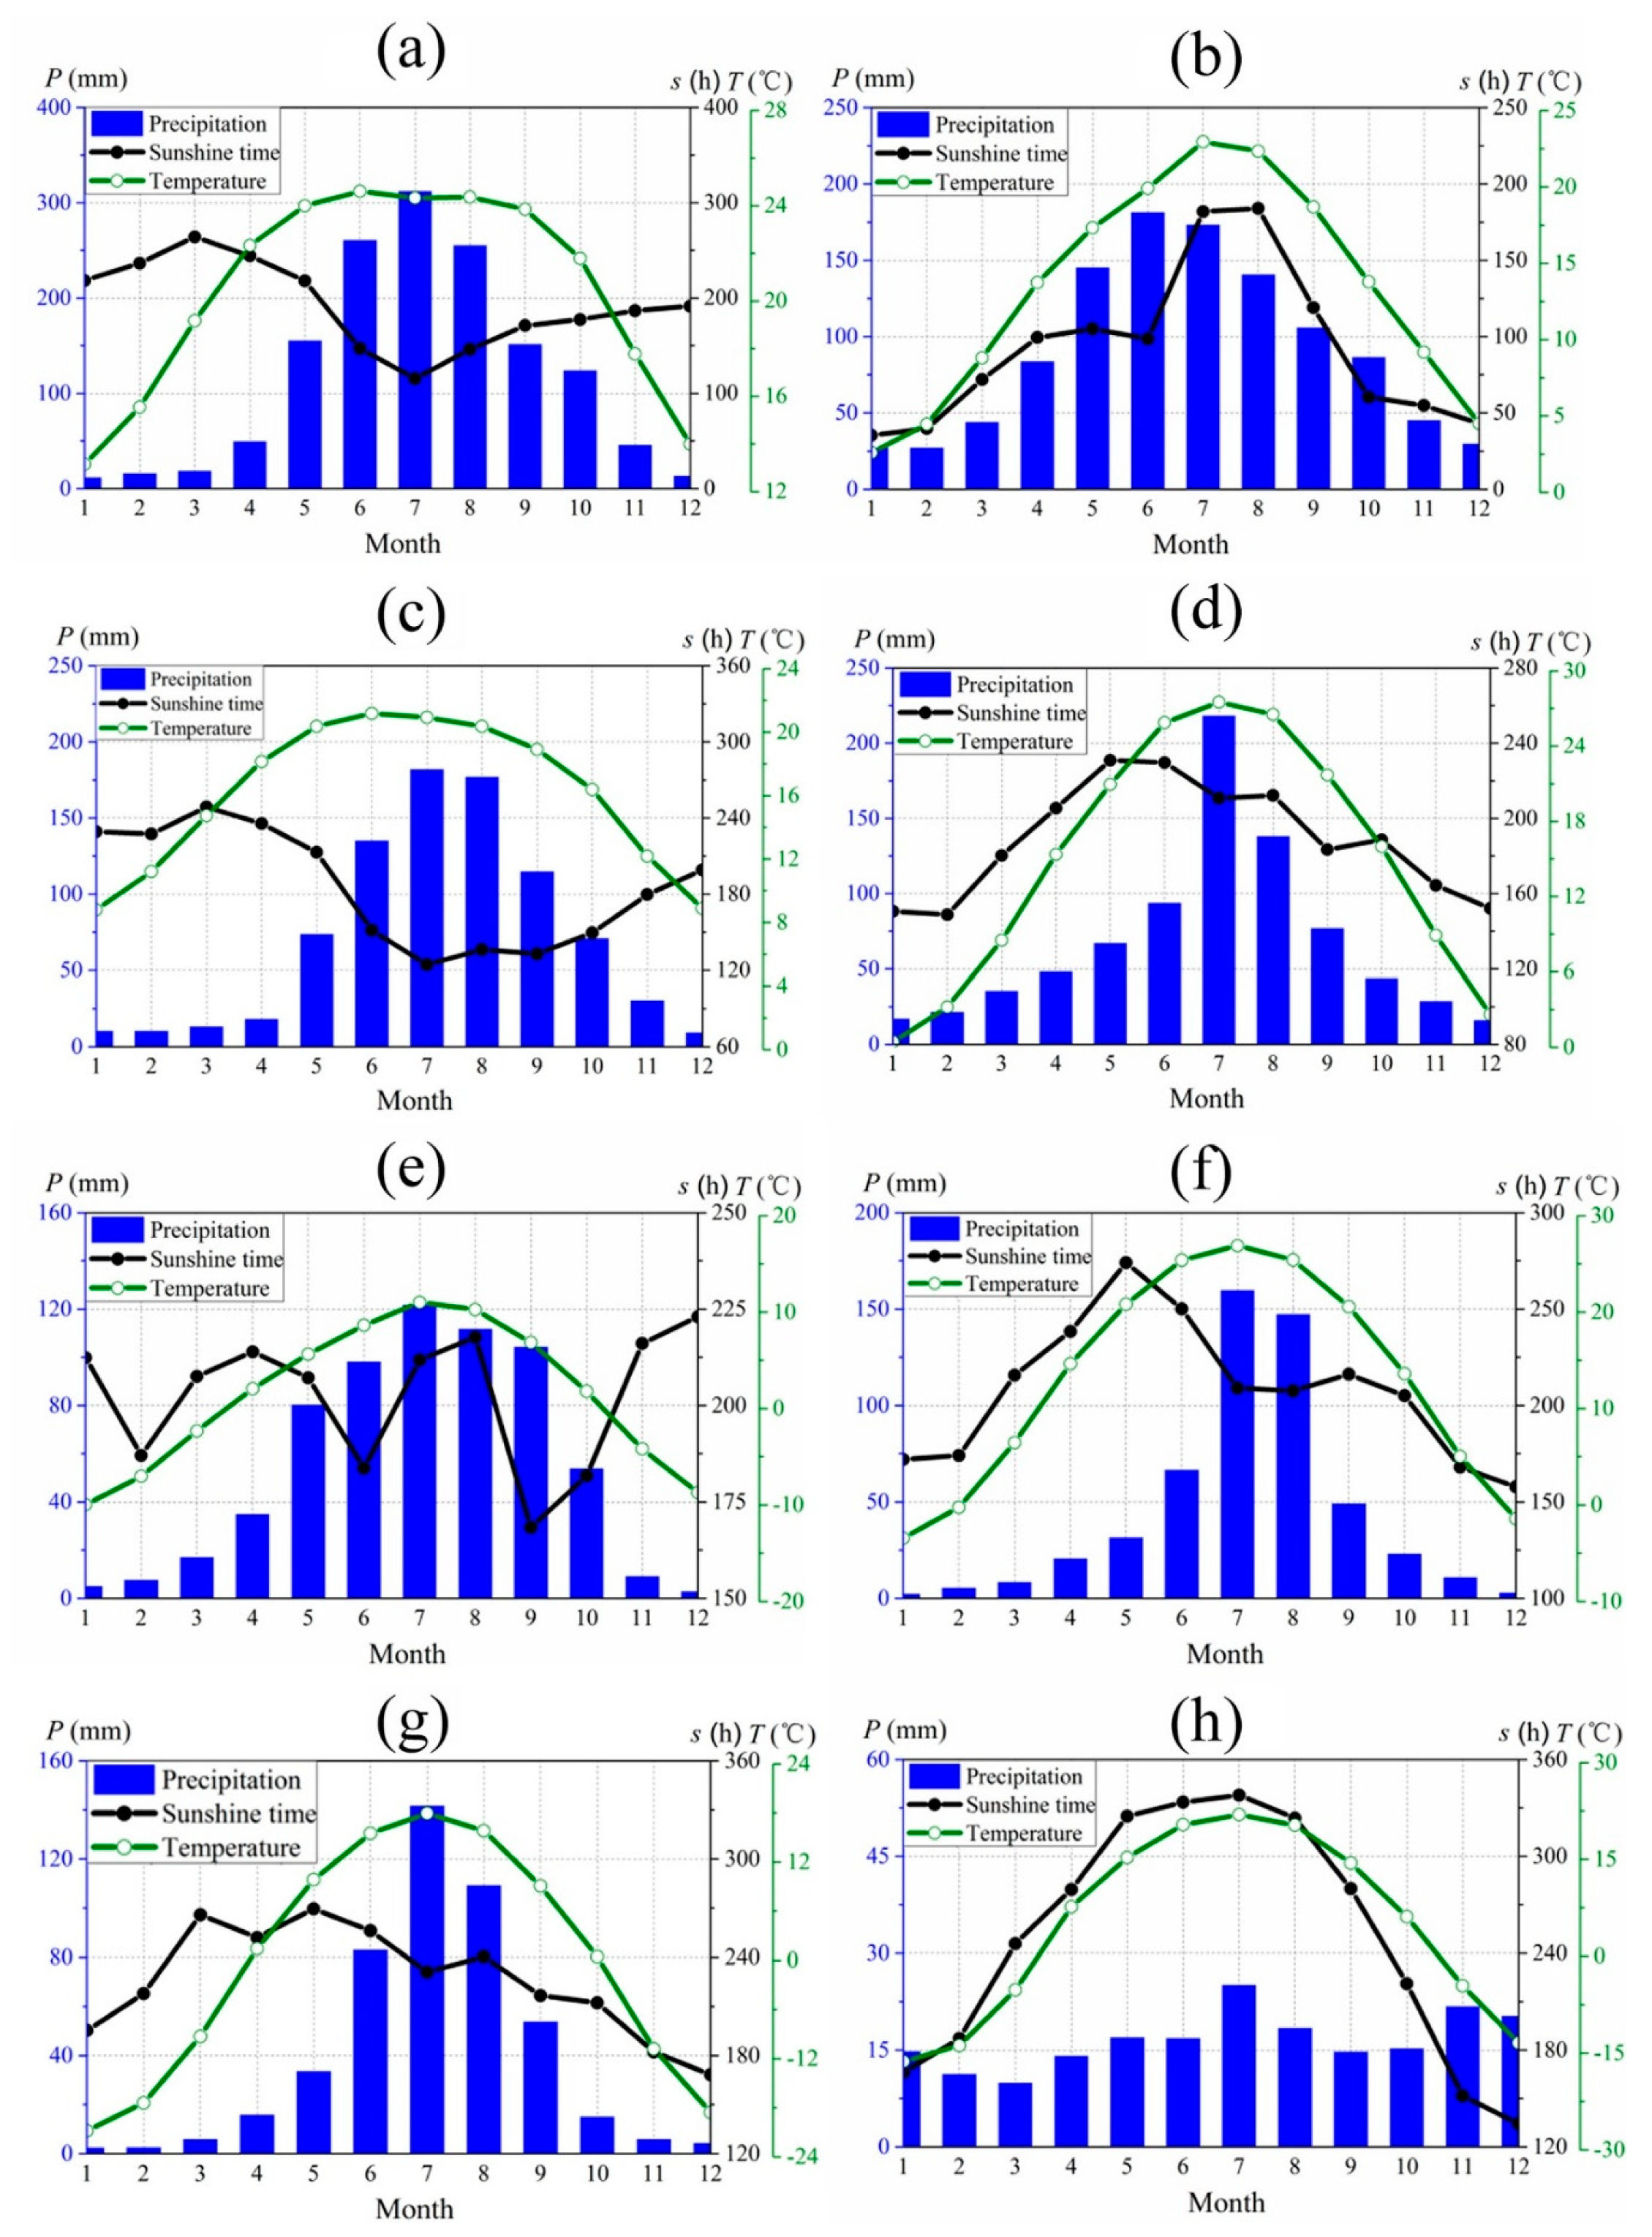
In addition to the C11 sub-region, a decreasing trend in precipitation and actual evaporation from region C12 to region C15 (Table 1) was observed. C11 receives less precipitation than C12. As both temperature and sunny periods in C11 are greater than those of C12, and its potential evapotranspiration value is greater than that of C12, too. However, average annual actual evaporation for C11 is 93 mm less than that of C12. The reason is that rainfall and heat values for C12 to C15 are synchronous. However, C11 includes different periods of rain and heat (Figure 10a). In the summer, when precipitation are higher, sunny periods are the shortest of the year for C11. Therefore, although monthly precipitation reaches 300 mm in the summer, actual evaporation is controlled by latent heat and is low. Although latent heat levels are high in other seasons, actual evaporation is controlled by precipitation, creating relatively low levels of evaporation in this sub-region.
Sub-region C11 covers 0.42% of the Chinese territory and is mainly located in the western part of Yunnan Province. It is characterized by high altitudes (over 800 m), abundant sunshine (2131 h), high potential evapotranspiration levels and intense precipitation (1595 mm). Precipitation falling from May to September accounts for 78% of the annual total (e.g., Ruili station (97.9°E, 24.0°N), Figure 10a). As rain and heat are not synchronous, the average annual actual evapotranspiration is only 841 mm and is lower than that of other sub-regions in the humid zone.
Sub-region C12 occupies 2.53% of the Chinese territory and is largely located in coastal areas of Guangdong Province and Hainan Province, and in southcentral Jiangxi Province. The vegetation is dominated by tropical monsoon rainforest and subtropical evergreen broad-leaved forest. Due to the tropical cyclones, the highest wind speed (2.6 m/s) and precipitation (1717 mm) are the highest in the humid zone. Precipitation mainly falls from May to August, and average monthly precipitation levels for these 4 months are close to 400 mm. However, the duration of sunny periods is not as long as that in the C11.
Sub-region C13 accounts for 6.75% of the Chinese territory. Stations in C13 are broadly distributed in Fujian, Guangdong, and Guangxi Provinces. C13 and C12 are positioned in southcentral zones of Mainland China. The annual sunny periods and annual precipitation decrease from those of C12. Monthly sunny periods vary from 72 h to 253 h, and monthly mean rainfall reaches approximately 120 mm.
Sub-region C14 occupies 6.00% of the Chinese territory. Stations in C14 are positioned in the south, north and northeast of the humid zone; they cross the Sichuan Basin, the periphery of the Guizhou Plateau and Hunan Province and extend even to Anhui, Zhejiang and Jiangsu Provinces. Maximum monthly precipitation reach 204 mm. Rain and heat processes are recorded in the same period.
Sub-region C15 covers 3.90% of the Chinese territory and is mainly located in the Sichuan Basin and Guizhou Plateau. Annual sunny periods cover 1402 h, which is the lowest value found in sub-regions of the humid zone, and they are consistent with monthly precipitation trends (e.g., Xishui station (106.2°E, 28.3°N), Figure 10b). The average annual precipitation is 1090 mm, and the highest monthly precipitation of 180 mm occurred in June.
3.3.2. Semi-Humid Zone
The precipitation recorded for the semi-humid zone range from 660 mm to 1029 mm, and the potential and actual evapotranspiration range from 795 mm to 1266 mm and from 607 mm to 662 mm, respectively. The banded zone of semi-humid zone covers a large area from Southwestern to Northeastern China and from the eastern margin of the Qinghai-Tibet Plateau to the Northeast Plain. Thus, temperatures in the area vary considerably from 2.6 to 16 °C. Sunny periods recorded for the semi-humid zone are relatively long and range from 2100 h to 2403 h. Precipitation decreases gradually from C21 to C26. With the exception of values recorded for sub-region C22, the temperature and potential evapotranspiration in these sub-regions gradually decrease.
Although the precipitation and potential evapotranspiration are high for C21 and C22, the actual evaporation is lower than that for C23, which is mainly due to different periods of rain and heat recorded for C21 and C22. Precipitation measured for sub-region C23 is 33 mm which is higher than that for C24, and the potential evapotranspiration is 125 mm which also higher than that of C24. However, actual evaporation values are very similar between the two sub-regions and the bias is only 4 mm. While sunny periods are longer for C25 and C26, which are mainly located along the eastern margins of the Qinghai-Tibet Plateau and the Northeast Plain, the temperatures are among the lowest of the sub-regions, and the corresponding potential and actual evapotranspiration and precipitation are the lowest observed for the semi-humid zone.
Sub-region C21 accounts for only 1.88% of the Chinese territory; it includes only five stations and is located in Yunnan Province. The average altitude of the sub-region is 1780 m, and the area receives a sufficient amount of sunshine (2400 h). However, rain and heat values are significantly different for the same period. Average annual precipitation reaches 1029 mm, and is the highest level recorded in the semi-humid zone. High precipitation are recorded from June to September and range from 189 to 270 mm with an average value of 223 mm.
Sub-region C22 occupies 2.16% of the Chinese territory with stations mainly located in Yunnan Province. The average altitude of the area is 1489 m; average annual sunny periods last 2277 hours; and the average temperatures is 12.7 °C (e.g., Chuxiong station (101.6°E, 25.0°N), Figure 10c). Sunshine patterns for the year are opposite those of precipitation, which is similar to the C21 sub-region. However, the maximum monthly precipitation is lower than that recorded in C21.
Sub-region C23 covers 1.54% of the Chinese territory and includes 11 stations that are centrally distributed across Yunnan, Anhui and Shandong Provinces. Temperatures and altitudes recorded for C23 are lower than those of C22. Precipitation mainly falls from June to August with a peak occurring in July (218 mm). Recorded sunshine and precipitation trends are very similar (e.g., Bozhou station (115.8°E, 33.9°N), Figure 10d).
Stations in sub-region C24 account for 1.87% of the Chinese territory and are located in Shaanxi, Henan and Liaoning Provinces. The altitude of this sub-region is the lowest for the semi-humid zone. Sunshine and precipitation have the same distribution over the year.
Sub-region C25 occupies the largest proportion of the semi-humid zone, covering 3.74% of the Chinese territory. It runs through the semi-humid zone but is mainly distributed across Northeastern China. Less precipitation falls here than in sub-region C24, although sunshine is more abundant. Sunny periods vary monthly from between 139 h to 238 h with periods lasting 194 h on average.
Sub-region C26 occupies 5.22% of the Chinese territory. Stations in C26 are also mainly located along the eastern margin of the Qinghai-Tibet Plateau and in northeastern areas. Sunshine is abundant with monthly sunshine hours of approximately 200 h. The average local temperature is only 2.6 °C, and precipitation here is the lowest in the semi-humid zone (e.g., Ruoergai station (103.0°E, 33.6°N), Figure 10e).
3.3.3. Semi-Arid Zone
For the semi-arid zone, ranges for precipitation, potential evapotranspiration, actual evaporation and temperature are 449–570 mm, 952–1150 mm, 444–474 mm, and 1.9–11.2 °C, respectively. The semi-arid zone is located along the north and west reaches of the semi-humid zone, and it is mainly positioned along the central-eastern area of the Qinghai-Tibet Plateau and in the northern and northeastern areas of Mainland China. All values (precipitation, temperature, and potential and actual evapotranspiration) gradually decrease from C31 to C34. Sunny periods for all sub-regions are relatively long, varying slightly from 2609 h to 2659 h.
Sub-region C31 covers 3.24% of the Chinese territory and is mainly distributed across Hebei Province and along the northern area of Shanxi Province. Precipitation and potential evapotranspiration as well as temperature (11.2 °C) are the highest in the semi-arid zone. Precipitation in July and August is high at approximately 150 mm, while those in the rest of the month are less than 100 mm. Throughout the year, sunshine time reach a maximum value in May and then decrease (e.g., Baoding station (115.5°E, 38.9°N), Figure 10f).
Sub-region C32 occupies 7.47% of the Chinese territory, and the stations are widely distributed across ten provinces. The range of monthly sunshine hours is 180–264 h, reaching a peak in May. The maximum precipitation value is 120 mm, which occurs in July.
Sub-region C33 accounts for 10.67% of the Chinese territory, the stations of which are mainly distributed in northeastern China and central Mongolia. Precipitation is concentrated from May to September, accounting for 88.9% of all rainfall (e.g., Boketu station (121.9°E, 48.8°N), Figure 10g); virtually no rainfall is observed in the other months. Monthly variations in sunshine are relatively minor compared with those in other sub-regions, and monthly sunshine periods span 225 h.
Sub-region C34 covers 9.41% of the Chinese territory and is mainly located in the central-eastern Qinghai-Tibetan Plateau. In this sub-region, evaporation is high, and nearly all precipitation evaporates. Monthly sunny periods exceed 200 h. Monthly precipitation is low, and the highest level recorded is 96 mm, which occurs in July.
3.3.4. Arid Zone
In the arid zone, precipitation, the recorded potential and actual evapotranspiration, temperature and sunny hours are 47–179 mm, 1234–1443 mm, 47–178 mm, 5.9–9.5 °C, and 2999–3043 h, respectively. As latent heat is high in the arid zone, actual evaporation depends on precipitation. Our diagram of the P-Ea relationship (Figure 9d) shows that actual evaporation in the arid and semi-arid zones is a linearly related with precipitation.
Sub-region C41 is widely distributed across Western China and occupies 19.21% of the Chinese territory. Precipitation in the arid zone is scarce and it is slightly larger than that of C42. Thus, the local climate is also wetter than C42. Altay station (88.1°E, 47.7°N) is typical of stations found in C41, and it records relatively average level of precipitation (~15 mm for each month) and high monthly sunshine in this sub-regions (Figure 10h).
Sub-region C42 covers 13.99% of the Chinese territory and is mainly located in Xinjiang province. In this sub-region, precipitation is very low. Aral station (81.3°E, 40.6°N) is chosen as representative of C42, and it records almost no precipitation (about 47 mm). Sunshine is very strong, and the monthly sunshine time exceeds 190 h.
4. Conclusions
In this study, a multi-dimensional hydro-climatic similarity and classification framework based on Budyko theory is proposed and applied to Mainland China. To conduct a comprehensive hydro-climatic classification at the continental scale, three indices, namely, the DI, EI, and parameter ω are employed in the framework. Under this framework, the traditional climatic zones, e.g., humid, semi-humid, semi-arid, and arid zones, obtained from the DI are sub-divided. Furthermore, a criterion is used to generate optimal classification results, i.e., average levels of similarity are the highest between stations within each sub-region. Using this method, station similarities are defined by the proximity of a vector space including the climatic and physical characteristics of stations.
The classification framework was then applied to Mainland China, and 637 stations were used for continental classification experiments. We found that the hydrothermal conditions of vertically distributed stations on the Budyko curve within the same climatic zone can be quite different when DI < 4.0. For instance, the higher the vertical locations of stations on the Budyko curve are, the drier and colder the climatic conditions and corresponding natural landscapes. Hence, to obtain comprehensive classification results, the DI, EI, and curve-fitting index ω should be combined. Under the proposed hydro-climatic classification framework, the four climatic zones were further divided into 17 sub-regions, and the hydrothermal conditions were examined for each sub-region. We found that the spatial and temporal distributions of hydrothermal factors are essential for sub-region categorizing.
In conclusion, our classification method based on Budyko theory can identify differences in dry-wet conditions and thus serves as an objective tool for large-scale hydro-climatic classification. Our method that classifies regions through quantitatively assessing the interaction between water and energy availability could underpin sustainable water resources development and even guide crop planting by considering the synthetic climate indices of the framework. Finally, mapping hydro-climatic zones across continental scale would transfer knowledge to ungagged areas, which can guide modelling and promote predictive power for hydrological community.
Author Contributions
Conceptualization, J.L., S.X. and X.C.; methodology, J.L.; software, S.X.; data curation, S.X. and X.H.; writing-original draft preparation, S.X., X.H. and J.L.; writing-review and editing, J.L. and R.H.; supervision, X.C.; funding acquisition, R.H. and J.L.
Funding
This work was supported by the National Key Research and Development Program (2016YFC0401501) funded by the Ministry of Science and Technology of China, the National Natural Science Foundation of China (NSFC) (grants 41730750, 41771025, and 91647108), and the Special Fund of the State Key Laboratory of Hydrology-Water Resources and Hydraulic Engineering (no 20185044312).
Conflicts of Interest
The authors declare no conflict of interest.
References
- Ran, Y.; Xie, J.; Li, X. Socio-economic development and its effects on the ecological environment of the Yellow River Source Zone. In Landscape and Ecosystem Diversity, Dynamics and Management in the Yellow River Source Zone; Springer: Berlin, Germany, 2016; pp. 331–351. [Google Scholar]
- McDonnell, J.J.; Woods, R. On the need for catchment classification. J. Hydrol. 2004, 299, 2–3. [Google Scholar] [CrossRef]
- Wagener, T.; Sivapalan, M.; Troch, P.A.; Woods, R.A. Catchment Classifification and Hydrologic Similarity. Geogr. Compet. 2007, 1, 901–931. [Google Scholar] [CrossRef]
- Troch, P.A.; Lahmers, T.; Meira, A.; Mukherjee, R.; Pedersen, J.W.; Roy, T.; Valdés-Pineda, R. Catchment coevolution: A useful framework for improving predictions of hydrological change. Water Resour. Res. 2015, 51, 4903–4922. [Google Scholar] [CrossRef]
- Zeng, R.; Cai, X. Assessing the temporal variance of evapotranspiration considering climate and catchment storage factors. Adv. Water Resour. 2015, 79, 51–60. [Google Scholar] [CrossRef]
- Jin, Y.; Liu, J.T.; Lin, L.; Wang, A.; Chen, X. Exploring hydrologically similar catchments in terms of the physical characteristics of upstream regions. Hydrol. Res. 2017. [Google Scholar] [CrossRef]
- Abrahams, A.D. Channel networks: A geomorphological perspective. Water Resour. Res. 1984, 20, 161–188. [Google Scholar] [CrossRef]
- Piao, S.; Ciais, P.; Huang, Y.; Shen, Z.; Peng, S.; Li, J.; Zhou, L.; Liu, H.; Ma, Y.; Ding, Y.; et al. The impacts of climate change on water resources and agriculture in China. Nature 2010, 467, 43–51. [Google Scholar] [CrossRef]
- Jones, J.A.; Creed, I.F.; Hatcher, K.L.; Warren, R.J.; Adams, M.B.; Benson, M.H.; Boose, E.; Brown, W.A.; Campbell, J.L.; Covich, A.; et al. Ecosystem processes and human influences regulate streamflow response to climate change at long-term ecological research sites. Bioscience 2012, 62, 390–404. [Google Scholar] [CrossRef]
- Fang, J.; Song, Y.; Liu, H.; Piao, S. Vegetation-climate relationship and its application in the division of vegetation zone in China. J. Integr. Plant Biol. 2002, 44, 1105–1122. [Google Scholar]
- Troch, P.A.; Carrillo, G.; Sivapalan, M.; Wagener, T. Climate-vegetation-soil interactions and long-term hydrologic partitioning: Signatures of catchment co-evolution. Hydrol. Earth Syst. Sci. 2013, 17, 2209–2217. [Google Scholar] [CrossRef]
- Trancoso, R.; Larsen, J.R.; Mcalpine, C.; Mcvicar, T.R.; Phinn, S. Linking the Budyko framework and the Dunne diagram. J. Hydrol. 2016, 535, 581–597. [Google Scholar] [CrossRef] [Green Version]
- Wang, D.; Alimohammadi, N. Responses of annual runoff, evaporation, and storage change to climate variability at the watershed scale. Water Resour. Res. 2012, 48, W05546. [Google Scholar] [CrossRef]
- Fernandez, R.; Sayama, T. Hydrological recurrence as a measure for large river basin classifification and process understanding. Hydrol. Earth Syst. Sci. 2015, 19, 1919–1942. [Google Scholar] [CrossRef]
- Peel, M.C.; Finlayson, B.L.; McMahon, T.A. Updated world map of the Köppen-Geiger climate classification. Hydrol. Earth Syst. Sci. 2007, 11, 259–263. [Google Scholar] [CrossRef]
- Knoben, W.J.M.; Woods, R.A.; Freer, J.E. A quantitative hydrological climate classifification evaluated with independent streamflflow data. Water Resour. Res. 2018, 54, 5088–5109. [Google Scholar] [CrossRef]
- Abella, S.R.; Shelburne, V.B.; Macdonald, N.W. Multifactor classification of forest landscape ecosystems of Jocassee Gorges, southern Appalachian Mountains, South Carolina. Can. J. Vet. Res. 2003, 33, 1933–1946. [Google Scholar] [CrossRef]
- Stadler, S.J. Aridity indexes. In The Encyclopedia of Climatology, Encyclopedia of Earth Sciences; Oliver, J.E., Fairbridge, R.W., Eds.; Nostrand Reinhold Goes: New York, NY, USA, 1987; Volume XI, pp. 102–107. [Google Scholar]
- Penman, H.L. Estimating evaporation. Eos Trans. AGU 1956, 37, 43–50. [Google Scholar] [CrossRef]
- McCulloch, J.S.G. Tables for the rapid compution of the Penman estimate of evaporation. East Afr. Agric. For. J. 1965, 30, 286–295. [Google Scholar] [CrossRef]
- Thornthwaite, C.W.; Mather, J.R. The water balance. Publ. Climatol. 1955, 8, 1–104. [Google Scholar]
- Holdridge, L.R. Determination of World Plant Formations from Simple Climatic Data. Science 1947, 105, 367–368. [Google Scholar] [CrossRef]
- Kira, T. Forest ecosystems of East and Southeast Asia in global perspective. Ecol. Res. 1991, 6, 185–200. [Google Scholar] [CrossRef]
- Budyko, M.I. Methods for Determining the Components of the Heat Balance, Climate and Life; Academic Press: New York, NY, USA, 1974. [Google Scholar]
- Botzan, T.M.; Mariño, M.A.; Necula, A.I. Modified de martonne aridity index: Application to the Napa basin, California. Phys. Geogr. 1998, 19, 55–70. [Google Scholar] [CrossRef]
- Arora, V.K. The use of the aridity index to assess climate change effect on annual runoff. J. Hydrol. 2002, 265, 164–177. [Google Scholar] [CrossRef]
- Wu, S.H.; Yin, Y.H.; Zheng, D. Study on dry and wet conditions of land surface in China in recent 30 years. Sci. China 2005, 35, 276–283. (in Chinese). [Google Scholar]
- Sawicz, K.A.; Kelleher, C.; Wagener, T.; Troch, P.; Sivapalan, M.; Carrillo, G. Characterizing hydrologic change through catchment classification. Hydrol. Earth Syst. Sci. 2014, 18, 6599–6627. [Google Scholar] [CrossRef]
- Berghuijs, W.R.; Sivapalan, M.; Woods, R.A.; Savenije, H.H.G. Patterns of similarity of seasonal water balances: A window into streamflflow variability over a range of time scales. Water Resour. Res. 2014, 50, 5638–5661. [Google Scholar] [CrossRef]
- Addor, N.; Nearing, G.; Prieto, C.; Newman, A.J.; Le Vine, N.; Clark, M.P. Selection of hydrological signatures for large-sample hydrology. Water Resour. Res. 2018. [Google Scholar] [CrossRef]
- Zhang, L.; Hickel, K.; Dawes, W.R.; Chiew, F.H.S.; Western, A.W.; Briggs, P.R. A rational function approach for estimating mean annual evapotranspiration. Water Resour. Res. 2004, 40, 89–97. [Google Scholar] [CrossRef]
- Yang, D.; Sun, F.; Liu, Z.; Cong, Z.; Ni, G.; Lei, Z. Analyzing spatial and temporal variability of annual water-energy balance in nonhumid regions of China using the Budyko hypothesis. Water Resour. Res. 2007, 43, 436–451. [Google Scholar] [CrossRef]
- Gunkel, A.; Lange, J. Water scarcity, data scarcity and the Budyko curve—An application in the Lower Jordan River Basin. J. Hydrol. 2017, 12, 136–149. [Google Scholar] [CrossRef]
- Peel, M.C.; Mcmahon, T.A.; Finlayson, B.L. Vegetation impact on mean annual evapotranspiration at a global catchment scale. Water Resour. Res. 2010, 46, 2095–2170. [Google Scholar] [CrossRef]
- Yang, D.W.; Shao, W.W.; Yeh, P.J.F.; Yang, H.B.; Kanae, S.; Oki, T. Impact of vegetation coverage on regional water balance in the nonhumid regions of China. Water Resour. Res. 2009, 45, 450–455. [Google Scholar] [CrossRef]
- Donohue, R.J.; Roderick, M.L.; McVicar, T.R. On the importance of including vegetation dynamics in Budyko’s hydrological model. Hydrol. Earth Syst. Sci. 2006, 3, 983–995. [Google Scholar] [CrossRef]
- Donohue, R.J.; Roderick, M.L.; Mcvicar, T.R. Can dynamic vegetation information improve the accuracy of Budyko’s hydrological model. J. Hydrol. 2010, 390, 23–34. [Google Scholar] [CrossRef]
- Li, D.; Pan, M.; Cong, Z.; Zhang, L.; Wood, E. Vegetation control on water and energy balance within the Budyko framework. Water Resour. Res. 2013, 49, 969–976. [Google Scholar] [CrossRef] [Green Version]
- Zhang, S.; Yang, H.; Yang, D.; Jayawardena, A.W. Quantifying the effect of vegetation change on the regional water balance within the Budyko framework. Geophys. Res. Lett. 2015, 43, 1140–1148. [Google Scholar] [CrossRef]
- Zhang, S.; Yang, Y.; Mcvicar, T.R.; Yang, D. An analytical solution for the impact of vegetation changes on hydrological partitioning within the Budyko framework. Water Resour. Res. 2018, 54, 519–537. [Google Scholar] [CrossRef]
- Gao, M.; Chen, X.; Liu, J.; Zhang, Z. Regionalization of annual runoff characteristics and its indication of co-dependence among hydro-climate–landscape factors in Jinghe River Basin, China. Stoch. Environ. Res. Risk Assess. 2017, 4, 1–18. [Google Scholar] [CrossRef]
- Milly, P.C.D. An analytic solution of the stochastic storage problem applicable to soil water. Water Resour. Res. 1993, 29, 3755–3758. [Google Scholar] [CrossRef]
- Potter, N.J.; Zhang, L.; Milly, P.C.D.; Mcmahon, T.A.; Jakeman, A.J. Effects of rainfall seasonality and soil moisture capacity on mean annual water balance for Australian catchments. Water Resour. Res. 2005, 41, W06007. [Google Scholar] [CrossRef]
- Donohue, R.J.; Roderick, M.L.; Mcvicar, T.R. Roots, storms and soil pores: Incorporating key ecohydrological processes into Budyko’s hydrological model. J. Hydrol. 2012, 436–437, 35–50. [Google Scholar] [CrossRef]
- Shao, Q.; Traylen, A.; Zhang, L. Nonparametric method for estimating the effects of climatic and catchment characteristics on mean annual evapotranspiration. Water Resour. Res. 2012, 48, W03517. [Google Scholar] [CrossRef]
- Li, D. Assessing the impact of interannual variability of precipitation and potential evaporation on evapotranspiration. Adv. Water Resour. 2014, 70, 1–11. [Google Scholar] [CrossRef]
- Ning, T.; Li, Z.; Liu, W. Vegetation dynamics and climate seasonality jointly control the interannual catchment water balance in the Loess Plateau under the Budyko framework. Hydrol. Earth Syst. Sci. 2017, 21, 1–25. [Google Scholar] [CrossRef]
- Qiu, N.; Chen, X.; Hu, Q.; Liu, J.T.; Huang, R.; Gao, M. Hydro-stochastic interpolation coupling with the Budyko approach for prediction of mean annual runoff. Hydrol. Earth Syst. Sci. 2018, 22, 2891–2901. [Google Scholar] [CrossRef] [Green Version]
- Fu, B.P. On the calculation of the evaporation from land surface. Sci. Atmos. Sin. 1981, 5, 23–31. (in Chinese). [Google Scholar]
- Merz, R.; Blöschl, G. A regional analysis of event runoff coefficients with respect to climate and catchment characteristics in Austria. Water Resour. Res. 2009, 45, 639–643. [Google Scholar] [CrossRef]
- Greve, P.; Gudmundsson, L.; Orlowsky, B.; Seneviratne, S.I. Introducing a probabilistic Budyko framework. Geophys. Res. Lett. 2015, 42, 2261–2269. [Google Scholar] [CrossRef] [Green Version]
- The 90 m Advanced Spaceborne Thermal Emission and Reflection Radiometer Global Digital Elevation Model (ASTER GDEM) Data. Available online: http://www.gscloud.cn/sources/ (accessed on 17 March 2015).
- FAO Classified Soil Map of One Kilometer in China. Available online: http://www.soil.csdb.cn/map/ (accessed on 29 September 2015).
- Spatial Distribution Data of Soil Texture in China. Available online: http://www.resdc.cn/DOI/ (accessed on 7 December 2015).
- Allen, R.G.; Pereira, L.S.; Raes, D.; Smith, M. Crop Evapotranspiration: Guidelines for Computing Crop Water Requirements; FAO Irrigation and Drainage; Food and Agricultural Organization: Rome, Italy, 1998; p. 56. [Google Scholar]
- Gao, G.; Chen, D.; Xu, C.Y.; Simelton, E. Trend of estimated actual evapotranspiration over China during 1960–2002. J. Geophys. Res. 2007, 112, D11120. [Google Scholar] [CrossRef]
- Sun, F. Study on Watershed Evapotranspiration Based on the Budyko Hypothesis. Ph.D. Thesis, Tsinghua University, Beijing, China, 2007. [Google Scholar]
- Winter, T.C. The concept of hydrologic landscapes. J. Am. Water Resour. Assoc. 2010, 37, 335–349. [Google Scholar] [CrossRef]
- Cheng, L.; Yaeger, M.; Viglione, A.; Coopersmith, E. Exploring the physical controls of regional patterns of flow duration curves—Part 1: Insights from statistical analyses. Hydrol. Earth Syst. Sci. 2012, 16, 4435–4446. [Google Scholar] [CrossRef]
- Yuan, Q.Z.; Wu, S.H.; Dai, E.B.; Zhao, D.S.; Zhang, X.R.; Qi, R.P. Spatiotemporal variations of dry-wet climate over period of 1961~2015 in China. Sci. Sin. Terrae 2017, 47, 1339–1348. (in Chinese). [Google Scholar]
- Zheng, J.Y.; Bian, J.J.; Ge, Q.S.; Hao, Z.X.; Yin, Y.H.; Liao, Y.M. The climate regionalization in China for 1981–2010. Chin. Sci. Bull. 2013, 58, 3088–3099. (In Chinese) [Google Scholar]
- Zhu, G.R.; Li, Y. Types and changes of Chinese climate zones from 1961 to 2013 based on Köppen climate classification. Arid Land Geogr. 2015, 38, 1121–1132. (In Chinese) [Google Scholar]
- The VCG Website. Available online: https://www.vcg.com/ (accessed on 15 April 2018).
Figure 1.
Map of meteorological stations and provinces in China. Grey points on the map denote the meteorological stations used in this study.
Figure 1.
Map of meteorological stations and provinces in China. Grey points on the map denote the meteorological stations used in this study.

Figure 2.
Flow chart of main procedures within the classification framework.

Figure 3.
Schematic diagram of sub-region classifications on the Budyko curve. Points a and b, shown as red triangles, denote the intersection of lower and upper envelope lines when DI = 1. Line segment ab is divided into n equal segments, and Fu’s curves cross equipartition points to divide each climatic zone into n sub-regions.

Figure 4.
The optimal classification of stations on the Budyko curve. The humid zone is divided into sub-regions C11, C12, C13, C14, and C15. The semi-humid zone is divided into sub-regions C21, C22, C23, C24, C25, and C26. The semi-arid zone is divided into sub-regions C31, C32, C33, and C34. The arid zone is divided into sub-regions C41 and C42.

Figure 5.
The number of sub-regions as a function of the average Euclidean distance measured within a climatic zone. The three red pentagrams represent optimal values with the lowest Euclidean distance for each zone.
Figure 5.
The number of sub-regions as a function of the average Euclidean distance measured within a climatic zone. The three red pentagrams represent optimal values with the lowest Euclidean distance for each zone.

Figure 6.
The classification results of national climatic stations (a) and climatic zones (b).

Figure 7.
Representative landscapes of each sub-region. C11: Tropical landscape of Lingshui, Hainan Province (110.0°E, 18.5°N). C12: Subtropical coastal landscape of Yangjiang, Guangdong Province (112.0°E, 21.8°N). C13: Landscape of the Chiang-nan Hilly Region in Suichuan, Jiangxi Province (114.5°E, 26.3°N). C14: Cedar forest in Huoshan, Anhui Province (116.3°E, 31.4°N). C15: Karst scenery in Xishui, Guizhou Province (106.2°E, 28.3°N). C21: Lijiang, Yunnan Province (100.2°E, 26.9°N). C22: Mountainous area in Chuxiong, Yunnan Province (101.5°E, 25.0°N). C23: Terraced field in Baoshanlongyang, Yunnan Province (99.2°E, 25.1°N). C24: The Hanzhoung Basin in Lueyang, Shaanxi Province (106.2°E, 33.3°N). C25: Mixed forest in northeastern China, Yichun, Heilongjiang Province (128.9°E, 47.7°N). C26: Grassland in Ruoergai, Sichuan Province (102.9°E, 33.6°N). C31: Mountainous landscape in Xingtai, Hebei Province (114.5°E, 37.1°N). C32: Plains in Shijiazhuang, Hebei Province (114.4°E, 38.0°N). C33: Grassland in eastern WuZhu MuQin, Inner Mongolia (117.0°E, 45.5°N). C34: Hillslopes in the Lhasa River Basin in Naqu, Tibet (92.1°E, 31.5°N). C41: Green dunes of the Junggar Basin in Shihezi, Xinjiang (86.0°E, 44.3°N). C42: Desert of the Tarim Basin in Hotan, Xinjiang (79.9°E, 37.1°N). All landscape pictures are available online [63].

Figure 8.
The distribution of the dryness index with average annual precipitation (a) and sunny periods (b) for Mainland China.
Figure 8.
The distribution of the dryness index with average annual precipitation (a) and sunny periods (b) for Mainland China.


Figure 9.
Precipitation as a function of DI (a), EI (b), E0 (c), Ea (d), and sunny periods (e).


Figure 10.
Monthly precipitation, sunny periods, and temperature measured from typical stations in each sub-region. (a) Ruili station, (b) Xishui station, (c) Chuxiong station, (d) Bozhou station, (e) Ruoergai station, (f) Baoding station, (g) Boketu station, (h) Altay station.
Figure 10.
Monthly precipitation, sunny periods, and temperature measured from typical stations in each sub-region. (a) Ruili station, (b) Xishui station, (c) Chuxiong station, (d) Bozhou station, (e) Ruoergai station, (f) Baoding station, (g) Boketu station, (h) Altay station.


Table 1.
Average climatic factors (1961–2012) for each sub-region.
| Climate Zone | Sub-Region | Wind Speed (m/s) | Altitude (m) | Temperature (°C) | Hours of Sun Recorded Annually (h) | E0 (mm) | Ea (mm) | P (mm) | DI | EI |
|---|---|---|---|---|---|---|---|---|---|---|
| Humid zone | C11 | 1.6 | 833 | 20.0 | 2131 | 1195 | 841 | 1595 | 0.77 | 0.54 |
| C12 | 2.6 | 173 | 19.9 | 1872 | 1151 | 934 | 1717 | 0.69 | 0.56 | |
| C13 | 2.3 | 330 | 17.9 | 1751 | 1031 | 877 | 1468 | 0.73 | 0.61 | |
| C14 | 2.3 | 472 | 15.4 | 1690 | 931 | 829 | 1300 | 0.76 | 0.67 | |
| C15 | 1.7 | 572 | 14.8 | 1402 | 845 | 779 | 1090 | 0.79 | 0.73 | |
| Semi-humid zone | C21 | 2.0 | 1780 | 16.0 | 2403 | 1266 | 660 | 1029 | 1.23 | 0.64 |
| C22 | 2.1 | 1489 | 12.7 | 2277 | 1086 | 634 | 839 | 1.31 | 0.76 | |
| C23 | 2.7 | 792 | 13.5 | 2272 | 1097 | 662 | 807 | 1.37 | 0.82 | |
| C24 | 2.3 | 624 | 11.7 | 2100 | 972 | 658 | 774 | 1.27 | 0.85 | |
| C25 | 2.4 | 918 | 6.0 | 2252 | 868 | 630 | 703 | 1.25 | 0.90 | |
| C26 | 2.5 | 1799 | 2.6 | 2316 | 795 | 607 | 660 | 1.22 | 0.93 | |
| Semi-arid zone | C31 | 2.3 | 860 | 11.2 | 2624 | 1150 | 473 | 570 | 2.12 | 0.84 |
| C32 | 2.7 | 646 | 9.5 | 2609 | 1104 | 474 | 525 | 2.17 | 0.91 | |
| C33 | 2.7 | 947 | 6.0 | 2659 | 1027 | 447 | 470 | 2.33 | 0.96 | |
| C34 | 2.7 | 2620 | 1.9 | 2632 | 952 | 444 | 449 | 2.26 | 0.99 | |
| Arid zone | C41 | 2.8 | 1663 | 5.9 | 2999 | 1234 | 178 | 179 | 8.21 | 1.00 |
| C42 | 2.5 | 1387 | 9.5 | 3043 | 1443 | 47 | 47 | 33.23 | 1.00 |
© 2019 by the authors. Licensee MDPI, Basel, Switzerland. This article is an open access article distributed under the terms and conditions of the Creative Commons Attribution (CC BY) license (http://creativecommons.org/licenses/by/4.0/).
Share and Cite
MDPI and ACS Style
Liu, J.; Xu, S.; Han, X.; Chen, X.; He, R. A Multi-Dimensional Hydro-Climatic Similarity and Classification Framework Based on Budyko Theory for Continental-Scale Applications in China. Water 2019, 11, 319. https://doi.org/10.3390/w11020319
AMA Style
Liu J, Xu S, Han X, Chen X, He R. A Multi-Dimensional Hydro-Climatic Similarity and Classification Framework Based on Budyko Theory for Continental-Scale Applications in China. Water. 2019; 11(2):319. https://doi.org/10.3390/w11020319
Chicago/Turabian StyleLiu, Jintao, Shanshan Xu, Xiaole Han, Xi Chen, and Ruimin He. 2019. "A Multi-Dimensional Hydro-Climatic Similarity and Classification Framework Based on Budyko Theory for Continental-Scale Applications in China" Water 11, no. 2: 319. https://doi.org/10.3390/w11020319
Note that from the first issue of 2016, this journal uses article numbers instead of page numbers. See further details here.