Overtopping Failure of a Reinforced Tailings Dam: Laboratory Investigation and Forecasting Model of Dam Failure


1
School of Safety Engineering, Chongqing University of Science and Technology, Chongqing 401331, China
2
Department of Hydraulic Engineering, Tsinghua University, Beijing 100084, China
3
School of Civil Engineering, The University of Queensland, Brisbane, QLD 4072, Australia
4
School of Mathematics and Physics, Chongqing University of Science and Technology, Chongqing 401331, China
*
Author to whom correspondence should be addressed.
Water 2019, 11(2), 315; https://doi.org/10.3390/w11020315
Submission received: 29 December 2018
/
Revised: 7 February 2019
/
Accepted: 8 February 2019
/
Published: 12 February 2019
(This article belongs to the Section Hydrology)
Abstract
:Overtopping failure of reinforced tailings dam may cause significant damage to the environment and even loss of life. In order to investigate the feature of overtopping of the reinforced tailings dam, which has rarely appeared in the literature, the displacement, the phreatic level and the internal stress of dam during overtopping were measured by a series of physical model tests. This study conclusively showed that, as the number of reinforcement layers increased, the anti-erosion capacity of tailings dam was notably improved. It could be supported by the change of the dimension of dam breach, the reduction of stress loss rate, and the rise of phreatic level from the tests. Based on the erosion principle, a mathematical model was proposed to predict the width of the tailings dam breach, considering the number of reinforcement layers. This research provided a framework for the exploration of the overtopping erosion of reinforced tailings dam, and all presented expressions could be applied to predict the development of breach during overtopping.
1. Introduction
Tailings, which are generally stored in a slurry form and then pumped into a sedimentation pond, are waste products of the ore-dressing process [1]. Currently, tighter legislation and regulations on tailings disposal are forcing mine operators to play a more prominent role in controlling the disposal of vast quantities of highly visible wastes [2]. Over the last few decades, there were several failures of tailings impoundments due to various reasons, including liquefaction of the retained tailings, overtopping erosion of the dam, or an excessive water seepage that would produce breach [3,4,5,6,7]. However, flood overtopping was recognized as the major cause of tailings dam failure [8].
Overtopping had been of particular interest in the last few decades due to the protection from potential environmental damages and the loss of property [9,10,11,12,13]. However, actual measurements of overtopping erosion is a costly and time-consuming process that is usually limited to small experimental tests [14,15,16,17,18]. The main influence of overtopping on dam is the erosion by water, so the characteristic of soil erosion is very important to study and many people focused on the soil erosion in recent years. A great many of the theories and methods of erosion have been studied and lots of achievements and experience were obtained in many fields. In the coast erosion, Mulder et al. [19], Van Rijn et al. [20] and Giardino et al. [21] studied the characteristics of coastal erosion and proposed some effective methods to control it. In the research on erosion of earth dams, the characteristics of dam erosion by water was researched by Carlsten et al. [22], Ran et al. [23] and Wu et al. [24]. Callaghan et al. [25], Serpa et al. [26] and Stefanidis et al. [27] studied the effect of climate change on soil erosion in a mountainous Mediterranean catchment to assess soil erosion changes. Simonneaux et al. [28] and Teng et al. [29] also studied the climate change effects on soil erosion in a semi-arid mountainous watershed and the assessment of soil erosion by water on the Tibetan Plateau based on the Revised Universal Soil Equation (RUSLE) and the Coupled Model Intercomparison Project (CMIP5) climate models, respectively. Meanwhile, Wang et al. [30] studied the response of the meltwater erosion to runoff energy consumption on loessal slopes, and Sujatha et al. [31] used the RUSLE to predict the erosion risk of a small mountainous watershed in Kodaikanal, South India. Deng et al. [32] presented a coupled model for simulating bed deformation and bank erosion that focuses on the erosion of the bank with a composite structure in the Lower Jingjiang Reach. Choi et al. [33] proposed a combined erosion framework; the framework adopts a dam-breach erosion model that can capture the progressive nature of fluvial erosion by considering the particle size distribution of the soil being eroded. The findings from the field investigation were then used to back-analyze fluvial erosion along the riverbank.
All the aforementioned research presented a great many theories and methods of erosion that can provide a good reference for the study of overtopping failure of the tailings dam. In terms of overtopping failure research of the tailings dam, to analyze the tailings dam failure evolution pattern, Zhang et al. [34] studied a tailings dam overtopping evolution model based on a physical model experiment method according to the model similarity theory and dam breach erosion model.Sun et al. [8] found out that the displacement of dam was dependent on the degree of dam saturation during overtopping erosion. Sliding displacement was increased as the saturation line rose. Liu et al. [35] proposed a physical-based model to analyze the flood process, integrating the theory of non-equilibrium sediment transposition and a conceptual model of the process of lateral erosion. However, the above research results made a great contribution to study tailings dam overtopping evolution, but the dam was built without reinforcement.
The geosynthetics have been applied extensively for strengthening and/or increasing the height of tailings dam built from low-shear strength fine-grain tailings for decades [36,37,38]. Yin et al. [39] studied the characteristics of interaction between geosynthetics (geobelt and geo-grid) and fine copper ore tailings through laboratory pull-out tests, and the results revealed that the interaction was influenced by tailings particle size, density, moisture content, and vertical load. James et al. [40] found out that reinforcement could improve the seismic stability of tailings impoundments, which could also help dissipate porewater pressures after shaking. Liu et al. [41] focused the variation in properties of composite materials after immersion to evaluate the shear behaviors of polymer–sand composite material after immersion with direct shear tests. The shear behaviors were improved with an increment in the curing time, polymer content and sand dry density while there is a decrease in the shear behaviors with increasing immersion time. Consoli et al. [42] studied the mechanical properties of gold tailings with the insertion of fibers. The research advanced in understanding the parameters that control durability and strength of fiber-reinforced compacted gold tailings.
Although overtopping and reinforcement of tailings dam have been studied separately over the past few years, rather less attention had been paid to the effect of reinforcement on the overtopping process. Since geosynthetics have been extensively used in tailings dam projects, the feature of overtopping erosion considering the influence of reinforcement, which has rarely appeared in the literature, is worth investigating. It will help to provide theoretical framework for the protection of dam failure.
This study aimed to analyze the feature of overtopping erosion of the tailings dam in terms of the number of reinforcement layers. It is achieved by the use a self-designed Tailings Dam Overtopping Failure Model Test System, which consisted of a glass flume, an observation system for phreatic line, and a rainfall system. In addition, a mathematical model for overtopping failure prediction considering the reinforcement layers was proposed based on the river dynamics theory and the erosion principle. This model could be used for predicting the width of breach caused by erosion and the discharge of water through the breach. It will provide data for the risk assessment of reinforced tailings dam overtopping.
2. Experimental
2.1. Experimental Facilities
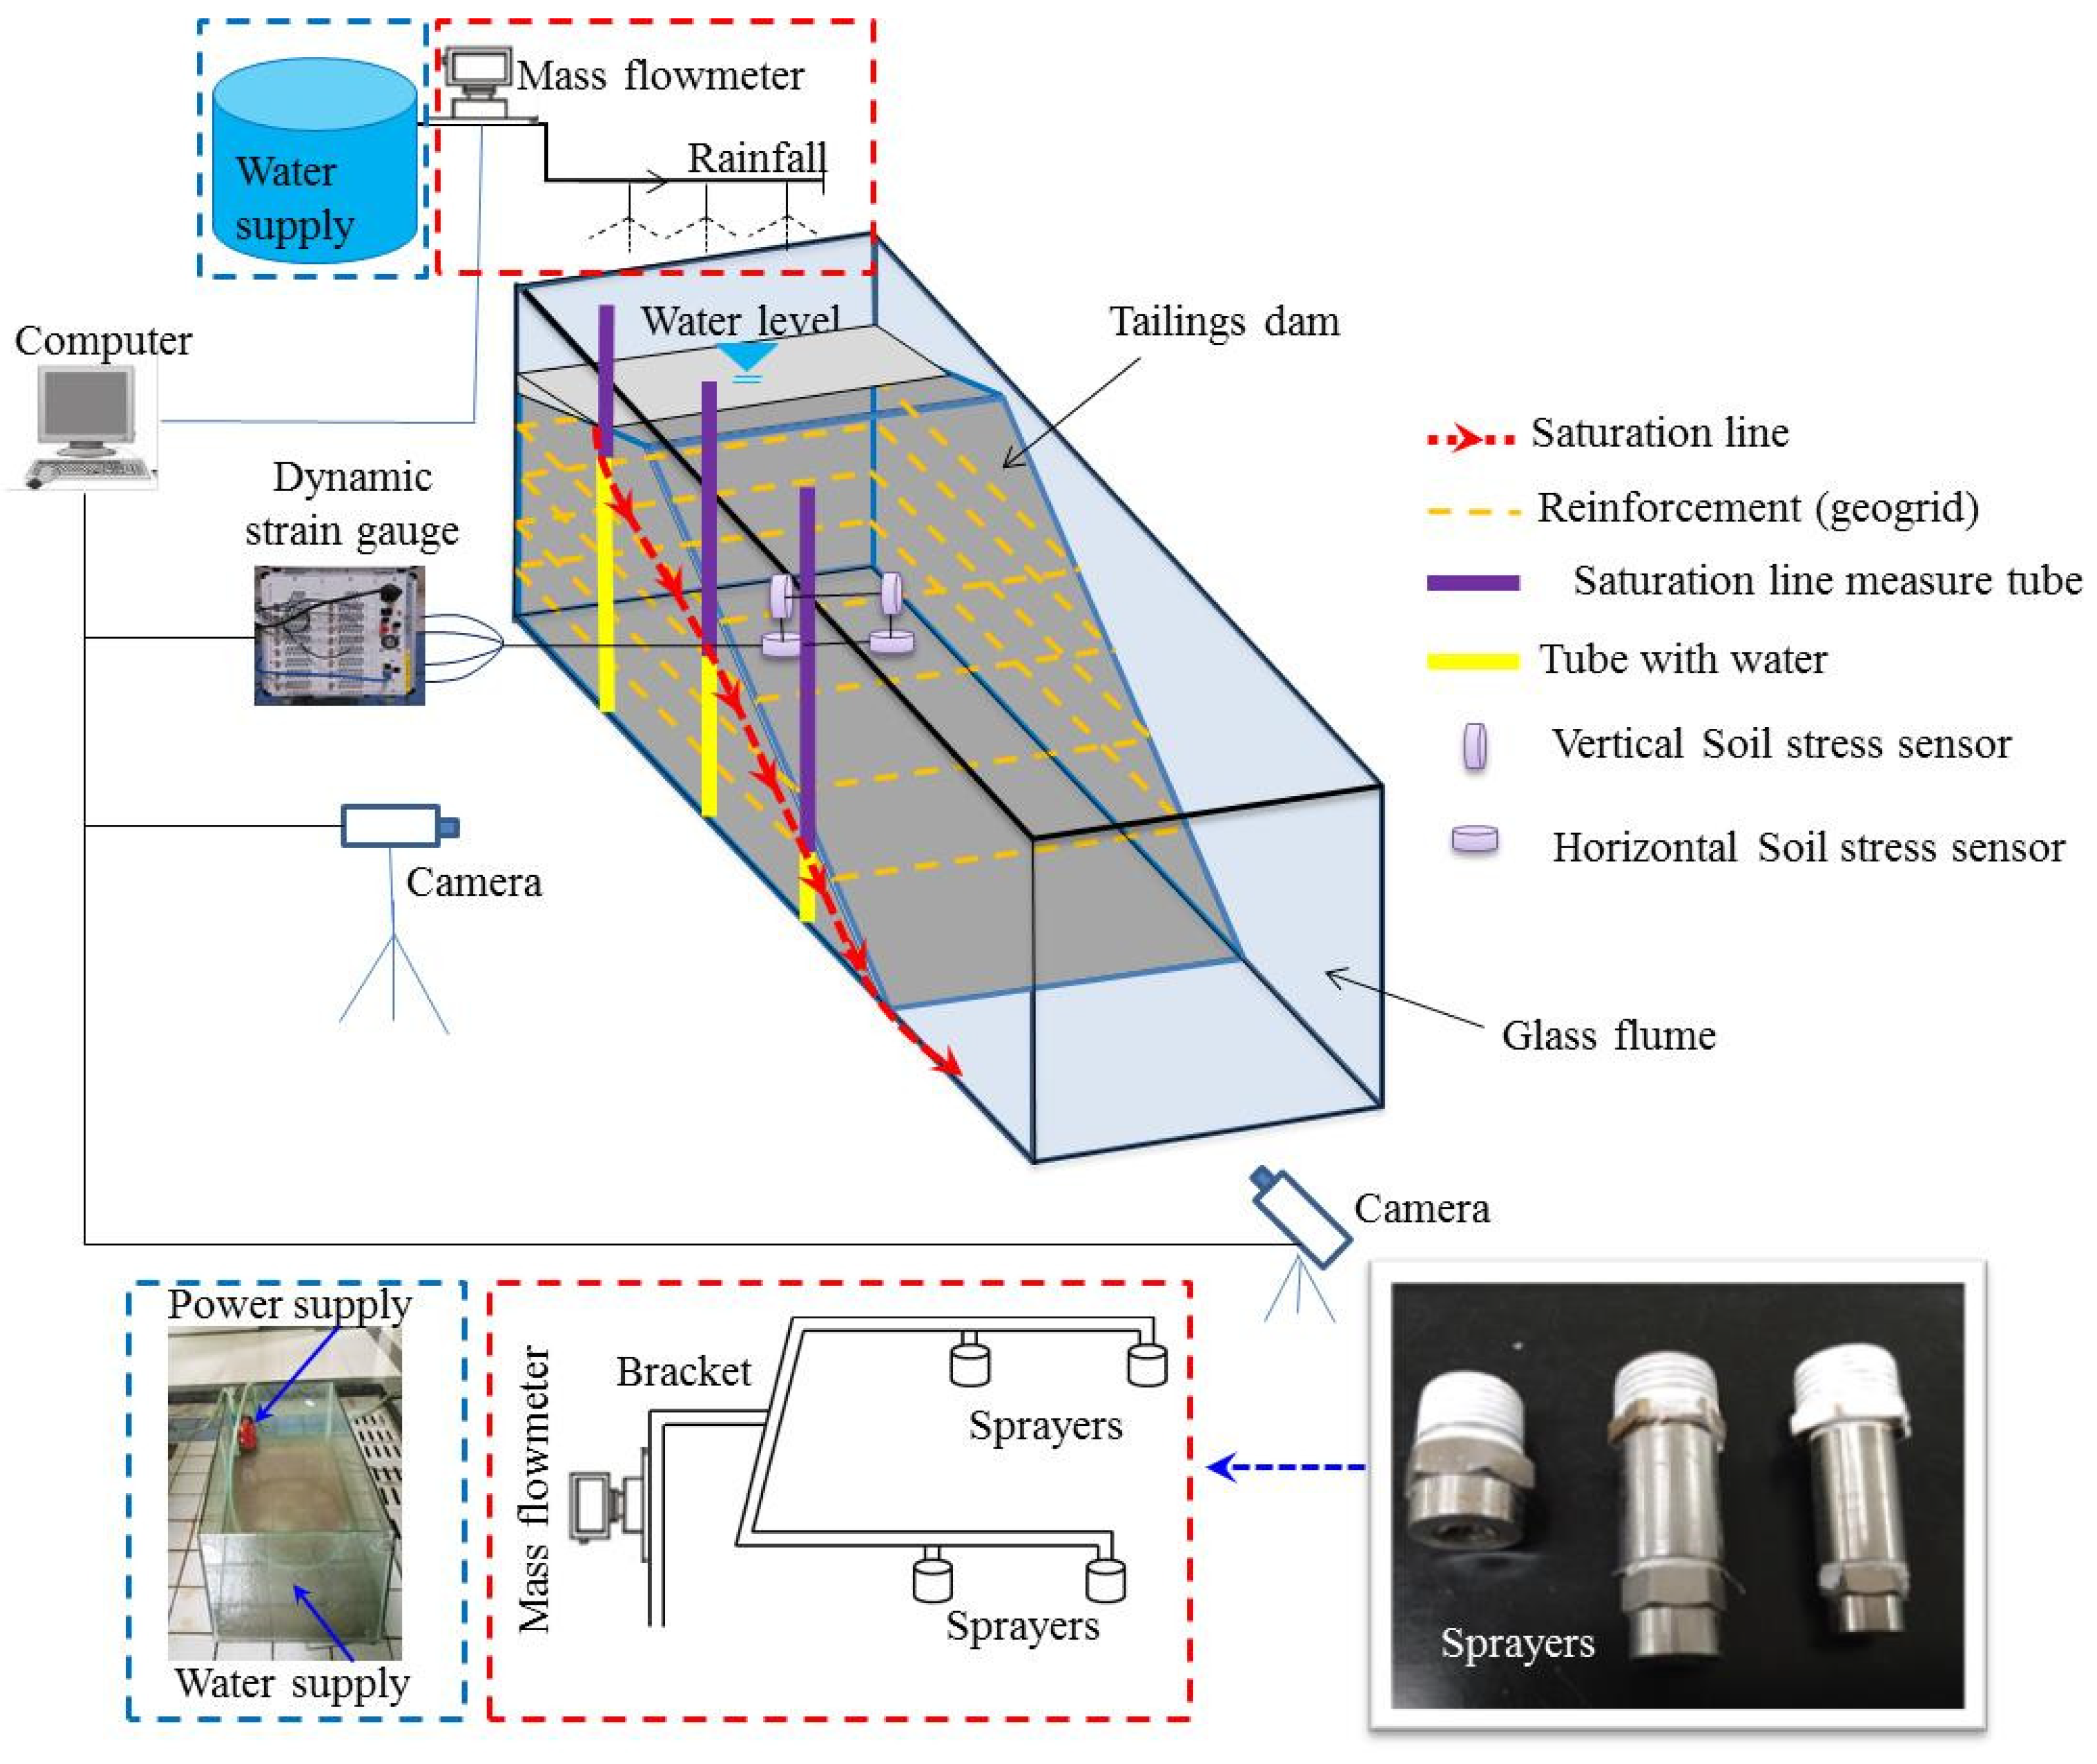
The experimental facilities consist of a glass flume, an observation system for phreatic line, and artificial rainfall simulator (Figure 1). Experiment tracer points and equipment layout are shown in Figure 2.
The glass flume had an internal dimension of 200 cm (length) by 60 cm (width) by 50 cm (height). The inner wall of flume was lubricated by the Vaseline in order to reduce the friction. The process of flooding and the change of the breach could be monitored using a high resolution camera (Camera model: Sony/HDR-CX680 (SONY, Beijing, China), Camera resolution: 1920×1080/50p). There were three U-type tubes that were evenly spaced at 30 cm monitoring the phreatic line (JR-01, JR-02, JR-03), with a diameter of 20 mm and height of 50 cm (Figure 2). Each U-type tube was divided into two segments: the one in the dam was made of perforated Polyvinyl Chlorid (PVC) and the other that was outside the dam was made of transparent acrylic. Geo-grid was used as the reinforcing materials of the model test [43], and the basic properties were shown in Table 1.
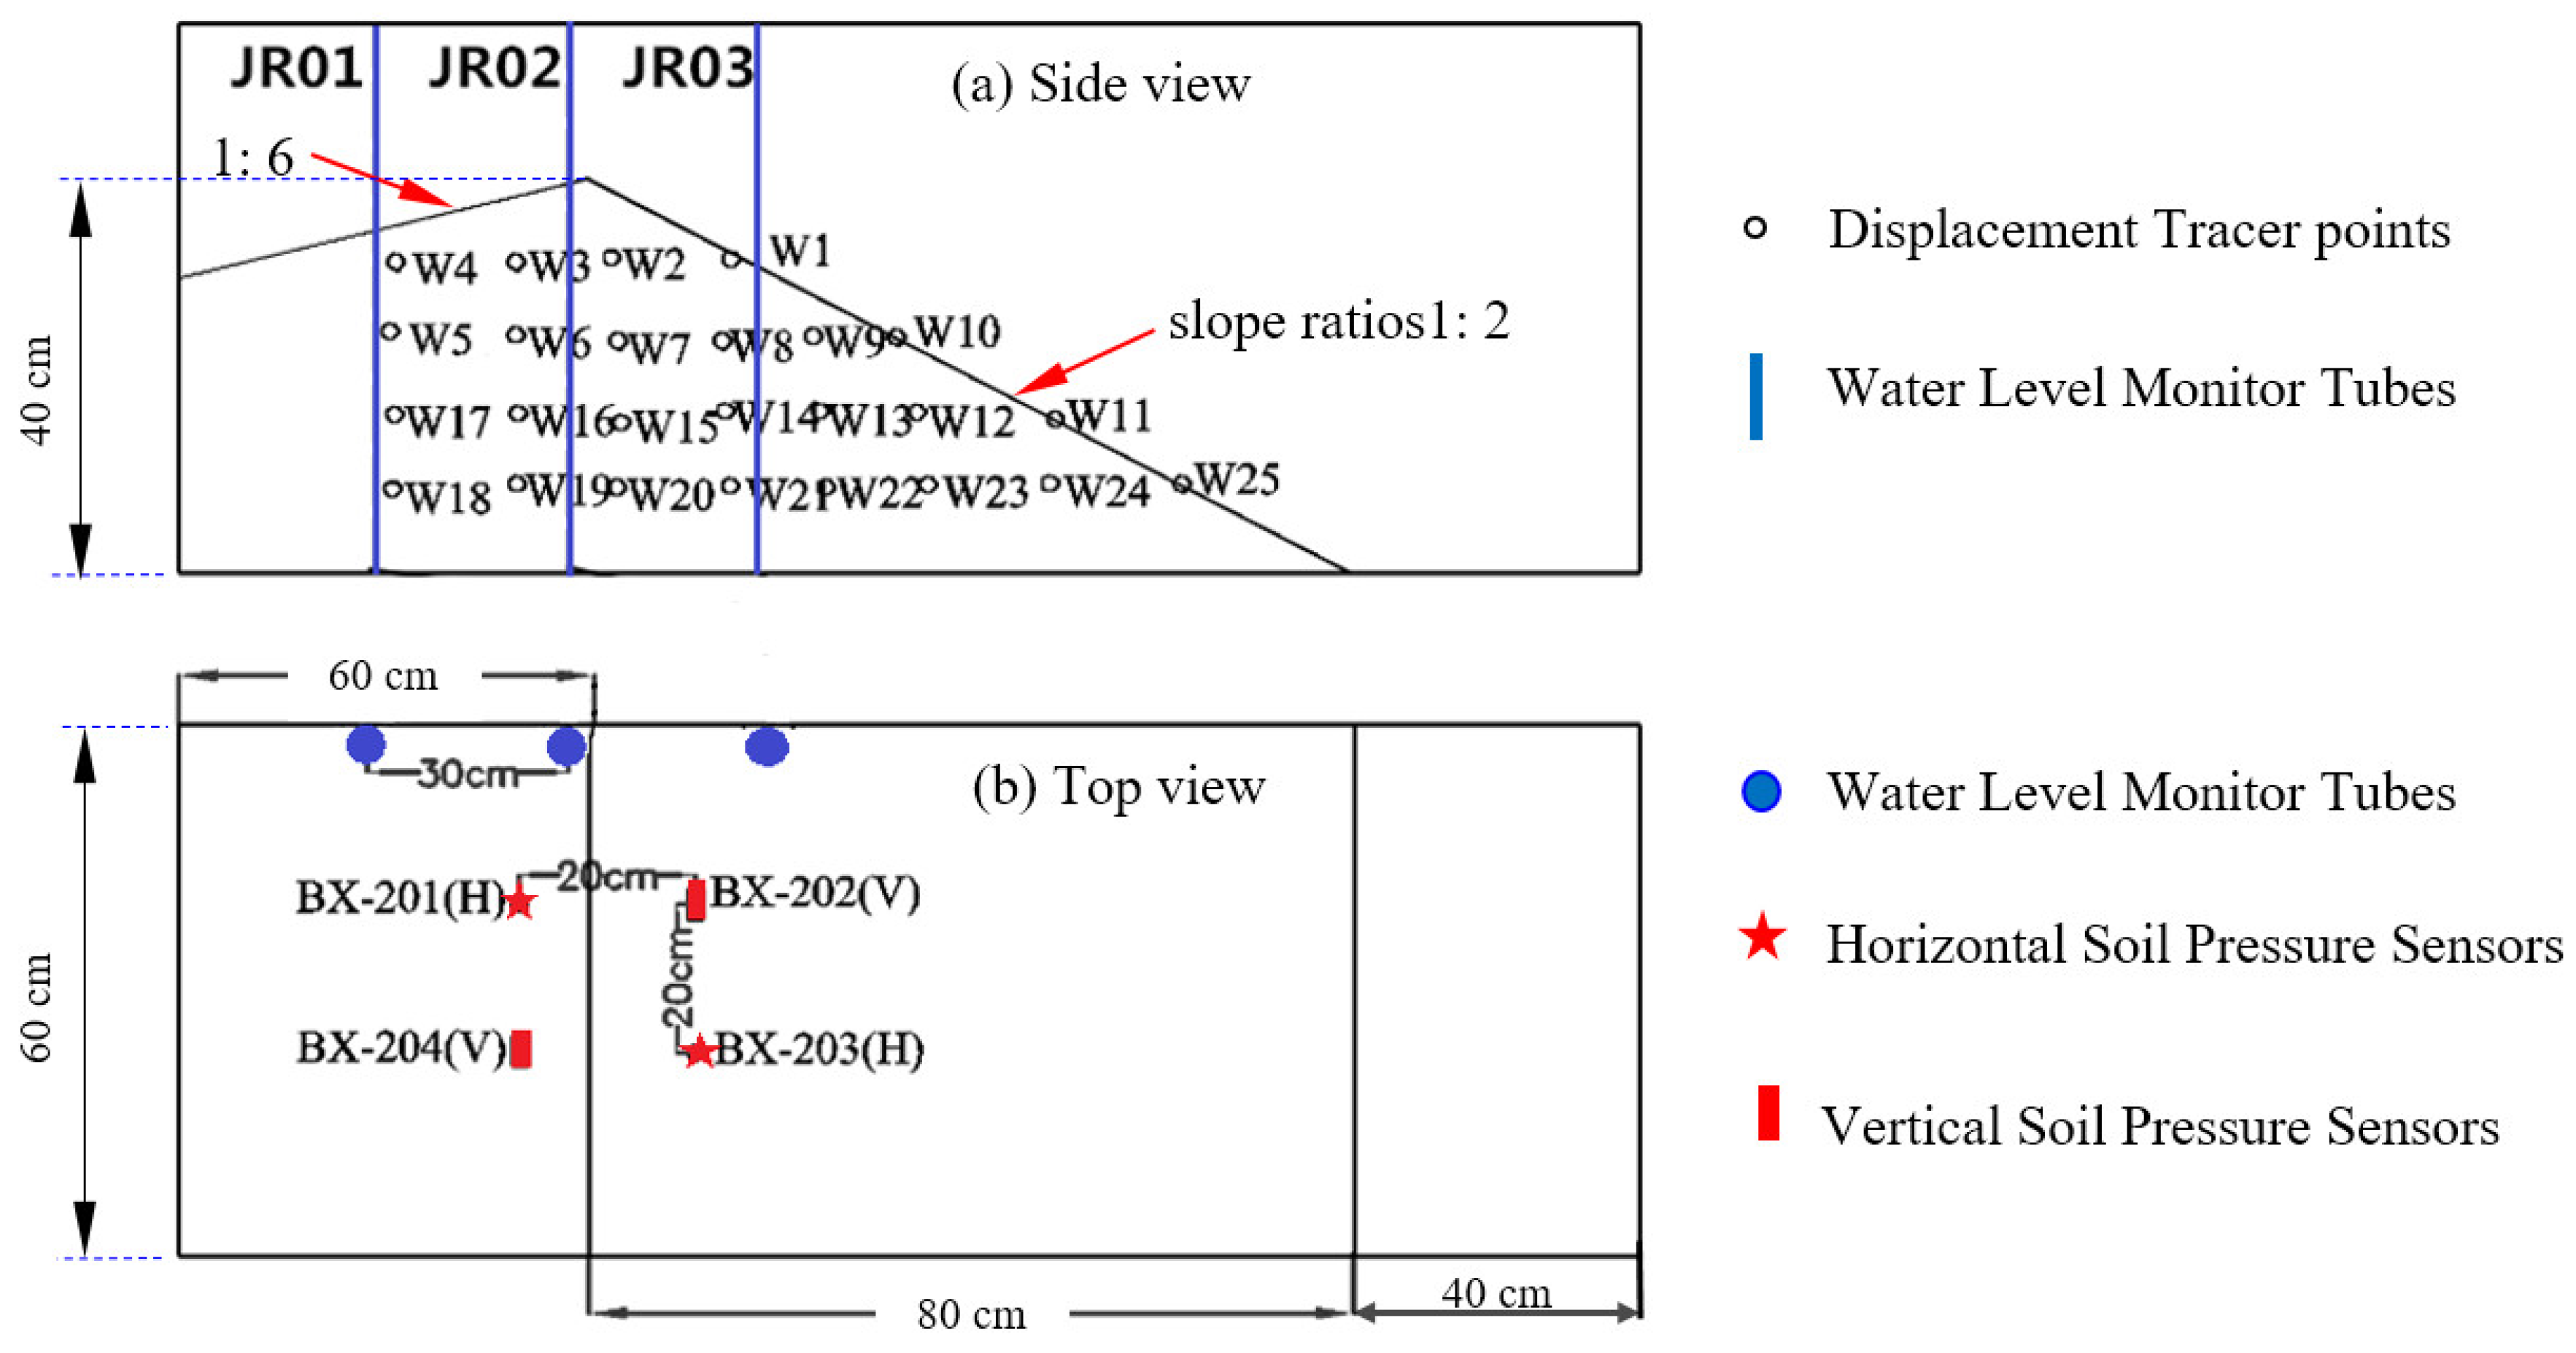
In order to measure the deformation of the dam, tracer points were located at the crest, the slope and the toe of the model tailings dam (Figure 2). Two soil pressure sensors (BX-202, BX-203, Dandong Electronic Instrument Factory, Dandong, China) were installed in the middle of the dam slope at a depth of 20 cm to measure the stress of the tailings in the dam, and two other soil pressure sensors (BX-201, BX-204) were installed 20 cm horizontally away from BX-202 and BX-203. BX-201 and BX-203 were placed horizontally while BX-202 and BX-204 were placed vertically, in order to measure the vertical and horizontal stresses, respectively (Figure 2). The soil pressure sensor had a dimension of Φ12 × 4.2 mm, and the measuring range is from 0 to 50 kPa. The model of dynamic strain tester is TST3828EW (Jiangsu Test Electronic Equipment Manufacturing Co., Ltd., Jingjiang, China), the maximum sampling frequency is 1 kHz, and the A/D (Analog to Digital) conversion resolution of dynamic strain tester is 24 bits. All of these equipment were calibrated before their placement in the tailings dam. The model dam was a 1.4 m × 0.6 m × 0.4 m upstream dam with an upstream slope ratio of 1:6 and a downstream slope ratio of 1:2.
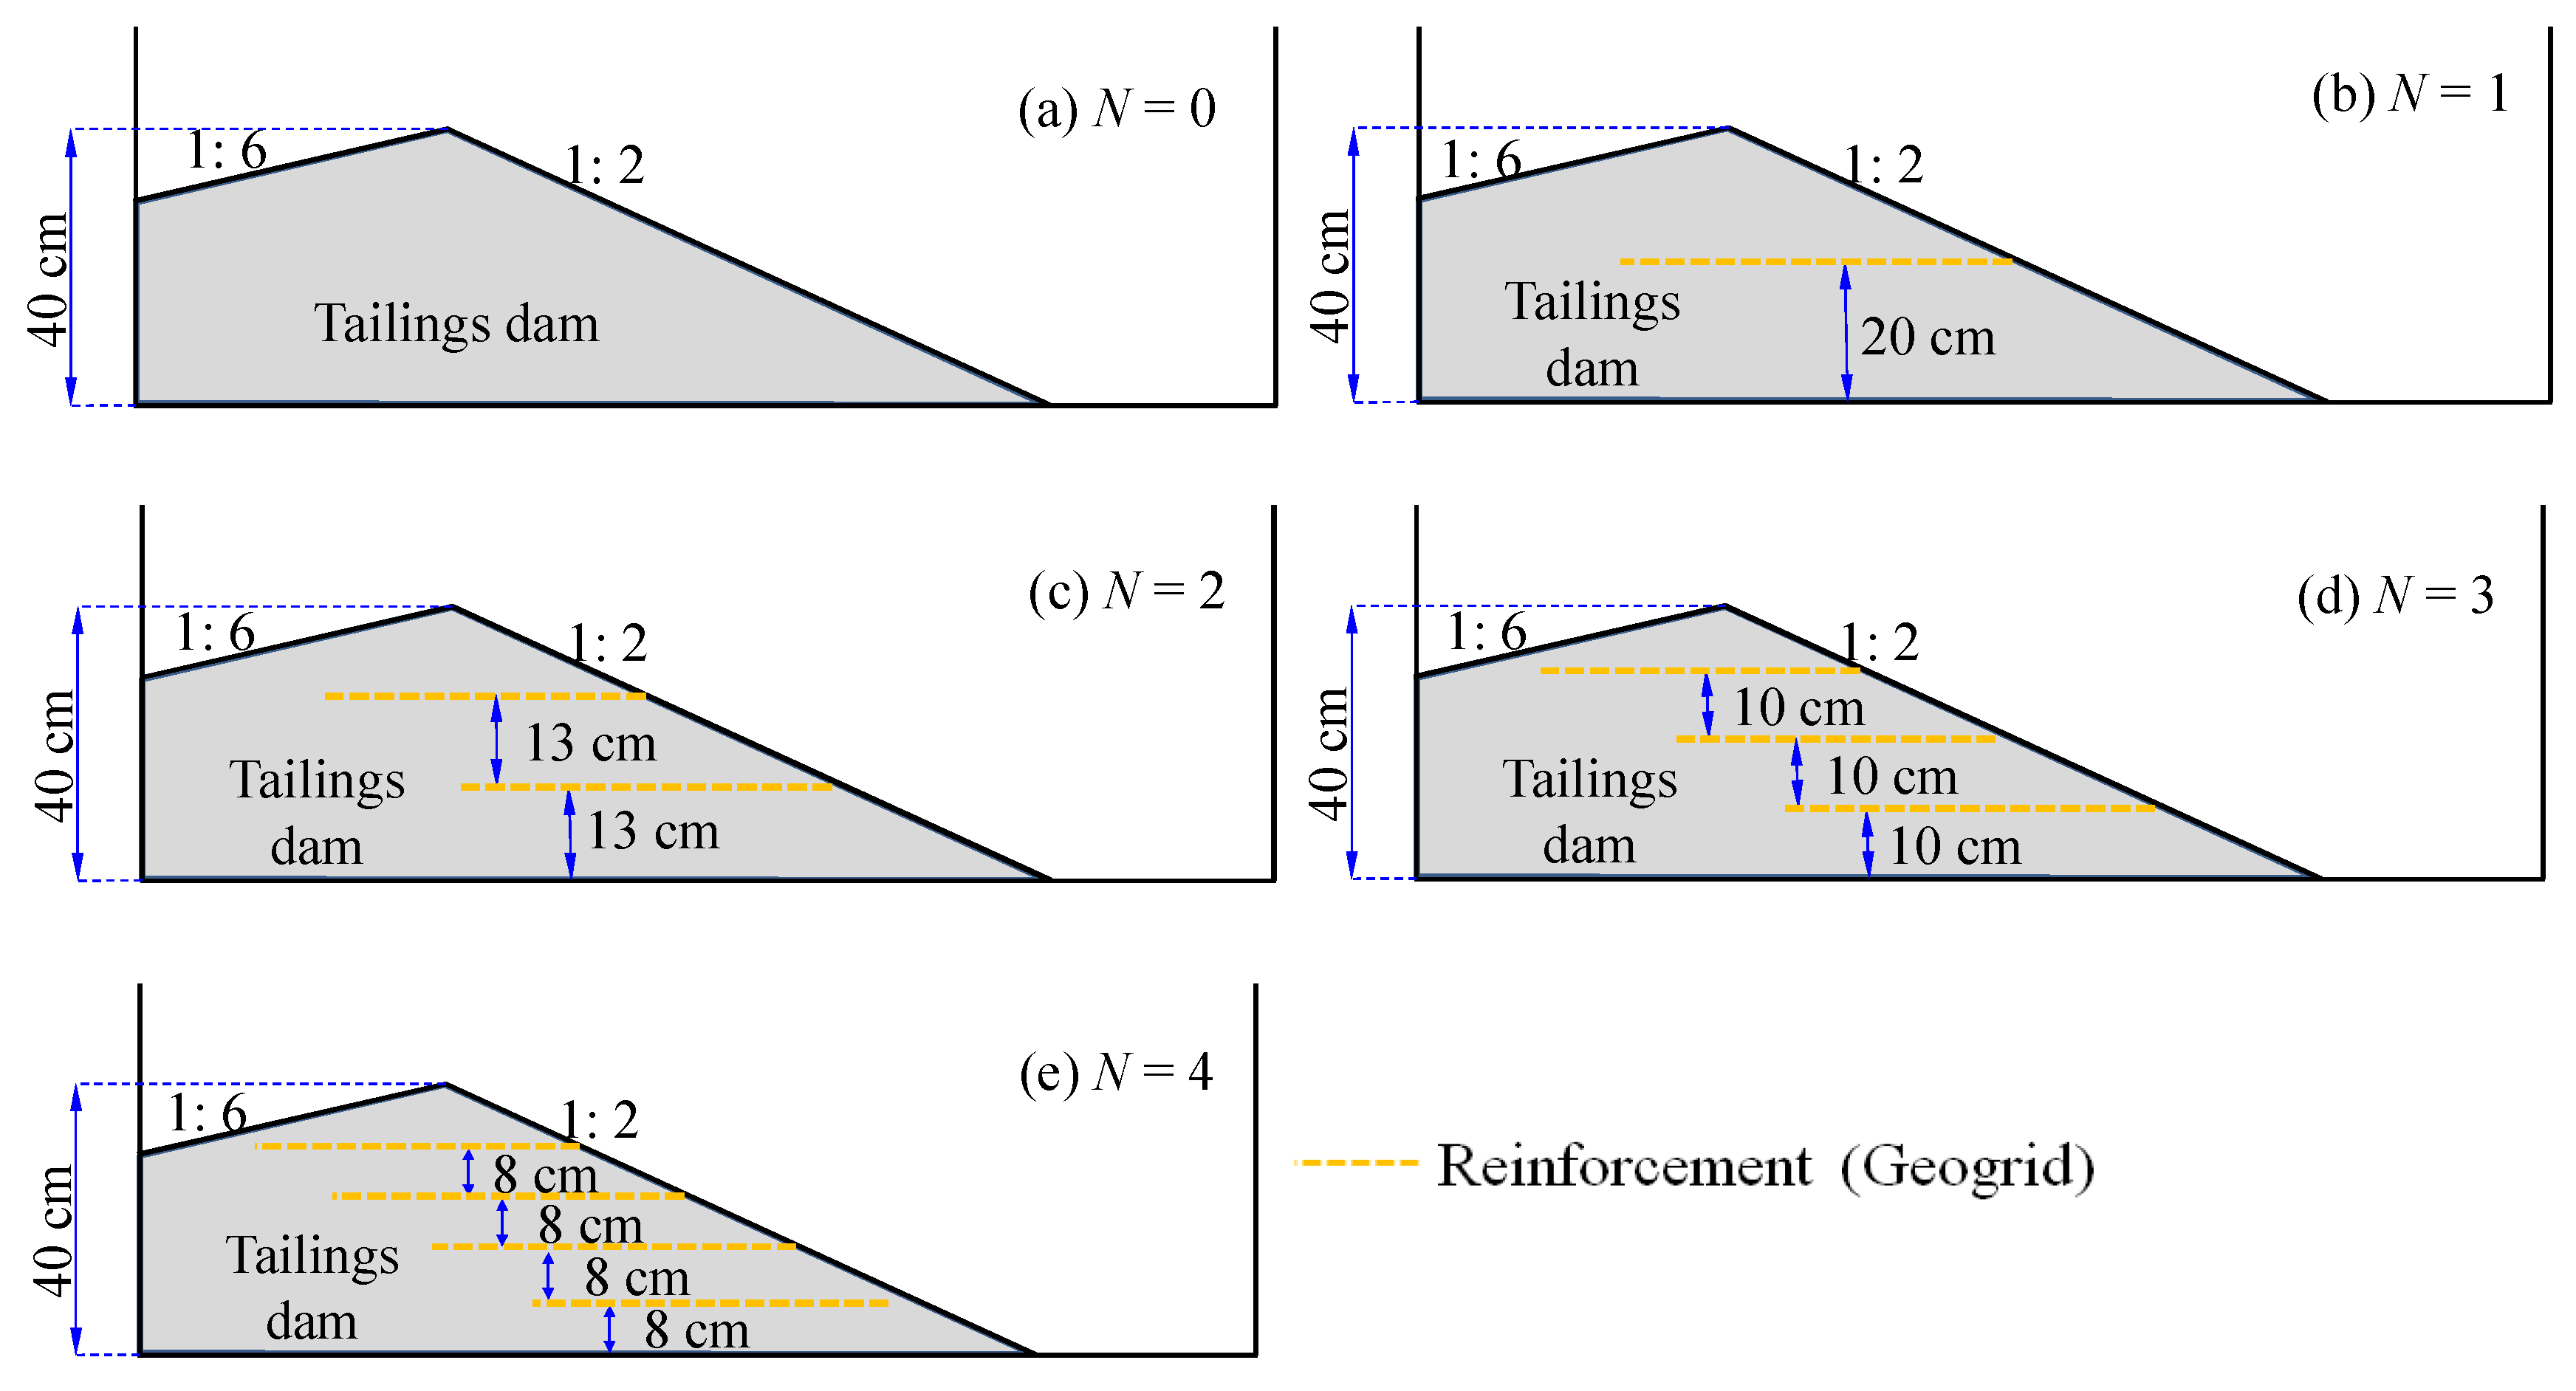
A series of dam overtopping tests were carried out with different reinforcement layers (reinforcement layers number N = 0, 1, 2, 3, 4; see Figure 3).
2.2. Experimental Materials and Procedures
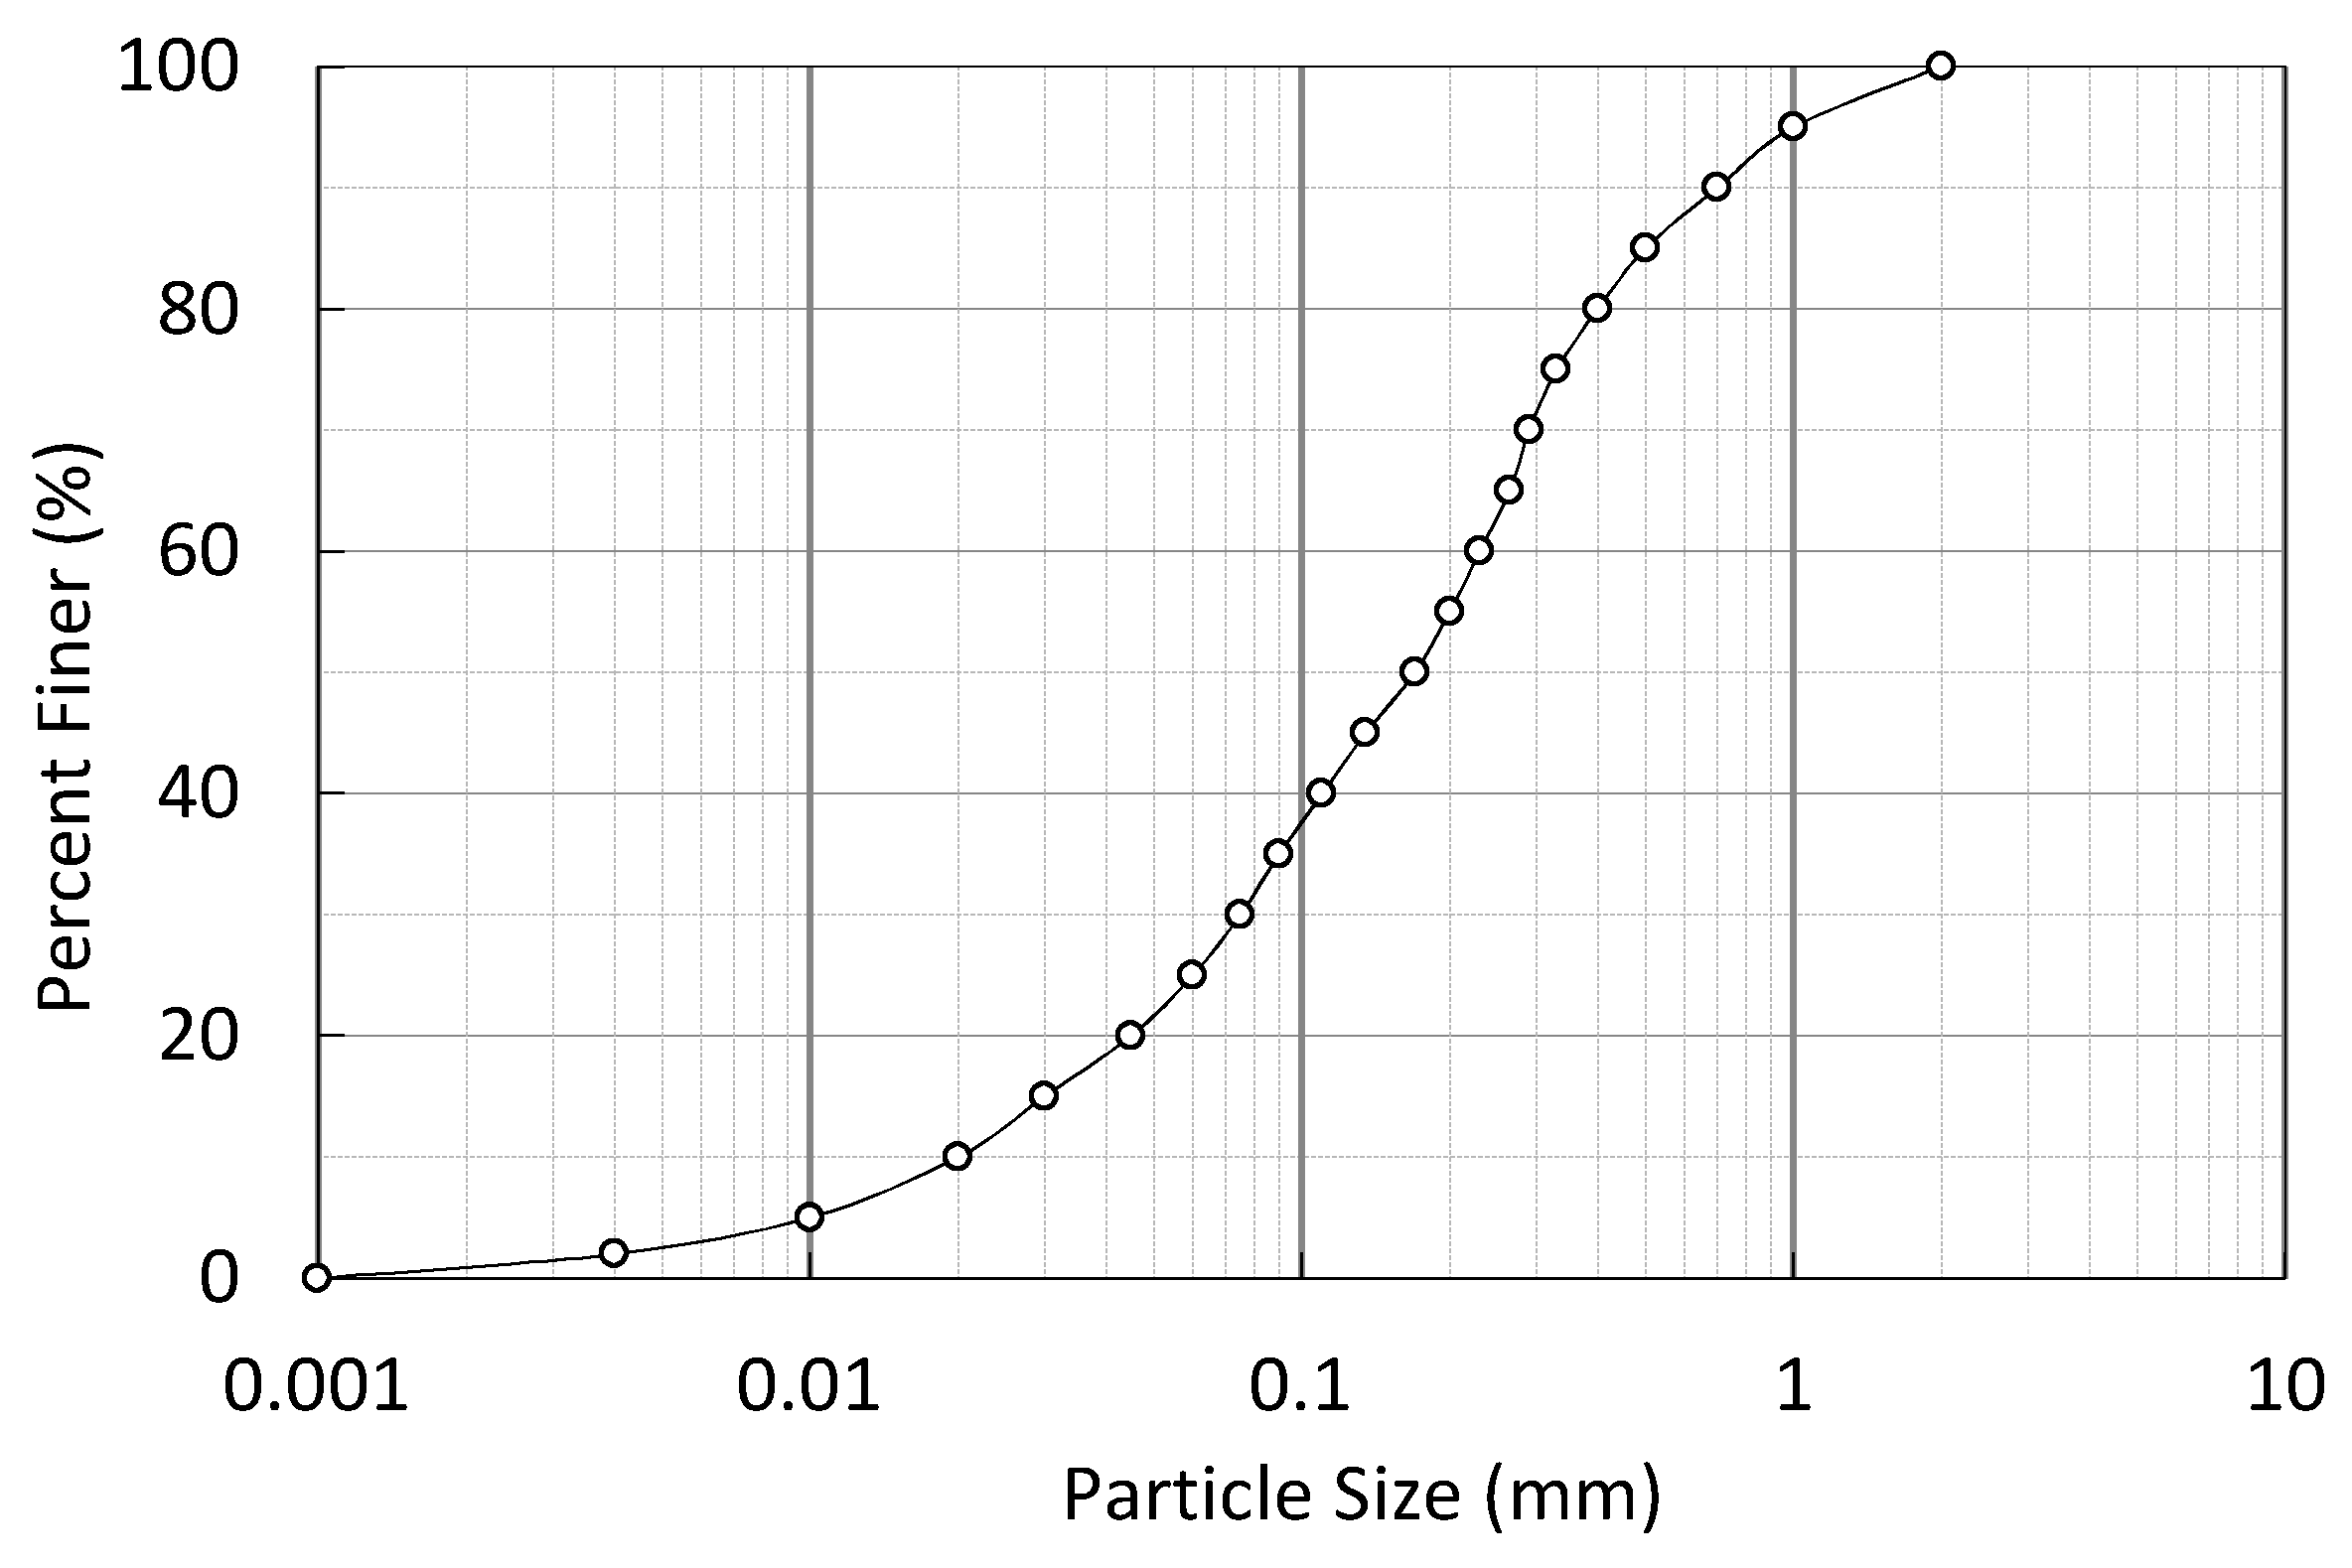
The copper tailings utilized in the all tests were extracted from a tailings disposal site located in Yunnan Province, China, being classified as medium sand approximately (code for design of tailings facilities. The particle mass percent with grain size greater than 0.25 mm is more than 50%; the tailings are classified as medium sand.) The copper tailings particle size distribution was shown in Figure 4, and the characterization test by Standard for soil test method and results were presented in Table 2.
According to the similarity theory, the tailings dam model should be built first, and all the sensors and geo-grid should be installed completely. Then, through the rainfall system to pump water into the flood control area until the beach length reached 10 cm (as well as local beach length 40 m , the rainfall intensity was 80 mm/day, which was as well as the local of Yunnan Province, China. While the water had saturated the beach and the dam, the current phreatic level was measured until the phreatic level was stabilized. Finally, it rained again until the tailings dam model flood overtopping failure happened.
The dam displacements, internal stress of the dam, phreatic level and erosion of the dam were recorded by the sensors introduced above.
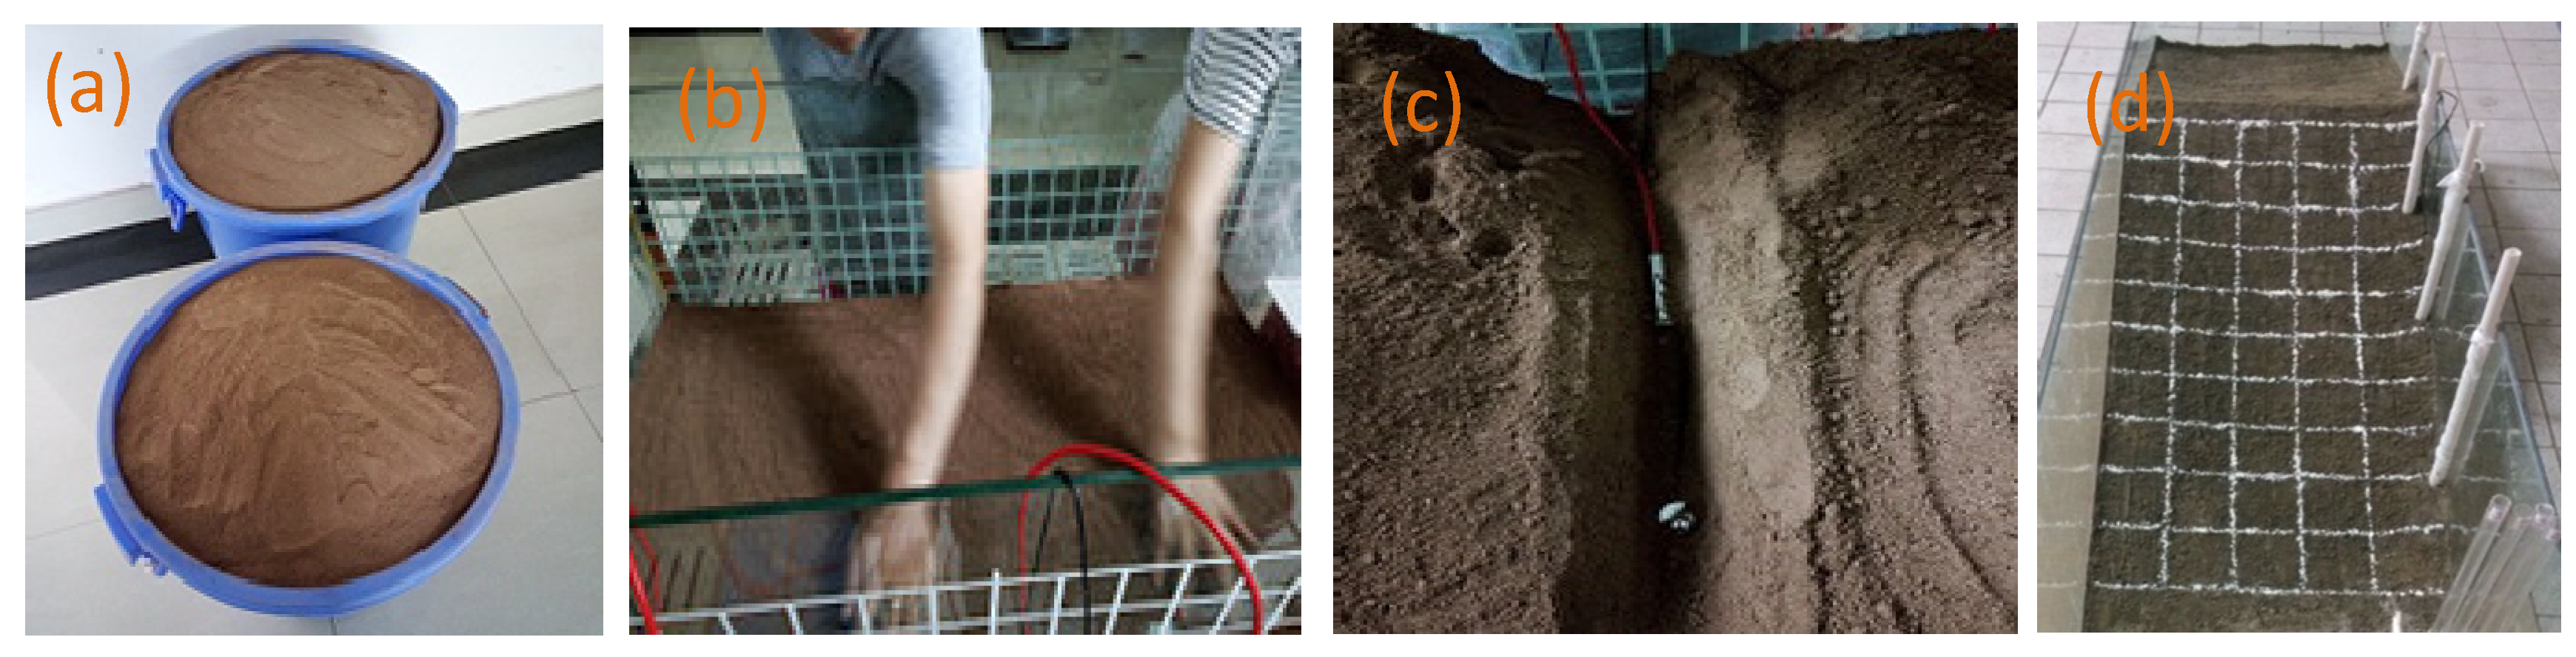
All the detail procedures of tailings dam construction were listed as below:
- The tailings with 10% water content were prepared according to the test requirements (as shown in Figure 5a).
- Layer compaction method for construction tailings dam, each layer was 8 cm, the compactness of each layer is 85% (as shown in Figure 5b).
- Lay down the reinforcement and sensors (as shown in Figure 5c).
- The displacement monitoring mark were placed on the side of the dam every 10 cm according to the drawn grid lines (as shown in Figure 5d).
- Install the camera, and calibrate these equipment after their placement in the tailings dam.
3. Results and Discussion
3.1. Reinforcement Density on Dam Displacement
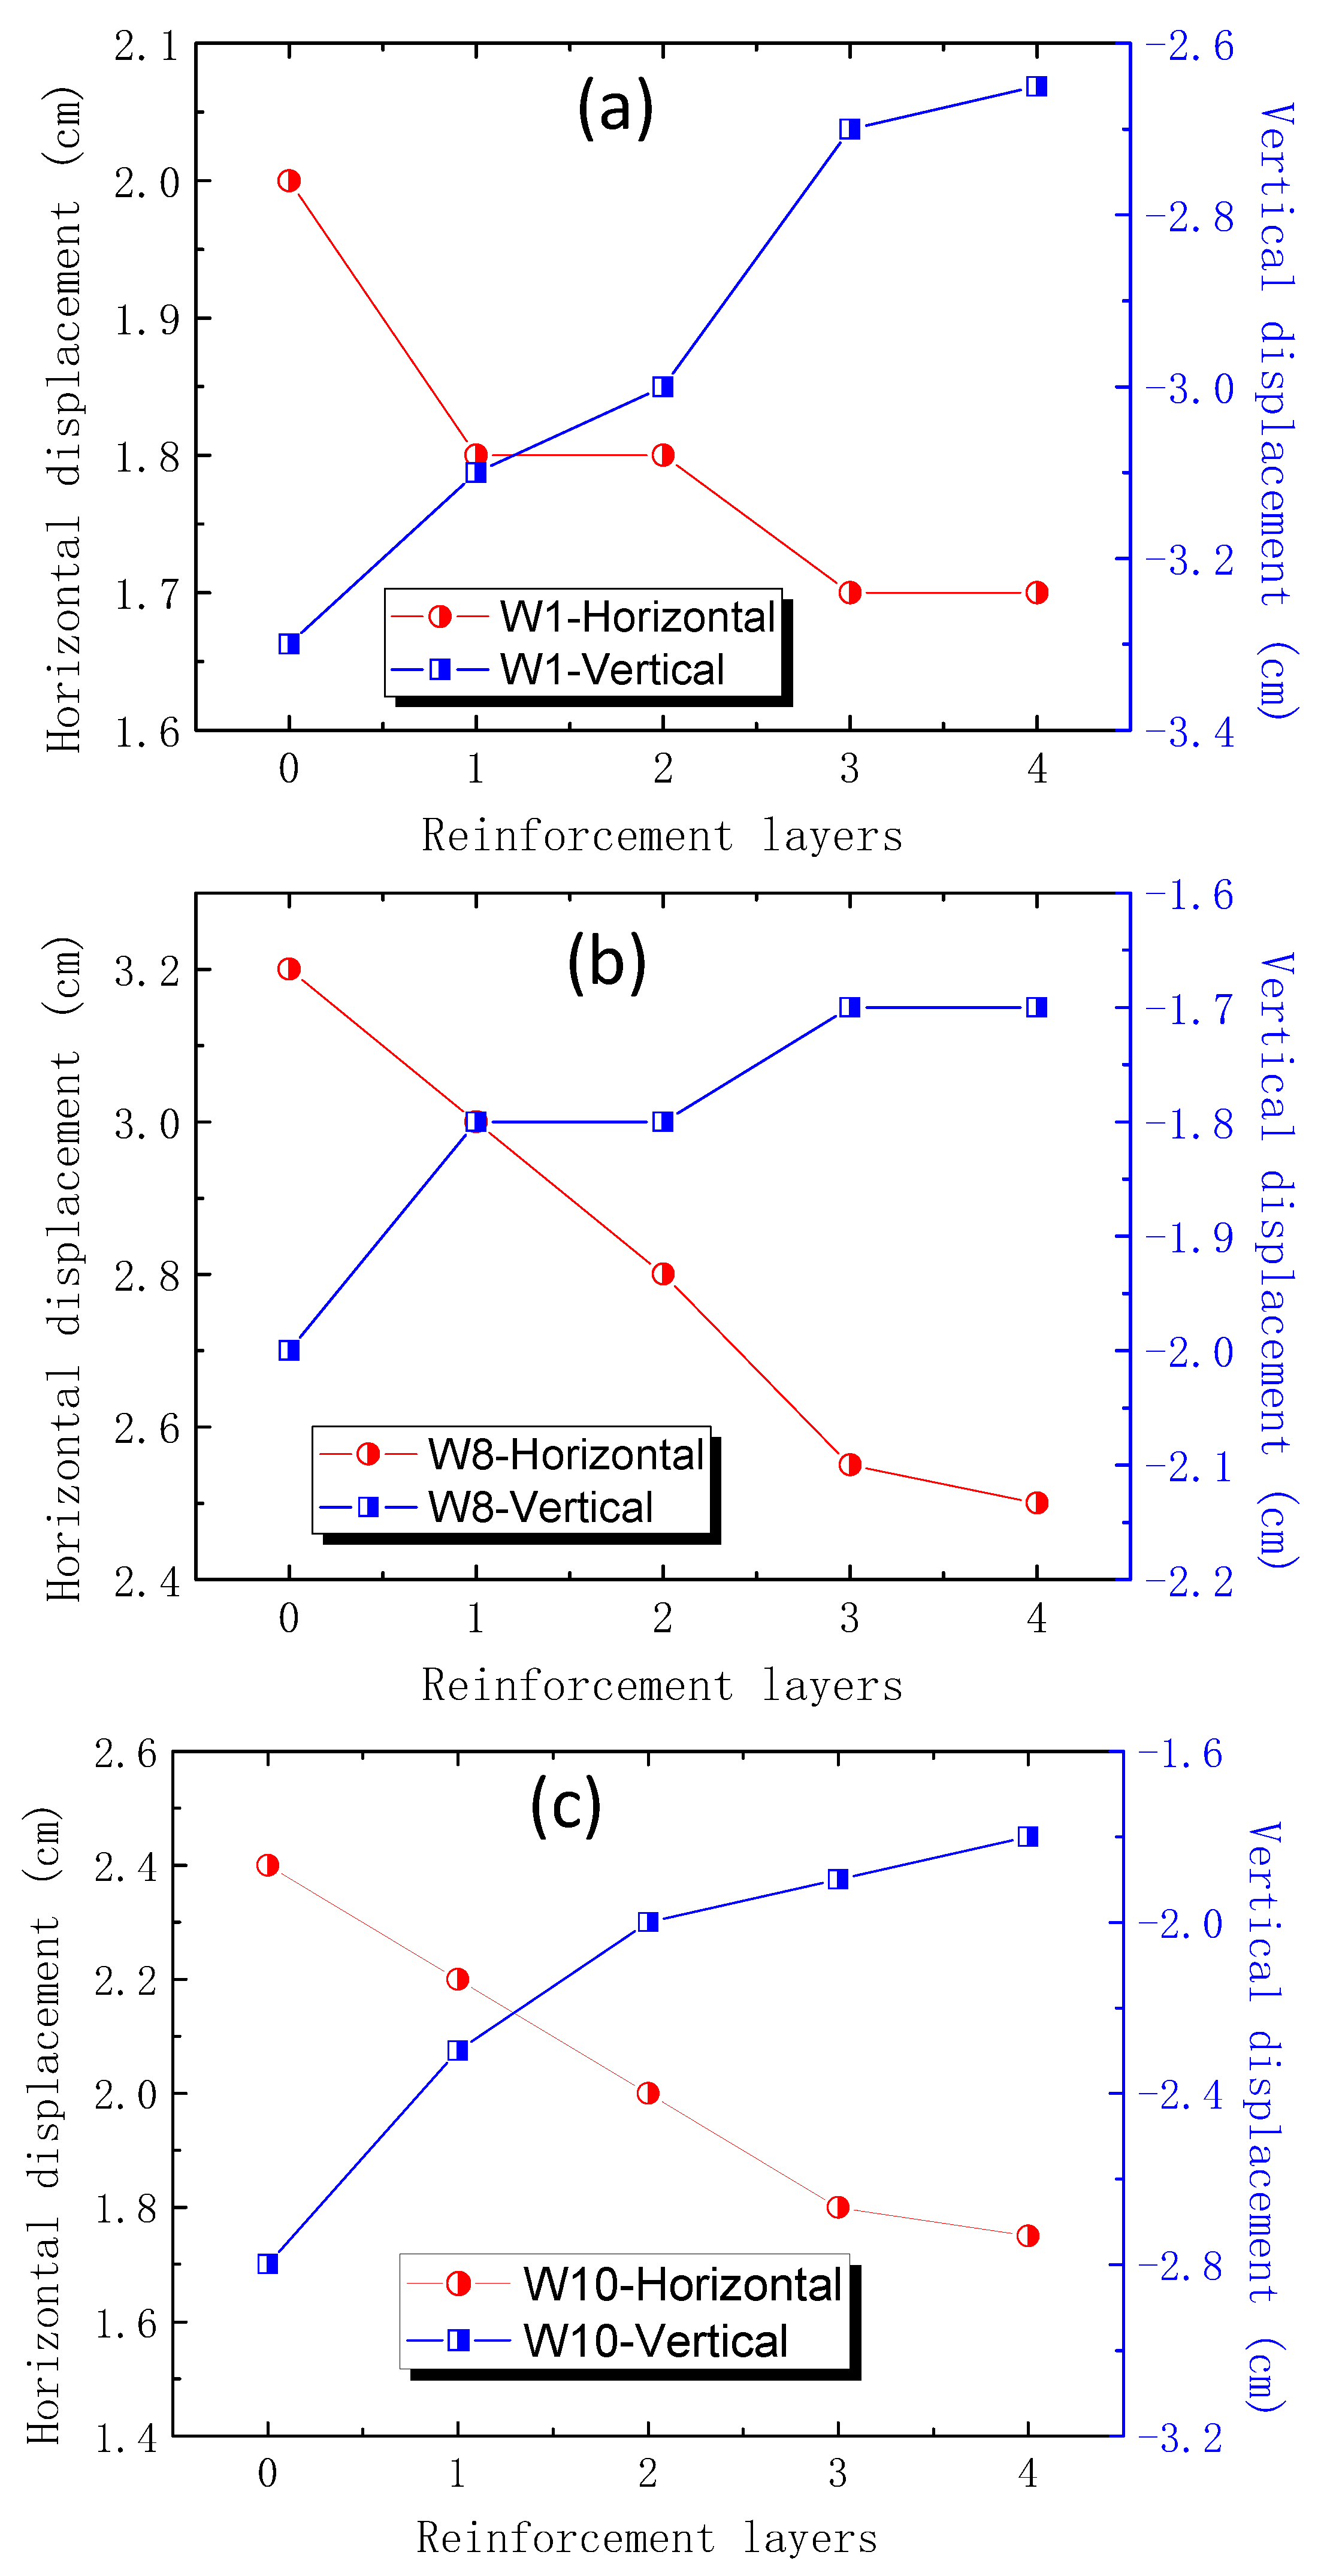
To analyze the displacement of the tailings dam during overtopping, the displacement of the key tracer points W1, W8, W10 were recorded throughout the test. For the number of different reinforcement layers (N = 0, 1, 2, 3, 4), the final vertical and horizontal displacement were plotted in Figure 6.
It was shown that, as the number of reinforcement layers increased, the final displacement of W1, W8, and W10 reduced significantly. The main reason was that reinforcement layers could combine tailings together and enhance the strength of tailings dam. With the increase of the number of reinforcement (geo-grid) layers, the distance between geo-grid layers decreased and the interaction between two adjacent layers increased considerably, which effectively restrained the deformation of tailings dam.
3.2. Reinforcement Layers and Flooding Time on the Phreatic Level
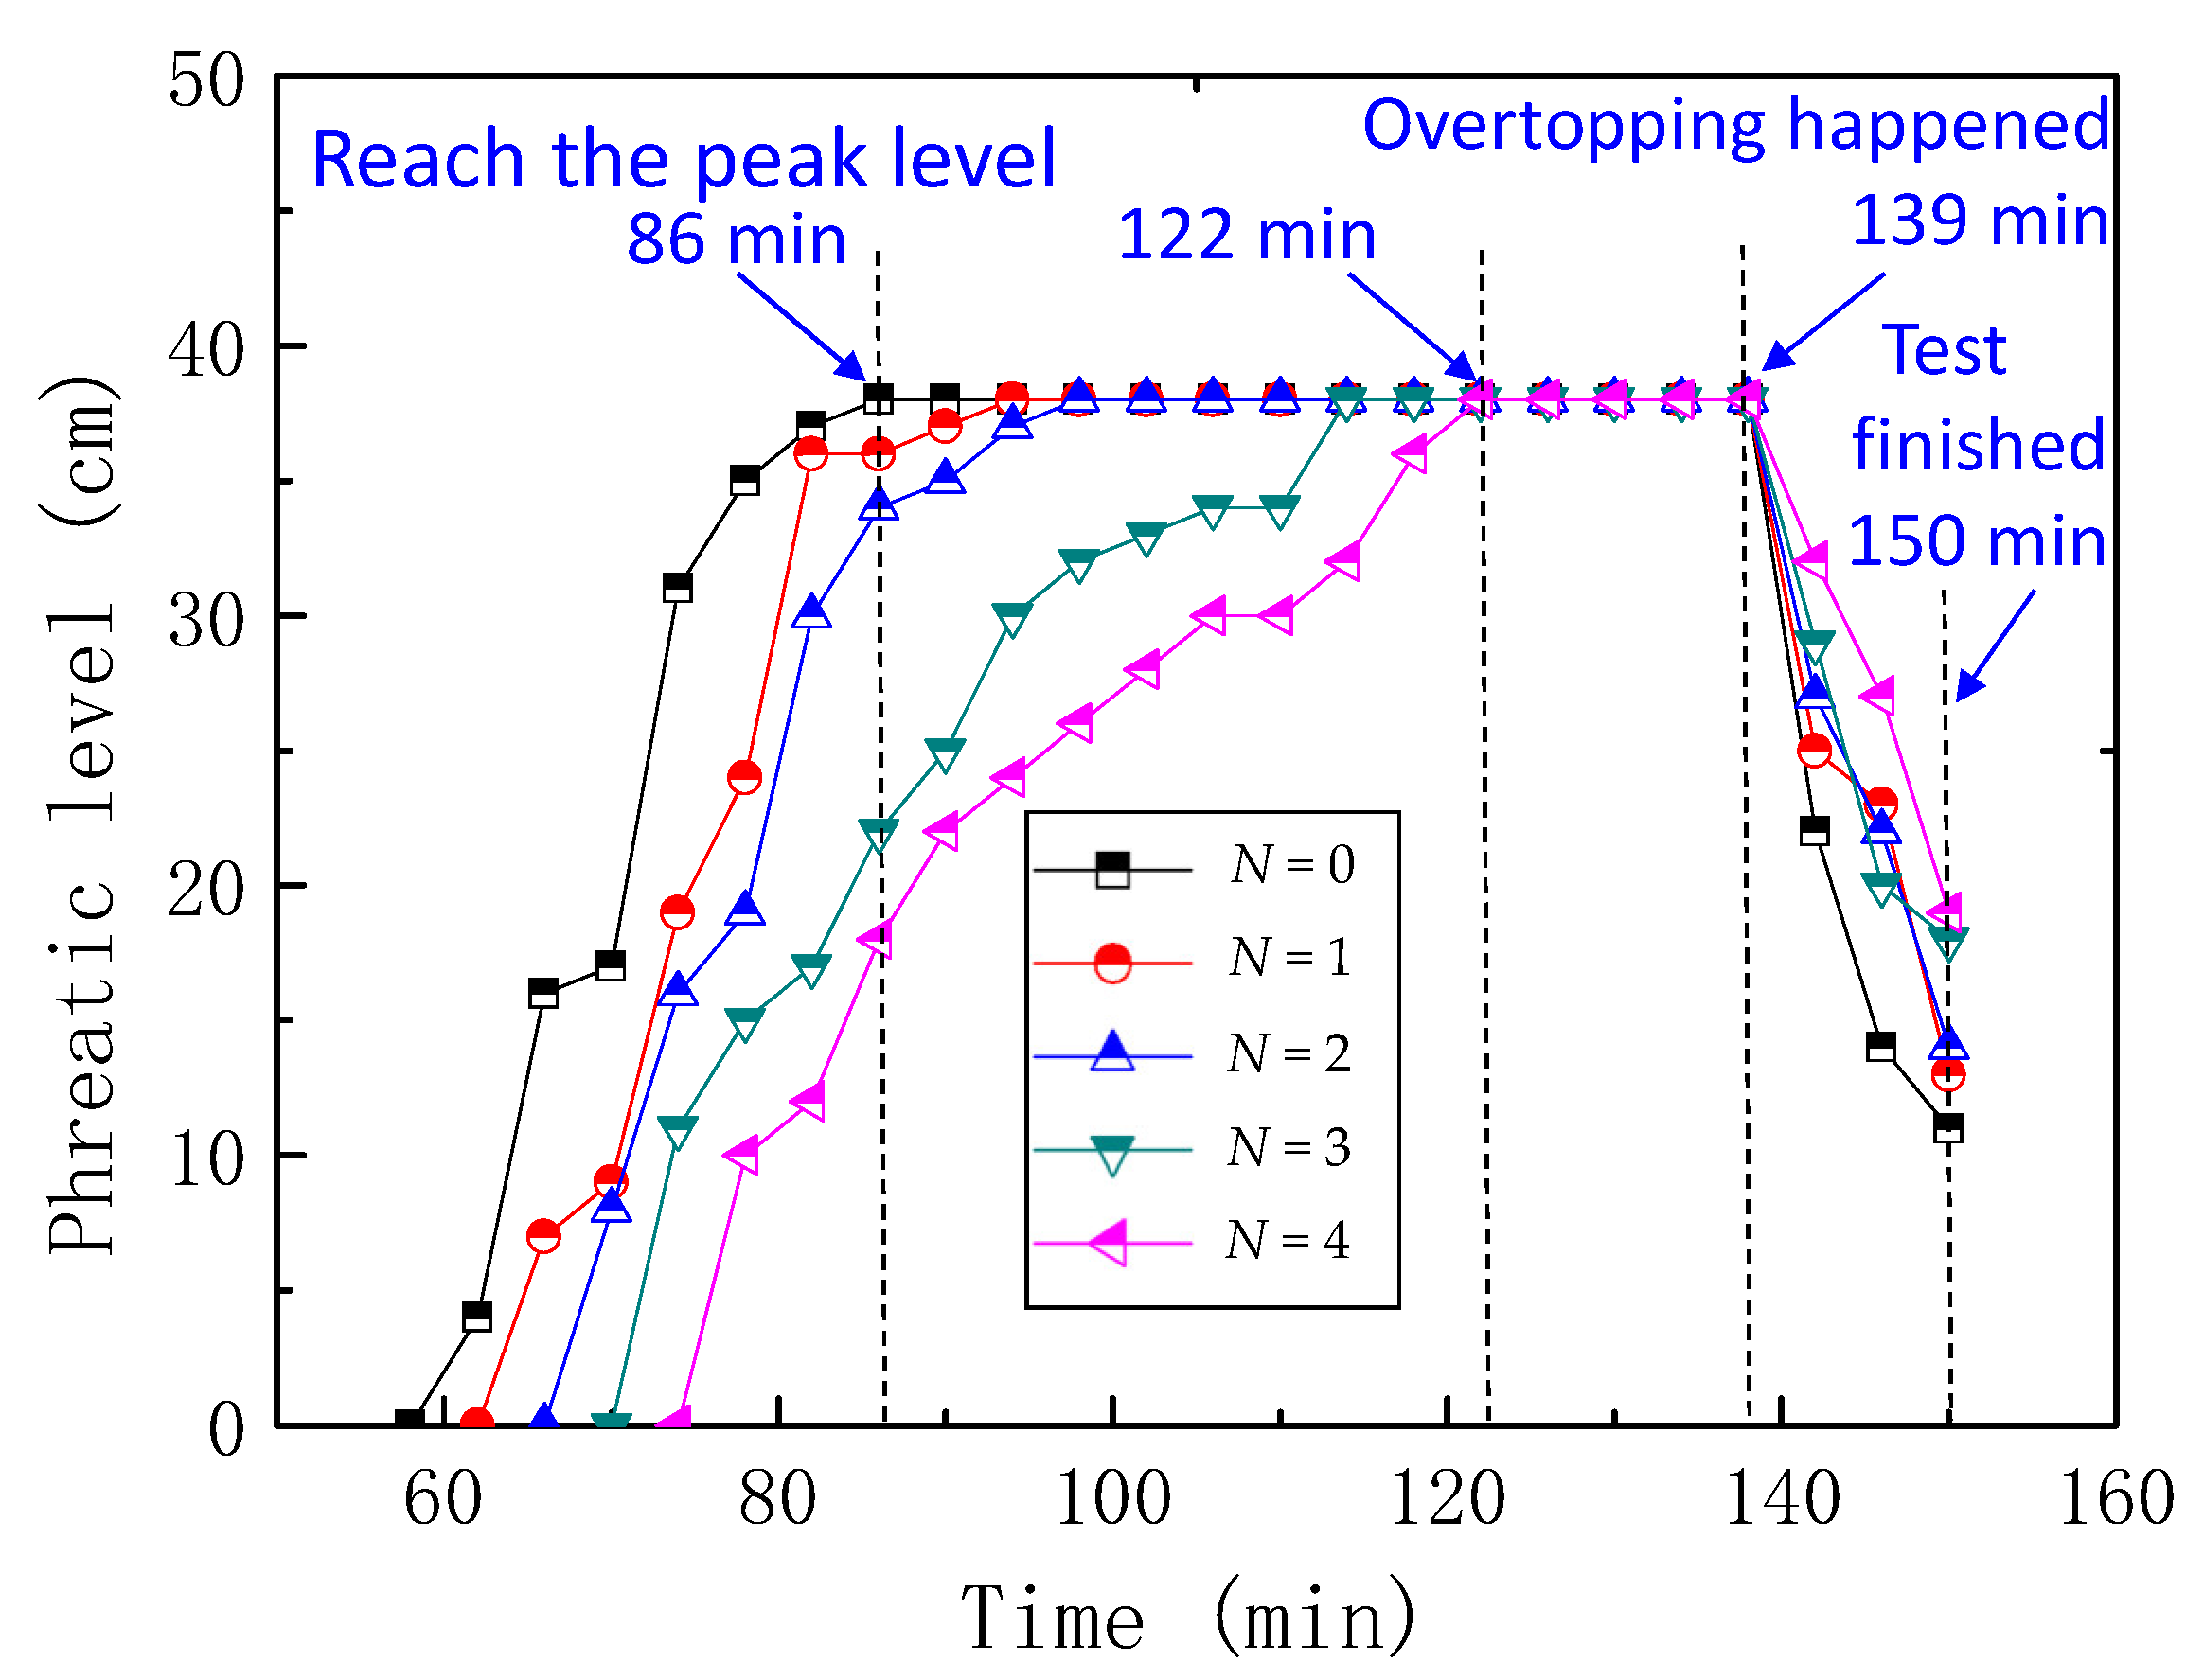
As the rainfall continued, the height of the phreatic level in the observation tubes was recorded at a time interval of 4 min. In order to analyze the influence of reinforcement layers on the height of the phreatic level in the observation tubes, the data of JR-01, JR-02 and JR-03 were collected. The phreatic level monitor tube JR-02 was located near the crest of the dam, which was the most representative to reflect the tailings dam phreatic level changes during overtopping.
The change of phreatic level from JR-02 was shown in Figure 7. The phreatic level rose as rainfall continued, but the rate of rise was slowing down with the increased number of reinforcement layers. Comparing to the dam without reinforcement, the peak of the phreatic level of the dam with four reinforcement layers delayed about 36 min. The main reason was that the fine tailings’ particles attached to the geotextile and formed a water impermeable layer in the dam, which impeded the rise of phreatic level.
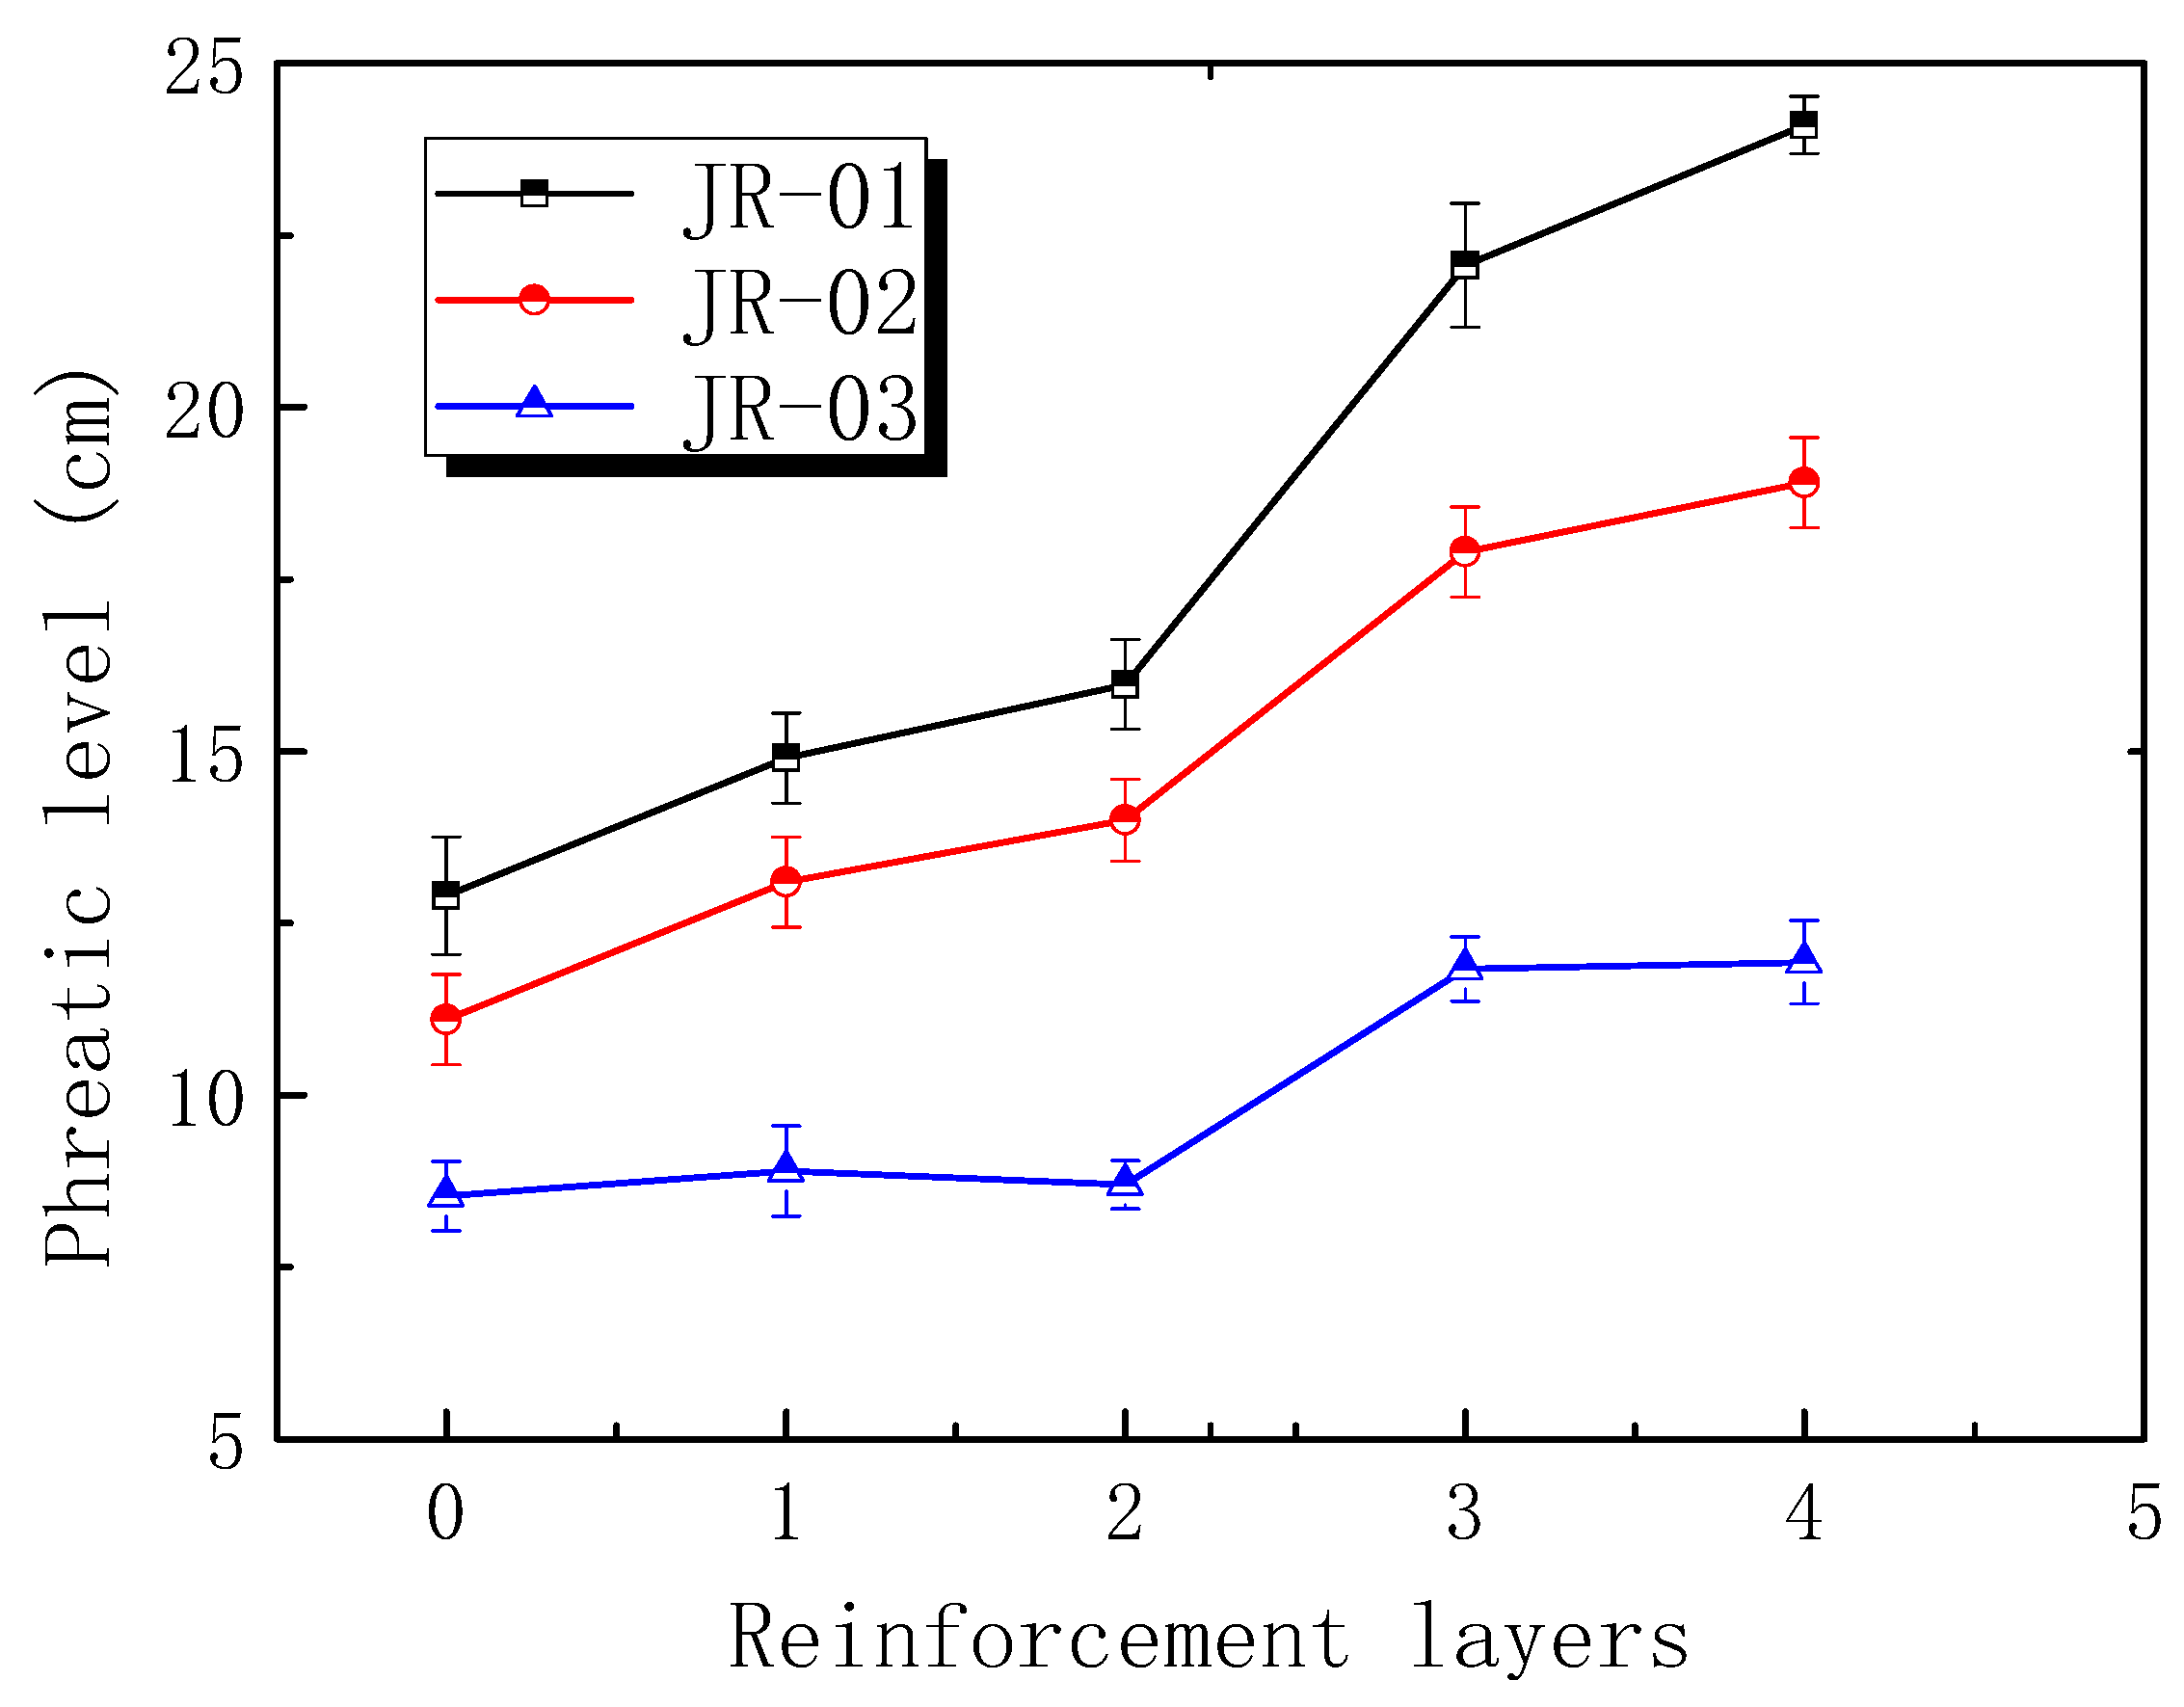
Tailings dam overtopping occurred at 139 min, and the phreatic level declined in the following 11 min until the water flowed out completely. Figure 8 displayed the final phreatic level of tailings dam with different reinforcement layers when overtopping was ended. It indicated that the final phreatic level was higher as the number of reinforcement layer increased. The main reason was that deformation during overtopping would reduce the height of tailings dam while the reinforcement layers effectively restrained the deformation. Hence, the more the reinforcements there were, the higher the dam was, which resulted in the ascent of the final phreatic level.
3.3. Stress Change during Overtopping
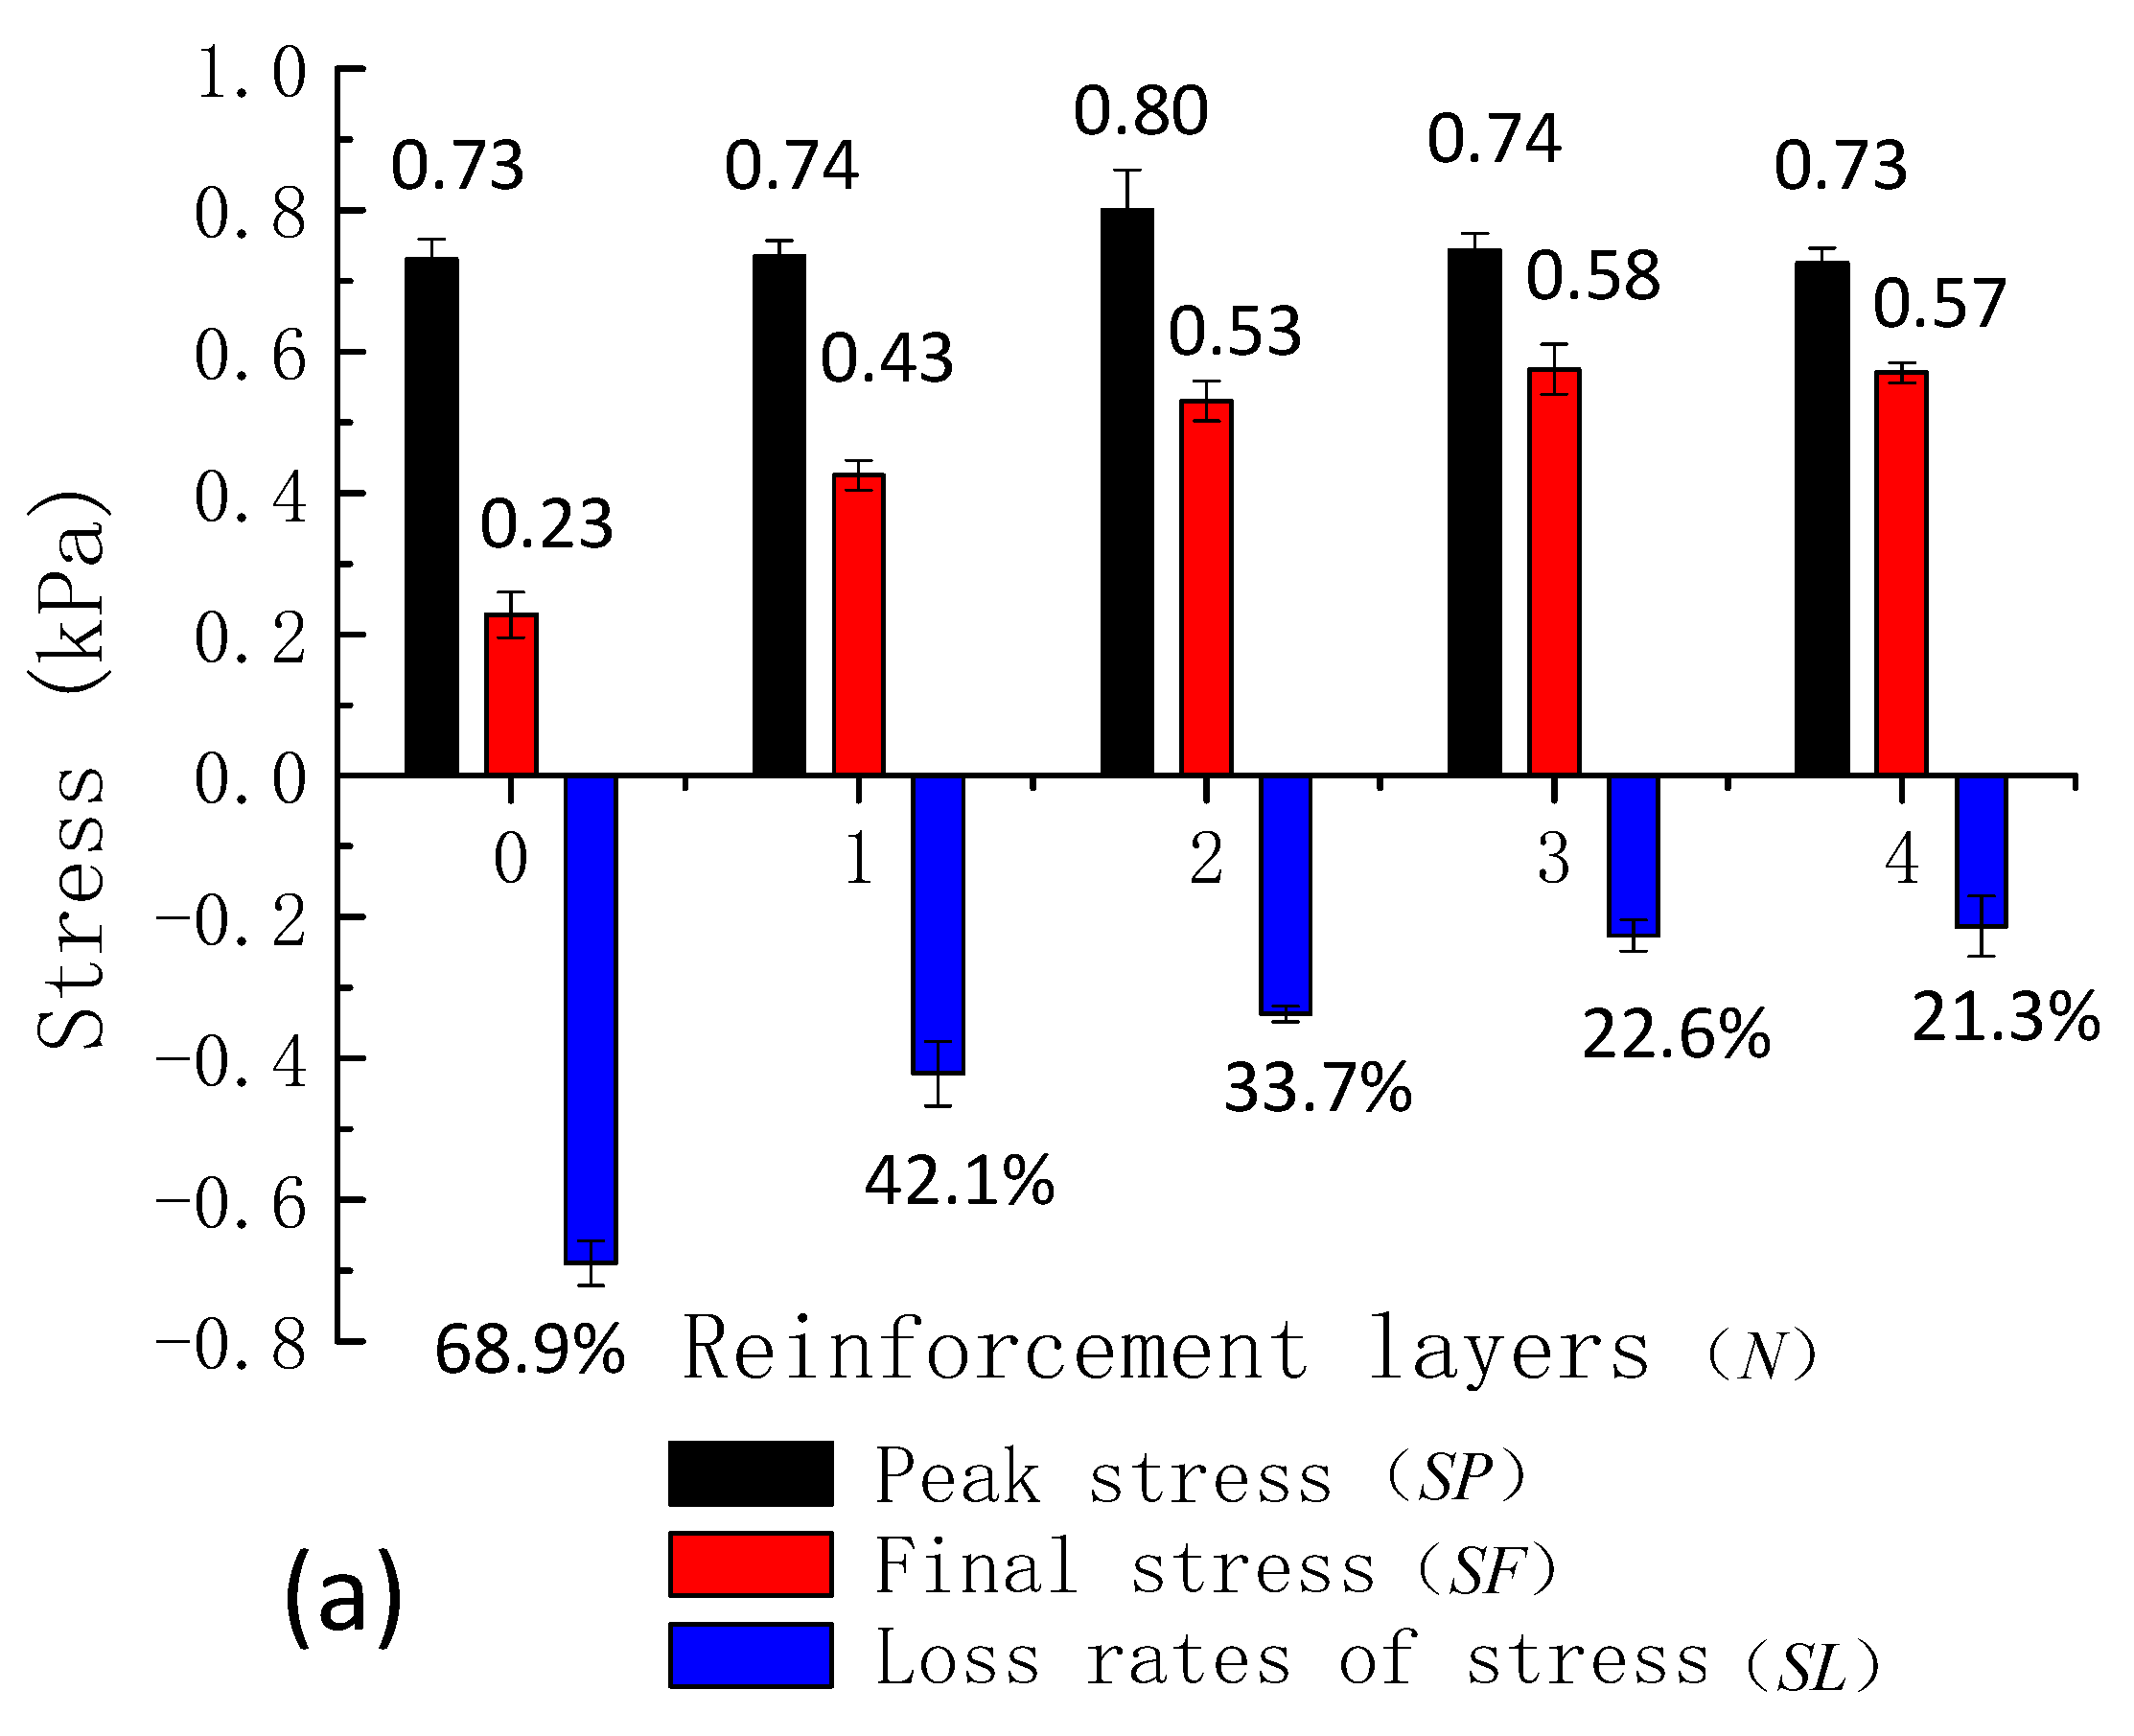
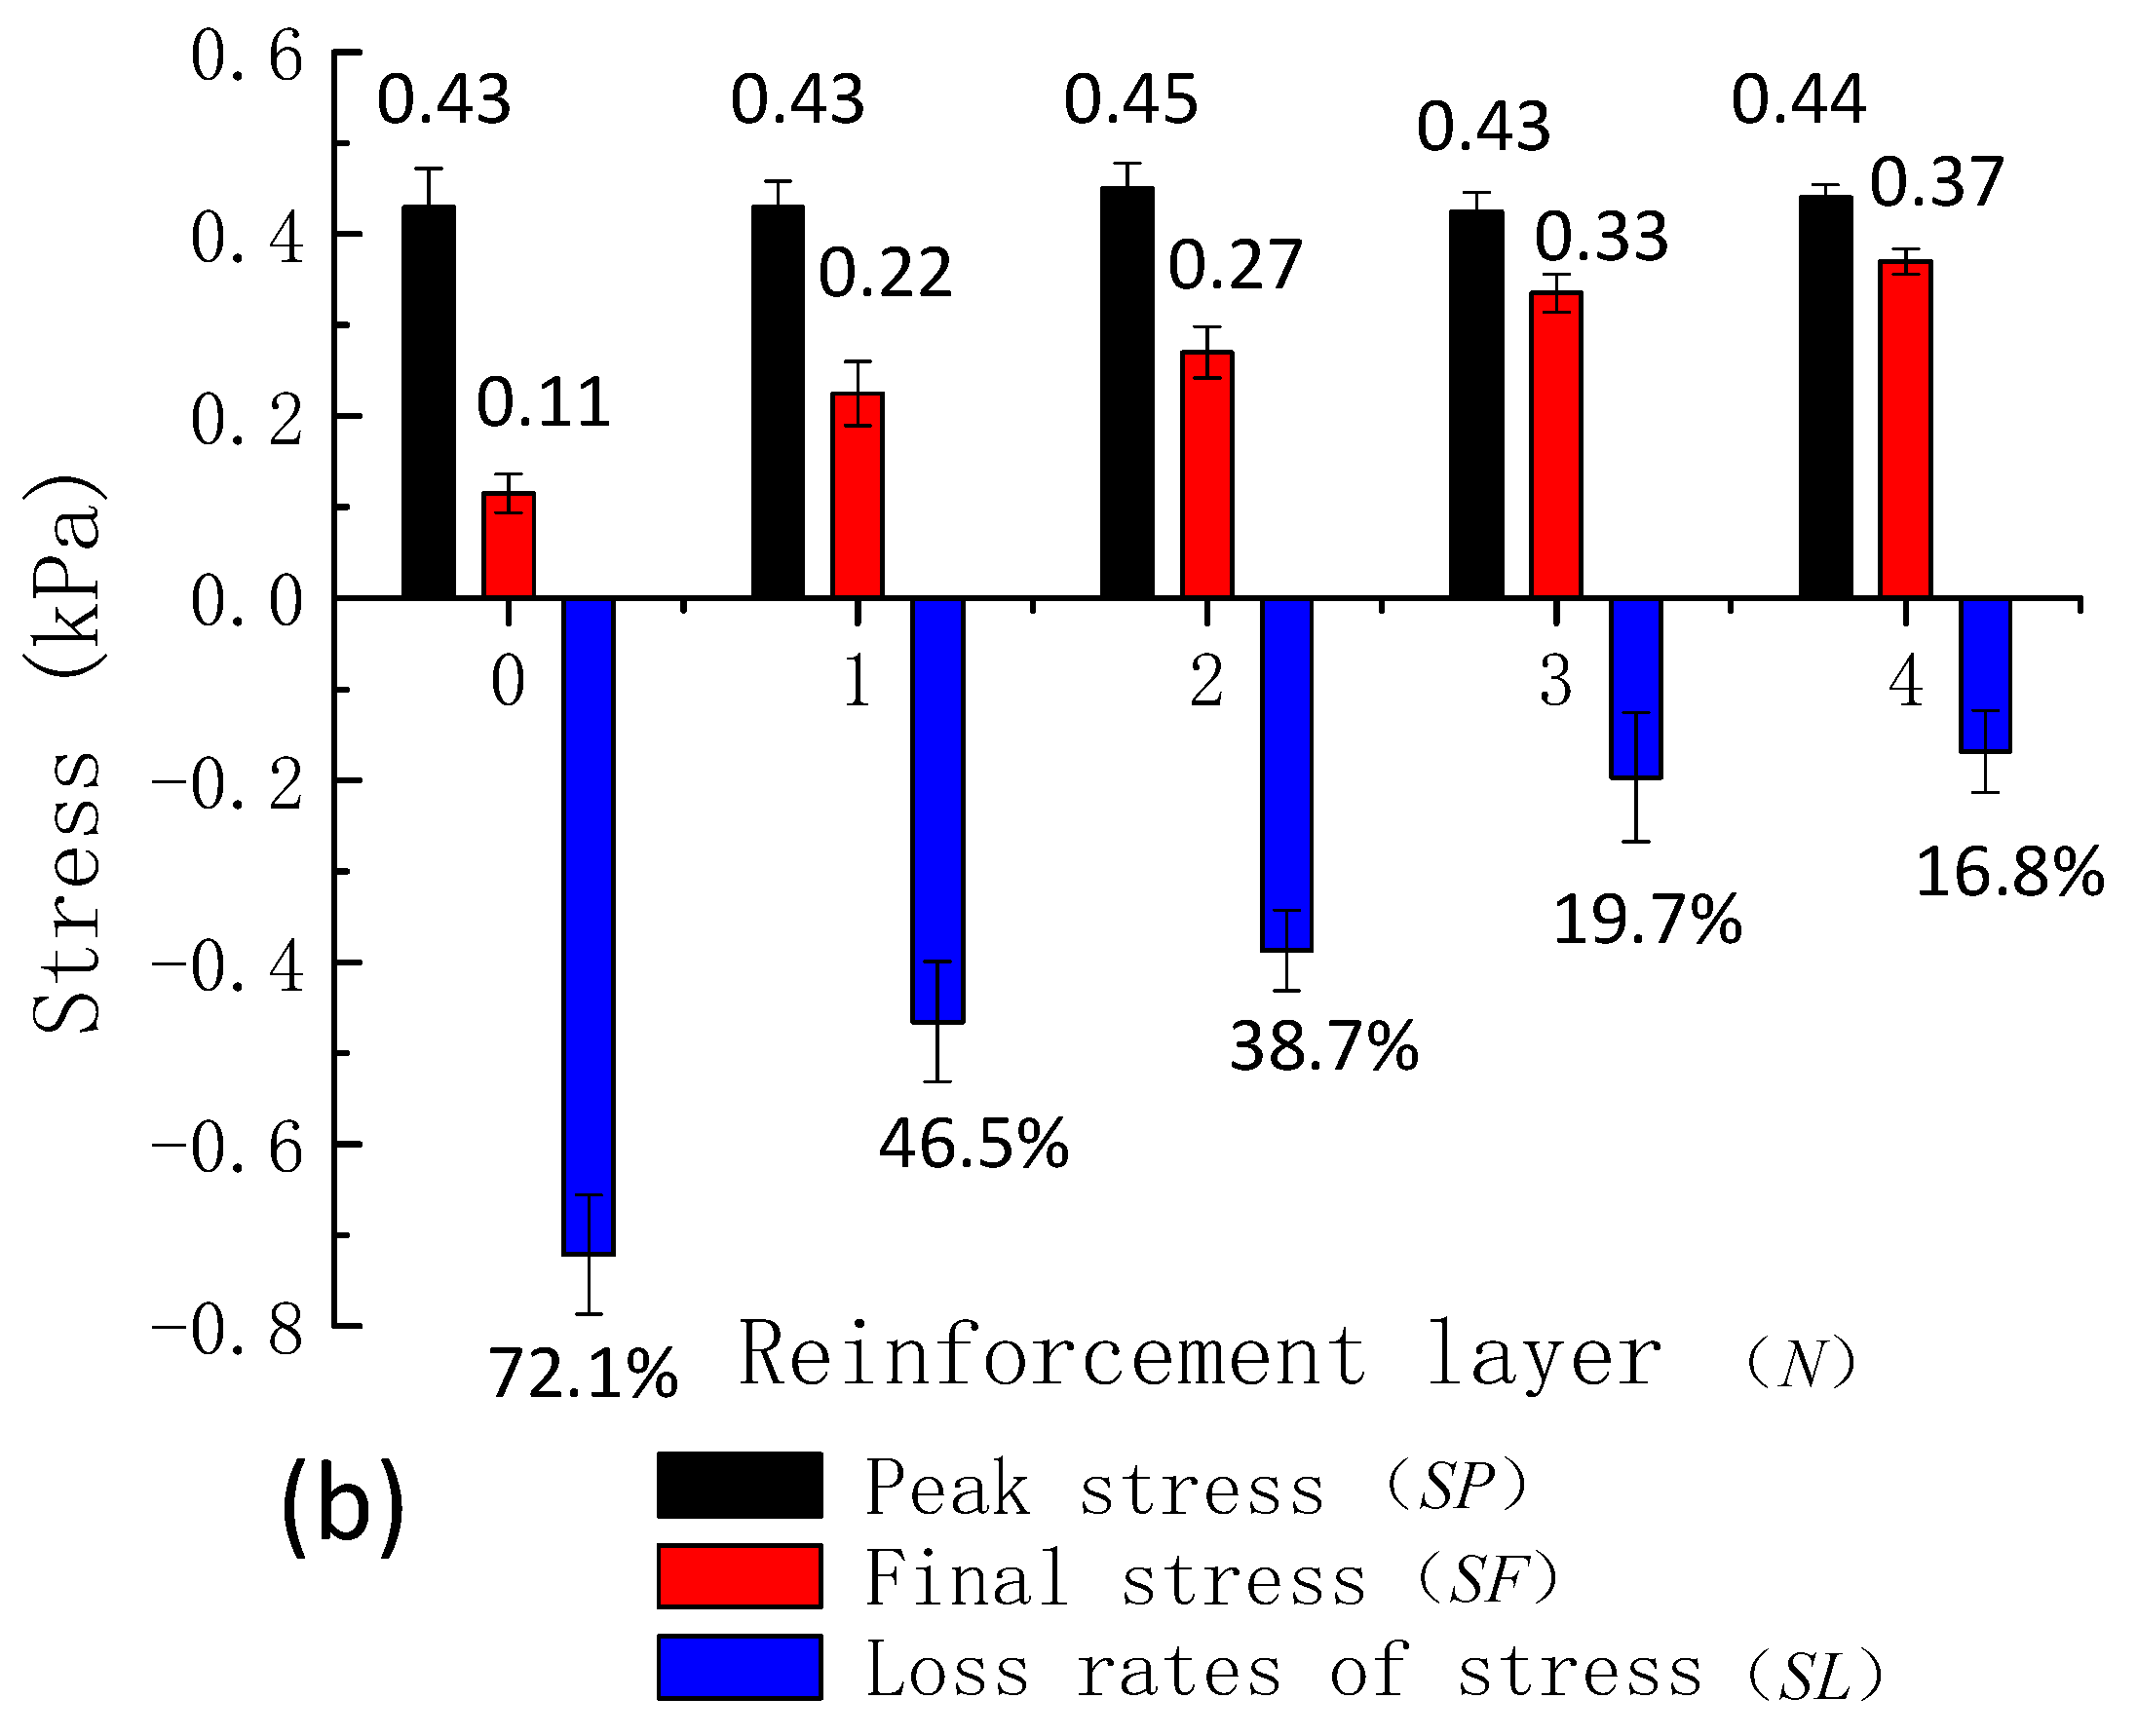
The internal stress of dam during overtopping was obtained by the sensors throughout the tests. When the phreatic level reached the peak, the internal stress of dam was measured as peak stress (SP). When the test finished, the internal stress of dam was measured as final stress (SF), and the loss rate of stress (SL) was calculated by Equation (1):
As shown in Figure 9, with the increase of the reinforcement layers, the SL of tailings dam gradually decreased. From the reading of sensor BX-201, the SP and SF (Figure 9a) without reinforcement were 0.73 kPa cm and 0.23 kPa, and the SL was 68.9%; the SP and SF with four reinforcement layers were 0.73 kPa cm and 0.57 kPa, and the SL was only 21.3%. Meanwhile, the data from sensor BX-202 suggested that the SP and SF (Figure 9b) without reinforcement were 0.43 kPa cm and 0.11 kPa, and the SL was 72.1%; the SP and SF with four reinforcement layers were 0.44 kPa cm and 0.37 kPa and the SL was only 16.8%.
In view of the mechanics analysis, the flood overtopping carried away a large number of tailings sands during the overtopping process, which led to a significant reduction in the internal stress. However, the erosion of adjacent tailings was impeded by reinforcement layers to a certain degree. As the number of the reinforcement layers increased, the erosion of tailings was gradually reduced.
3.4. Analysis on Evolution of the Overtopping Failure Process
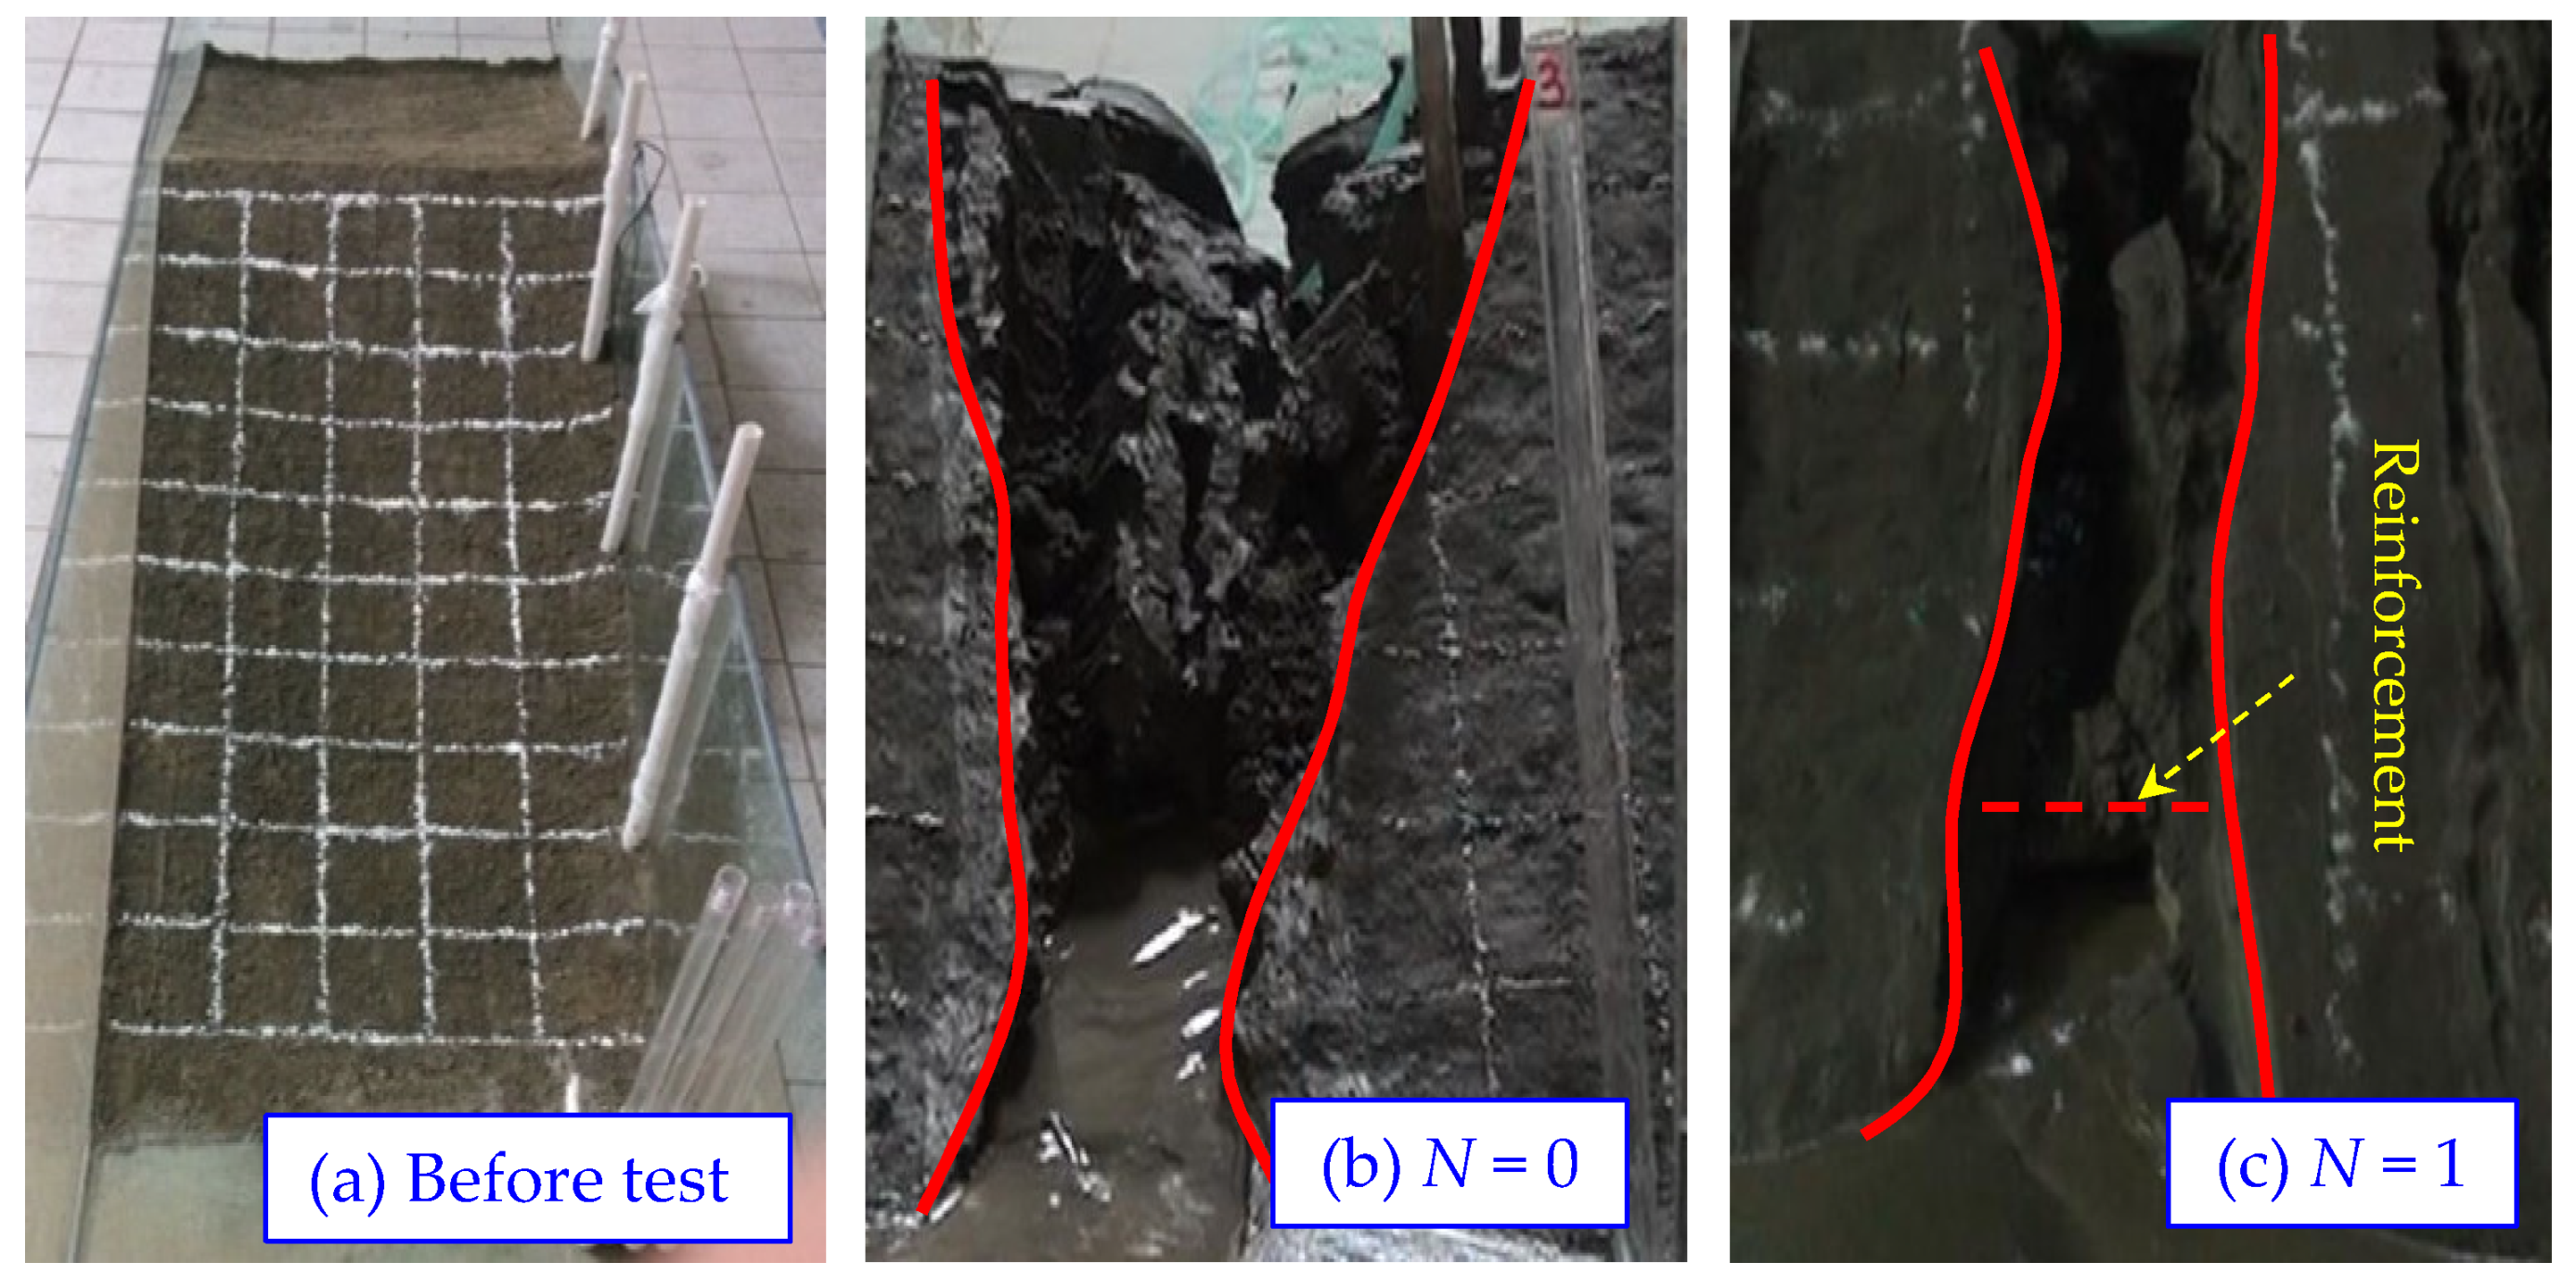
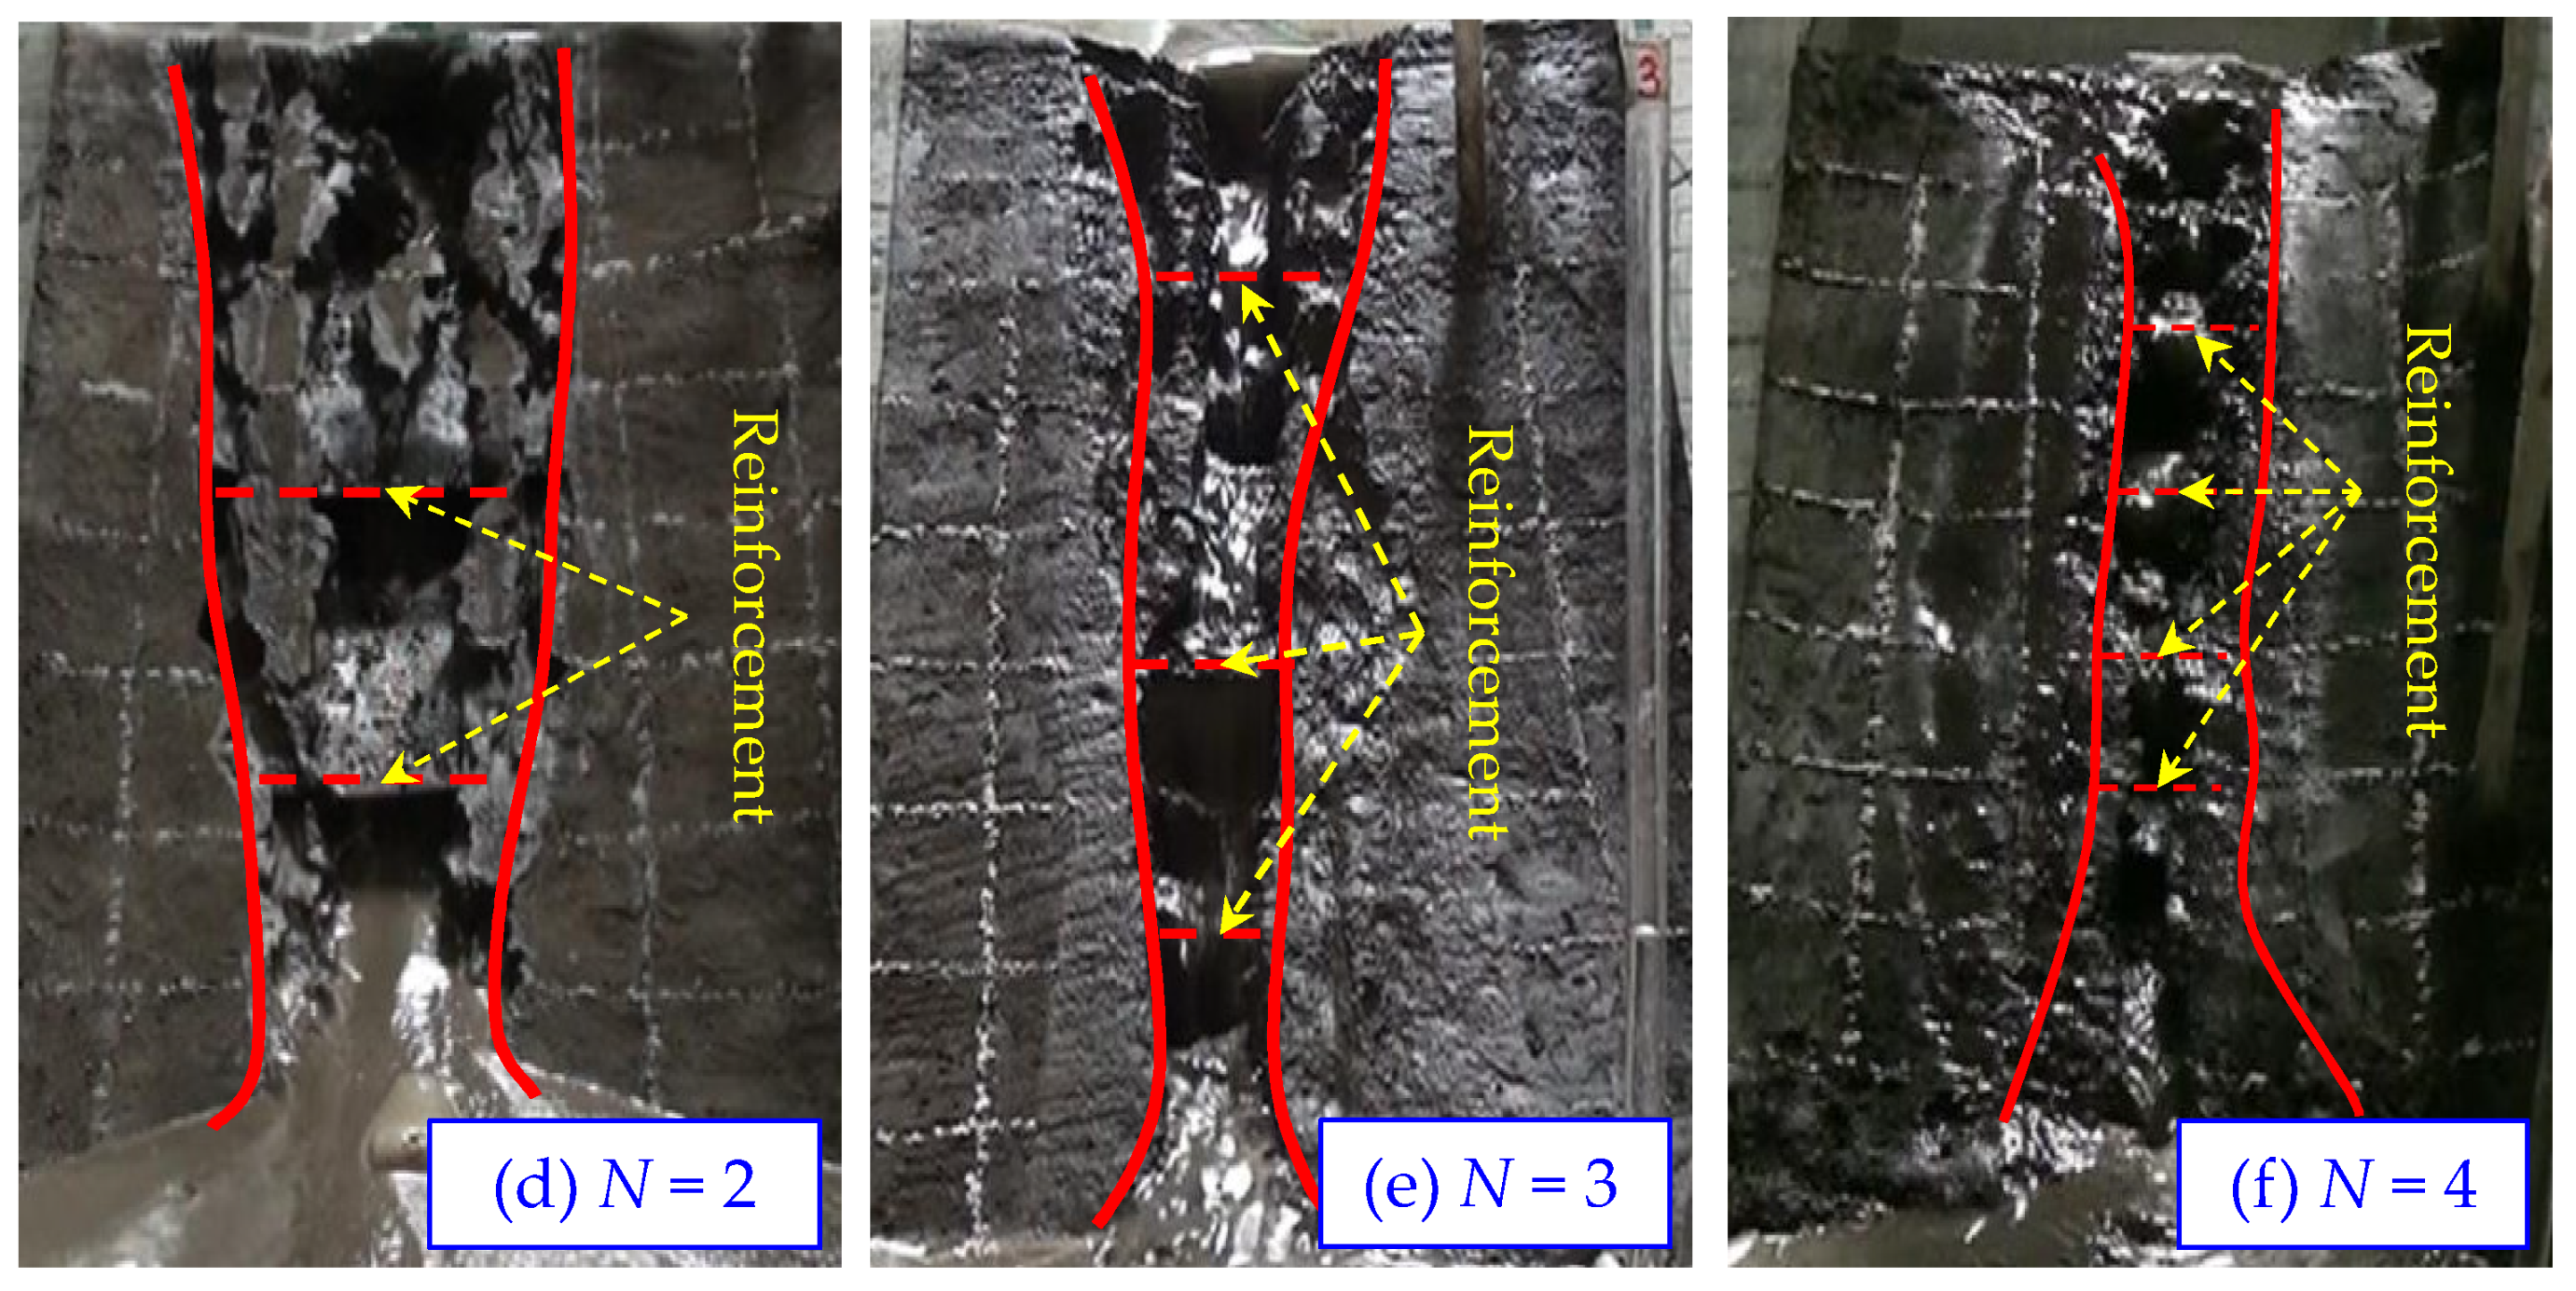
The failure process of the tailings dam varies significantly with different numbers of reinforcement layers, which directly affected the shape of the breach and the discharge of tailings. The final breach shape of tailings dam for different reinforcement layers was shown in Figure 10.
As shown in Figure 10, it was found that more reinforcement layers will lead to a relatively less damage to the tailings dam during overtopping. For the unreinforced tailings dam (N = 0), a large amount of tailings on the top were washed away, forming a deep breach. This erosion process would cause the shore of the breach to become instable, which could result in collapse of both sides of the breach. Since the debris of the dam accumulated at the toe and blocked the erosion, the bottom of the dam was not greatly affected. The breach was eventually shaped as an hourglass (see Figure 10b). For the case with four layers of reinforcement (N = 4), both sides of the dam breach did not show an obvious trench collapse. The main reason was that reinforcement had a locking effect on the tailings particle, so the erosion of adjacent tailings was impeded by reinforcement. The large-scale collapse did not occur at the main body of the dam, finally showing a clear ladder-shaped slope, as shown in Figure 10f.
Figure 11 shows that plots of width and depth of the breach versus time for different reinforcement layers. It was found that the maximum width and depth of the breach for the unreinforced tailings dam was about 43 cm and 22 cm, respectively. At the end of the overtopping test, the maximum width and depth had decreased to 8 cm and 14 cm for two layers of reinforcement, and 7 cm and 18 cm for four layers of reinforcement. In addition, it was noticed that, when the reinforcement was more than two layers, the further improvement was not significant. This result showed that the optimum number was two layers of reinforcement.
4. Prediction Model of Overtopping Failure
A prediction model was established to quantify the process of the erosion of the breach and validated with the experimental data obtained. Based on the results of the tailings dam overtopping tests, the changing process of the breach width on the top of the tailings dam should satisfy the following Equation [44]:
where ρs was the density of the tailings (kg/m3), Ct was the erosion coefficient of tailings (kg/m3), was the increment of breach width in (m), ν was the velocity of water in breach (m/s), and νk was the velocity of impact resistance (m/s), which was related to the properties of the dam material.
The hydraulic characteristics of overtopping flow were similar to the flow of broad crested weir [44]. The flow discharge could be obtained by Equation (3):
Among them, = 1.7, = −1.3 [45], the slope parameter was m = 0.36 according to the test model, ksm was the coefficient of submergence, ksm = 0.95, b was the breach width (m), h0 was the breach depth (m), and in this paper, h0 = z.
The relationship about time, breach depth and the number of reinforcement layers (N) was shown in Table 3, which could be calculated by the following Equation (4), the coefficients were obtained by best-fitting using Matrix Laboratory (Matlab, The MathWorks, Natick, MA, USA) based on the test results:
Ct was the erosion coefficient of reinforced tailings dam. From the test results, it was found that the Ct was changing with the number of reinforcement layers. The relationship between Ct and the number of reinforcement layers (N) was shown in Table 4, which could be represented by Equation (5):
where the N was the number of reinforcement layers, and was the erosion coefficient of tailings dam without reinforcement.
Substituting Equation (5) into Equation (2), an equation of the width of the breach after introducing reinforcement layers number (N) can be obtained:
According to the initial conditions above, the width of the dam breach with four reinforcement layers could be predicted by Equation (6), showing a high goodness of fit. The calculated breach width values were compared to the measured ones, as shown in Figure 12.
Substituting Equation (4) into Equation (3), the flow through the breach of reinforcement dam was calculated by Equation (3), as shown in Figure 13. It was found that the reinforcement could effectively reduce the discharge of the overtopping.
5. Conclusions
Overtopping was recognized as the major cause of tailings dam failure. In order to investigate the feature of overtopping of the reinforced tailings dam, a series of physical model tests were carried out. The findings of this research provided insights for the overtopping erosion of the tailings dam with different numbers of reinforcement. All presented expressions were applicable to the prediction of the development of breach in terms of time. From the study developed in this paper, the following conclusions could be drawn:
- The reinforcement layers significantly affected the phreatic level. As the number of reinforcement layers increased, the rate of the rise of the phreatic level was slowing down, but the final phreatic level became higher.
- The number of reinforcement layers had an impact on the final shape of dam breach after overtopping erosion. The final breach was shaped as a ladder with four reinforcement layers and an hourglass without reinforcement.
- The reinforcement layers could improve the anti-erosion capability of tailings dam. With the increase of reinforcement layers, the size of breach and the loss rate of stress were reduced significantly.
- Based on the erosion principle, a mathematical model including the number of reinforcement layers was proposed to predict the width and flow of the tailings dam breach.
Author Contributions
Conceptualization, X.J.; Methodology, X.J.; Validation, Y.C.; Supervision, D.J.W. and M.L.S.; Writing—Original Draft Preparation, X.J. and Y.C.; Writing—Review and Editing, X.J., Y.C. and H.Z.
Funding
The research reported in this paper has been funded by the National Natural Science Foundation of China (No. 51404049), the Natural Science Foundation project of Chongqing Science and Technology Commission (No. cstc2016jcyjA0319, No. cstc2018jcyjAX0231, No. cstc2015jcyjA50010), the China Scholarship Council (No. 201608505157), the China Postdoctoral Science Foundation (No. 2017M620048, No. 2018T110103), and grant chongqing-0004-2017AQ, Chongqing-0009-2018AQ.
Acknowledgments
The authors would like to thank the reviewers for their constructive comments that improved the paper.
Conflicts of Interest
The authors declare no conflict of interest.
References
- Ozcan, N.; Ulusay, R.; Isik, N. A study on geotechnical characterization and stability of downstream slope of a tailings dam to improve its storage capacity (Turkey). Environ. Earth Sci. 2013, 69, 1871–1890. [Google Scholar] [CrossRef]
- Reid, C.; Becaert, V.; Aubertin, M.; Rosenbaum, R.; Deschenes, L. Life cycle assessment of mine tailings management in Canada. J. Clean Prod. 2009, 17, 471–479. [Google Scholar] [CrossRef]
- Harder, L.F.; Stewart, J.P. Failure of Tapo Canyon tailings dam. J. Perform. Constr. Facil. 1996, 10, 109–114. [Google Scholar] [CrossRef]
- McDermott, R.K.; Sibley, J.M. The Aznalcollar tailings dam accident a case study. Miner. Res. Eng. 2000, 9, 101–118. [Google Scholar] [CrossRef]
- Blight, G.E. Destructive mudflows as a consequence of tailings dyke failures. Proc. Inst. Civ. Eng. Geotech. Eng. 1997, 125, 9–18. [Google Scholar] [CrossRef]
- Fourie, A.; Blight, G.E.; Papageorgiou, G. Static liquefaction as a possible explanation for the Merriespruit tailings dam failure. Can. Geotech. J. 2001, 38, 707–719. [Google Scholar] [CrossRef]
- Villavicencio, G.; Espinace, R.; Palma, J. Failures of sand tailings dams in a highly seismic country. Can. Geotech. J. 2014, 51, 449–464. [Google Scholar] [CrossRef]
- Sun, E.J.; Zhang, X.K.; Li, Z.X.; Wang, Y.H. Tailings dam flood overtopping failure evolution pattern. Procedia Eng. 2012, 28, 356–362. [Google Scholar] [CrossRef]
- Hahn, W.; Hanson, G.J.; Cook, K.R. Breach morphology observations of embankment overtopping tests. Water Res. 2000, 1–10. [Google Scholar] [CrossRef]
- Coleman, S.E.; Andrews, D.P.; Webby, M.G. Overtopping breaching of noncohesive homogeneous embankments. J. Hydraul. Eng. 2002, 128, 829–838. [Google Scholar] [CrossRef]
- Hanson, G.J.; Cook, K.R.; Hunt, S.L. Physical modeling of overtopping erosion and breach formation of cohesive embankments. Trans. ASAE 2005, 48, 1783–1794. [Google Scholar] [CrossRef]
- Tørum, A.; Kuhnen, F.; Menze, A. On berm breakwaters. Stability, scour, overtopping. Coast. Eng. 2003, 49, 209–238. [Google Scholar] [CrossRef]
- Hanson, G.J.; Cook, K.R.; Hahn, W.; Britton, S.L. Observed erosion processes during embankment overtopping tests. In Proceedings of the ASAE Annual Meeting, Las Vegas, NV, USA, 27–30 July 2003; pp. 11–17. [Google Scholar] [CrossRef]
- Yang, Y.; Cao, S.Y.; Yang, K.J.; Li, W.P. Experimental study of breach process of landslide dams by overtopping and its initiation mechanisms. J. Hydrodyn. 2015, 27, 872–883. [Google Scholar] [CrossRef]
- Yuan, S.U.; Tang, H.W.; Li, L.; Pan, Y.; Amini, F. Combined wave and surge overtopping erosion failure model of HPTRM levees: Accounting for grass-mat strength. Ocean Eng. 2015, 109, 256–269. [Google Scholar] [CrossRef]
- Mohamed, M.M.A.; El-Ghorab, E.A.S. Investigating scale effects on breach evolution of overtopped sand embankments. Water Sci. 2016, 30, 84–95. [Google Scholar] [CrossRef]
- Mohamed, M.M.A. Overtopping breach peak outflow approximation of embankment dam by using Monte Carlo method. In Proceedings of the Joint Conference on Water Resource Engineering and Water Resources Planning and Management, Minneapolis, MN, USA, 30 July–2 August 2000. [Google Scholar] [CrossRef]
- He, Z.G.; Hu, P.; Zhao, L.; Wu, G.F.; Pähtz, T. Modeling of Breaching Due to Overtopping Flow and Waves Based on Coupled Flow and Sediment Transport. Water 2015, 7, 4283–4304. [Google Scholar] [CrossRef]
- Mulder, J.P.M.; Hommes, S.; Horstman, E.M. Implementation of coastal erosion management in the Netherlands. Ocean Coast. Manag. 2011, 54, 888–897. [Google Scholar] [CrossRef]
- Van Rijn, L.C. Coastal erosion and control. Ocean Coast. Manag. 2011, 54, 867–887. [Google Scholar] [CrossRef]
- Alessio, G.; Eleni, D.; Stuart, P.; Giorgio, S.; Kees, D.H. A Regional Application of Bayesian Modeling for Coastal Erosion and Sand Nourishment Management. Water 2019, 11, 61. [Google Scholar] [CrossRef]
- Carlsten, S.; Johansson, S.; Wörman, A. Radar techniques for indicating internal erosion in embankment dams. J. Appl. Geophys. 1995, 33, 143–156. [Google Scholar] [CrossRef]
- Ran, Q.H.; Wang, F.; Li, P.; Ye, S.; Tang, H.L.; Gao, J.H. Effect of rainfall moving direction on surface flow and soil erosion processes on slopes with sealing. J. Hydrol. 2018, 567, 478–488. [Google Scholar] [CrossRef]
- Wu, Y.Y.; Ouyang, W.; Hao, Z.C.; Lin, C.Y.; Liu, H.B.; Wang, Y.D. Assessment of soil erosion characteristics in response to temperature and precipitation in a freeze-thaw watershed. Geoderma 2018, 328, 56–65. [Google Scholar] [CrossRef]
- Callaghan, D.P.; Nielsen, P.; Short, A.; Ranasinghe, R. Statistical simulation of wave climate and extreme beach erosion. Coast. Eng. 2008, 55, 375–390. [Google Scholar] [CrossRef]
- Serpa, D.; Nunes, J.P.; Santos, J.; Sampaio, E.; Jacinto, R.; Veiga, S.; Lima, J.C.; Moreira, M.; Corte-Real, J.; Keizer, J.J.; et al. Impacts of climate and land use changes on the hydrological and erosion processes of two contrasting Mediterranean catchments. Sci. Total Environ. 2015, 538, 64–77. [Google Scholar] [CrossRef] [PubMed]
- Stefanidis, S.; Stathis, D. Effect of Climate Change on Soil Erosion in a Mountainous Mediterranean Catchment (Central Pindus, Greece). Water 2018, 10, 1469. [Google Scholar] [CrossRef]
- Simonneaux, V.; Cheggour, A.; Deschamps, C.; Mouillot, F.; Cerdan, O.; Le Bissonnais, Y. Land use and climate change effects on soil erosion in a semi-arid mountainous watershed (High Atlas, Morocco). J. Arid Environ. 2015, 122, 64–75. [Google Scholar] [CrossRef]
- Teng, H.; Liang, Z.; Chen, S.; Liu, Y.; Rossel, R.A.V.; Chappell, A.; Yu, W.; Shi, Z. Current and future assessments of soil erosion by water on the Tibetan Plateau based on RUSLE and CMIP5 climate models. Sci. Total Environ. 2018, 635, 673–686. [Google Scholar] [CrossRef]
- Wang, T.; Li, P.; Hou, J.M.; Li, Z.B.; Ren, Z.P.; Cheng, S.D.; Xu, G.C.; Su, Y.Y.; Wang, F.C. Response of the Meltwater Erosion to Runoff Energy Consumption on Loessal Slopes. Water 2018, 10, 1522. [Google Scholar] [CrossRef]
- Sujatha, E.R.; Sridhar, V. Spatial Prediction of Erosion Risk of a Small Mountainous Watershed Using RUSLE: A Case-Study of the Palar Sub-Watershed in Kodaikanal, South India. Water 2018, 10, 1608. [Google Scholar] [CrossRef]
- Deng, S.S.; Xia, J.Q.; Zhou, M.R.; Lin, F.F. Coupled modeling of bed deformation and bank erosion in the Jingjiang Reach of the middle Yangtze River. J. Hydrol. 2019, 568, 221–233. [Google Scholar] [CrossRef]
- Choi, C.E.; Cui, Y.F.; Kelvin, Y.K.A.; Liu, H.M.; Wang, J.; Liu, D.Z.; Wang, H. Case Study: Effects of a Partial-Debris Dam on Riverbank Erosion in the Parlung Tsangpo River, China. Water 2018, 10, 250. [Google Scholar] [CrossRef]
- Zhang, X.K.; Sun, E.J.; Li, Z.X. Experimental Study on Evolution Law of Tailings Dam Flood Overtopping. China Saf. Sci. J. 2011, 21, 118–124. [Google Scholar] [CrossRef]
- Liu, L.; Zhang, H.W.; Zhong, D.Y.; Miao, R.Z. Research on tailings dam break due to overtopping. J. Hydraul. Eng. 2014, 45, 675–681. [Google Scholar] [CrossRef]
- Festugato, L.; Consoli, N.C.; Fourie, A. Cyclic shear behaviour of fibre-reinforced mine tailings. Geosynth. Int. 2015, 22, 196–206. [Google Scholar] [CrossRef]
- Li, L.; Mitchell, R. Effects of reinforcing elements on the behavior of weakly cemented sands. Can. Geotech. J. 1988, 25, 389–395. [Google Scholar] [CrossRef]
- Wei, Z.A.; Yin, G.Z.; Li, G.Z.; Wang, J.G.; Wan, L.; Shen, L.Y. Reinforced terraced fields method for fine tailings disposal. Miner. Eng. 2009, 22, 1053–1059. [Google Scholar] [CrossRef]
- Yin, G.; Wei, Z.; Wang, J.G.; Wan, L.; Shen, L. Interaction characteristics of geosynthetics with fine tailings in pullout test. Geosynth. Int. 2008, 15, 428–436. [Google Scholar] [CrossRef]
- James, M.; Aubertin, M. The use of waste rock inclusions to improve the seismic stability of tailings impoundments. In Proceedings of the GeoCongress 2012: State of the Art and Practice in Geotechnical Engineering, Oakland, CA, USA, 25–29 March 2012; pp. 4166–4175. [Google Scholar] [CrossRef]
- Liu, J.; Bai, Y.X.; Li, D.; Wang, Q.Y.; Qian, W.; Wang, Y.; Debi Prasanna, K.; Wei, J.H. An Experimental Study on the Shear Behaviors of Polymer-Sand Composite Materials after Immersion. Polymers 2018, 10, 924. [Google Scholar] [CrossRef]
- Consoli, N.C.; Nierwinski, H.P.; da Silva, A.P.; Sosnoski, J. Durability and strength of fiber-reinforced compacted gold tailings-cement blends. Geotext. Geomembr. 2017, 45, 98–102. [Google Scholar] [CrossRef]
- Zhu, X.; Huang, X.M. Laboratory simulating test and field settlement observation of reinforced embankment. Chin. J. Geotech. Eng. 2002, 24, 386–388. [Google Scholar] [CrossRef]
- Zhang, H.W.; Zhang, J.H.; Bu, H.L. Discuss the probability formula of bed load transport. South-to-North Water Transf. Water Sci. 2011, 9, 140–145. [Google Scholar] [CrossRef]
- Singh, V.P. Dam Breach Modeling Technology; Kluwer Academic Publisher: Dordrecht, The Netherlands, 1996; Volume 17, pp. 181–200. [Google Scholar]
Figure 1.
Tailings dam overtopping failure model test system.

Figure 2.
Monitoring distribution of tailings dam failure experiment. (a) Side view; (b) Top view.

Figure 3.
The schematic diagram of geo-grid laying. (a) N = 0; (b) N = 1; (c) N = 2; (d) N = 3; (e) N = 4.
Figure 3.
The schematic diagram of geo-grid laying. (a) N = 0; (b) N = 1; (c) N = 2; (d) N = 3; (e) N = 4.

Figure 4.
Grain size distribution curve of the copper tailings sample.

Figure 5.
The procedures of tailings dam construction. (a) Tailings sample; (b) tailings dam construction; (c) tailings dam construction; (d) displacement monitor.
Figure 5.
The procedures of tailings dam construction. (a) Tailings sample; (b) tailings dam construction; (c) tailings dam construction; (d) displacement monitor.

Figure 6.
The final vertical and horizontal displacement of tracer points during overtopping for different reinforcement layers. (a) Displacement of point W1; (b) Displacement of point W8; (c) Displacement of point W10.
Figure 6.
The final vertical and horizontal displacement of tracer points during overtopping for different reinforcement layers. (a) Displacement of point W1; (b) Displacement of point W8; (c) Displacement of point W10.

Figure 7.
Phreatic level of JR-02 during test.

Figure 8.
Final phreatic level at the end of time.

Figure 9.
The characteristics of dam internal stress, (a) stress of sensor BX-201; (b) stress of sensor BX-202, .
Figure 9.
The characteristics of dam internal stress, (a) stress of sensor BX-201; (b) stress of sensor BX-202, .


Figure 10.
The breach shape for different reinforcement layers. (a) Before test; (b) N = 0; (c) N = 1; (d) N = 2; (e) N = 3; (f) N = 4.
Figure 10.
The breach shape for different reinforcement layers. (a) Before test; (b) N = 0; (c) N = 1; (d) N = 2; (e) N = 3; (f) N = 4.


Figure 11.
The width/depth changes graph of breach, (a) breach width; (b) breach depth.


Figure 12.
Comparison of the calculated and measured breach width for four reinforcement layers.

Figure 13.
Calculated of flow through breach with different reinforcement layers.


Table 1.
Basic property of geo-grid.
| Type | Grid Size (mm) | Tensile Strength (kN·m−1) | Elongation at Break (%) | ||
|---|---|---|---|---|---|
| Vertical | Horizontal | Longitudinal | Transverse | ||
| JT1101 | 25 | 25 | 6.5 | 6.5 | 12.7 |
Table 2.
Properties of the copper tailings sample.
| Index | Values |
|---|---|
| Specific gravity | 2.10 |
| Moisture content (%) | 12.5 |
| Porosity | 0.024 |
| Modulus of compression (MPa) | 17.6 |
| Coefficient of compressibility (MPa−1) | 0.058 |
| Permeability coefficient (×10−6 m·s−1) | 5.86 |
| Cohesion (kPa) | 7.52 |
| Internal friction angle (Φ/°) | 31.2 |
Table 3.
Relationship about breach depth, reinforcement layers (N) and time.
| Index | Values | ||||||||||||||||
|---|---|---|---|---|---|---|---|---|---|---|---|---|---|---|---|---|---|
| Time (s) | 0 | 20 | 40 | 60 | 80 | 100 | 120 | 140 | 160 | 180 | 200 | 220 | 240 | 280 | 300 | 320 | |
| Breach Depth (cm) | N = 0 | 0 | 10 | 10 | 12 | 12.5 | 14 | 16 | 18 | 20 | 20 | 22 | 22 | 22 | 22 | 22 | 22 |
| N = 1 | 0 | 6 | 8 | 11 | 11 | 13 | 13 | 15 | 15 | 17 | 17 | 20 | 20 | 20 | 20 | 20 | |
| N = 2 | 0 | 4 | 6 | 7.2 | 8 | 8 | 8 | 8 | 10 | 12 | 14 | 14 | 14 | 14 | 14 | 14 | |
| N = 3 | 0 | 3 | 3 | 3 | 4 | 4 | 6 | 7 | 8 | 8 | 9 | 10 | 10 | 10 | 10 | 10 | |
| N = 4 | 0 | 2 | 2 | 2 | 4 | 4 | 5 | 7 | 7 | 8 | 8 | 10 | 10 | 10 | 10 | 10 | |
Table 4.
Relationship between Ct and reinforcement.
| Reinforcement Layers (N) | 0 | 1 | 2 | 3 | 4 |
|---|---|---|---|---|---|
| Ct (×10−4 kg/cm3) | 38.62 | 13.51 | 9.92 | 6.10 | 5.59 |
© 2019 by the authors. Licensee MDPI, Basel, Switzerland. This article is an open access article distributed under the terms and conditions of the Creative Commons Attribution (CC BY) license (http://creativecommons.org/licenses/by/4.0/).
Share and Cite
MDPI and ACS Style
Jing, X.; Chen, Y.; Williams, D.J.; Serna, M.L.; Zheng, H. Overtopping Failure of a Reinforced Tailings Dam: Laboratory Investigation and Forecasting Model of Dam Failure. Water 2019, 11, 315. https://doi.org/10.3390/w11020315
AMA Style
Jing X, Chen Y, Williams DJ, Serna ML, Zheng H. Overtopping Failure of a Reinforced Tailings Dam: Laboratory Investigation and Forecasting Model of Dam Failure. Water. 2019; 11(2):315. https://doi.org/10.3390/w11020315
Chicago/Turabian StyleJing, Xiaofei, Yulong Chen, David J. Williams, Marcelo L. Serna, and Hengwei Zheng. 2019. "Overtopping Failure of a Reinforced Tailings Dam: Laboratory Investigation and Forecasting Model of Dam Failure" Water 11, no. 2: 315. https://doi.org/10.3390/w11020315
Note that from the first issue of 2016, this journal uses article numbers instead of page numbers. See further details here.