Analysis of Precipitation and Temperature Extremes over the Muda River Basin, Malaysia


1
Geography Section, School of Humanities, Universiti Sains Malaysia, Penang 11800, Malaysia
2
Department of Ecology, School of Horticulture and Plant Protection, Yangzhou University, Yangzhou 225009, China
*
Author to whom correspondence should be addressed.
Water 2019, 11(2), 283; https://doi.org/10.3390/w11020283
Submission received: 30 November 2018
/
Revised: 1 January 2019
/
Accepted: 8 January 2019
/
Published: 6 February 2019
(This article belongs to the Section Hydrology)
Abstract
:Trends in precipitation and temperature extremes of the Muda River Basin (MRB) in north-western Peninsular Malaysia were analyzed from 1985 to 2015. Daily climate data from eight stations that passed high quality data control and four homogeneity tests (standard normal homogeneity test, Pettitt test, Buishand range test, and von Neumann ratio test) were used to calculate 22 Expert Team on Climate Change Detection and Indices (ETCCDI) extreme indices. Non-parametric Mann–Kendall, modified Mann–Kendall and Sens’ slope tests were applied to detect the trend and magnitude changes of the climate extremes. Overall, the results indicate that monthly precipitation tended to increase significantly in January (17.01 mm/decade) and December (23.23 mm/decade), but decrease significantly in May (26.21 mm/decade), at a 95% significance level. Monthly precipitation tended to increase in the northeast monsoon, but decrease in the southwest monsoon. Mann–Kendall test detected insignificant trends in most of the annual climate extremes, except the extremely wet days (R99p), mean of maximum temperature (TXmean), mean of minimum temperature (TNmean), cool days (TX10p), cool nights (TN10p), warm days (TX90p) and warm nights (TN90p) indices. The number of heavy (R10mm), very heavy (R20mm), and violent (R50mm) precipitation days changed at magnitudes of 0~2.73, −2.14~3.33, and −1.67~1.29 days/decade, respectively. Meanwhile, the maximum 1-day (Rx1d) and 5-day (Rx5d) precipitation amount indices changed from −10.18 to 3.88 mm/decade and −21.09 to 24.69 mm/decade, respectively. At the Ampangan Muda station, TNmean (0.32 °C/decade) increased at a higher rate compared to TXmean (0.22 °C/decade). The number of the cold days and nights tended to decrease, while an opposite trend was found in the warmer days and nights.
Keywords:
extreme; precipitation; temperature; climate change; ETCCDI; Muda River; Malaysia; tropical; rainfall; trend1. Introduction
Climate change is a well-known threat to the social, economic, and environmental spheres [1]. The number and intensity of recorded natural hazards such as flood, drought, heatwave and wildfire have increased as climate change exacerbates. For instance, climate change caused the frequent occurrence of devastating heatwaves in northern Europe, Asia and many other places [2]. Elsewhere, based on Kundzewicz et al. [3], the highest recorded annual flood loss occurred in China in 2010, causing a total loss of ~USD 51 billion. Quantifying of precipitation and temperature extremes in a specific location is therefore essential to understand the effects of climate change on natural hazards.
Current research on precipitation and temperature extremes, however, has been dominated by researchers in Australia, China, Europe, and United States [4,5]. Besides that, a majority of the climate extreme trend research involved country scale assessment [6,7]. Although these studies have greatly improved our understanding on the changes of climate extremes, the risk and trend varies considerably in different regions and need to be studied. Moreover, the relationship of climate pattern and natural hazards is complicated within a river basin, but relatively little research has explored the basin-scale characteristic of climate extremes.
Analysis in the changes of precipitation and temperature extremes in the upper Blue Nile Basin, Ethiopia was conducted by Worku et al. [8] using the extreme indices of Expert Team on Climate Change Detection and Indices (ETCCDI). They found the signs of climate change over the basin due to the increasing of climate extremes’ events and trends. Similar ETCCDI indices have been applied in other basin-scale studies including Koshi River Basin [9] and Songhua River Basin [10]. Most importantly, World Meteorological Organization (WMO) recommended an application of the ETCCDI extreme indices to allow a better comparison among climate extremes studies around the world.
Malaysian precipitation extremes studies were mainly conducted in national scale [11,12,13]. Extreme precipitation during the monsoon flood season (December to February) over the east coast of Peninsular Malaysia were increased during the moderate La Niña events rather than the strong La Niña events [11]. On a basin scale assessment, Tan et al. [14] conducted a comprehensive precipitation extreme changes analysis over the Kelantan River Basin from 1985 to 2014 using the ETCCDI indices. As reported, increasing trends were found in most of the evaluated indices over this basin, except the consecutive wet days (CWD) and consecutive dry days (CDD) indices. Such detailed basin scale assessment needs to be conducted in other Malaysian river basins as well. This is important for effective management of the river basins via understanding of the basin climate system and potential water-related hazards.
The Muda River Basin (MRB) located in north-western Peninsular Malaysia supplies freshwater resources to the states of Kedah and Penang for domestic, industrial and agricultural purposes [15]. Based on Ghani et al. [16], flood hits the basin almost every year during the wet seasons. One of the major floods occurred in October 2003 and affected about 45,000 people. Besides that, flood and drought have also caused multi-million-ringgit losses of paddy each year. In a national scale assessment, the total precipitation (PRCPTOT) increased significantly in the period of June to August during the El Niño at two climate stations located in north-western Peninsular Malaysia [11]. However, none of the evaluated stations were located within the MRB. Therefore, a basin scale assessment, which might be emerged contrary findings compared to the national scale assessment, is required.
The present study aims to provide a comprehensive analysis of the climate extremes changes over the MRB from 1985 to 2015. The spatial-temporal trends of the precipitation and temperature extremes were evaluated using the ETCCDI indices. This study contributes to a better understanding of the climate extremes changes in a typical tropical river basin. Moreover, the findings will act as a baseline for the projections of future climate extremes. Section 2 and Section 3 describe the study area, materials and methods. Results and discussion are described in Section 4 and Section 5, respectively. A brief summary of this study is given in Section 6.
2. Study Area
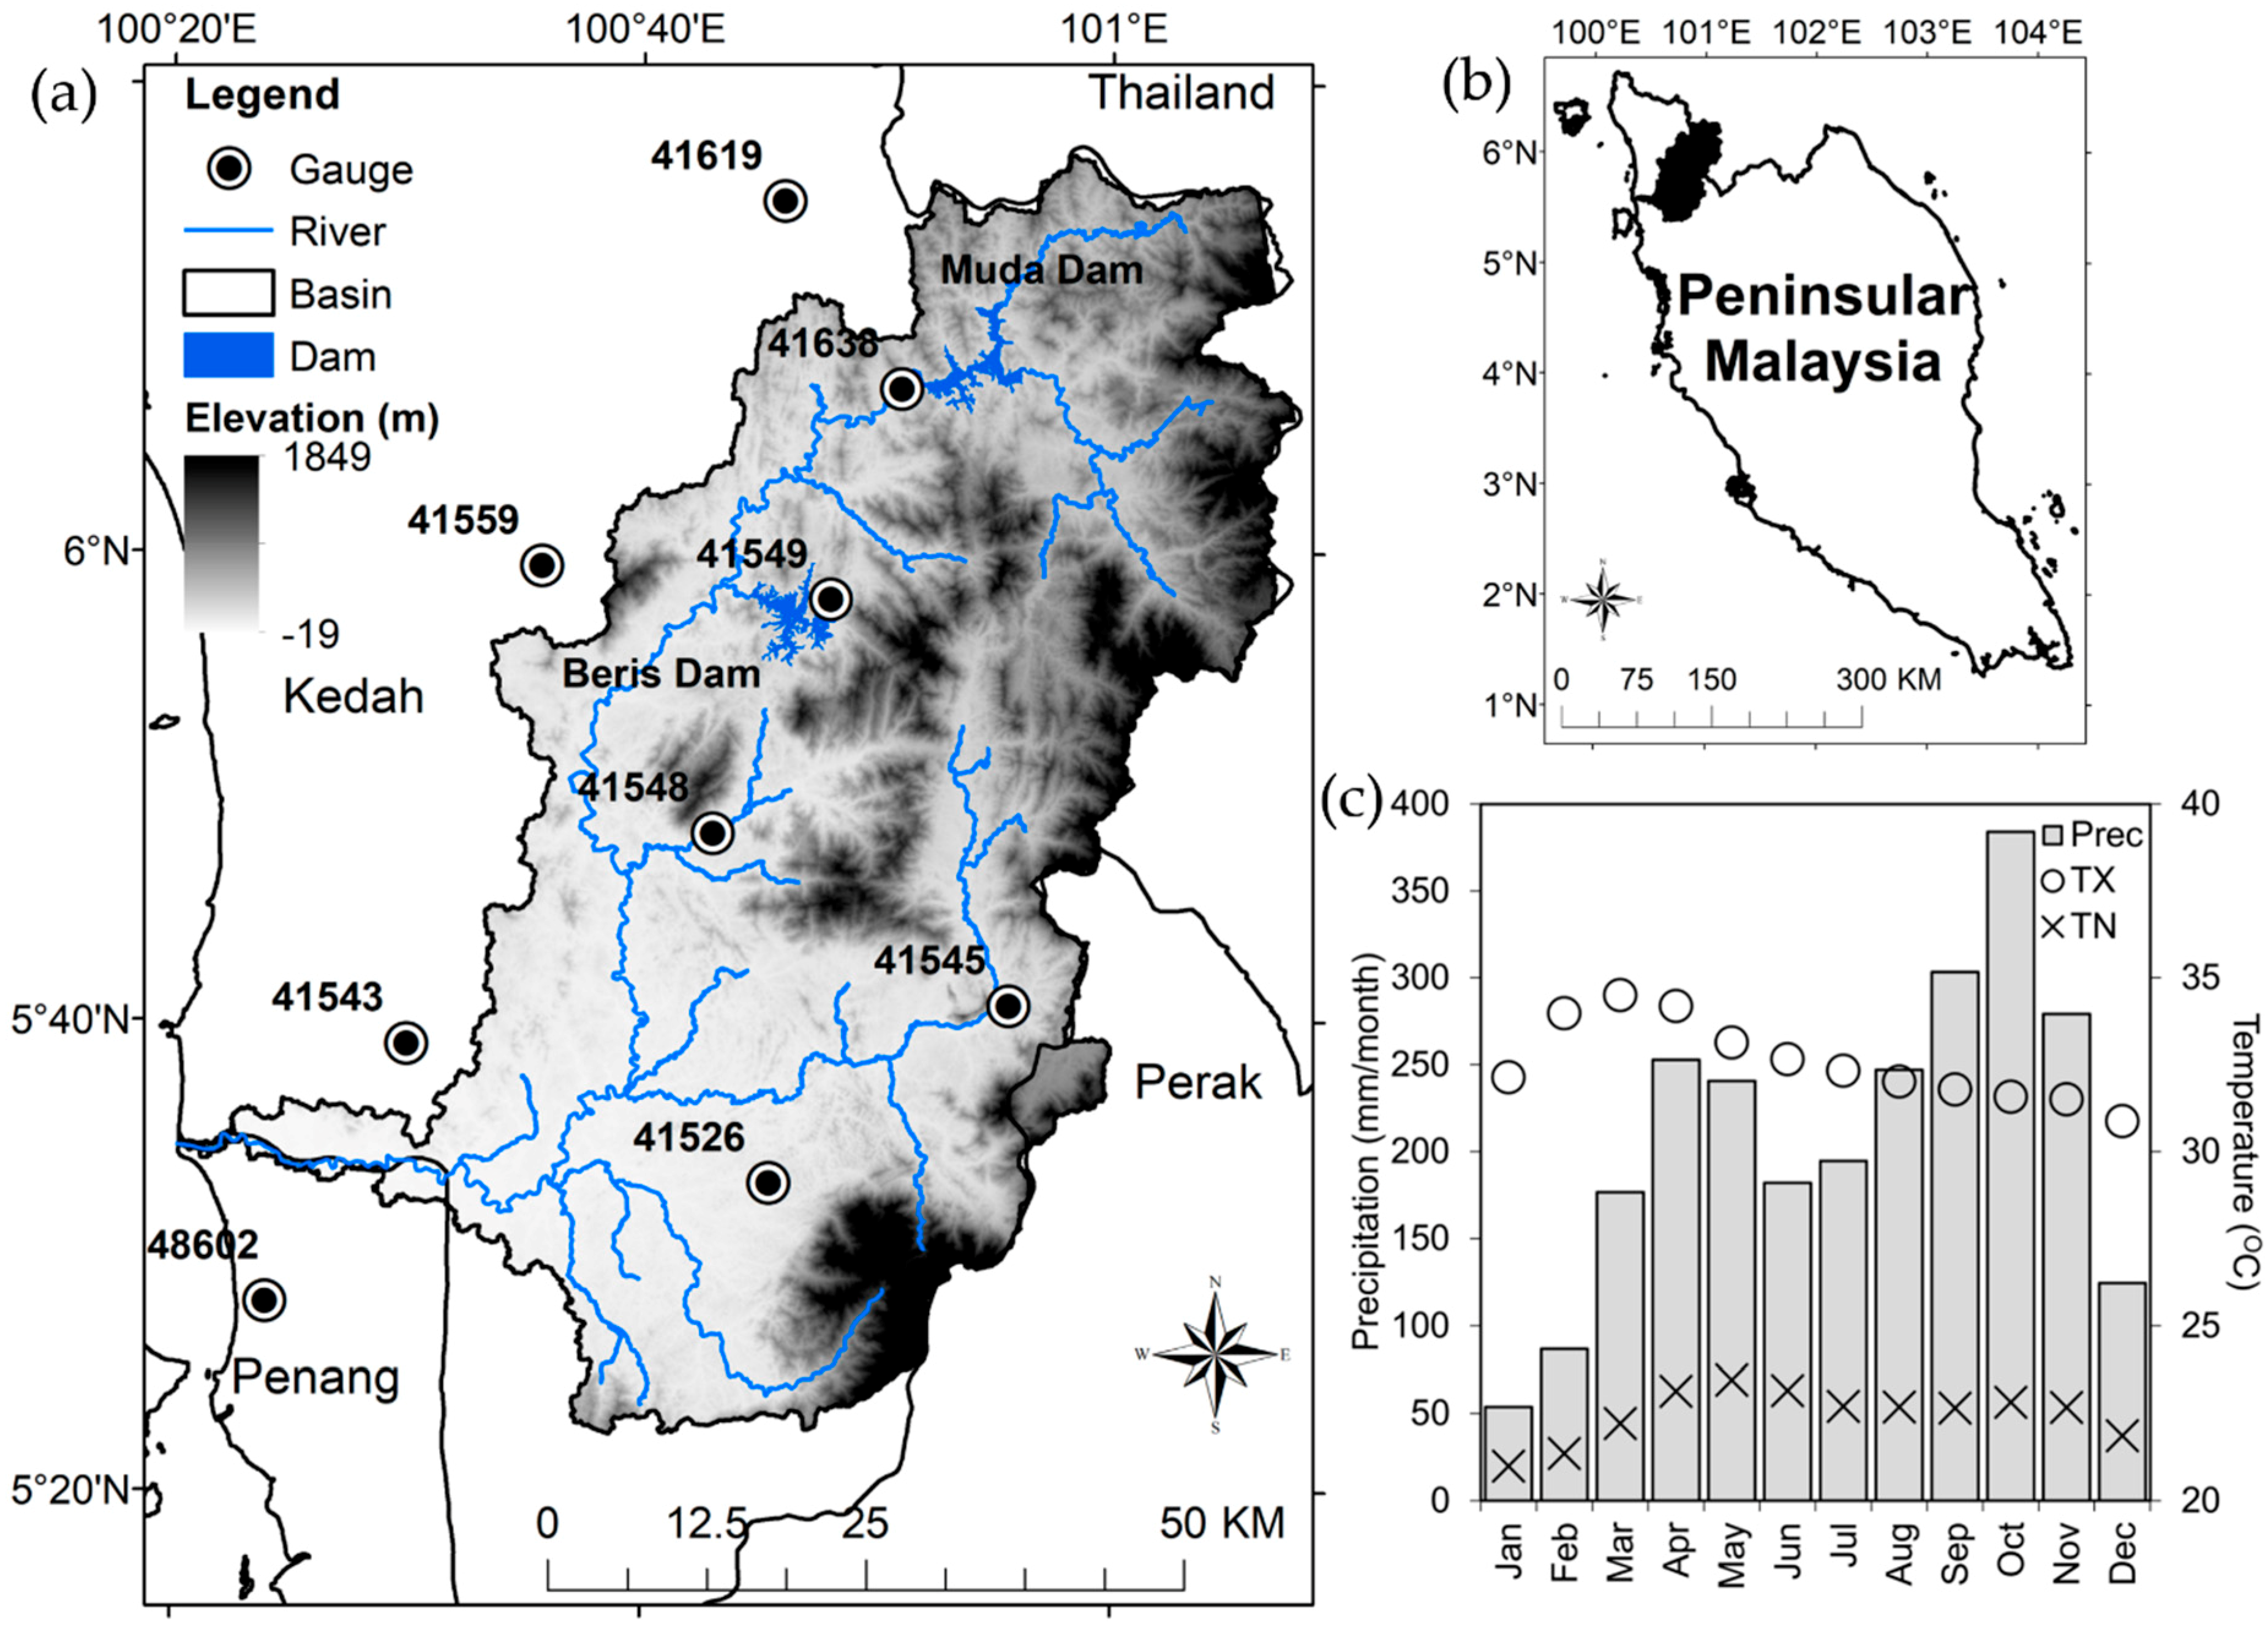
The MRB lies between 5°20′–6°20′ N latitudes and 100°20′–101°20′ E longitudes (Figure 1a,b). It has a drainage area of about 4111 km2. The MRB is located in a major part of Kedah and in minor part of Penang. So, both states have the right to withdraw water from the Muda River. The Muda Dam and Beris Dam are two major dams within the basin. The Muda Dam with a storage of 160 million m3 [17], was constructed in 1969 under the Muda Irrigation Scheme for irrigating the paddy field in the south and south-eastern regions of Kedah. The Muda Agriculture Development Authority (MADA) is responsible to operate and maintain the dam. Meanwhile, the Beris Dam (122 million m3) is operate and maintain by the Department of Irrigation and Drainage (DID). Perbadanan Bekalan Air Pulau Pinang (PBAPP), the only water supply company in Penang, is abstracting water from the downstream of the Muda River. In fact, Penang is highly dependent on the Muda River as more than 80% of the state’s water comes from this river [18]. Hence, any reduction on water resources of the MRB could directly affect the domestic and industrial sectors in Penang.
Regional monthly precipitation of the MRB as measured by the mean of the eight stations shown in Figure 1c. Similar to other Malaysian river basins, the climate system of the MRB can be divided into the northeast monsoon (NEM, November to March), southwest monsoon (SWM, May to September) and two inter-monsoon seasons [19]. The MRB is less affected by the NEM because of the Titiwangsa range blocks the heavy precipitation [13]. Meanwhile, the SWM effect on the MRB is reduced by the mountain ranges in Sumatra, Indonesia. There are two precipitation peaks during the months of April and October in the 1985–2015 period, showing the inter-monsoon seasons bring more heavy precipitation compared to the NEM and SWM. Heavy precipitation of the inter-monsoon seasons is mainly brought by the local convective systems [13]. The basin received annual precipitation from 2160 mm/year to 3000 mm/year during the period of 1985–2015. As shown in Figure 1c, the mean monthly maximum (Tmax) and minimum (Tmin) temperature at the Ampangan Muda station ranged from 30.9–34.5 °C and 21–23.5 °C, respectively. In 2016, a super El Niño event severely reduced the water storage capacities of the Muda Dam and the Beris Dam to critical levels of 45.2% and 38.3%, respectively [18].
3. Materials and Methods
3.1. Data and Quality Control
Observed daily precipitation data from 1985 to 2015 were collected from Malaysian Meteorological Department (MMD). A basic information of the nine stations is listed in Table 1. Application of unreliable observed climate data might cause wrong conclusions on the climate conditions, so data quality control and homogeneity tests were conducted to minimize the error. Data quality control involves removal of stations with inhomogeneous trend, i.e. those with more than 10% missing and unreasonable values. The latter situation refers to extremely high or negative precipitation and temperature values, and the Tmin value is greater than the Tmax value. Homogeneity test is performed to detect and remove the inhomogeneous station from the trend analysis. Inhomogeneous climate data due to changes in instrumentation, environment and measurement approach might cover up the real climate condition [20]. Four homogeneity tests (standard normal homogeneity test, Pettitt test, Buishand range test and von Neumann ratio test) recommended by Wijngaard et al. [21] were used to detect the homogenous trend of the daily precipitation data. Then, the stations were categorized into “useful”, “doubtful” and “suspect” when the one or none, two and three or all tests rejects null hypothesis at 1% significance level, respectively. The XLSTAT-Time Series Analysis module, an add-in of Microsoft Excel that contains the four selected homogeneity tests were used.
3.2. Trend Analysis
General and extreme trends of the precipitation, Tmax and Tmin were conducted using the non-parametric Mann–Kendall (MK) test. This method is widely applied in hydro-climatic trend analysis [6,22]. The null hypothesis of the MK test is “there is no trend in the time series” based on the fact that the data is randomly ordered and independent. A positive MK value indicates an increasing trend, while a negative MK value shows a decreasing trend. However, positive serial correlation in climate data will increase the probability of significant output, indirectly lead to a false trend [23]. Therefore, a modified MK test introduced by Hamed and Rao [24] was employed to evaluate the trend of serial correlation data. The magnitude of the detected trends was calculated using the Sen’s slope test. The missing values in the climate data does not affect the outputs as they are rank-based techniques [25]. Regional trend was measured using the arithmetic mean of all stations over the basin [26]. The trends were assessed at a 95% significance level. Detailed calculations of the MK and Sens’ slope are available in several hydro-climatic trends analysis manuscripts [14,27].
3.3. Extreme Indices
A set of ETCCDI’s precipitation and temperature extremes indices as listed in Table 2 was used. Precipitation extreme indices can be categorized into two groups: (1) precipitation indices: PRCPTOT, R95p, R99p, Rx1d, Rx5d and SDII, and; (2) number of precipitation days: CDD, CWD, R10mm, R20mm and R50mm. The threshold of the user defined daily violent precipitation to 50 mm/day based on the WMO precipitation classification.
Temperature extremes indices can be classified into three groups: (1) extreme temperature values: TXmean, TNmean and DTR; (2) warm extreme indices: TX90p, TN90p, TXx and TNx, and (3) cold extreme indices: TX10p, TN10p, TXn and TNn. Measurement of these indices was conducted using the RClimDex tool. Climate data quality control procedure as mentioned in the Section 3.1 was performed by the RClimDex tool.
4. Results
4.1. Data Quality Control and Homogeneous Assessment
Table 1 shows that most of the precipitation gauges had less than 3% missing value, except the Pusat Pertanian Charok Padang station (~5.7% missing value). For the temperature data, the Ampangan Muda station is the only station within the basin with less than 10% missing value. It had a missing value of about 6.5%. The recorded daily Tmax and Tmin of the Ampangan Muda station varied from 23.5–38.6 °C and 15.2–25.8 °C, respectively. On the other hand, the temperature data of the Pusat Pertanian Charok Padang station was excluded from this study because the missing value is about 12%.
Homogeneity result shows that the Ampangan Muda and Butterworth stations are labeled as “useful”. The Butterworth station is one of the principal climate stations in Malaysia, which is well maintained and calibrated by the MMD staff [28]. Meanwhile, the Ampangan Muda station is mainly used to monitor the climate condition around the Muda Dam, and therefore more attention is given by local authorities. The remaining stations were classified as “doubtful”, except the Hospital Baling and Hospital Sungai Petani stations as “suspect”. Two aspects were considered in removing the “suspect” stations: (1) location and (2) comparison with nearby homogeneous station. After a rigorous data quality and homogeneity assessment, the Hospital Sungai Petani station was removed from the trend analysis.
4.2. Trend of Monthly Precipitation
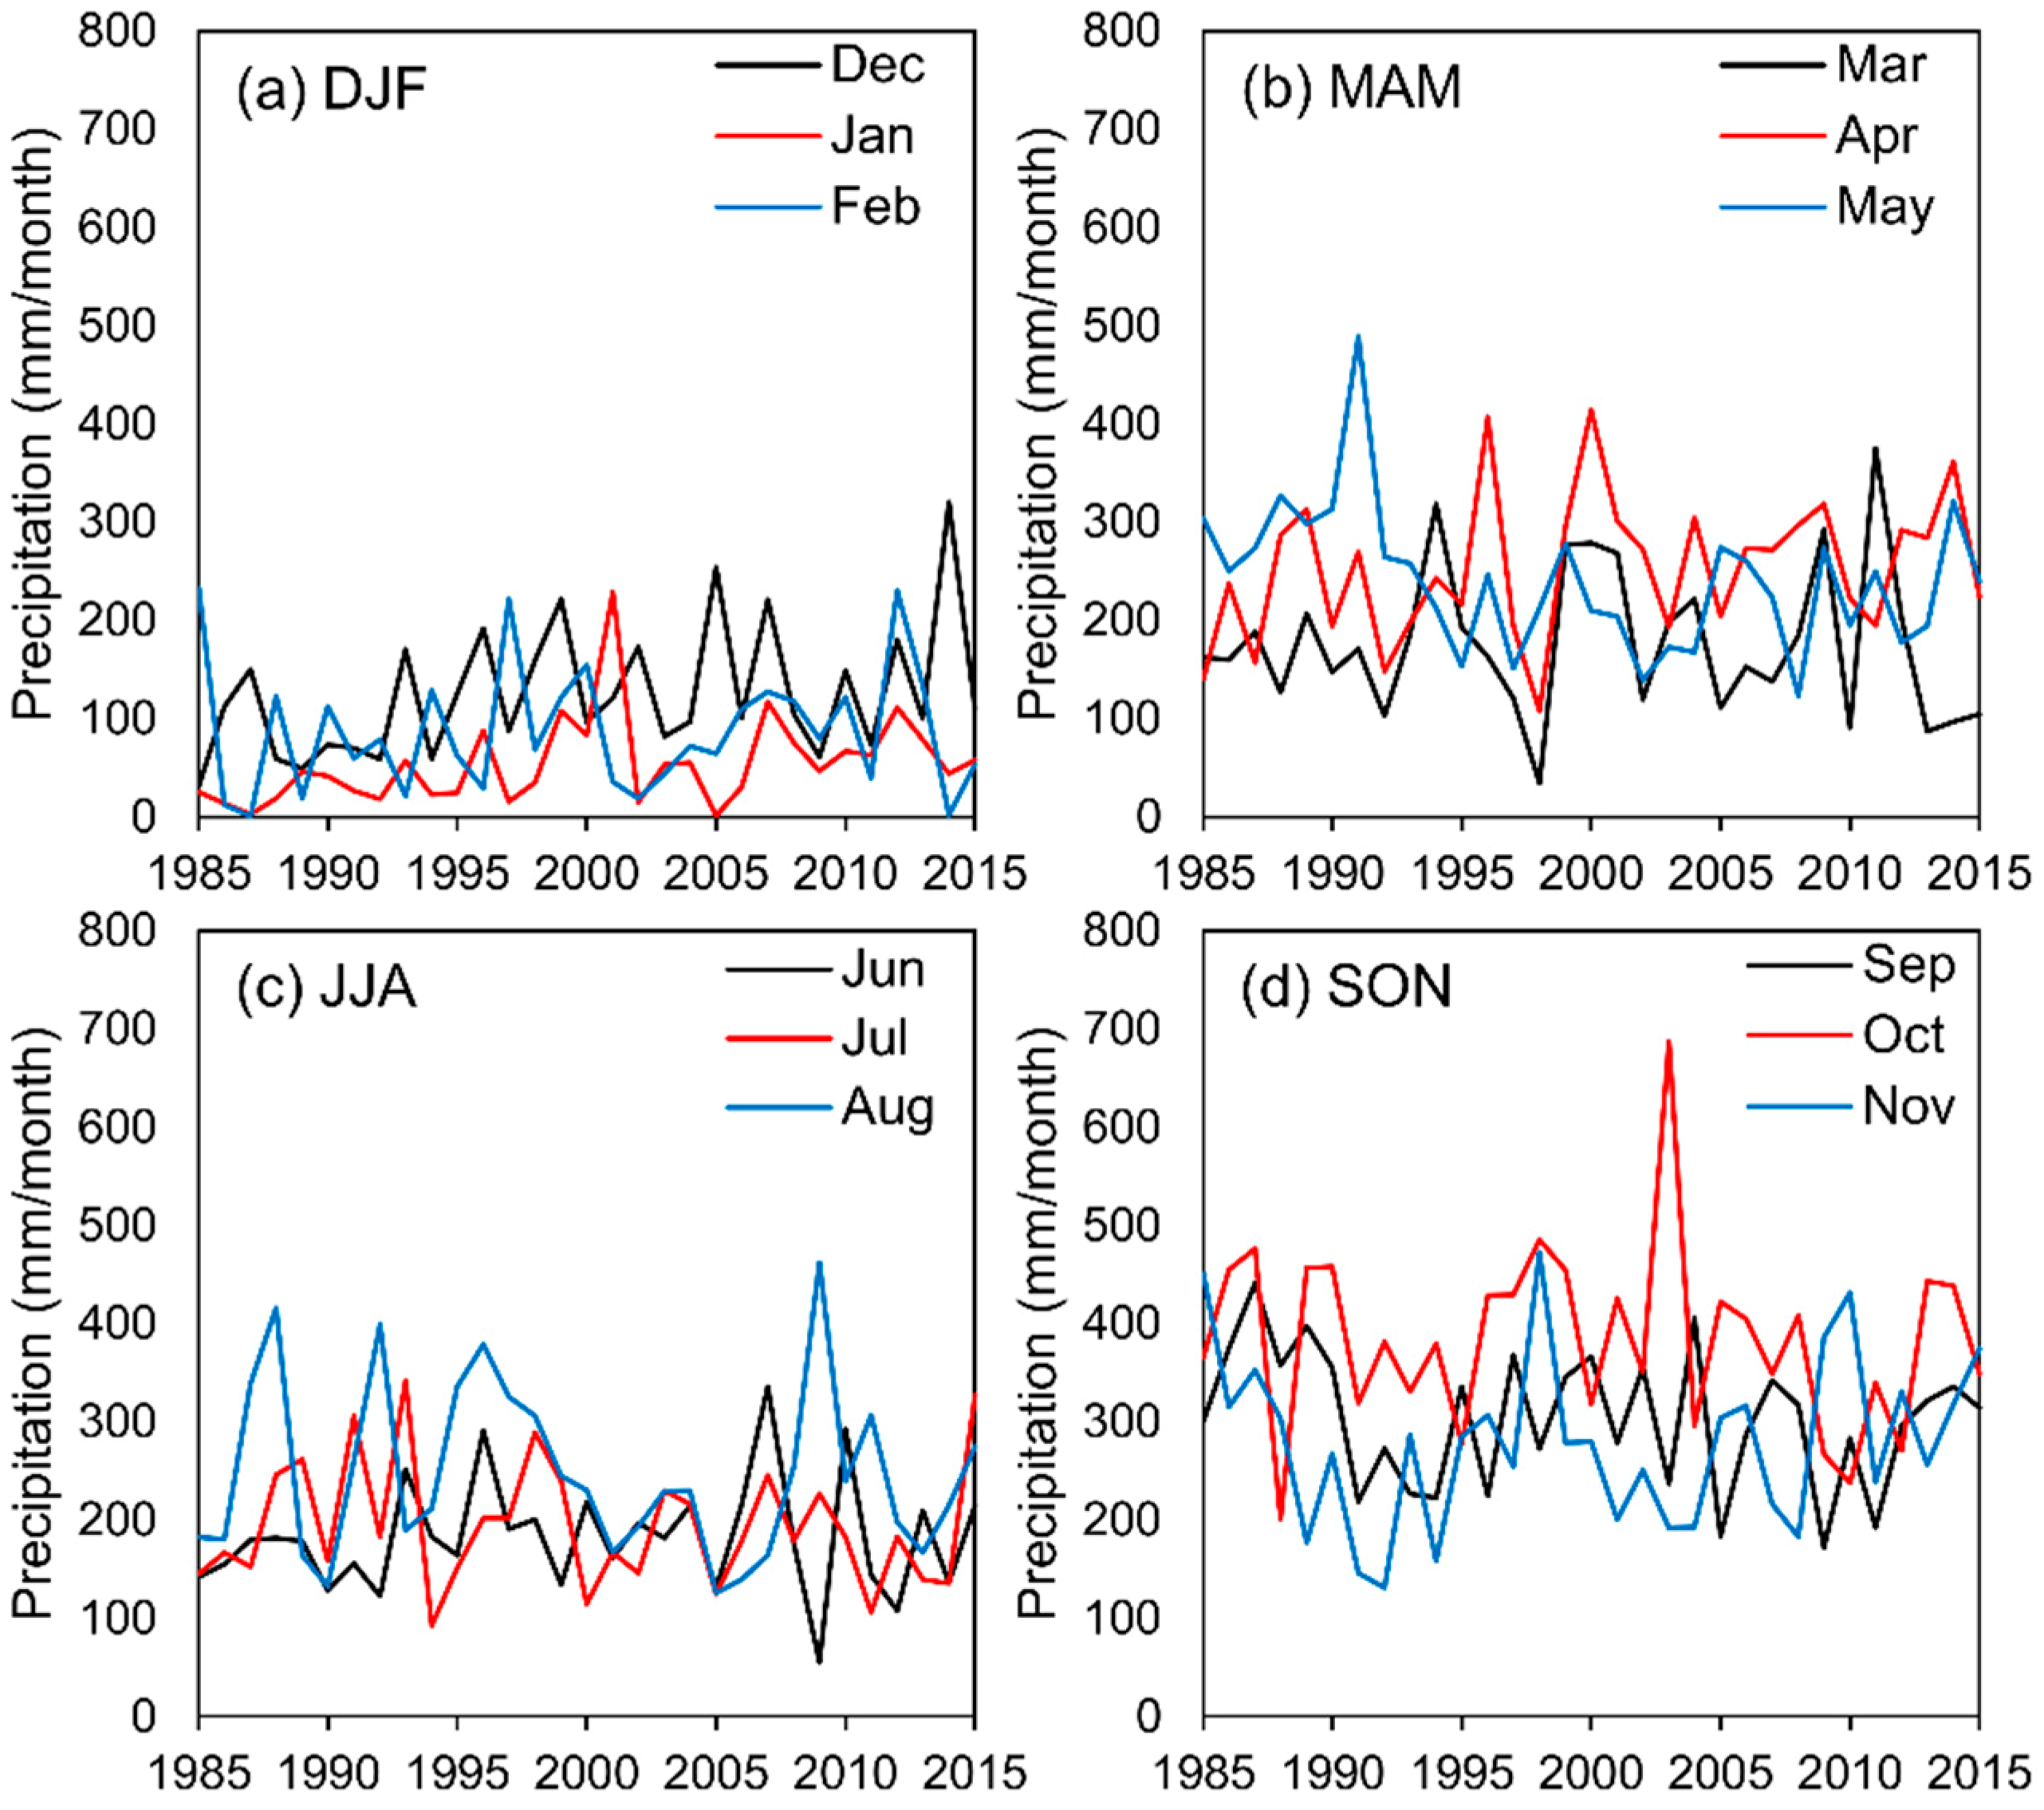
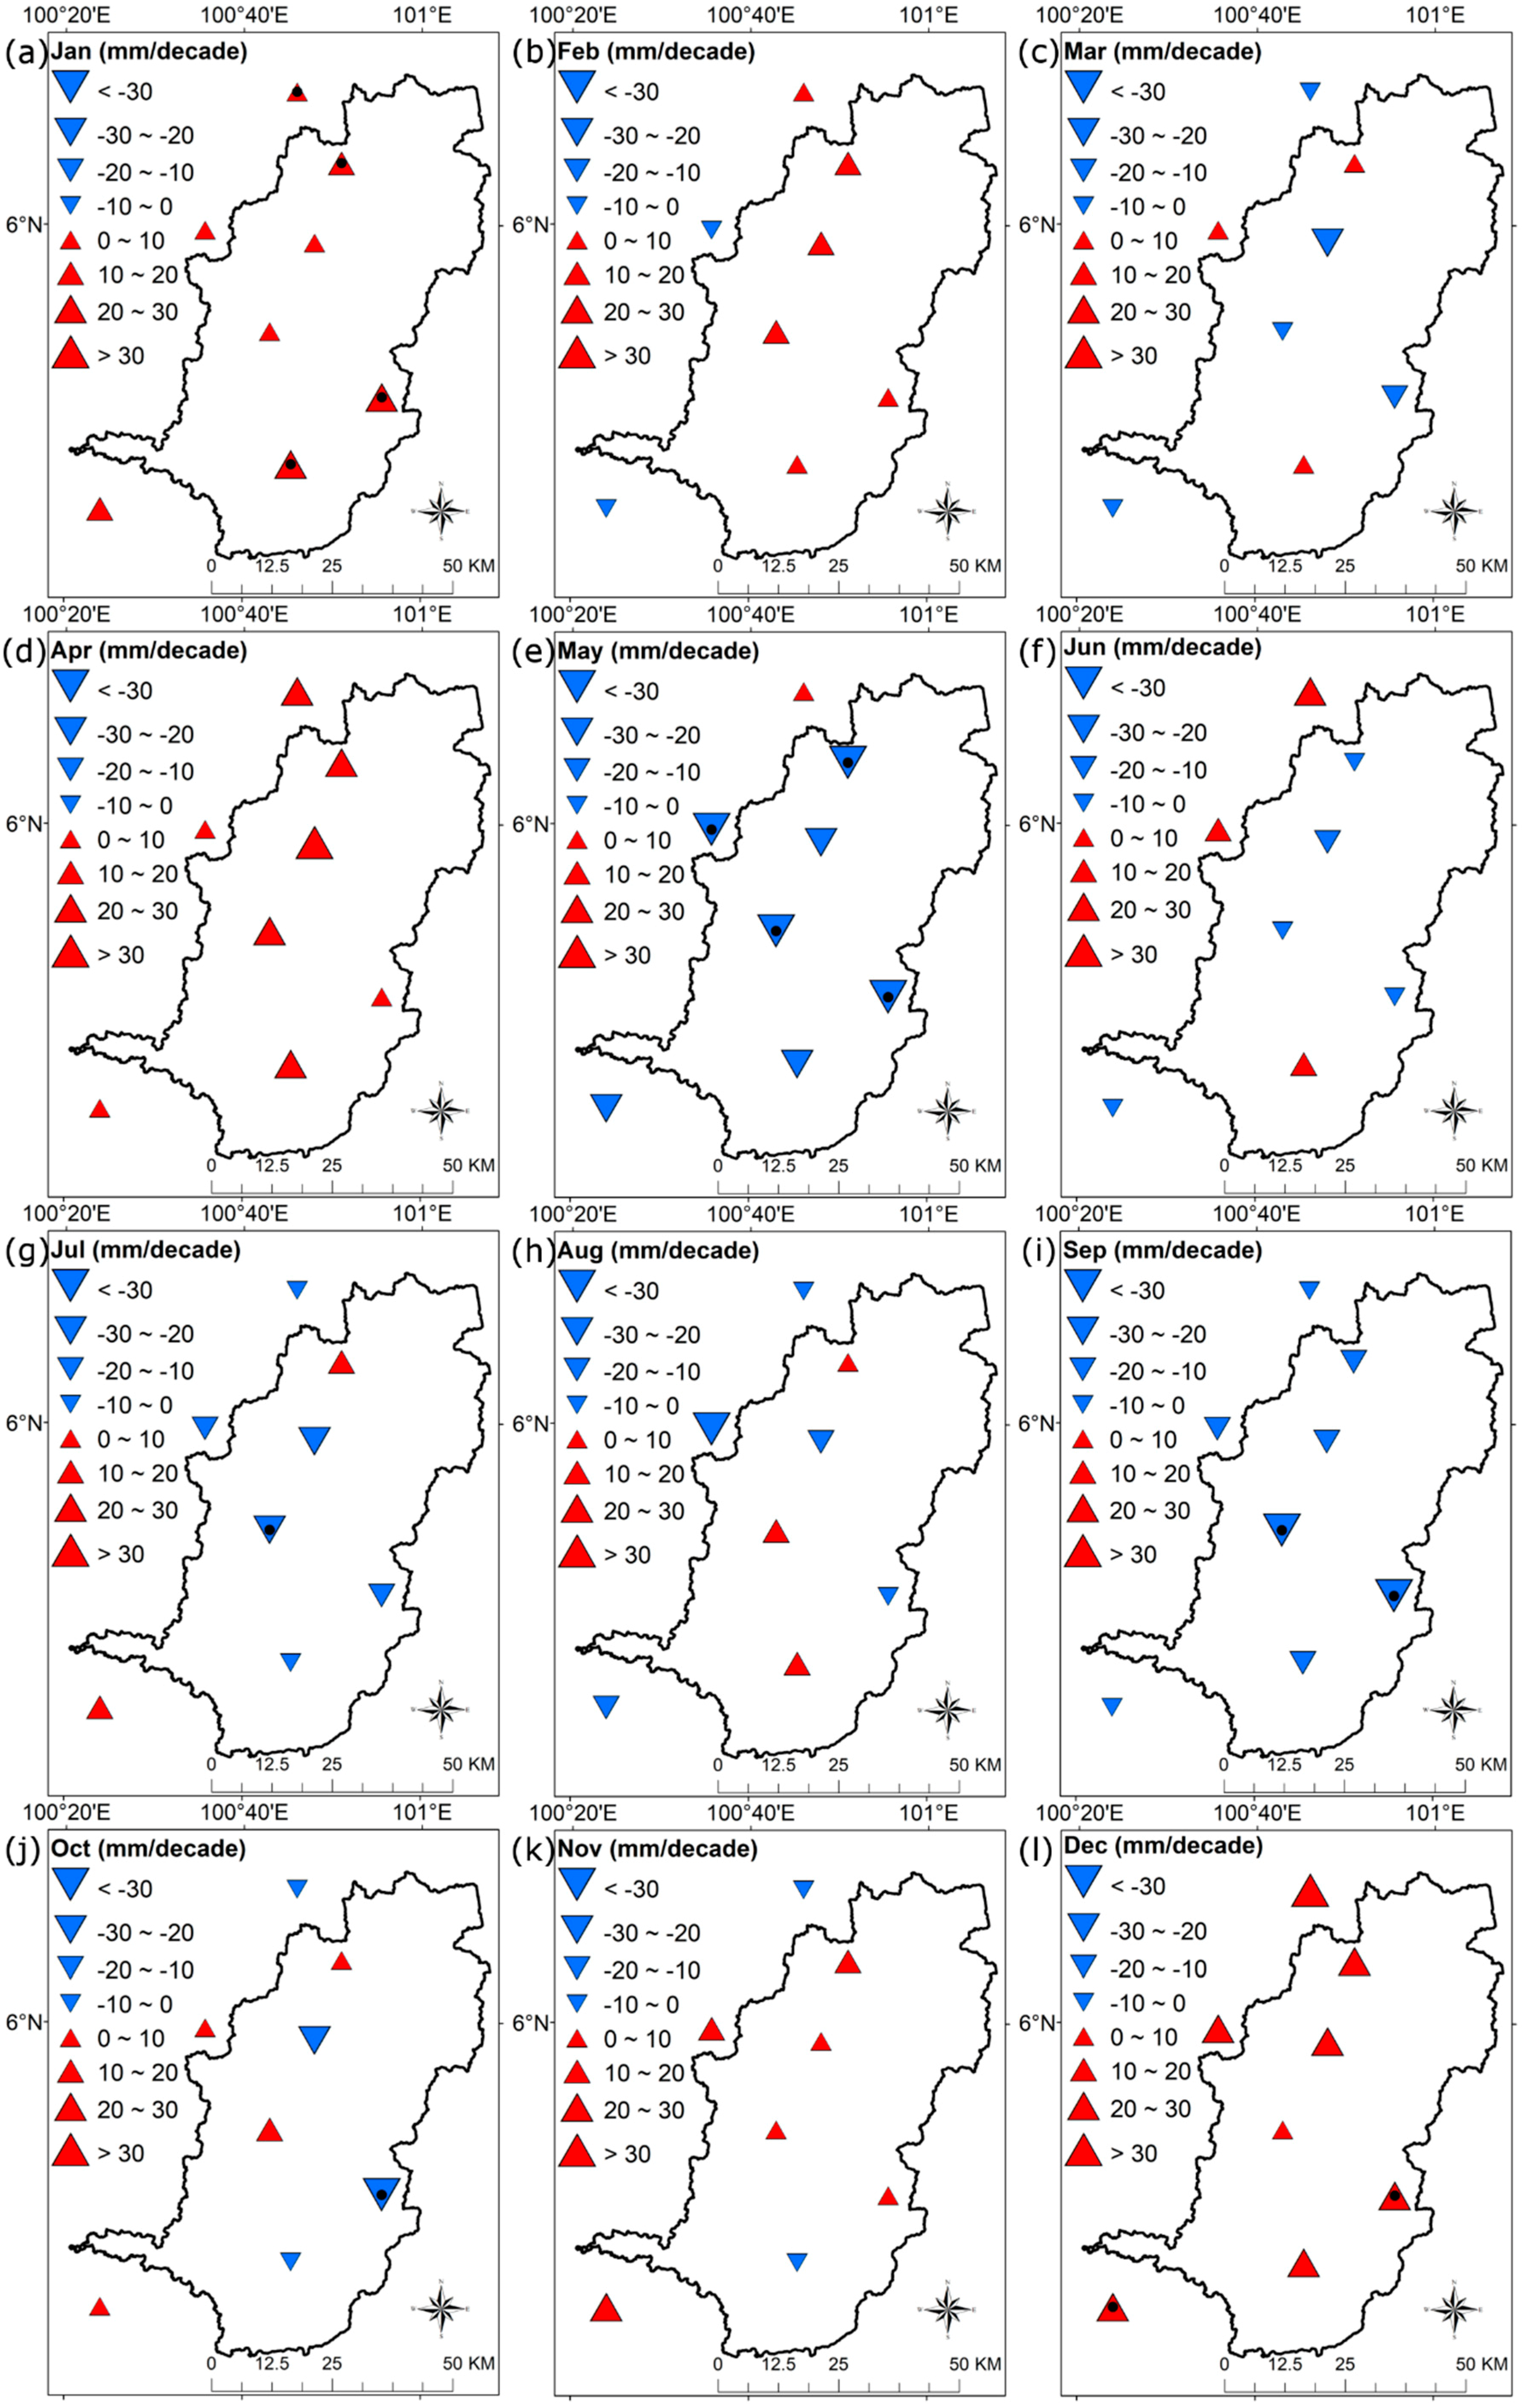
Figure 2 and Figure 3 show the spatial-temporal trends of monthly precipitation over the basin during the 1985–2015 period. The magnitude of monthly precipitation as measured by the Sens’ slope test is listed in Table 3. As the annual precipitation changes can be represented by the PRCPTOT index which is further discussed in Section 4.3, this section is focused solely on the monthly precipitation assessment.
A significant increasing trend of monthly precipitation was found in January and December at a 95% significance level, with changing rates of 17.01 mm/decade and 23.23 mm/decade, respectively. Interestingly, monthly precipitation tended to increase in the low precipitation season in the MRB. For example, Figure 3a shows 50% of the stations had a significant increasing trend in January, the month that received lowest amount of monthly precipitation of the basin, at a 95% significance level. Similarly, most of the stations within the basin showed an increasing trend in monthly precipitation in November, December, February, and April. A possible explanation for the increases of monthly precipitation during these months might be due to a warmer condition in Peninsular Malaysia in the past few decades [29]. Higher temperature increased the water vapor in atmosphere and then, amplified the local convection processes [30]. Therefore, more intense precipitation has been occurred in these periods.
By contrast, a significant decreasing trend was observed in May with a rate of 26.21 mm/decade. Monthly precipitation in March, July, August, September, and October showed a decreasing trend during 1985 to 2015, with magnitudes ranging from 5.74 to 18.81 mm/decade. Figure 3 shows the decreases of monthly precipitation are mainly observed the middle part of the MRB, during the SWM. Consistent with the present result, Wong et al. [31] also found a drier condition during the SWM months in the north-western part of Peninsular Malaysia since the last three decades. This result may be explained by the fact that the El Niño Southern Oscillation (ENSO) signatures are largely limited to the southern equator during the SWM due to the interaction between the background flow and the regional anomalous circulation [31]. Therefore, a lesser impact was found in the MRB that is located in far northern Peninsular Malaysia.
4.3. Annual Trend of Precipitation Extremes
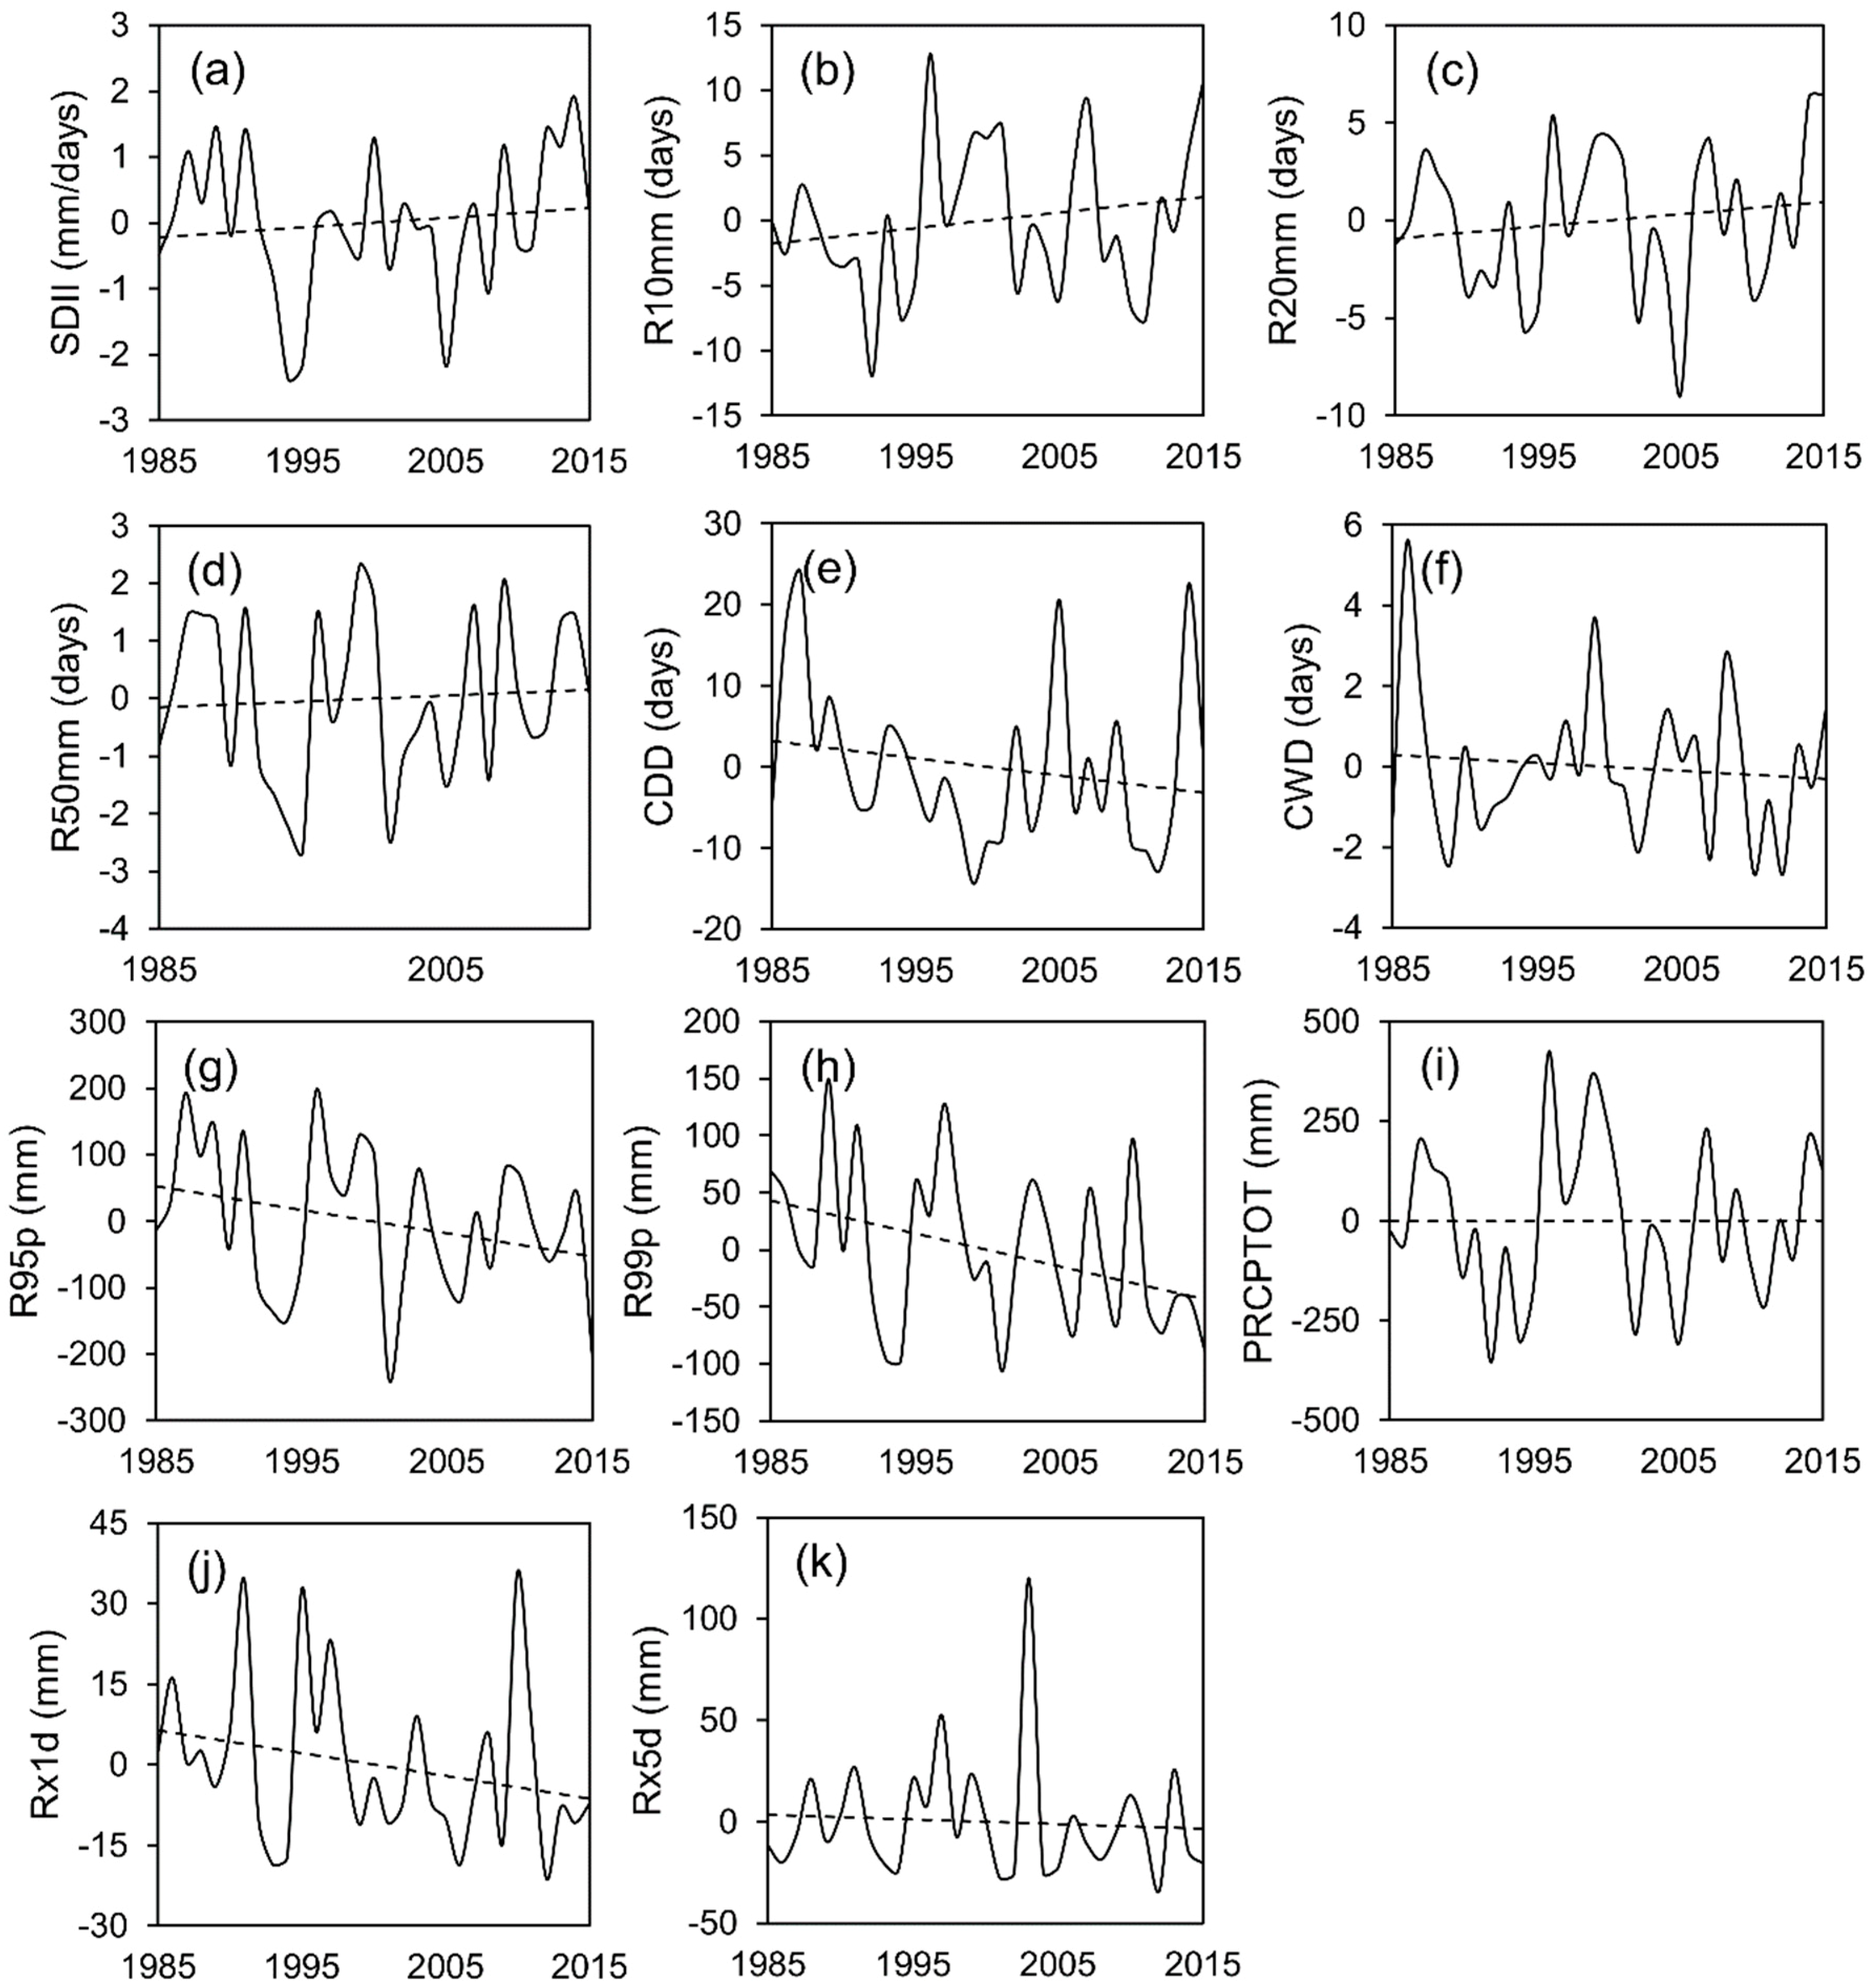
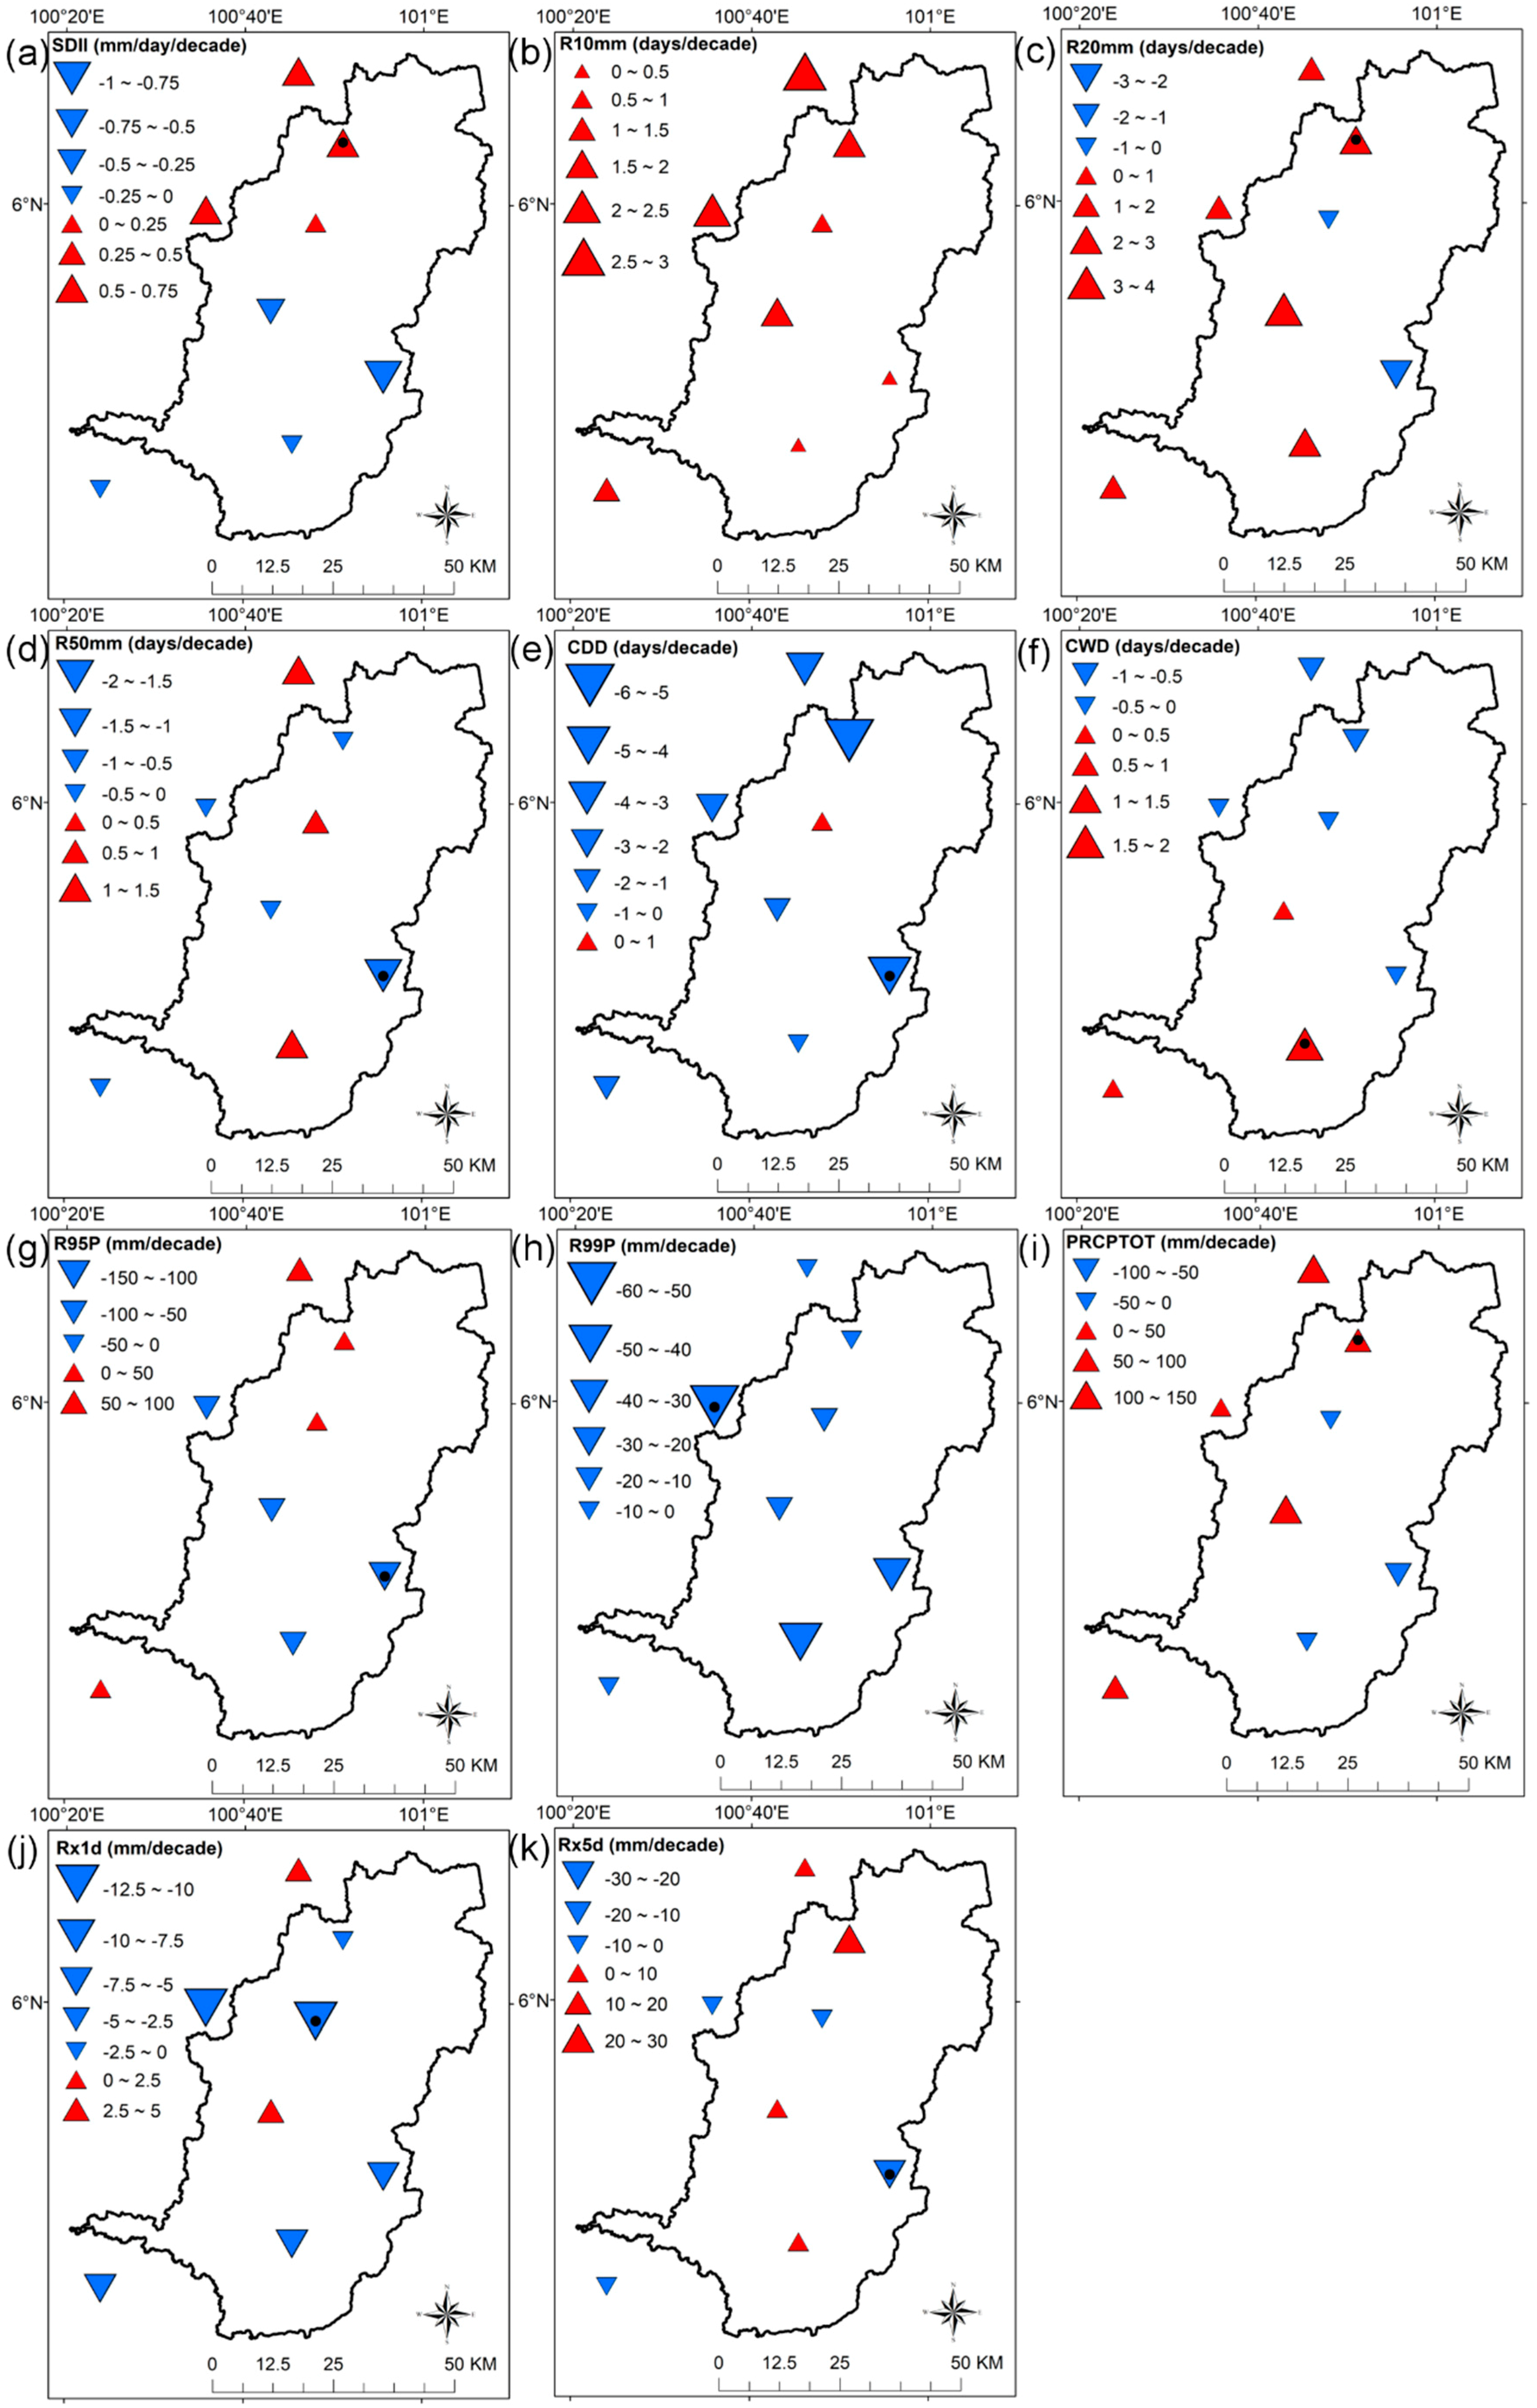
The spatio-temporal annual trends of precipitation extremes from 1985 to 2015 over the MRB are presented in Figure 4 and Figure 5. Overall, most of the precipitation extremes indices denoted insignificant trends, except R99p with a significant decreasing trend, as listed in Table 4. The Ampangan Muda station is the only station that had significant increasing trends at both PRCPTOT and SDII indices, at a 95% significance level. The results showed that the Muda Dam received more precipitation in recent decades. However, strong El Niño events in 1997/1998 and 2016 still resulted in prolonged drought and water crisis in this region. Hence, effective precipitation collection strategies should be implemented to collect and store precipitation during non-El Niño periods.
For indices representing the number of extreme precipitation days, regional increasing trends were found for the R10mm, R20mm, and R50mm indices, with magnitudes of 1.02, 0.59, and 0.13 days/decade, respectively (Table 4). Increasing trends in R10mm and R20mm indices are detected at most of the evaluated stations, as shown in Figure 5b,c, respectively. The current study found that the number of extreme precipitation days are increasing over the MRB, which is in agreement with those obtained in nearby regions, i.e., Singapore [6] and Kelantan River Basin [14]. The regional trend in CDD decreased with a magnitude of 2.69 days/decade, meanwhile CWD increased at a rate of 0.1 days/decade. CDD and CWD showed that the decreasing trends dominate over the north MRB. The only significant increasing CWD trend was observed at the Badenoch Estate station that is located in southern MRB.
In contrast to some Southeast Asia studies [6,25] that indicated tendency of wetter conditions due to increasing R95p and R99p trends, the MRB experienced drier conditions in the period of 1985–2015. This is proven through the reduction of precipitation amount contributed by the extremely wet days. R99p decreased with a rate of 32.37 mm/decade, which is significant at a 95% significance level. Whereas, the decreasing trend of the R95p was 39.76 mm/decade. Apparently, reductions of R95p and R99p were mainly observed at stations in southern MRB as shown in Figure 5g,h.
During the period from 1985–2015, Figure 4j,k and Table 4 indicate decreasing trends of the Rx1d and Rx5d indices of 4.2 mm/decade and 2.5 mm/decade, respectively. The spatial evaluation shows 75% of the stations had decreasing Rx1d trends, with a significant decreasing trend was found in the middle of the MRB, at the Pusat Pertanian Batu Seketol station (41549). Meanwhile, a significant Rx5d decreasing trend was observed at the Hospital Baling station (41545) in the south-western region of the basin. The finding is contrary to that of the Kelantan River Basin in northeastern Peninsular Malaysia where significant increasing trends of Rx1d and Rx5d were reported [14]. These contrasting results may be explained by the geographical difference whereby the Titiwangsa mountain range separates the west coast and the east coast of Peninsular Malaysia. The Titiwangsa mountain range dramatically reduces the intermittent strong cold surges and north-easterly wind blowing from the South China Sea across the peninsular Malaysia during the NEM [11].
4.4. Trend of Temperature Extremes
The temporal trends of the temperature extremes at the Ampangan Muda station are listed in Table 5. Mann–Kendall test showed significant increasing trends in TXmean, TNmean, TX90p, and TN90p, whereas significant decreasing trends in TX10p and TN10p, at a 95% significance level. Annual TXmean and TNmean increased with a rate of 0.22 and 0.32 °C/decade for the period 1985–2015, respectively. The increment of TNmean was larger than TXmean, where significant increasing trends were found in each month (0.16–0.6 °C/decade), except February. Comparison of the findings with other Malaysian studies [29,32] confirms the warmer rate of TNmean in Peninsular Malaysia. The annual DTR exhibited a decreasing trend with a rate of 0.07 °C/decade, indicating the differences between TXmean and TNmean are getting smaller. On a monthly scale, the highest decrease magnitude was occurred in January, with a significant rate of 0.70 °C/decade.
From 1985 to 2015, the warm temperature extreme indices (TXx, TNx, TX90p, and TN90p) exhibited increasing trends, of which the warm nights (TN90p) and warm days (TX90p) with rates of 4.31 %/decade and 3.49 %/decade, respectively. Meanwhile, the trends of the warmest days (TXx) and warmest nights (TNx) were at a rate of 0.07 °C/decade and 0.18 °C/decade, respectively. For monthly scale, significant increasing trends in all the four warm extreme indices were found in July, November and December, with the rates of 0.36~0.40 °C/decade, 0.23~0.43 °C/decade, 3.97~4.88%/decade and 4.13~6.30%/decade for TXx, TNx, TX90p, and TN90p, respectively.
For the cold temperature extreme indices (TXn, TNn, TX10p, and TN10p), increasing trends were observed in the coldest days (TXn) and coldest nights (TNn) by 0.31 °C/decade and 0.65 °C/decade, respectively. By contrast, the frequency of cool days (TX10p) and cool nights (TN10p) decreased by 2.3%/decade and 6.99%/decade, respectively. On the monthly scale, TNn increased significantly in almost every month (0.21~0.72 °C/decade), except February and May, indicating a warmer trend of coldest nights over the basin. Meanwhile, significant decreasing trends were found in TN10p in each month, except February, ranging from 2.91~8.16%/decade.
5. Discussion
The trend on the evaluated temperature extremes indices confirms warmer trends in the MRB, which is similar in nearby countries such as Indonesia [25] and western Thailand [33]. It is interesting to note that most of the highest temperature extremes indices’ values were recorded during the super El Niño in 1997/1998 in this region. The findings are similar to those of Manton et al. [34] who found a reduction in the number of the cold days and nights, and an increase in warmer days and nights in Southeast Asia. A possible explanation for the results may due to the agricultural land expansion and logging activities in this region. Deforestation could heighten the emission of carbon dioxide to the atmosphere, leading to more sun radiations reflect back the earth system. Large-scale deforestation in Southeast Asia leads to a hotter climate over the deforested area [35].
Availability of long-term high-quality climate data remain a critical issue in the Southeast Asia region. For example, the relatively short climate extremes’ trends assessment period was found in studies in Singapore [6], Indonesia [25], Kelantan River Basin [14], and this study, mainly between 1980 to 2015. A good example is that opposite climate extremes’ trends were found between the periods of 1910–1995 and 1961–1998 in Australia [34]. Reliable climate stations do not exist before the late 1950s in some Southeast Asia countries. Therefore, more efforts should be conducted to understand the missing historical climate conditions.
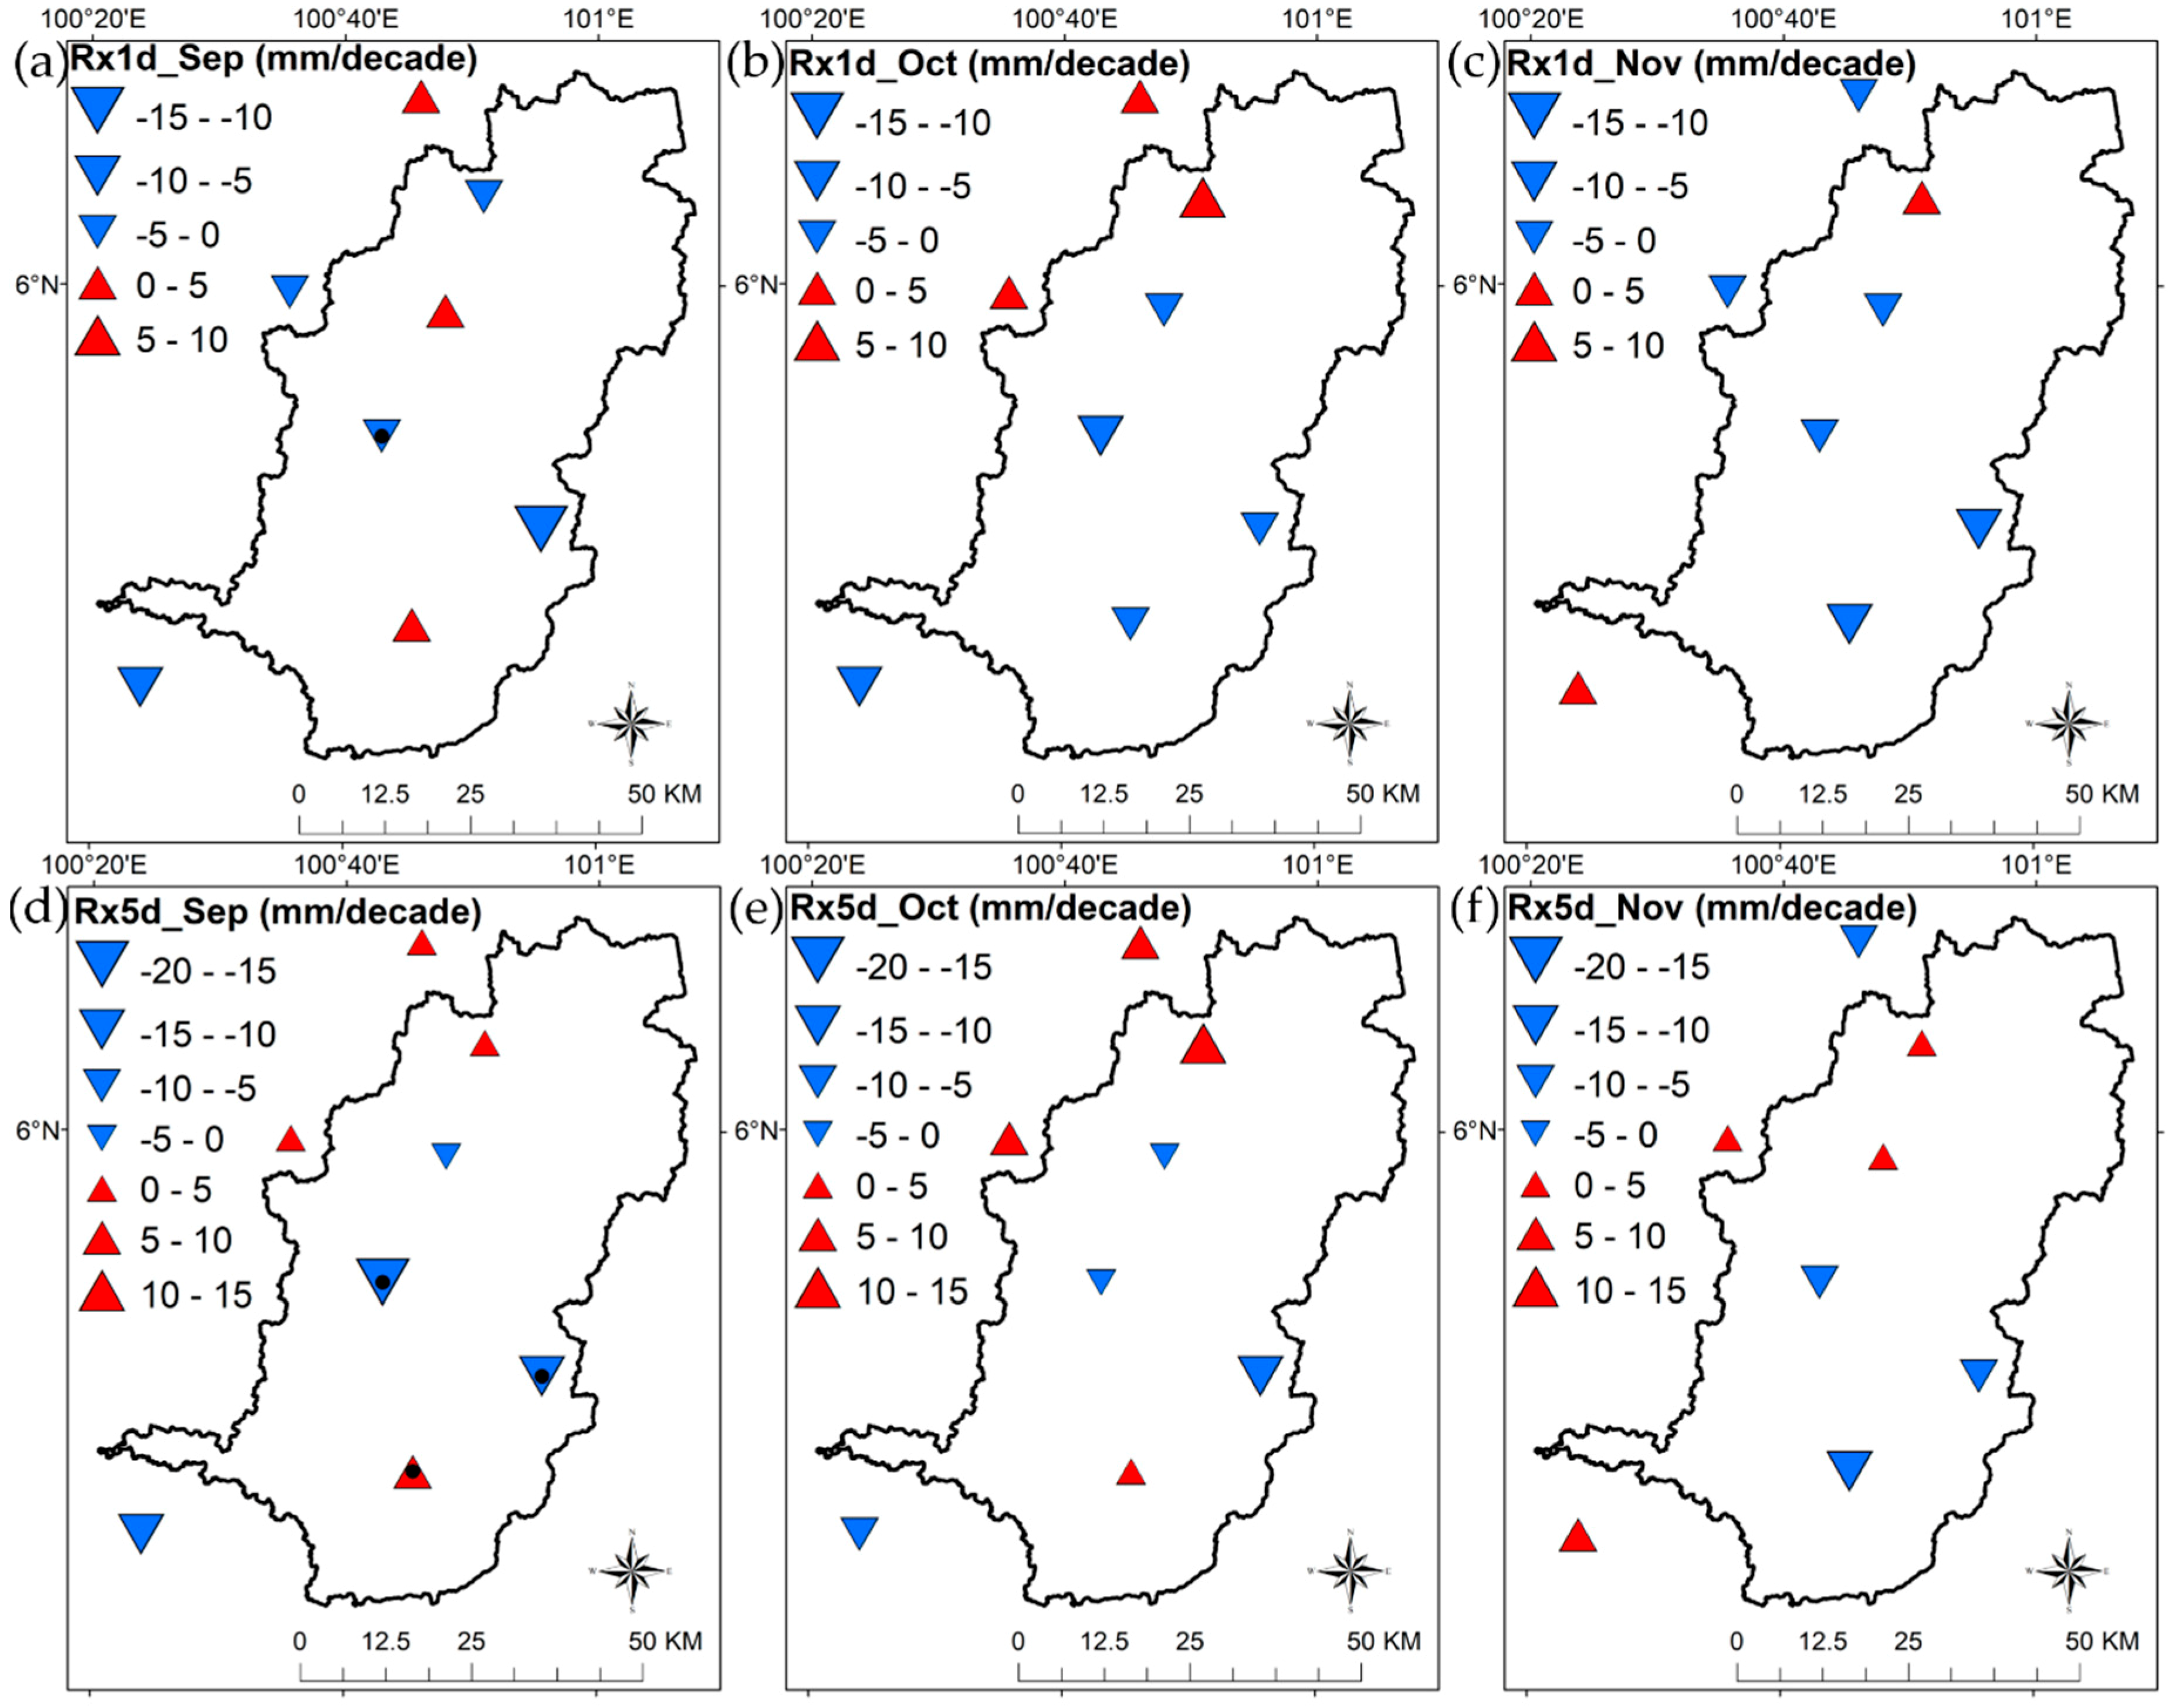
Table 3 shows decreases in Rx1d and Rx5d have been detected in most of the months, ranging from 0.38 to 7.5 mm/decade, except January, February, April, and December. The only opposite trend was found in June, where the Rx1d had a decrease trend of 1.35 mm/decade, while the Rx5d was increased by 5.08 mm/decade. As the Rx1d and Rx5d are flood related indices, the spatial distribution of both indices was further evaluated in the flood period from September to November (Figure 6). A significant decreasing trend was found at the Hospital Baling station in September in both the Rx1d and Rx5d indices, at a 95% significance level. Most of the decreases Rx1d and Rx5d stations were mainly found in the middle and southern regions of the MRB. However, a single extremely high value of the Rx1d or Rx5d could cause massive damage to the basin. For instance, one of the highest Rx5d value (~500 mm) was recorded at the Butterworth station during the destructive 2003 flood. Moreover, climate change impact on the monthly streamflow of the MRB is expected to be more critical after 2040s [36]. Therefore, several flood mitigation strategies have been proposed by Julien et al. [37] to reduce the flood damage in the basin.
Although any drought conditions in Malaysia could be recovered within three months during the dry season [22,38], this natural disaster is still leading to agricultural losses in the region [39]. This is mainly due to the high-water demand from this basin, especially for the paddy irrigation system. North-western Peninsular Malaysia is the “rice bowl” of the country, contributing about 38% of the rice production in Malaysia. Reduction of water level of the reservoirs due to the significant changes of the precipitation and temperature extremes would influence the paddy productivity. For example, increases of the TXmean and TNmean as listed in Table 5 would amplify the evaporation rate of the paddy fields. Local authorities are searching for solutions to reduce the dependency of Penang state on this basin. A possible solution would be exploring new water resources in nearby basins, i.e., Perai River Basin located in southern part of the MRB. Besides that, seawater desalination technology, one of the Singapore’s national tap could also be one of the solutions to reduce the impact of climate extremes on water resources in this region. However, high installation, maintenance and operational costings might be a drawback of the desalination technology.
6. Conclusions
This study evaluated the trends of precipitation and temperature extremes over the MRB from 1985 to 2015 using 22 ETCCDI’s extreme indices. Trend and magnitude changes of high quality and homogeneous climate data from eight stations were analyzed using non-parametric Mann–Kendall, modified Mann–Kendall and Sen’s slope approaches. The main findings can be summarized as follows:
- -
- Interestingly, monthly precipitation tended to increase significantly in January (17.01 mm/decade) and December (23.23 mm/decade), which are among the months that received lowest precipitation amount, at a 95% significance level. Meanwhile, a significant decreasing monthly precipitation was found in May with a rate of 26.21 mm/decade.
- -
- Mann–Kendall test detected significant decreasing trends in annual R99p, TX10p, and TN10p, while significant increasing trends were found in TXmean, TNmean TX90p, and TN90p, at a 95% significance level.
- -
- Regional annual R10mm, R20mm, R50mm, and CWD showed increasing trends from 1985 to 2015, with magnitude changes of 1.02, 0.59, 0.13, and 0.1 days/decade, respectively. By contrast, decreasing trends were found in CDD (2.69 days/decade), R95p (39.76 mm/decade), R99p (32.37 mm/decade), Rx1d (4.21 mm/decade), and Rx5d (2.5 mm/decade).
- -
- Annual TXmean and TNmean at the Ampangan Muda station increased significantly at a rate of 0.22 and 0.32 °C/decade, respectively. Apparently, TNmean increased at a higher rate than TXmean. The differences between TXmean and TNmean are getting smaller due to the decreasing in DTR (0.07 °C/decade).
- -
- Annual TXx, TNx, TX90p, TN90p, TXn, and TNn at the Ampangan Muda station exhibited increasing trends, with magnitude changes of 0.07 °C/decade, 0.18 °C/decade, 3.49%/decade, 4.31%/decade, 0.31 °C/decade and 0.65 °C/decade, respectively. While TX10p and TN10p showed significant decreasing trends at rates of 2.3 and 6.99%/decade, respectively.
Consistent with the literature of Southeast Asia [34], the number of the cool days and nights of the basin tended to decrease, meanwhile increases were found in the warmer days and nights. Moreover, monthly precipitation tended to decrease in the SWM, but increase in the NEM. This study is important as a baseline to evaluate the potential future changes in the precipitation and temperature extremes over the basin. Further research might explore the application of the Coordinated Regional Climate Downscaling Experiments–Southeast Asia (CORDEX-SEA) climate projections in basin-scale climate extremes assessment. Application and validation of satellite precipitation products [28,40,41] in measuring climate extremes could also be considered in the future works. Impact assessment of climate extremes on regional crops productivity [42] such as paddy could also be one of the potential future studies.
Author Contributions
Conceptualization, M.L.T., N.S., and N.W.C.; methodology, M.L.T and C.L.; writing—original draft preparation, M.L.T.; writing—review and editing, M.L.T., N.S., N.W.C., and A.J.L.; project administration, M.L.T.; funding acquisition, M.L.T. and N.S.
Funding
This research was funded by Universiti Sains Malaysia, grant numbers 304/PHUMANITI/6315166 and 1001/PHUMANITI/856002.
Acknowledgments
Special thanks to Malaysian Meteorological Department for providing climate data in this study.
Conflicts of Interest
The authors declare no conflict of interest.
References
- Lee, T.M.; Markowitz, E.M.; Howe, P.D.; Ko, C.Y.; Leiserowitz, A.A. Predictors of public climate change awareness and risk perception around the world. Nat. Clim. Chang. 2015, 5, 1014. [Google Scholar] [CrossRef]
- Schiermeier, Q. Droughts, heatwaves and floods: How to tell when climate change is to blame. Nature 2018, 560, 20–22. [Google Scholar] [CrossRef] [PubMed]
- Kundzewicz, Z.W.; Kanae, S.; Seneviratne, S.I.; Handmer, J.; Nicholls, N.; Peduzzi, P.; Mechler, R.; Bouwer, L.M.; Arnell, N.; Mach, K.; et al. Flood risk and climate change: Global and regional perspectives. Hydrol. Sci. J. 2014, 59, 1–28. [Google Scholar] [CrossRef]
- Boccolari, M.; Malmusi, S. Changes in temperature and precipitation extremes observed in Modena, Italy. Atmos. Res. 2013, 122, 16–31. [Google Scholar] [CrossRef]
- Hoerling, M.; Eischeid, J.; Perlwitz, J.; Quan, X.-W.; Wolter, K.; Cheng, L. Characterizing recent trends in U.S. heavy precipitation. J. Clim. 2016, 29, 2313–2332. [Google Scholar] [CrossRef]
- Li, X.; Wang, X.; Babovic, V. Analysis of variability and trends of precipitation extremes in Singapore during 1980–2013. Int. J. Clim. 2018, 38, 125–141. [Google Scholar] [CrossRef]
- Salman, S.A.; Shahid, S.; Ismail, T.; Chung, E.-S.; Al-Abadi, A.M. Long-term trends in daily temperature extremes in Iraq. Atmos. Res. 2017, 198, 97–107. [Google Scholar] [CrossRef]
- Worku, G.; Teferi, E.; Bantider, A.; Dile, Y.T. Observed changes in extremes of daily rainfall and temperature in Jemma sub-basin, Upper Blue Nile Basin, Ethiopia. Appl. Clim. 2018. [Google Scholar] [CrossRef]
- Shrestha, A.B.; Bajracharya, S.R.; Sharma, A.R.; Duo, C.; Kulkarni, A. Observed trends and changes in daily temperature and precipitation extremes over the Koshi River Basin 1975–2010. Int. J. Clim. 2017, 37, 1066–1083. [Google Scholar] [CrossRef]
- Song, X.; Song, S.; Sun, W.; Mu, X.; Wang, S.; Li, J.; Li, Y. Recent changes in extreme precipitation and drought over the Songhua River Basin, China, during 1960–2013. Atmos. Res. 2015, 157, 137–152. [Google Scholar] [CrossRef]
- Tangang, F.; Farzanmanesh, R.; Mirzaei, A.; Supari; Salimun, E.; Jamaluddin, A.F.; Juneng, L. Characteristics of precipitation extremes in Malaysia associated with El Niño and La Niña events. Int. J. Clim. 2017, 37, 696–716. [Google Scholar] [CrossRef]
- Wan Zin, W.Z.; Jamaludin, S.; Deni, S.M.; Jemain, A.A. Recent changes in extreme rainfall events in Peninsular Malaysia: 1971–2005. Appl. Clim. 2010, 99, 303. [Google Scholar] [CrossRef]
- Suhaila, J.; Deni, S.M.; Wan Zin, W.Z.; Jemain, A.A. Spatial patterns and trends of daily rainfall regime in Peninsular Malaysia during the southwest and northeast monsoons: 1975–2004. Meteorol. Atmos. Phys. 2010, 110, 1–18. [Google Scholar] [CrossRef]
- Tan, M.L.; Ibrahim, A.L.; Cracknell, A.P.; Yusop, Z. Changes in precipitation extremes over the Kelantan River Basin, Malaysia. Int. J. Clim. 2017, 37, 3780–3797. [Google Scholar] [CrossRef]
- Ibrahim, A.L.; Chan, N.W. Water balance analysis in relation to wet rice cultivation in the Muda region of Kedah and Perlis, Malaysia. Malays. Agric. J. 1996, 55, 34–57. [Google Scholar]
- Ghani, A.A.; Ali, R.; Zakaria, N.A.; Hasan, Z.A.; Chang, C.K.; Ahamad, M.S.S. A temporal change study of the Muda River system over 22 years. Int. J. River Basin Manag. 2010, 8, 25–37. [Google Scholar] [CrossRef]
- Lee, K.F. A Background Study: Economic Benefits of the Muda Water Catchment; World Wide Fund for Nature (Formerly World Wildlife Fund): Petaling Jaya, Malaysia, 2009. [Google Scholar]
- PBA. PBA Holdings Bhd Annual Report 2016. 2016. Available online: https://www.pbahb.com.my/?page_id=564 (accessed on 15 October 2018).
- Tukimat, N.N.A.; Harun, S. Climate change impact on rainfall and temperature in muda irrigation area using multicorrelation matrix and downscaling method. J. Water Clim. Chang. 2015, 6, 647–660. [Google Scholar] [CrossRef]
- Peterson, T.C.; Easterling, D.R.; Karl, T.R.; Groisman, P.; Nicholls, N.; Plummer, N.; Torok, S.; Auer, I.; Boehm, R.; Gullett, D.; et al. Homogeneity adjustments of in situ atmospheric climate data: A review. Int. J. Clim. 1998, 18, 1493–1517. [Google Scholar] [CrossRef]
- Wijngaard, J.B.; Klein Tank, A.M.G.; Können, G.P. Homogeneity of 20th century European daily temperature and precipitation series. Int. J. Clim. 2003, 23, 679–692. [Google Scholar] [CrossRef]
- Tan, M.L.; Chua, V.P.; Li, C.; Brindha, K. Spatiotemporal analysis of hydro-meteorological drought in the Johor River Basin, Malaysia. Appl. Clim. 2018. [Google Scholar] [CrossRef]
- Cox, D.R.; Stuart, A. Some quick sign tests for trend in location and dispersion. Biometrika 1955, 42, 80–95. [Google Scholar] [CrossRef]
- Hamed, K.H.; Rao, R.A. A modified Mann–Kendall trend test for autocorrelated data. J. Hydrol. 1998, 204, 182–196. [Google Scholar] [CrossRef]
- Supari; Tangang, F.; Juneng, L.; Aldrian, E. Observed changes in extreme temperature and precipitation over Indonesia. Int. J. Clim. 2017, 37, 1979–1997. [Google Scholar] [CrossRef]
- Feng, R.; Yu, R.; Zheng, H.; Gan, M. Spatial and temporal variations in extreme temperature in Central Asia. Int. J. Clim. 2018, 38, e388–e400. [Google Scholar] [CrossRef]
- Tan, M.L.; Ibrahim, A.L.; Yusop, Z.; Duan, Z.; Ling, L. Impacts of land-use and climate variability on hydrological components in the Johor River Basin, Malaysia. Hydrol. Sci. J. 2015, 60, 873–889. [Google Scholar] [CrossRef]
- Tan, M.; Ibrahim, A.; Duan, Z.; Cracknell, A.; Chaplot, V. Evaluation of six high-resolution satellite and ground-based precipitation products over Malaysia. Remote Sens. 2015, 7, 1504–1528. [Google Scholar] [CrossRef]
- Suhaila, J.; Yusop, Z. Trend analysis and change point detection of annual and seasonal temperature series in Peninsular Malaysia. Meteorol. Atmos. Phys. 2018, 130, 565–581. [Google Scholar] [CrossRef]
- Loo, Y.Y.; Billa, L.; Singh, A. Effect of climate change on seasonal monsoon in asia and its impact on the variability of monsoon rainfall in Southeast Asia. Geosci. Front. 2015, 6, 817–823. [Google Scholar] [CrossRef]
- Wong, C.; Liew, J.; Yusop, Z.; Ismail, T.; Venneker, R.; Uhlenbrook, S. Rainfall characteristics and regionalization in Peninsular Malaysia based on a high resolution gridded data set. Water 2016, 8, 500. [Google Scholar] [CrossRef]
- Amirabadizadeh, M.; Huang, Y.F.; Lee, T.S. Recent trends in temperature and precipitation in the Langat River Basin, Malaysia. Adv. Meteorol. 2015, 2015, 579437. [Google Scholar] [CrossRef]
- Sharma, D.; Babel, M.S. Trends in extreme rainfall and temperature indices in the Western Thailand. Int. J. Clim. 2014, 34, 2393–2407. [Google Scholar] [CrossRef]
- Manton, M.J.; Della-Marta, P.M.; Haylock, M.R.; Hennessy, K.J.; Nicholls, N.; Chambers, L.E.; Collins, D.A.; Daw, G.; Finet, A.; Gunawan, D.; et al. Trends in extreme daily rainfall and temperature in Southeast Asia and the South Pacific: 1961–1998. Int. J. Clim. 2001, 21, 269–284. [Google Scholar] [CrossRef]
- Lawrence, D.; Vandecar, K. Effects of tropical deforestation on climate and agriculture. Nat. Clim. Chang. 2014, 5, 27. [Google Scholar] [CrossRef]
- Amin, M.Z.M.; Shaaban, A.J.; Ercan, A.; Ishida, K.; Kavvas, M.L.; Chen, Z.Q.; Jang, S. Future climate change impact assessment of watershed scale hydrologic processes in Peninsular Malaysia by a regional climate model coupled with a physically-based hydrology modelo. Sci. Total Environ. 2017, 575, 12–22. [Google Scholar] [CrossRef] [PubMed]
- Julien, P.Y.; Ghani, A.A.; Zakaria, N.A.; Abdullah, R.; Chang, C.K. Case study: Flood mitigation of the Muda River, malaysia. J. Hydraul. Eng. 2010, 136, 251–261. [Google Scholar] [CrossRef]
- Sanusi, W.; Jemain, A.A.; Zin, W.Z.W.; Zahari, M. The drought characteristics using the first-order homogeneous markov chain of monthly rainfall data in Peninsular Malaysia. Water Resour. Manag. 2015, 29, 1523–1539. [Google Scholar] [CrossRef]
- Tan, M.L.; Tan, K.C.; Chua, V.P.; Chan, N.W. Evaluation of TRMM product for monitoring drought in the Kelantan River Basin, Malaysia. Water 2017, 9, 57. [Google Scholar] [CrossRef]
- Tan, M.L.; Santo, H. Comparison of GPM IMERG, TMPA 3B42 and PERSIANN-CDR satellite precipitation products over Malaysia. Atmos. Res. 2018, 202, 63–76. [Google Scholar] [CrossRef]
- Tan, M.L.; Chua, V.P.; Tan, K.C.; Brindha, K. Evaluation of TMPA 3B43 and NCEP-CFSR precipitation products in drought monitoring over Singapore. Int. J. Remote Sens. 2018, 39, 2089–2104. [Google Scholar] [CrossRef]
- Huang, J.; Zhang, F.; Zhou, L.; Hu, Z.; Li, Y. Regional changes of climate extremes and its effect on rice yield in Jiangsu Province, Southeast China. Environ. Earth Sci. 2018, 77, 106. [Google Scholar] [CrossRef]
Figure 1.
(a) Muda River Basin, (b) Peninsular Malaysia, and (c) the climatology of precipitation, maximum and minimum temperature from 1985 to 2015.
Figure 1.
(a) Muda River Basin, (b) Peninsular Malaysia, and (c) the climatology of precipitation, maximum and minimum temperature from 1985 to 2015.

Figure 2.
Temporal trends of monthly precipitation of the Muda River Basin in (a) December–January–February (DJF), (b) March–April–May (MAM), (c) June–July–August (JJA), and (d) September–October–November (SON) seasons from 1985 to 2015.
Figure 2.
Temporal trends of monthly precipitation of the Muda River Basin in (a) December–January–February (DJF), (b) March–April–May (MAM), (c) June–July–August (JJA), and (d) September–October–November (SON) seasons from 1985 to 2015.

Figure 3.
Spatial changes of monthly precipitation over the Muda River Basin from 1985 to 2015. Black dots indicate significant trend at a 95% significance level.
Figure 3.
Spatial changes of monthly precipitation over the Muda River Basin from 1985 to 2015. Black dots indicate significant trend at a 95% significance level.

Figure 4.
Regionally averaged anomaly of various precipitation extremes over the Muda River Basin from 1985 to 2015, (a) SDII; (b) R10mm; (c) R20mm; (d) R50mm; (e) CDD; (f) CWD; (g) R95p; (h) R99p; (i) PRCPTOT; (j) Rx1d; (k) Rx5d.
Figure 4.
Regionally averaged anomaly of various precipitation extremes over the Muda River Basin from 1985 to 2015, (a) SDII; (b) R10mm; (c) R20mm; (d) R50mm; (e) CDD; (f) CWD; (g) R95p; (h) R99p; (i) PRCPTOT; (j) Rx1d; (k) Rx5d.

Figure 5.
Spatial distribution of precipitation extremes trends and magnitude over the Muda River Basin from 1985 to 2015. Black dots indicate significant trend at a 95% significance level. (a) SDII; (b) R10mm; (c) R20mm; (d) R50mm; (e) CDD; (f) CWD; (g) R95p; (h) R99p; (i) PRCPTOT; (j) Rx1d; (k) Rx5d.

Figure 6.
Trend for regionally averaged Rx1d and Rx5d indices over the Muda River Basin during 1985–2015. Dotted indicates significant trend at a 95% significance level. (a) Rx1d–September; (b) Rx1d–October; (c) Rx1d–November; (d) Rx5d–September; (e) Rx5d–October; (f) Rx5d–November.
Figure 6.
Trend for regionally averaged Rx1d and Rx5d indices over the Muda River Basin during 1985–2015. Dotted indicates significant trend at a 95% significance level. (a) Rx1d–September; (b) Rx1d–October; (c) Rx1d–November; (d) Rx5d–September; (e) Rx5d–October; (f) Rx5d–November.


Table 1.
Stations information and rainfall missing values
| No | Station | Name | Latitude | Longitude | Elevation (m) | Missing (%) |
|---|---|---|---|---|---|---|
| 1 | 41526 | Badenoch Estate | 5.55 | 100.76 | 40.00 | 2.54 |
| 2 | 41543 | Hospital Sungai Petani | 5.65 | 100.50 | 8.00 | 2.32 |
| 3 | 41545 | Hospital Baling | 5.68 | 100.93 | 52.00 | 0.30 |
| 4 | 41548 | Pusat Pertanian Charok Padang | 5.80 | 100.72 | 31.00 | 5.74 |
| 5 | 41549 | Pusat Pertanian Batu Seketol | 5.97 | 100.80 | 71.00 | 2.29 |
| 6 | 41559 | Felda Sungai Tiang | 5.99 | 100.60 | 38.00 | 0.00 |
| 7 | 41619 | Ampangan Pedu | 6.25 | 100.77 | 58.60 | 0.39 |
| 8 | 41638 | Ampangan Muda * | 6.12 | 100.85 | 110.00 | 0.00 |
| 9 | 48602 | Butterworth | 5.47 | 100.40 | 2.80 | 0.00 |
* station contains Tmax and Tmin data.
Table 2.
Precipitation and temperature indices used in this study.
| Index | Name | Detail | Unit |
|---|---|---|---|
| Precipitation | |||
| SDII | Simple daily intensity index | Annual total precipitation divided by the number of wet days in the years | mm/days |
| R10mm | Number of heavy precipitation days | Annual count of days when precipitation ≥ 10 mm | Days |
| R20mm | Number of very heavy precipitation days | Annual count of days when precipitation ≥ 20 mm | Days |
| R50mm | Number of violent precipitation days | Annual count of days when precipitation ≥ 50 mm | Days |
| CDD | Consecutive dry days | Maximum number of consecutive days with rainfall < 1 mm | Days |
| CWD | Consecutive wet days | Maximum number of consecutive days with rainfall ≥ 1 mm | Days |
| R95p | Very wet days | Annual total precipitation when rainfall > 95th percentile | mm |
| R99p | Extremely wet days | Annual total precipitation when rainfall > 99th percentile | mm |
| PRCPTOT | Annual total wet-day precipitation | Annual total precipitation in wet days (rainfall > 1 mm) | mm |
| Rx1day | Max 1-day precipitation amount | Annual or Monthly maximum 1-day precipitation | mm |
| Rx5day | Max 5-day precipitation amount | Annual or Monthly maximum 5-day precipitation | mm |
| Temperature | |||
| TXmean | Mean of Maximum Temperature | Annual or Monthly Tmaxmean | °C |
| TNmean | Mean of Minimum temperature | Annual or Monthly Tminmean | °C |
| DTR | Diurnal temperature range | Monthly mean difference between Tmax and Tmin | °C |
| TXx | Maximum Tmax | Monthly maximum value of daily maximum temperature | °C |
| TNx | Maximum Tmin | Monthly maximum value of daily minimum temperature | °C |
| TXn | Minimum Tmax | Monthly minimum value of daily maximum temperature | °C |
| TNn | Minimum Tmin | Monthly minimum value of daily minimum temperature | °C |
| TX10p | Cool days | Percentage of days when TX < 10th percentile | % |
| TN10p | Cool nights | Percentage of days when TN < 10th percentile | % |
| TX90p | Warm days | Percentage of days when TX > 90th percentile | % |
| TN90p | Warm nights | Percentage of days when TN > 90th percentile | % |
Table 3.
Magnitude of the monthly precipitation, Rx1d, and Rx5d indices from 1985 to 2015. Bold color indicates significant trend at a 95% significance level.
Table 3.
Magnitude of the monthly precipitation, Rx1d, and Rx5d indices from 1985 to 2015. Bold color indicates significant trend at a 95% significance level.
| Month | Precipitation (mm/decade) | Rx1d (mm/decade) | Rx5d (mm/decade) |
|---|---|---|---|
| January | 17.01 | 6.83 | 15.05 |
| February | 10.33 | 4.61 | 10.56 |
| March | −8.15 | −2.19 | −0.38 |
| April | 22.05 | 1.27 | 8.96 |
| May | −26.21 | −4.35 | −7.50 |
| June | 9.63 | −1.35 | 5.08 |
| July | −5.74 | −1.63 | −6.27 |
| August | −9.74 | −3.61 | −3.99 |
| September | −18.81 | −1.65 | −2.55 |
| October | −18.22 | −1.82 | −2.33 |
| November | 11.27 | −1.05 | −7.47 |
| December | 23.23 | 3.92 | 4.19 |
Table 4.
Magnitude of the annual precipitation extreme indices from 1985 to 2015. Bold color indicates significant trend at a 95% significance level.
Table 4.
Magnitude of the annual precipitation extreme indices from 1985 to 2015. Bold color indicates significant trend at a 95% significance level.
| Indices | Overall Trend | Station Trend | |
|---|---|---|---|
| Min | Max | ||
| SDII (mm/days/decade) | 0.08 | −1.00 | 0.69 |
| R10mm (days/decade) | 1.02 | 0.00 | 2.73 |
| R20mm (days/decade) | 0.59 | −2.14 | 3.33 |
| R50mm (days/decade) | 0.13 | −1.67 | 1.29 |
| CDD (days/decade) | −2.69 | −5.71 | 0.95 |
| CWD (days/decade) | 0.10 | −0.77 | 1.54 |
| R95P (mm/decade) | −39.76 | −122.46 | 65.87 |
| R99P (mm/decade) | −32.37 | −50.08 | 0.00 |
| PRCPTOT (mm/decade) | −4.99 | −99.14 | 116.60 |
| Rx1d (mm/decade) | −4.21 | −10.18 | 3.88 |
| Rx5d (mm/decade) | −2.50 | −21.09 | 24.69 |
Table 5.
Temperature extreme trends at station 41638 from 1985 to 2015. Bold color indicates significant trend at a 95% significance level.
Table 5.
Temperature extreme trends at station 41638 from 1985 to 2015. Bold color indicates significant trend at a 95% significance level.
| Month | TXmean | TNmean | DTR | TXx | TNx | TXn | TNn | TX10p | TN10p | TX90p | TN90p |
|---|---|---|---|---|---|---|---|---|---|---|---|
| January | −0.03 | 0.60 | −0.70 | −0.11 | 0.39 | −0.84 | 0.72 | 1.08 | −8.16 | 0.00 | 5.37 |
| February | 0.07 | 0.18 | −0.14 | 0.11 | 0.39 | 0.22 | 0.36 | 0.00 | −1.98 | 0.00 | 1.98 |
| March | 0.23 | 0.32 | 0.00 | 0.24 | 0.12 | 0.15 | 0.67 | 0.00 | −6.30 | 0.00 | 3.58 |
| April | 0.15 | 0.27 | −0.13 | 0.25 | 0.11 | 0.46 | 0.56 | −0.73 | −6.66 | 0.00 | 3.49 |
| May | 0.24 | 0.16 | 0.07 | 0.25 | 0.22 | 0.67 | 0.12 | −2.02 | −3.93 | 0.00 | 3.35 |
| June | 0.33 | 0.20 | 0.12 | 0.33 | 0.13 | 0.53 | 0.53 | −2.86 | −3.84 | 3.20 | 2.11 |
| July | 0.33 | 0.30 | −0.01 | 0.36 | 0.43 | 0.22 | 0.44 | −0.96 | −6.36 | 4.88 | 4.13 |
| August | 0.41 | 0.20 | 0.20 | 0.56 | 0.14 | 0.16 | 0.25 | −3.23 | −3.67 | 5.21 | 3.22 |
| September | 0.39 | 0.25 | 0.20 | 0.33 | 0.20 | 0.36 | 0.29 | −3.00 | −4.76 | 3.32 | 2.68 |
| October | 0.34 | 0.18 | 0.14 | 0.25 | 0.07 | 0.11 | 0.33 | −0.54 | −5.71 | 3.78 | 1.98 |
| November | 0.40 | 0.37 | 0.05 | 0.40 | 0.33 | 0.46 | 0.21 | −4.23 | −3.85 | 4.68 | 6.18 |
| December | 0.15 | 0.49 | −0.40 | 0.36 | 0.23 | 0.00 | 0.53 | −0.21 | −2.91 | 3.97 | 6.30 |
| Annual | 0.22 | 0.32 | −0.07 | 0.07 | 0.18 | 0.31 | 0.65 | −2.30 | −6.99 | 3.49 | 4.31 |
© 2019 by the authors. Licensee MDPI, Basel, Switzerland. This article is an open access article distributed under the terms and conditions of the Creative Commons Attribution (CC BY) license (http://creativecommons.org/licenses/by/4.0/).
Share and Cite
MDPI and ACS Style
Tan, M.L.; Samat, N.; Chan, N.W.; Lee, A.J.; Li, C. Analysis of Precipitation and Temperature Extremes over the Muda River Basin, Malaysia. Water 2019, 11, 283. https://doi.org/10.3390/w11020283
AMA Style
Tan ML, Samat N, Chan NW, Lee AJ, Li C. Analysis of Precipitation and Temperature Extremes over the Muda River Basin, Malaysia. Water. 2019; 11(2):283. https://doi.org/10.3390/w11020283
Chicago/Turabian StyleTan, Mou Leong, Narimah Samat, Ngai Weng Chan, Anisah Jessica Lee, and Cheng Li. 2019. "Analysis of Precipitation and Temperature Extremes over the Muda River Basin, Malaysia" Water 11, no. 2: 283. https://doi.org/10.3390/w11020283
Note that from the first issue of 2016, this journal uses article numbers instead of page numbers. See further details here.