1. Introduction
Precipitation is one of the major factors affecting the global water cycle and water balance. Heavy precipitation will cause floods, landslides and other disasters and pose a serious threat to people’s safety and national property [
1,
2,
3]. Precipitation has significant variability in different spatial and temporal scales. Accurate measurement of precipitation distribution can help to is master the spatial distribution characteristics of precipitation and it is of great significance for hydrological and water situation analysis, water resource management, drought and flood disaster prediction and hydrological and ecological simulation [
4,
5].
At present, the estimation of precipitation based on the data of ground precipitation stations is the main component of quantitative estimation of precipitation. The observation data of ground precipitation stations can provide the real information of a certain point of ground precipitation and have high accuracy. However, the spatial and temporal distribution of precipitation in the basin cannot be accurately reflected due to the limitation of site location and quantity. With the development of remote sensing and computer technology, satellite precipitation products based on data inversion of various sensors are a new source for quantitative estimation of precipitation. Satellite precipitation products have many advantages, such as wide coverage, continuous distribution in space and easy access to data [
6,
7] and have great application potential in basins without data or lacking data. However, they are not directly measured, so accuracy evaluation and applicability analysis are required for further use [
8,
9]. Now, the precision evaluation of satellite precipitation products mostly takes the observation data of ground precipitation stations or ground-based radar as the reference value, which can meet the verification requirements to a certain extent. In addition, increasing numbers of researchers turn their attention to the fusion verification based on distributed hydrological models, analyse the hydrological prediction errors caused by satellite precipitation products and test the substitutability of satellite precipitation products to the ground station precipitation in hydrological simulation [
10,
11,
12].
The China Meteorological Assimilation Driving Datasets for the SWAT model (CMADS) is a public dataset developed by Dr. Xianyong Meng from China Agriculture University (CAU). [
13,
14,
15]. CMADS provides standard weather model-driven data for SWAT model and other models. CMADSV1.1 used in this paper is an updated version of CMADS V1.0. The TRMM (Tropical Rainfall Measuring Mission Multi-satellite) satellite is mainly used to monitor and study the precipitation in tropical regions [
16]. The satellite was launched in Japan in November 1997 and officially retired in June 2015. Presently, the commonly-used TMPA (Tropical Rainfall Measuring Mission Multi-satellite Precipitation Analysis) precipitation data include non-real-time precipitation products 3B42 and 3B43 calibrated by GPCC (the Global Precipitation Climatology Centre) ground stations and real-time precipitation products 3B42RT and so forth [
17]. As the follow-up satellite precipitation observation plan of TRMM, GPM (global precipitation measurement) is superior to TRMM in terms of spatial coverage, spatial and temporal resolution and rain and snow data observation. GPM core observation platform (GPM core observatory, GPMCO) was successfully launched in February 2014. Currently, the commonly-used IMERG (Integrated Multi-satellite Retrievals for Global Precipitation Measurement) precipitation data include IMERG-F, a non-real-time precipitation product calibrated by GPCC ground precipitation station, IMERG-E and IMERG-L, quasi-real-time precipitation product [
18]. The emergence of these precipitation fusion products provides more basic hydrological and meteorological data for the study of basin water resources.
A lot of researchers evaluate the applicability of the above fusion data, including the applicability of 3B42V7 and IMERG-F satellite precipitation products and their comparative evaluation [
19,
20,
21,
22,
23,
24,
25,
26,
27,
28]. For example, some researchers evaluate the product quality of IMERG, as well as its diversity and continuity, with the generation of TMPA products within the scope of Mainland China [
29]; some evaluate the accuracy and hydrological simulation utility of IMERG-E, IMERG-L, IMERG-F and 3B42V7 product in the Beijiang River Basin in China [
30]; some assess the fitness of IMERG-F and 3B42V7 products with the basin and CGDPA, as well as the precipitation drive simulation results under different hydrologic model parameters. Some evaluated the applicability of the above fusion data in Singapore [
31], the southern plains [
32] and other countries. The verification results show that TMPA and IMERG products have application potential in different studies.
CMADS has received domestic and worldwide attention in the past few years because it is high-resolution and high-quality meteorological data. Research shows that it has shown a good application effect in the basin and region hydrology simulation [
33,
34,
35,
36]. So far, many achievements have been obtained in the related research in the process of precipitation and runoff through CMADS drive SWAT model. For example, some researchers evaluate the application of CMADS reanalysis data set in China PET [
37] and some evaluate the data adaptability on the Qinghai-Tibet plateau of the inland alpine region with sparse distribution weather stations [
38]. Some researchers conduct hydrological simulation in South Korea Han River watershed and evaluate the precision of data set [
39]. In fact, as basic data, there are few researchers on the statistical accuracy assessment and evaluation of hydrological effect on different climate areas and watersheds and few use TMPA and IMERG in the analysis process of the influence of hydrological model parameters on runoff simulation. Therefore, the study of the application effect on CMADS in more fields has certain significance and can provide more and reliable data set source and theoretical support for the future water resources management, hydrology and meteorology research.
The research contents of the paper are as follows: 1. Statistical analysis part: the accuracy of precipitation data of satellite precipitation fusion products CMADS, TMPA and IMERG in Jinsha River Basin was statistically evaluated by selecting R, RMSE and other statistical analysis indicators and using the hourly precipitation product comparison between CMPA-Hourly (China Hourly Merged Precipitation Analysis combining observations from automatic weather stations with CMORPH) as the reference value 2. Hydrological suitability analysis part: based on SWAT distributed hydrological model, the daily runoff process of the outlet section of Jinsha River Basin was simulated by selecting TMPA, IMERG and CMADS data as precipitation input respectively and the indirect evaluation of precipitation input was realized through hydrological simulation.
This paper is organized as follows:
Section 2 introduces the research basin and data;
Section 3 introduces the evaluation scheme and corresponding evaluation indexes;
Section 4 presents the statistical evaluation of precipitation product CMADS, IMERG and TMPA;
Section 5 evaluates the effectiveness of hydrological simulation under the SWAT hydrological model driven by three kinds of precipitation products.
Section 6 and
Section 7 are discussion and summary. The organization flow chart of this paper is shown in
Figure 1.
2. Study Site and Data
2.1. Study Site
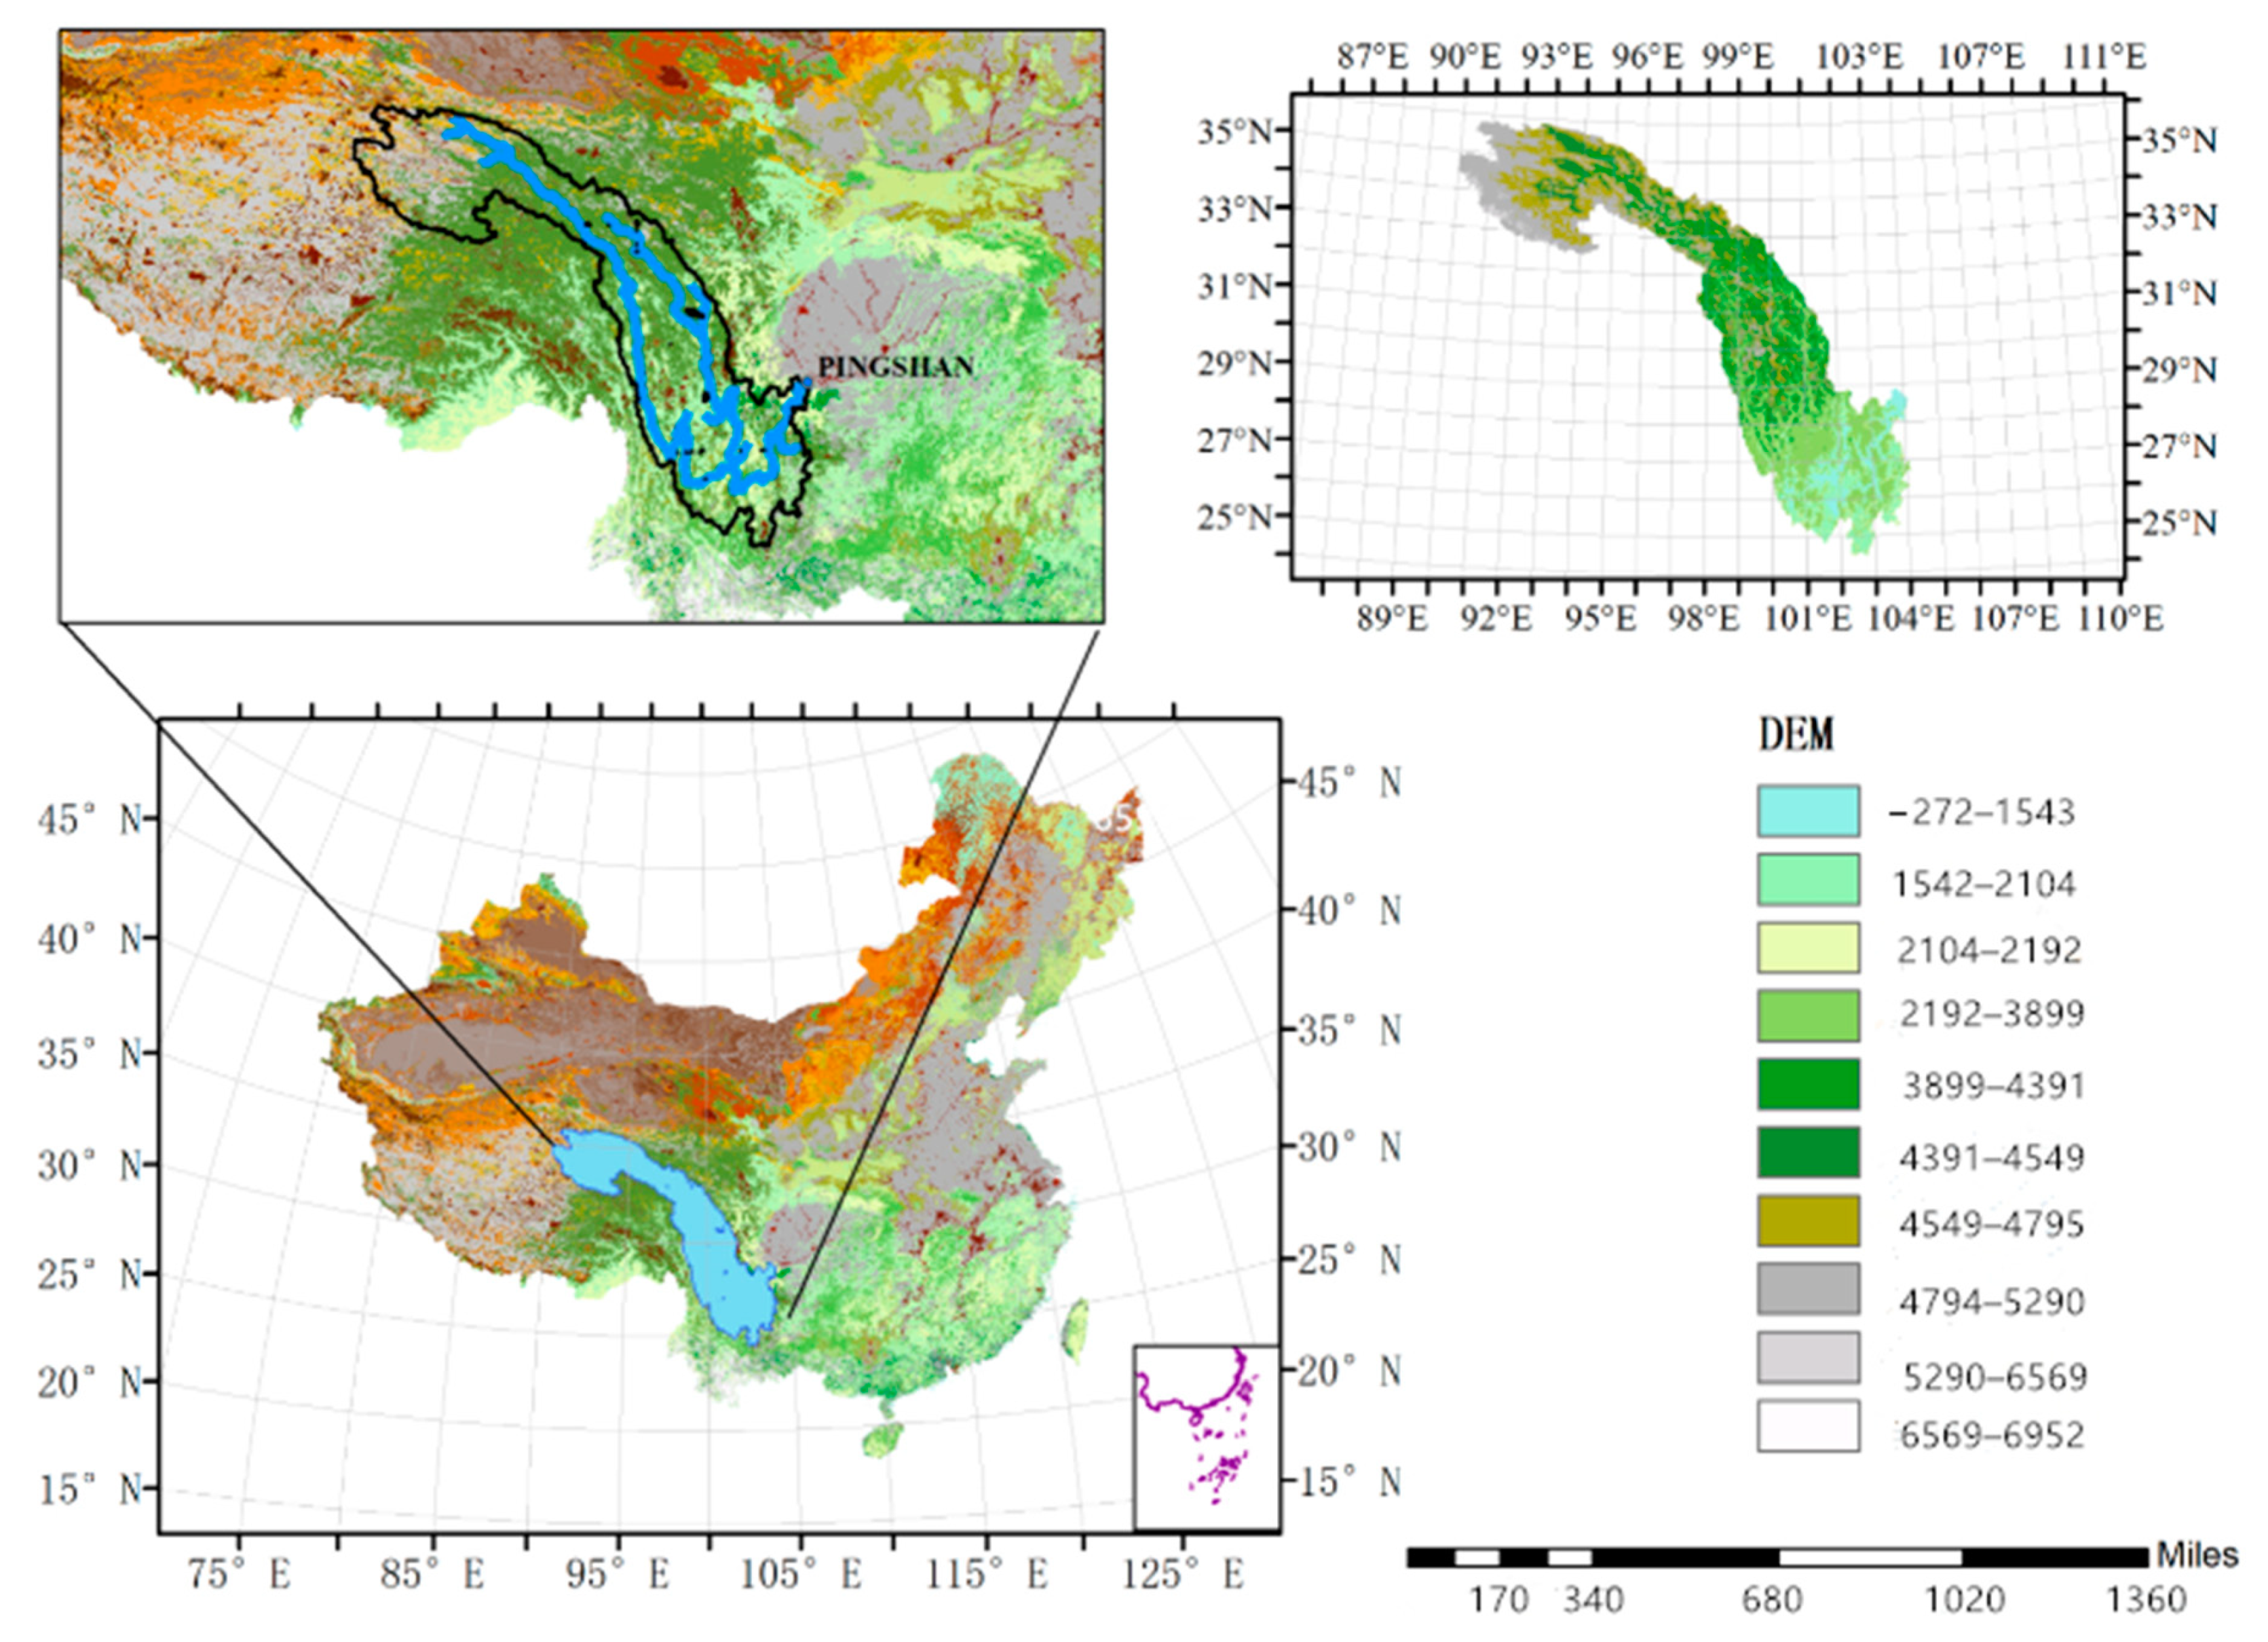
The Jinsha River Basin is located at the upper reaches of the Yangtze River and originates from the Tibetan Plateau. The Jinsha is one of the largest rivers in southwest China. The basin is located between 90–105°E and 24–36°N. The length of the river is 2316 km and the area of the river basin is 340,000 km
2. The river begins in Yushu County, Qinghai Province and flows through 5 major terrain and geomorphological units (Tibetan Plateau, West Sichuan Plateau, Hengduan Mountains, Yunnan-Guizhou Plateau and the Mountainous Area of Southwest Sichuan). The river is located in Qinghai, Tibet, Yunnan and Sichuan. The river is cross-distributed across plateaus, valleys, basins and hills. The basin is covered by plateau alpine meadows, hilly temperate dry river valley shrubs, hilly subtropical arid shrubs, subtropical xerophytic shrubs and subtropical semi humid evergreen broadleaf plants. The climate of the Jinsha River Basin exhibits regional characteristics: The upper and middle reaches experience a southwest monsoon climate with distinct dry and wet seasons (rainy season from May–October and dry season from November–April). The climate includes significant variations with altitude. The lower reaches belong to the central subtropical belt and experience a southeast monsoon climate. In this region, rainfall is characterized by pronounced seasonality and high intensity. In addition, the dry and hot river valley summer season in the lower reaches of the river basin is long and there is no winter [
40,
41,
42,
43,
44].
Figure 2 shows the study site and its major water systems.
2.2. Study Site Data
In this paper, we assess the suitability of precipitation data from different sources in our research on the Jinsha River Basin. The following paragraphs summarize the spatiotemporal resolution and coverage range of precipitation data types:
1) CMADS
The China Meteorological Assimilation Driving Datasets for the SWAT model (CMADS) are public datasets that were developed by Professor Xianyong Meng from China. The CMADS V1.1 dataset series covers the entire East Asia region (0–65°N, 60–160°E) and has a spatial resolution of 0.25°. The dataset includes precipitation, atmospheric temperature, atmospheric pressure, specific humidity, wind speed and other datasets. These datasets are available in .dbf and .txt formats in order to facilitate analysis and access by researchers from different disciplines [
45,
46,
47].
The hydrological simulation results of the CMADS + SWAT model can reflect the spatiotemporal distributions of various surface components in different regions and river basins [
48]. The CMADS dataset developed by Dr. Xianyong Meng provides 2008–2016 precipitation data to users free of charge and also provides scientific research support. More and more researchers are trusting this dataset and utilizing it to study complex and unique problems [
49,
50,
51,
52].
2) TMPA
The Tropical Rainfall Measuring Mission (TRMM) was jointly developed and designed by the National Aeronautics and Space Administration (NASA) and the Japan Aerospace Exploration Agency (JAXA). The TRMM tropical satellite precipitation plan covers an area that encircles the globe from 38°N–38°S. The TRMM Multi-satellite Precipitation Analysis (TMPA) is a precipitation product that uses multiple modern satellite precipitation sensors and ground rain gauge networks. TMPA provides 2 standard satellite products, quasi-real-time and non-real-time post-processing. The TRMM plan provides free global 50°N–50°S and multiple time interval precipitation data. The temporal resolution is 3 hours and the spatial resolution is 0.25° [
6]. The RMM PR (Ku band) is the world’s first space borne precipitation radar and its multiple years of operation have played a major role in improving the understanding of tropical and subtropical precipitation. In this paper, we employed the TMPA 3B42V7 post-real-time processing precipitation product (hereafter termed TMPA).
3) IMERG
The global precipitation measurement (GPM) is a TRMM post-precipitation plan. IMERG represents an improvement of the TRMM in terms of spatial coverage range, spatiotemporal resolution and rain and snow observation data. The GPM DPR (Ku and Ka bands) is the first space borne dual-frequency precipitation radar [
53]. As a subsequent satellite of the TRMM, it covers a global range of 65°N–65°S. The Integrated Multi-satellite Retrievals for GPM (IMERG) level-3 product extends the coverage range to the north and south poles and provides a precipitation product with a global temporal resolution of 30 minutes and a spatial resolution of 0.1°. The greater coverage range, higher spatiotemporal resolution, more accurate capture capabilities for trace amounts of precipitation and solid precipitation and overall application accuracy of IMERG have compelled more and more researchers to rely on it. In this paper, we employed the ground station-calibrated non-real-time post-processing satellite precipitation product with an accuracy exceeding that of the quasi real-time/real-time satellite precipitation product, that is, the “final” run IMERG (IMERG-F) product.
3. Statistical Assessment Protocol and Markers
3.1. Statistical Assessment Protocol
CMPA-Hourly (China Hourly Merged Precipitation Analysis combining observations from automatic weather stations with CMORPH) was produced by the meteorological data laboratory of the China Meteorological Data Service Centre [
54]. This product is based on the global 30-min and 8-km resolution Climate Prediction Centre MORPHing technique (CMORPH) satellite inversion precipitation product developed by the U.S. Climate Prediction Centre following quality control and correction of hourly precipitation data from 30,000 automated weather station observations in China. This precipitation fusion product effectively combines ground observation data from automated stations in China. Shen et al. validated that an hourly precipitation product with a resolution of 0.1° has an overall error level within 10% and an error level for heavy precipitation and regions with sparse stations within 20%. The fusion product can more accurately capture pronounced precipitation processes in typical regions. This product can provide important input parameters for precipitation in atmospheric and hydrological studies [
55].
In the statistical analysis section of this study, the precipitation volume in the Jinsha River Basin from the hourly precipitation 0.1° grid data resulting from the fusion of China’s automated stations and CMORPH was used as the observation data to calculate the error markers for TMPA, IMERG precipitation and CMADS precipitation for 910 grid precipitation observations in the Jinsha River Basin. The spatial resolution used for the precipitation calculation was 0.25°.
In this paper, 3 analyses were used to assess the precipitation accuracy of TMPA, IMERG and CMADS in the Jinsha River Basin.
1) Total analysis: Comparative analysis of the error markers of precipitation at all-time points for all 910 grid squares in the river basin, that is, total analysis at the river basin grid scale and the comparative analysis of error markers in precipitation at all-time points after the 910 grid values in the river basin were averaged, that is, total analysis at the average river basin grid scale.
2) Spatial analysis: Comparative analysis of the error markers of precipitation at all-time points for all grids in the river basin, that is, spatial analysis at the river basin grid scale.
3) Time series analysis: Comparative analysis of the error markers of precipitation for all grids at all-time points, that is, analysis of the temporal changes in precipitation in the river basin.
3.2. Assessment Markers
Several widely used assessment markers were selected to quantitatively evaluate the accuracy and error of three precipitation products, including accuracy assessment markers and classification markers. The accuracy assessment markers include the correlation coefficient (R), mean error (ME), relative bias (BIAS), root-mean-square error (RMSE), centred root-mean-squared error (CRMSE), standard deviation (SD) and Nash-Sutcliffe model coefficient of efficiency (NSE). The classification markers include the probability of detection (POD), false alarm ratio (FAR) and critical success index (CSI).
Table 1 shows the calculation formulas and optimal values for the various markers.
In the accuracy assessment markers in
Table 1,
is the observed precipitation data in mm,
is the test precipitation data in mm,
is the mean observed precipitation data in mm,
is the mean test precipitation data in mm and N is sample size. R can be used to assess the consistency between the test precipitation data and the reference precipitation data. The closer R is to 1, the greater the consistency between the test precipitation data and the reference precipitation data. The closer the ME is to 0, the smaller the mean error between the test precipitation data and the observed precipitation data and thus the better the assessment results. The closer the BIAS is to 0, the lower the systematic error between the test precipitation data and the observed precipitation data. The closer the RMSE is to 0, the lower the bias between the test precipitation data and the observed precipitation data and the closer the test precipitation data is to the observed precipitation data. The closer the CRMSE is to 0, the closer the deviation of the test data is to the deviation of the observed data. The closer
is to 0, the lower the dispersion of the measured precipitation data/observed precipitation dataset. As a hydrological simulation assessment marker, the closer the NSE is to 1, the greater the accuracy of the hydrological simulation.
Among the classification markers, represents the precipitation events detected by both the test data and observation data, represents precipitation events detected by the observation data but not detected by the test data and represents precipitation events detected by the test data but not detected by the observation data. POD is the frequency that precipitation events are detected by both test and observation data and reflects the ability of the test data to identify precipitation events. The closer POD is to 1, the more optimal it is. FAR is the frequency of precipitation events that are detected in test data but not in observation data. The closer FAR is to 0, the more optimal it is. CSI is the probability of accurate judgment when there are precipitation events in either the test data or observation data. A CSI of 1 is the most optimal.
4. Statistical Analysis and Evaluation Results
4.1. Total Analysis
In this paper, the entire hydrological research cycle lasted from November 2014 through October 2016.
Table 2 shows the error markers for precipitation.
From
Table 2, we can see that in terms of the accuracy assessment markers, the errors after the 910 grid squares were averaged were smaller than the errors from the 910 grid squares in the river basin. This may be due to the fact that the river basin has a large area and averaging the grid squares will eliminate some positive and negative errors. Therefore, the average values of the river basin grid squares exhibited smaller error values. Since the BIAS and ME error values in the river basin grid and the river basin mean range are equivalent, there was no comparison made between the 2. However, the BIAS marker demonstrated satisfactory error calculation results for this river basin. This indicates that the systematic bias between the satellite precipitation data TMPA, IMERG and CMADS datasets and the observed data was low. In terms of classification markers, the mean index error of the river basin still exhibited better performance than the river basin grid scale. For the full cycle error, we referenced the study results of Tang et al. (2016) [
56] for R, RMSE, CRMSE, POD, FAR and CSI and found these errors to be acceptable. From the error marker perspective, the 3 precipitation products as well as the observation precipitation product all demonstrated good overall consistency.
In the Jinsha River Basin, the dry season lasts from November through April of the following year, while the rainy season lasts from May through October. In order to better characterize the accuracy performance of the dry season and rainy season data, we divided the study cycle (November 2014–October 2016) into 4 hydrological cycles, with 2014–2015 as the first hydrological cycle (of which November 2014–April 2015 was the first dry season of the hydrological cycle and may 2015–October 2015 was the first rainy season) and 2015–2016 as the second hydrological cycle (of which November 2015–April 2016 was the second dry season of the hydrological cycle and may–October 2016 was the second rainy season). The hourly precipitation grid dataset obtained by the fusion of automated station and CMORPH data was used as observation data for comparative analysis of the corresponding error markers.
Table 3 lists the error markers.
We further compared the precipitation data performance of the satellite precipitation data during the 2014–2016 cycle for the full 2-year cycle, first dry season, first rainy season, second dry season and second rainy season.
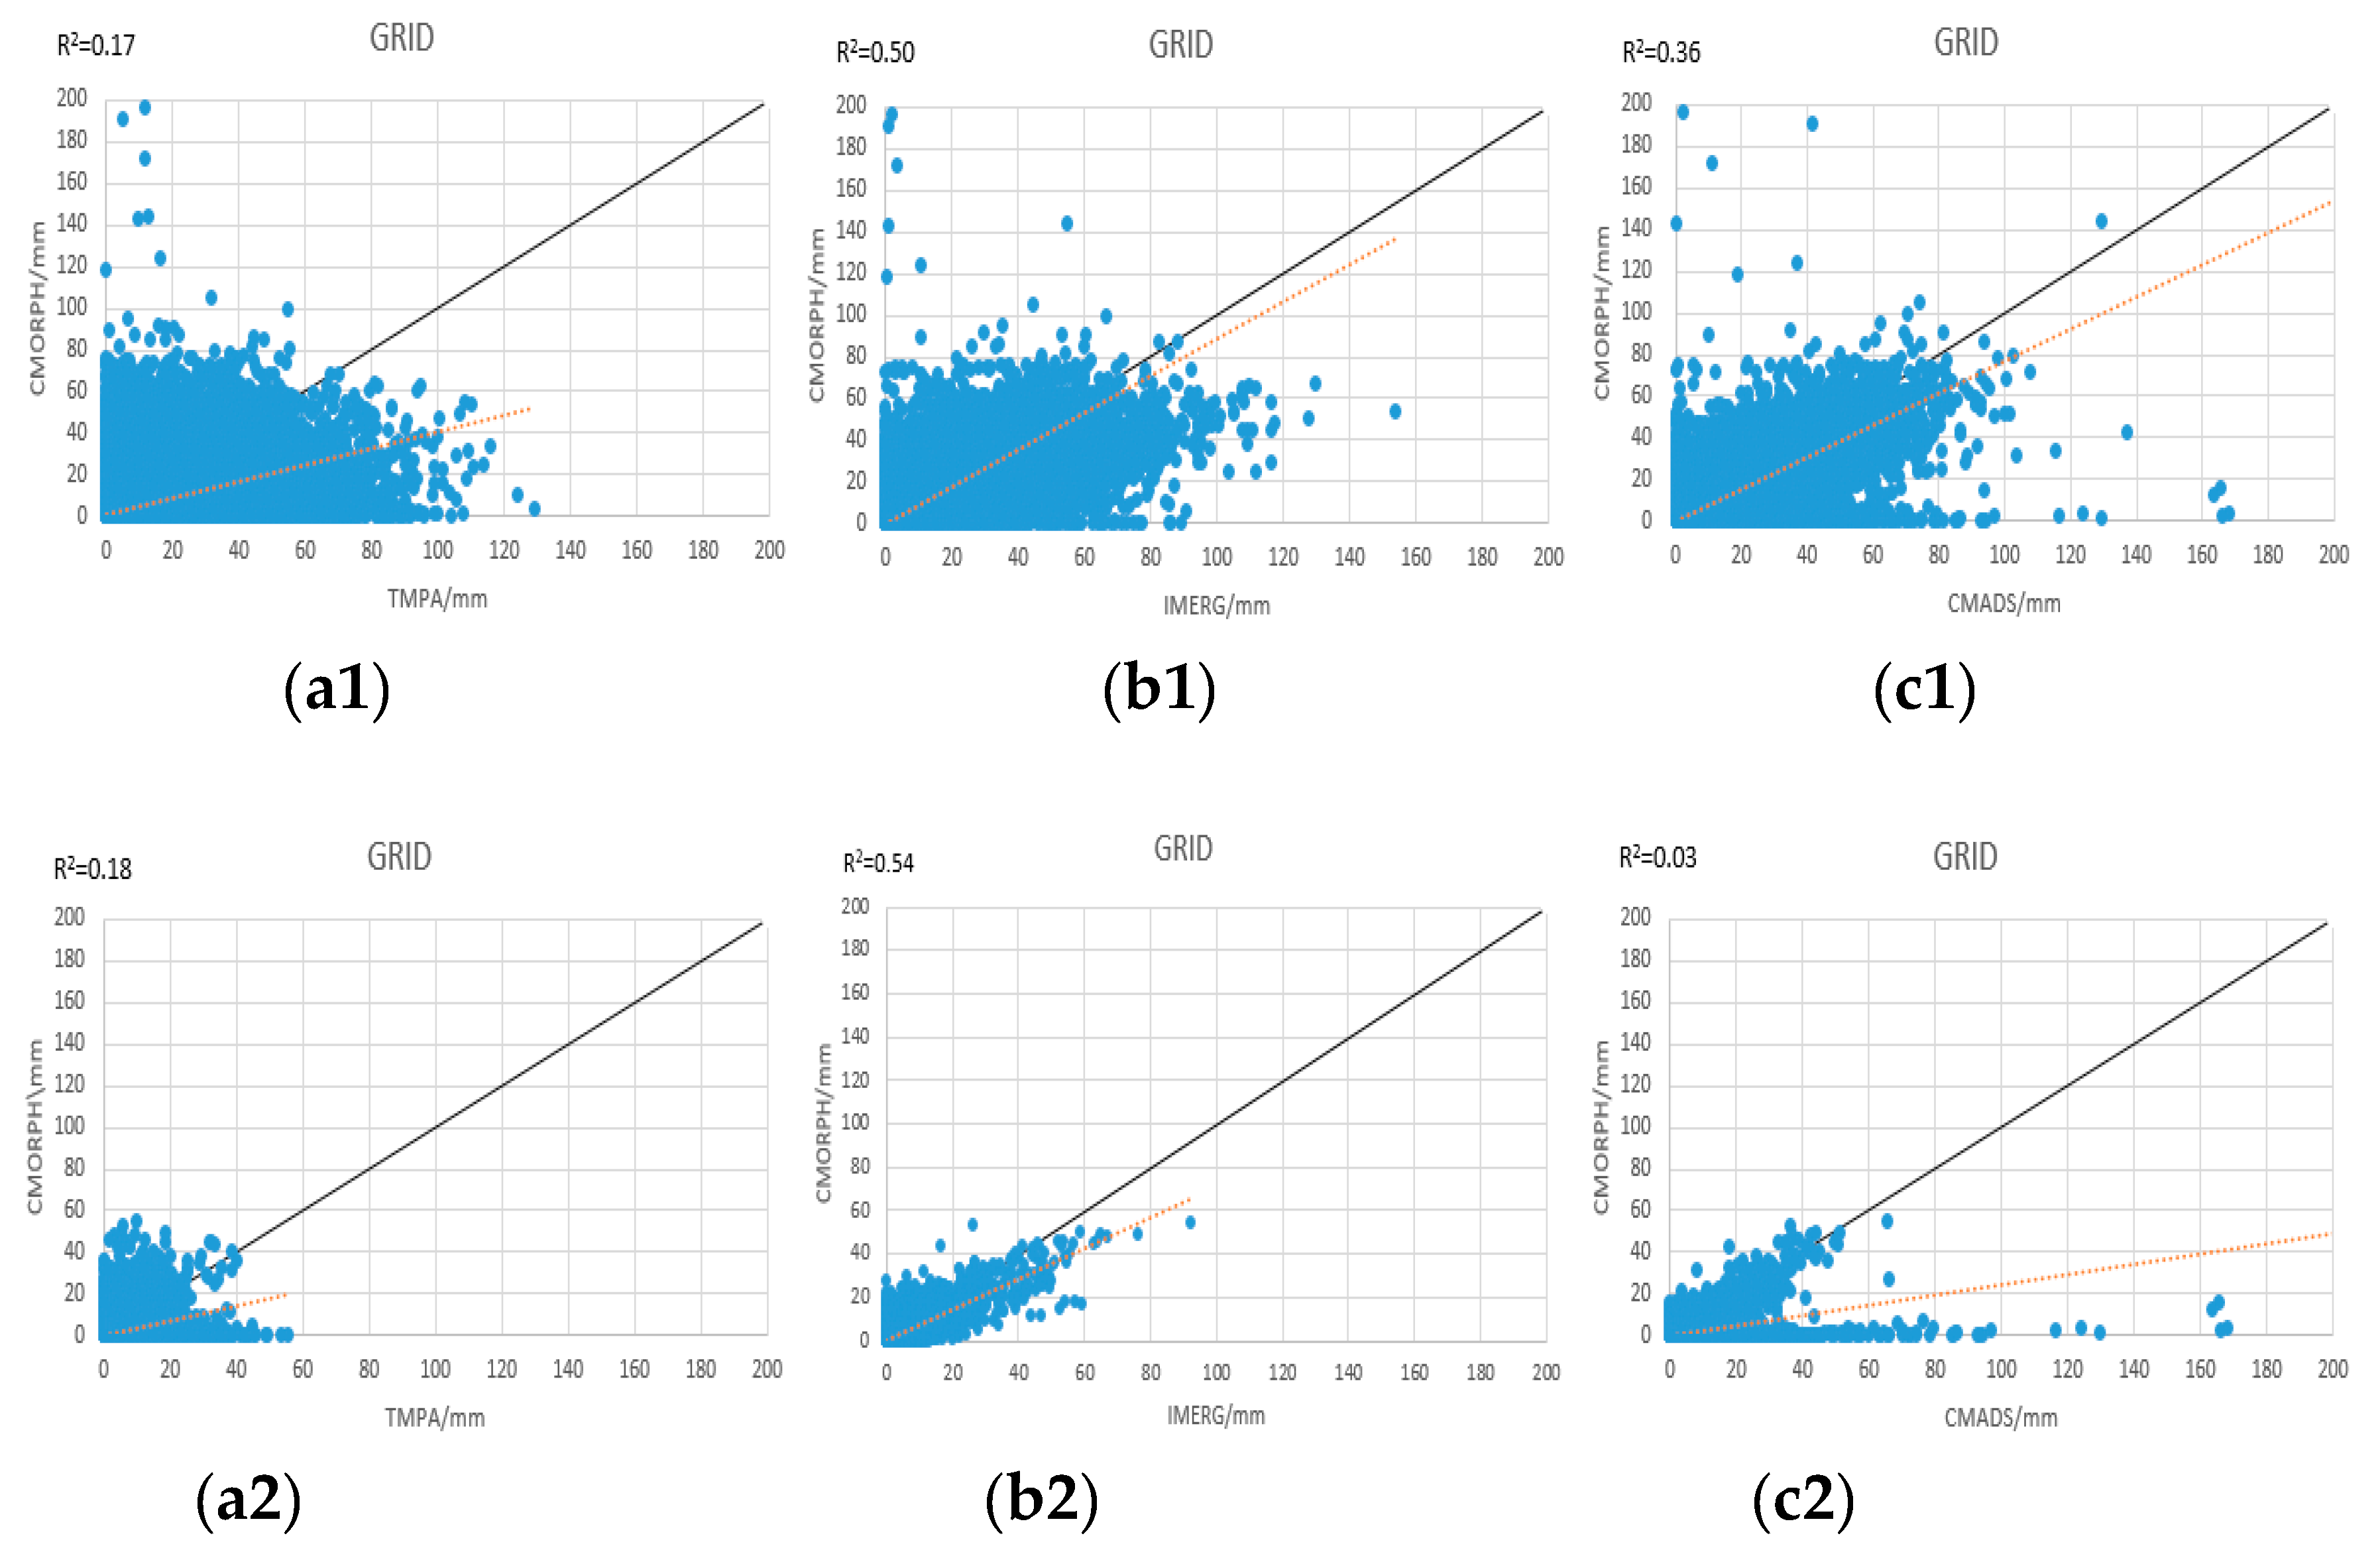
Figure 3 shows the unary linear relationship scatterplot for the TMPA, IMERG, CMADS and observed precipitation data. By combining
Figure 3 with
Table 2 and
Table 3, we can see that the fitting line of data (a3,b3 and c3) in the unitary linear scatter plot of flood season is closer to the standard line than the dry season fitting line (a4,b4 and c4),So the data performance for the dry season was weaker than that for the rainy season. Overall, the Jinsha River Basin experiences mainly light rainfall. Moderate to heavy precipitation generally occurs over the middle and lower reaches of the river basin, while the area in which very heavy rain occurs is even smaller [
40]. Since the three precipitation products were based on satellite detection or corrections based on satellite detection data, the detection errors for light rain by high-altitude satellites were more affected by other factors. Therefore, the detection efficiency was lower for the dry season than the rainy season since the former is characterized by lighter precipitation. The linear relationship of the full 2-year cycle of precipitation by CMADS and IMERG with the observed precipitation was better than that of the TMPA. The TMPA precipitation product exhibited poor performance in the full cycle and its linear relationship was weaker than that of IMERG and CMADS. One reason for this is due to the fact that the study period experienced instability in the detected precipitation during the 2 dry seasons and some bias occurred when the precipitation was high during the rainy season. Another reason was that the TMPA was calibrated using monthly rain gauges that were relatively sparse, which impacted its overall performance to some extent. IMERG showed improved performances in both dry and rainy seasons compared with the previous generation of TMPA products. Longitudinally, the relative bias of the first dry season was greater than the rainy seasons and the second dry season. The overall performance of CMADS was close to that of IMERG and was relatively good. The bias in the first dry season was greater than that of the other seasons during the study period. The low POD for precipitation during the dry season may stem from the fact that the ability of the satellite to detect solid precipitation is limited by its physical components, thus weakening its detection capability.
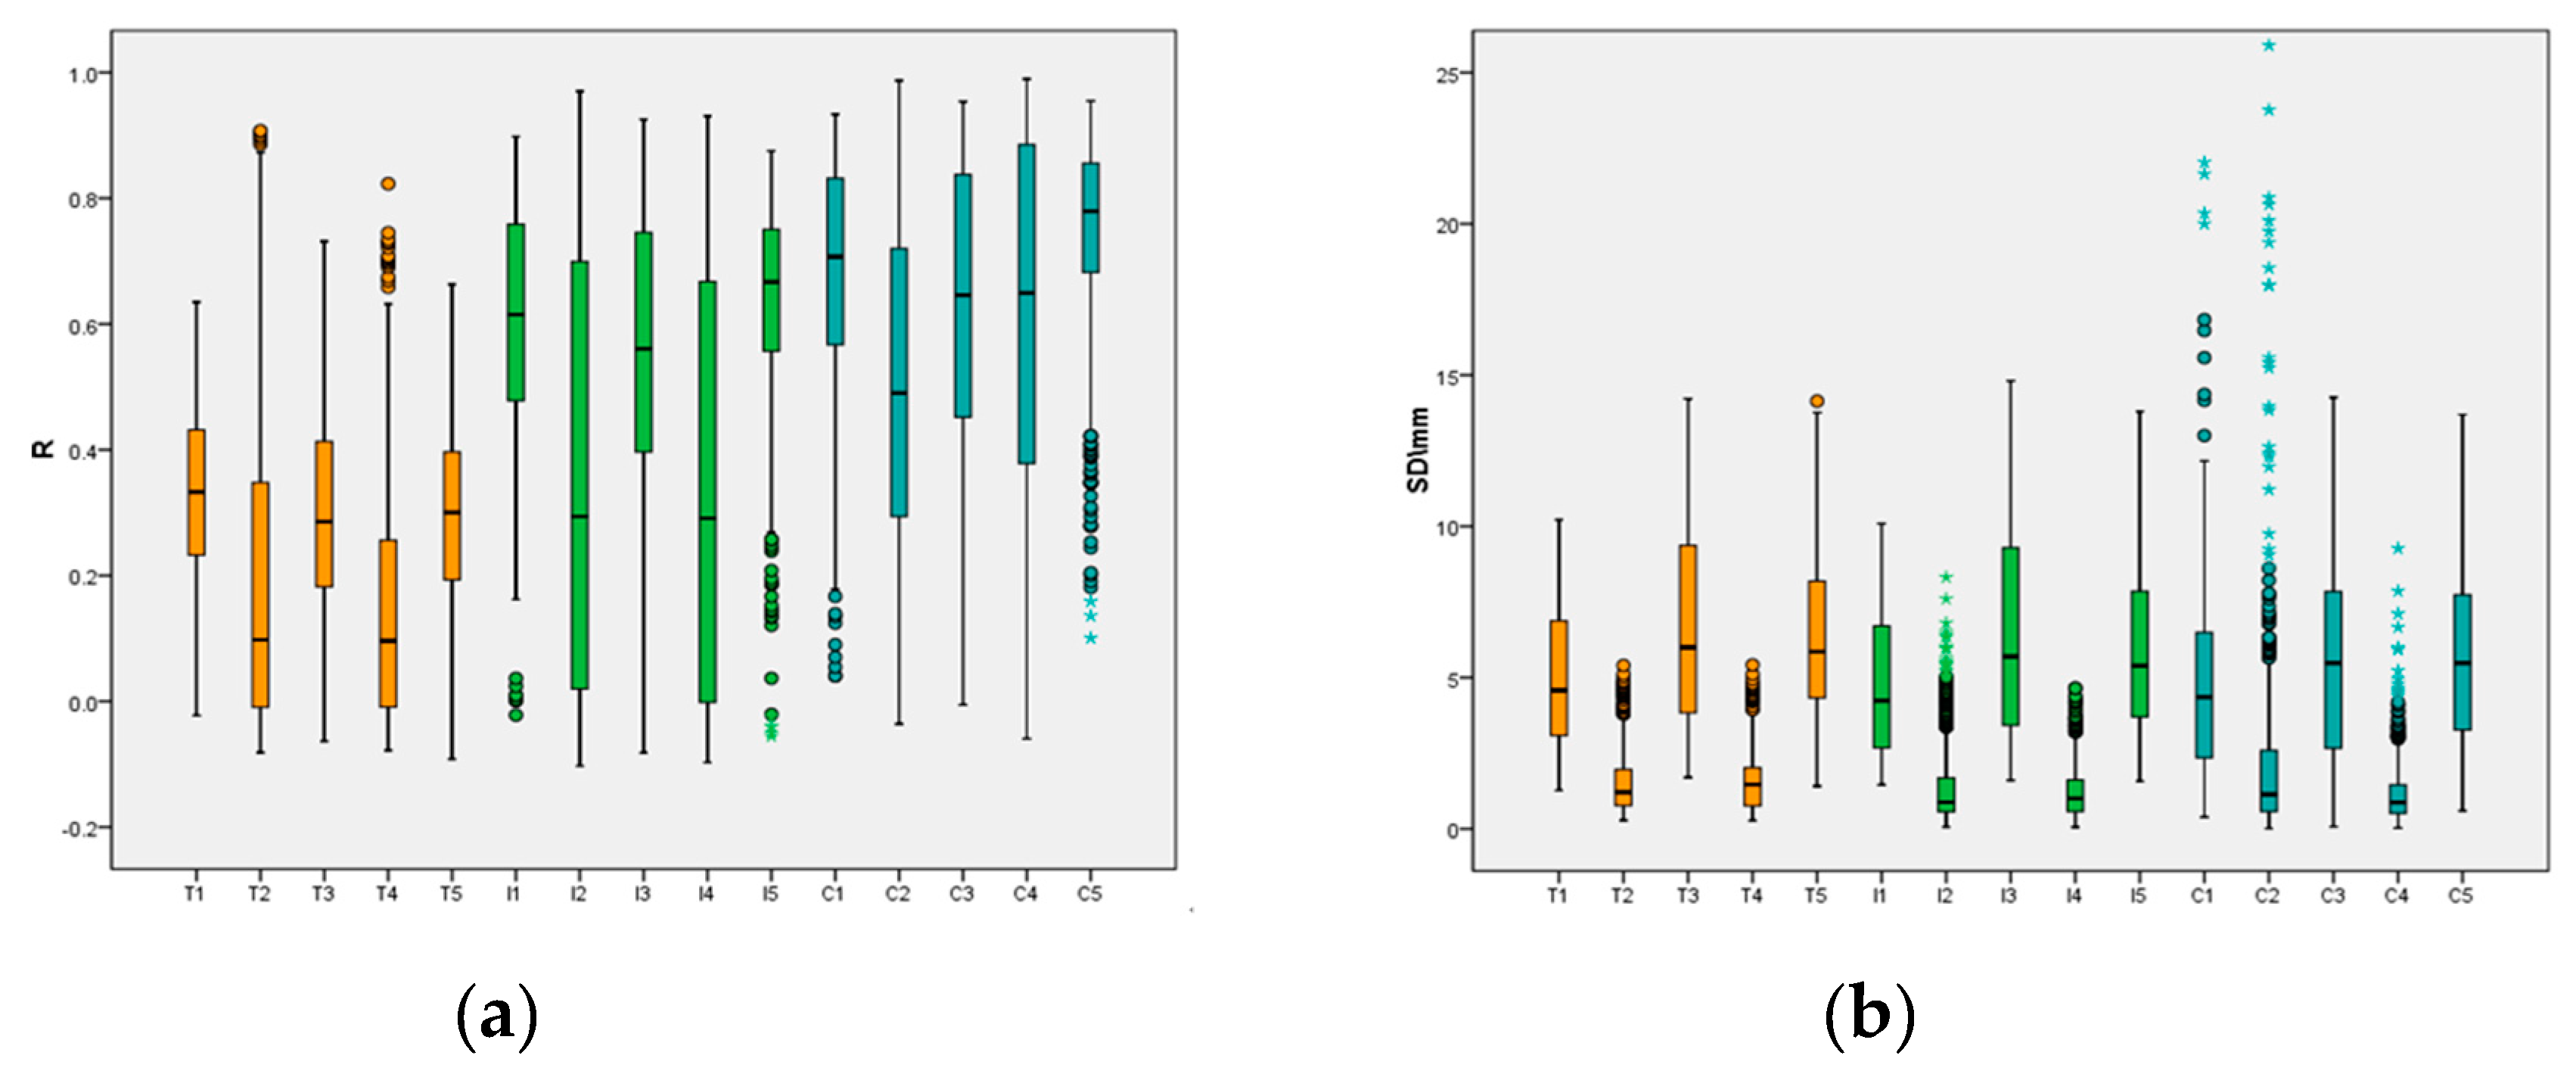
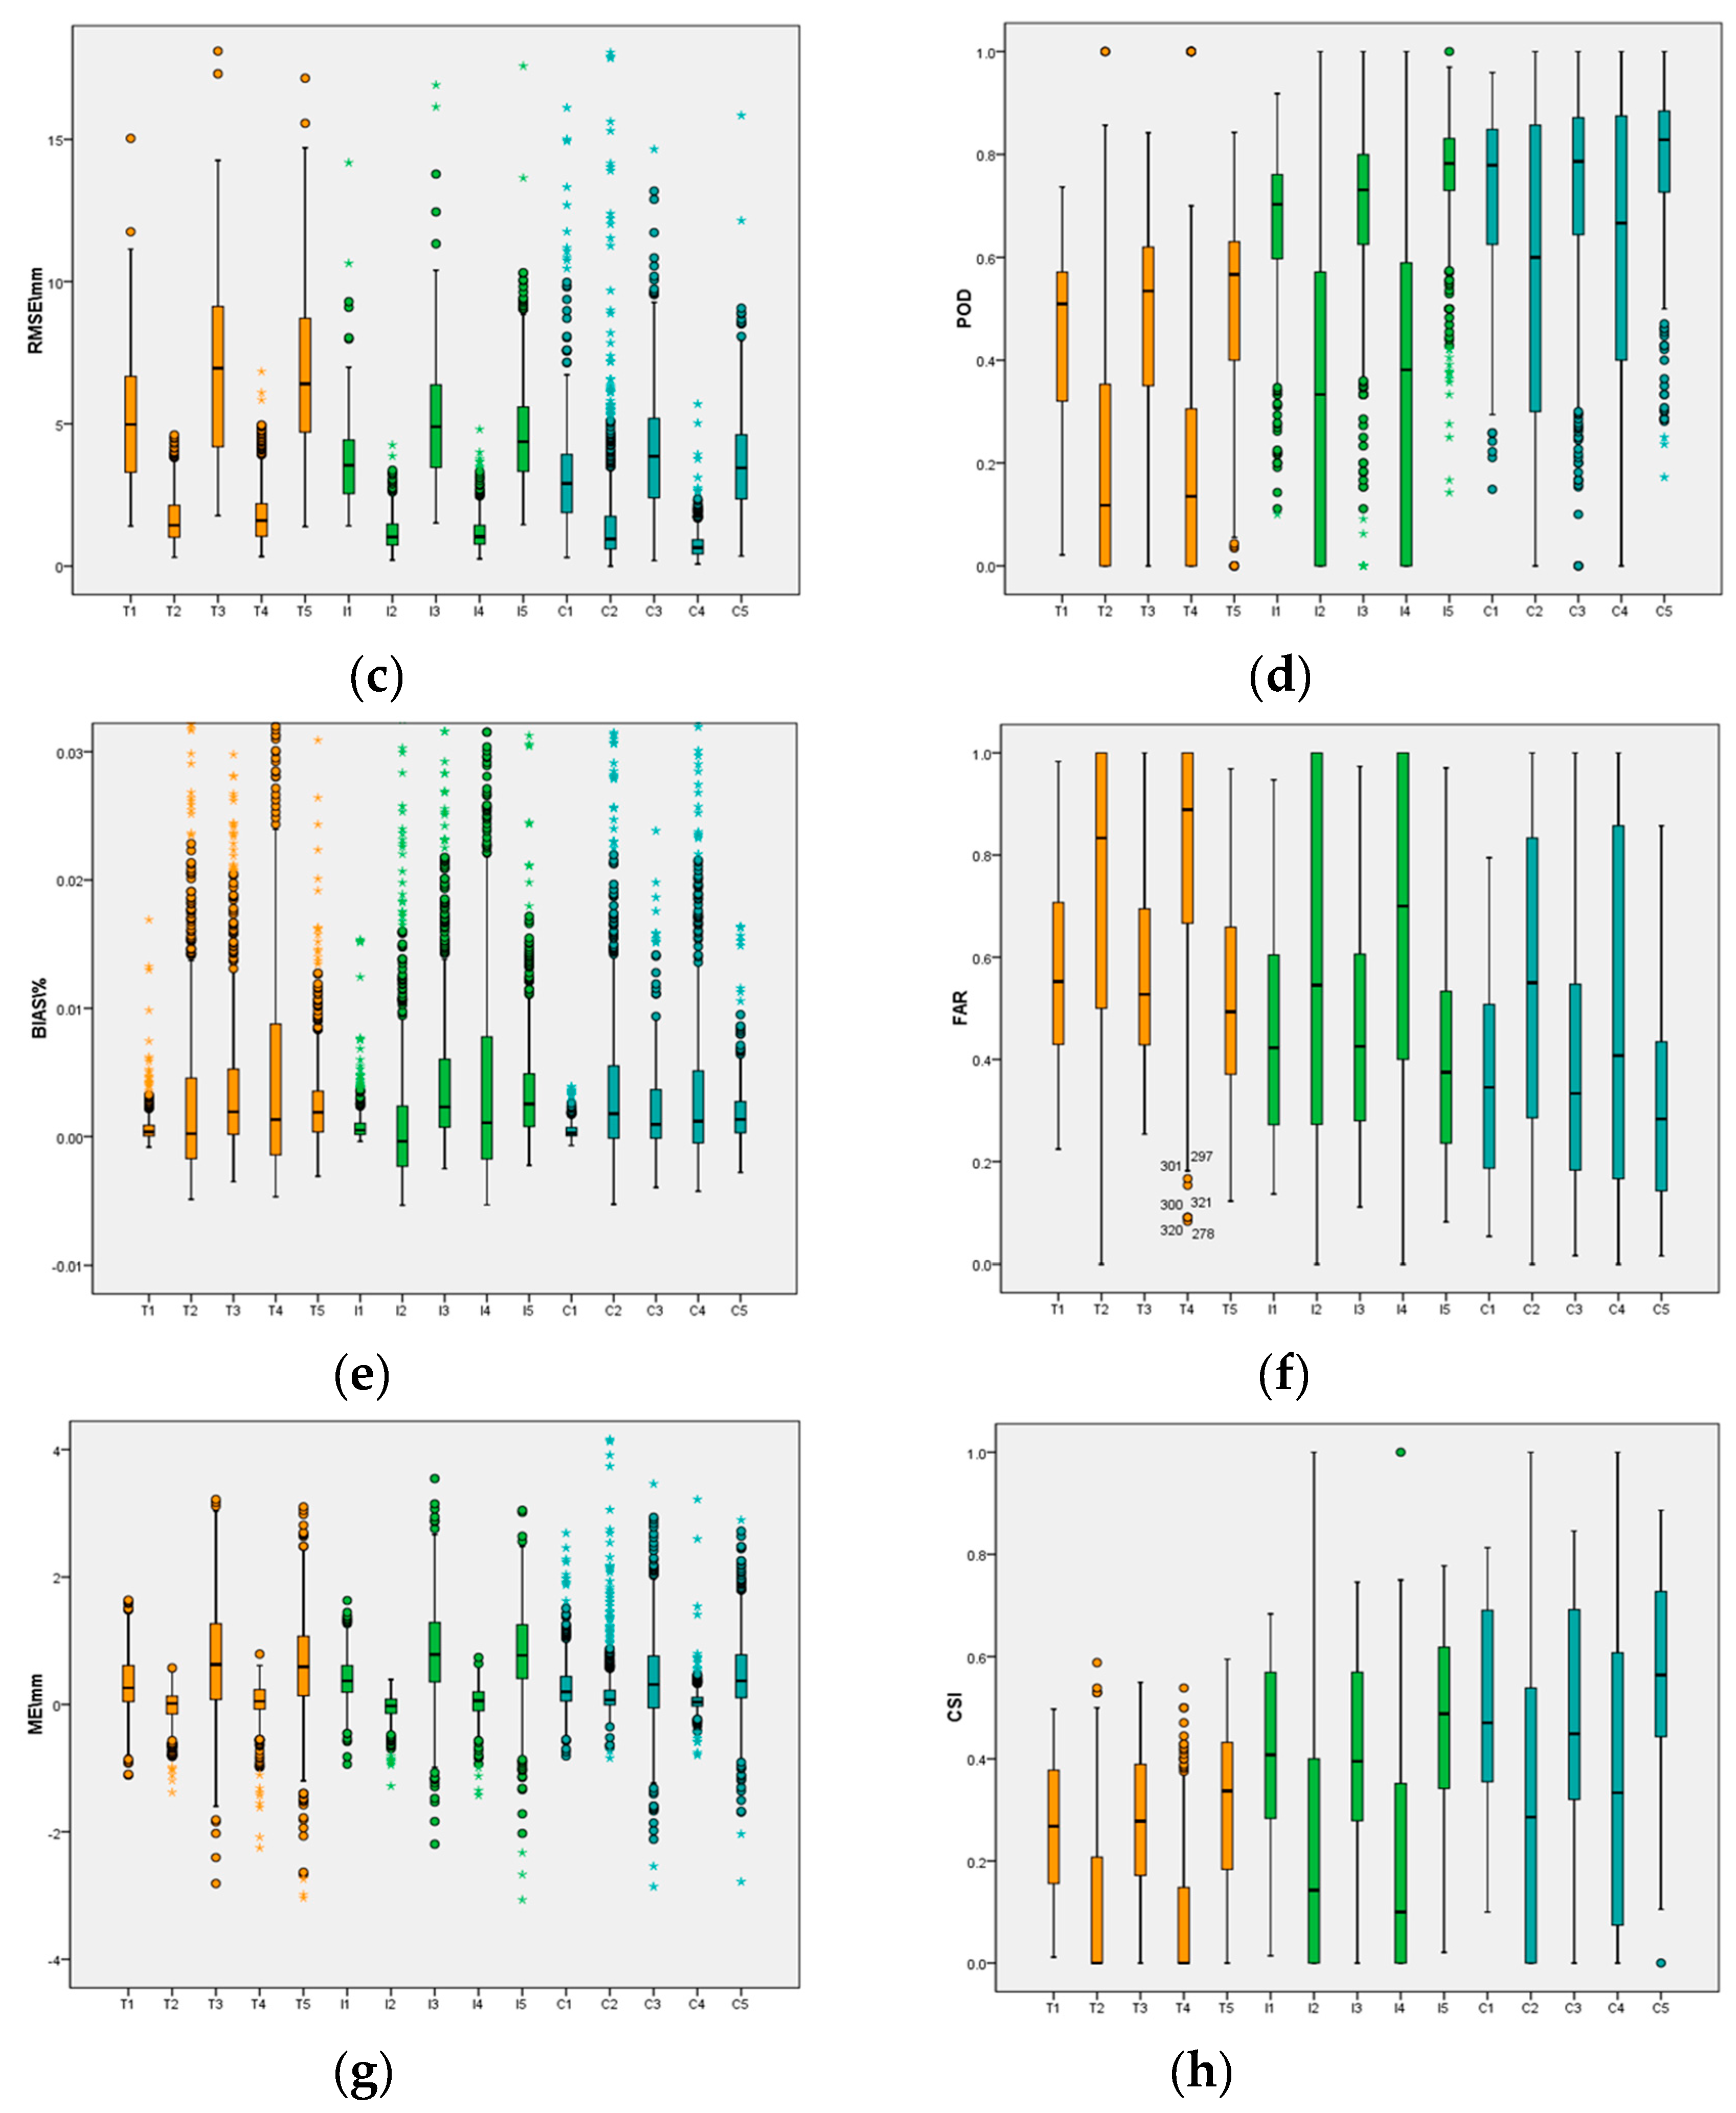
Figure 4 shows the box plot of the different error markers. Comparative analysis of the distribution status of various precipitation error markers can be carried out by combining
Figure 4 with
Table 2 and
Table 3. Taylor diagrams were plotted by combining SD
gauge, SD, R, RMSE and CRMSE (
Figure 5). A comparison of the performance of different data at the river basin grid scale and the average river basin grid scale was made by combining
Figure 5 with
Table 2 and
Table 3.
If the precipitation product has an R that approaches 1 and SD, RMSE, BIAS and ME that approach 0, this indicates that the error of its precipitation data is small. If the precipitation product has a POD and CSI that approach 1 and a FAR that approaches 0, this indicates that the precipitation data have good detection capabilities for precipitation and non-precipitation events. The solid black lines in the box plot represent the median. The 4 horizontal lines from top to bottom represent the maximum, third quartile, first quartile and minimum. The symbol o represents discrete values and * represents extreme values. From the box plots of the different markers, we can see the median error and the deviation of the integrated error from the median error. From
Figure 4d,f,h, we can see that the 3 markers in CMADS are better than those of the TMPA and IMERG precipitation products when the PODs for precipitation events are compared. The frequency of actual precipitation events that were detected by CMADS was optimal. The POD and CSI of the CMADS data were closer to 1 and its FAR was closer to 0, which is optimal. The comparison of the different accuracy assessment markers can be seen in the Taylor diagrams in
Figure 5. From the full cycles in
Figure 5a–d, we can see that the averaged error markers for the river basin grid were better than those of the river basin scale. The average river basin scale exhibited smaller SD errors. The CMADS of the grid scale and average grid scale for the first dry season all showed lower correlation coefficients and achieved better performances in the second dry season and first rainy season. IMERG is an upgraded precipitation product of the TMPA. From the few comparison cycles, we can see that the errors of IMERG were slightly smaller than those of the TMPA. Using the grid scale and average river basin scale of the first rainy season as an example, we can see that at the grid scale (
Figure 5e), R
cmads > R
imerg > R
tmpa—that is, the correlation coefficient for CMADS was the greatest and the correlation coefficient of TMPA was the smallest, with that of IMERG falling in between. In addition, RMSE
cmads < RMSE
imerg < RMSE
tmpa—that is, the RMSE was the smallest for CMADS, followed by IMERG. The average river basin scale (
Figure 5f) produced identical error values as the river basin grid scale, although the mean error was smaller and the correlation coefficient was greater.
In summary, the overall errors for the TMPA, IMERG and CMADS in the river basin in this study were found to be acceptable. These datasets showed better performances at the average grid scale. CMADS demonstrated better performance for the POD marker. The overall error performance of the IMERG precipitation data was better than that of the TMPA precipitation product. CMADS and IMERG exhibited their own strengths and weaknesses in the performances of different markers. The subsequent text will further compare and analyse these 3 types of precipitation data in driving hydrological simulation and actual measured runoff data will be used to further test the performance of the precipitation data.
4.2. Spatial Analysis
The 910 grid squares were used as study objects and the 2014–2016 study period was taken as the entire cycle when analysing the spatial distributions of relevant precipitation markers at the river basin grid scale.
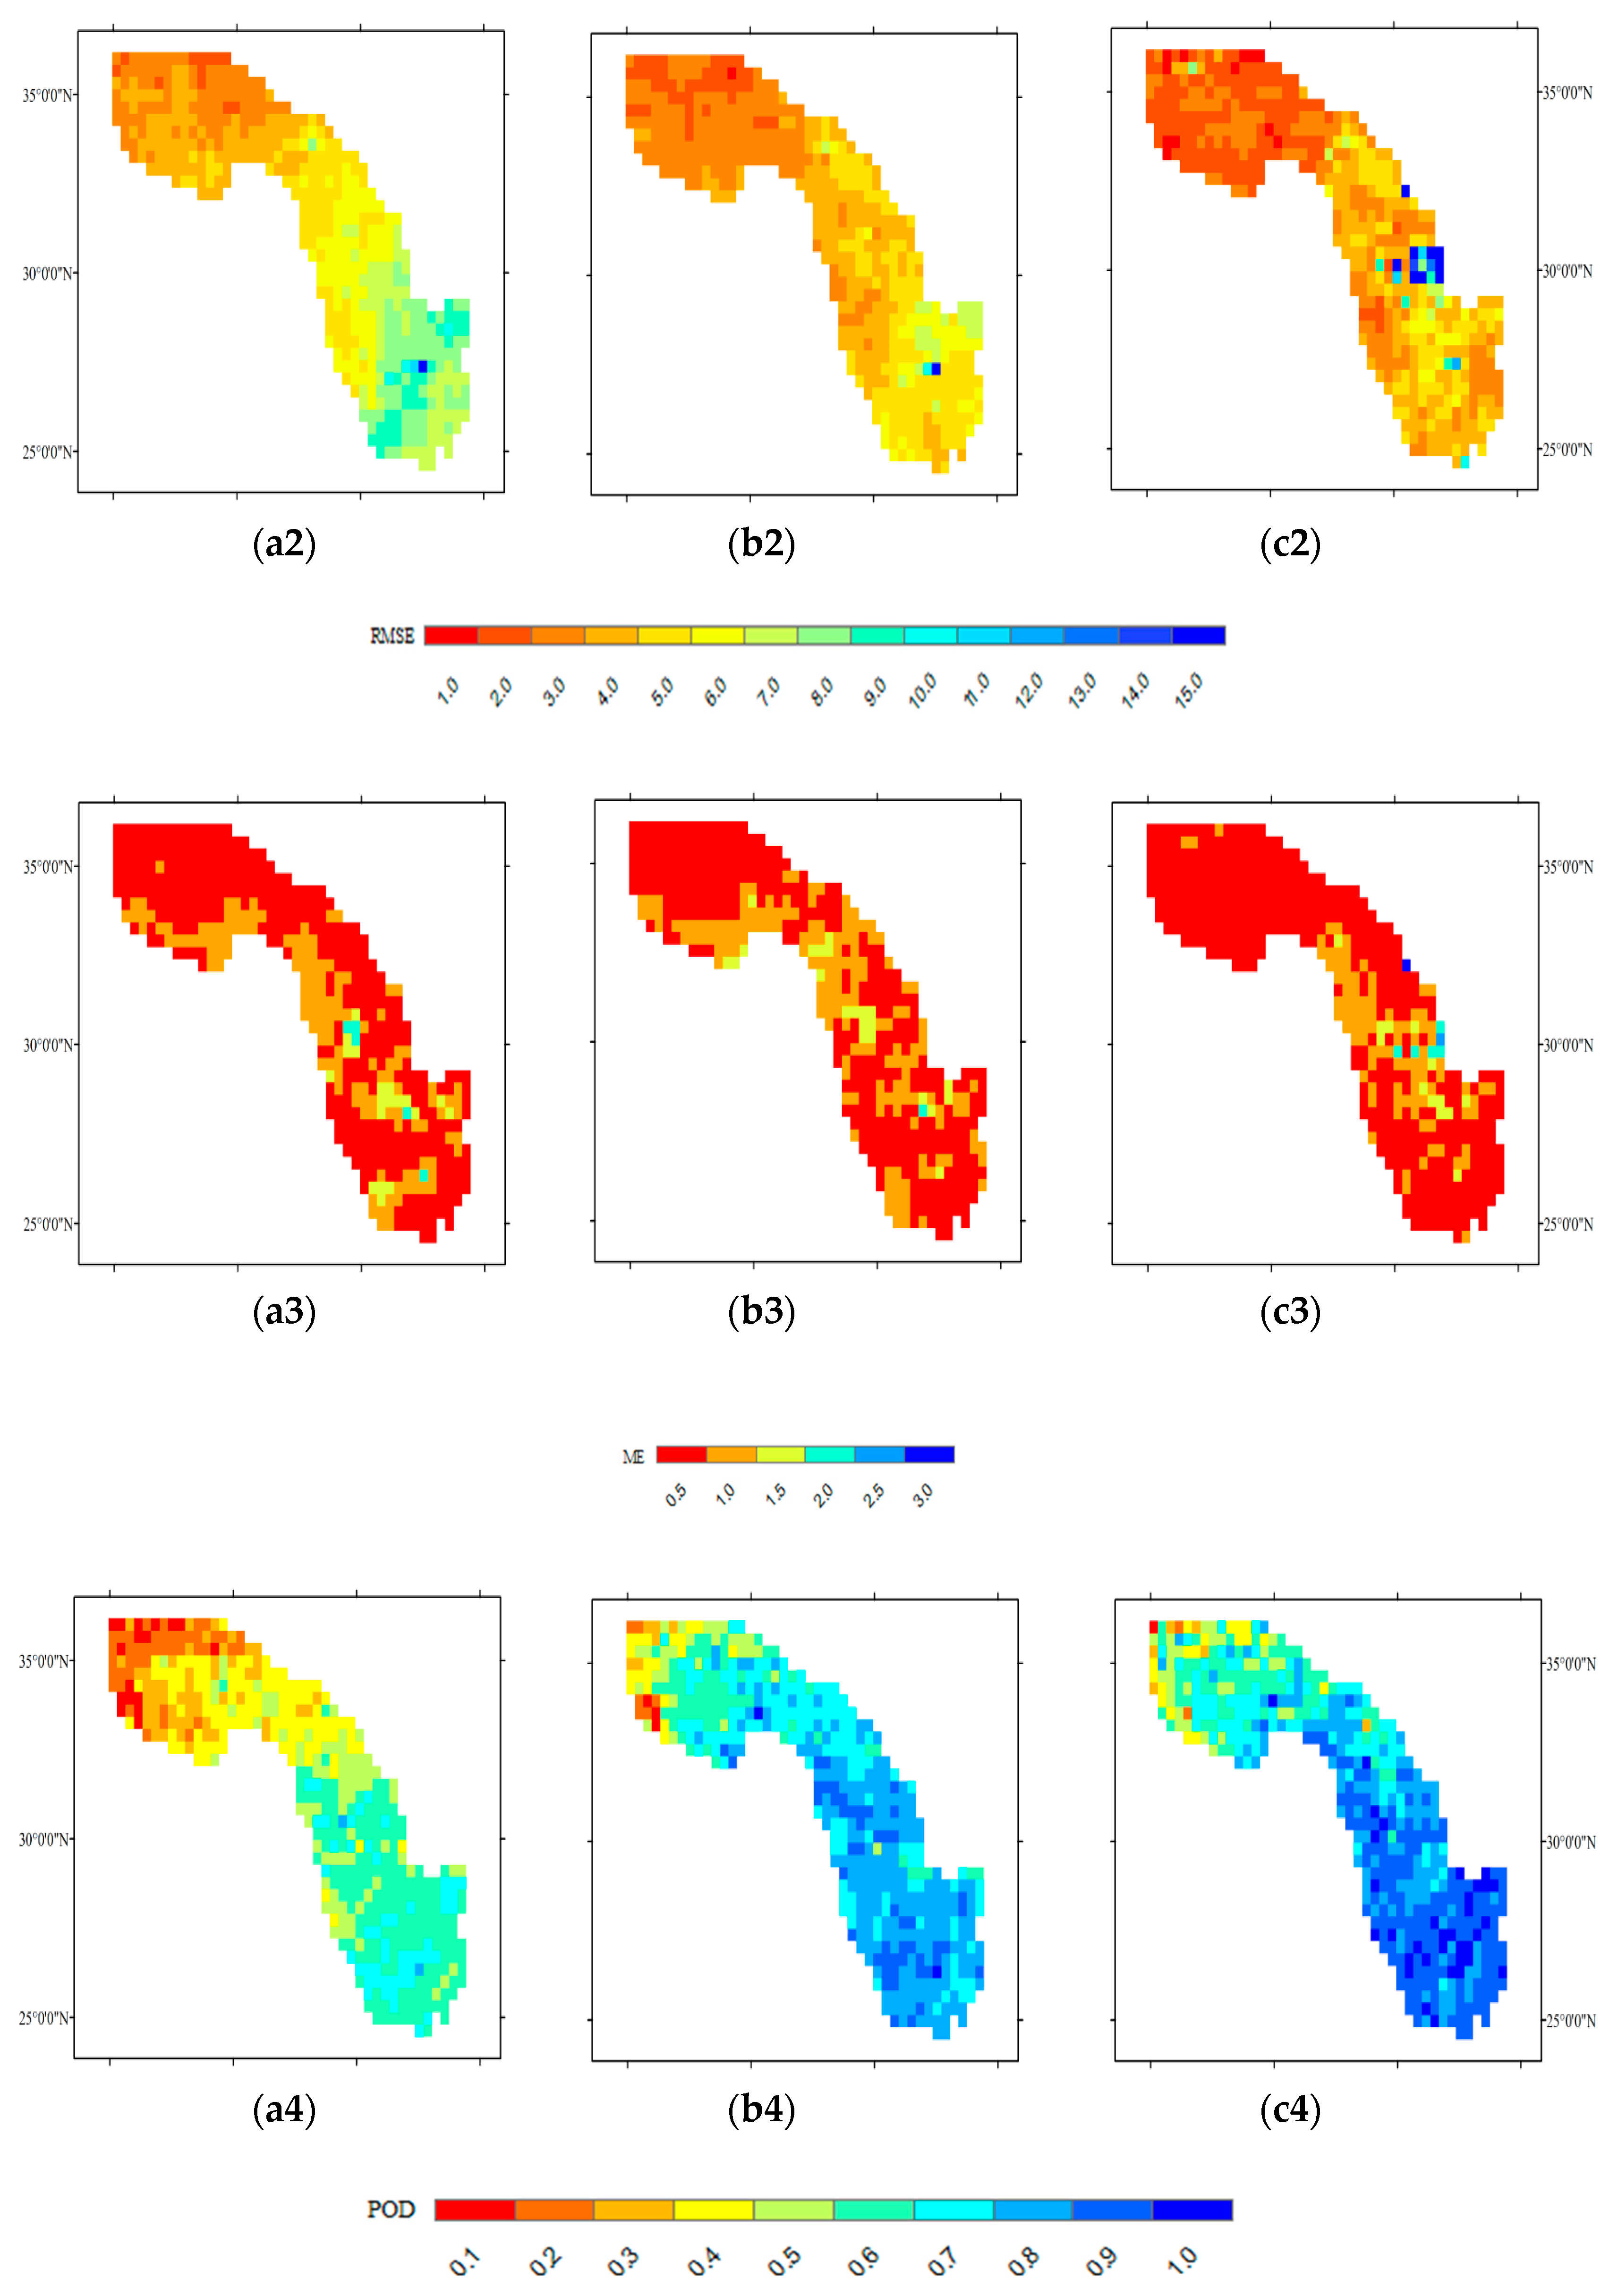
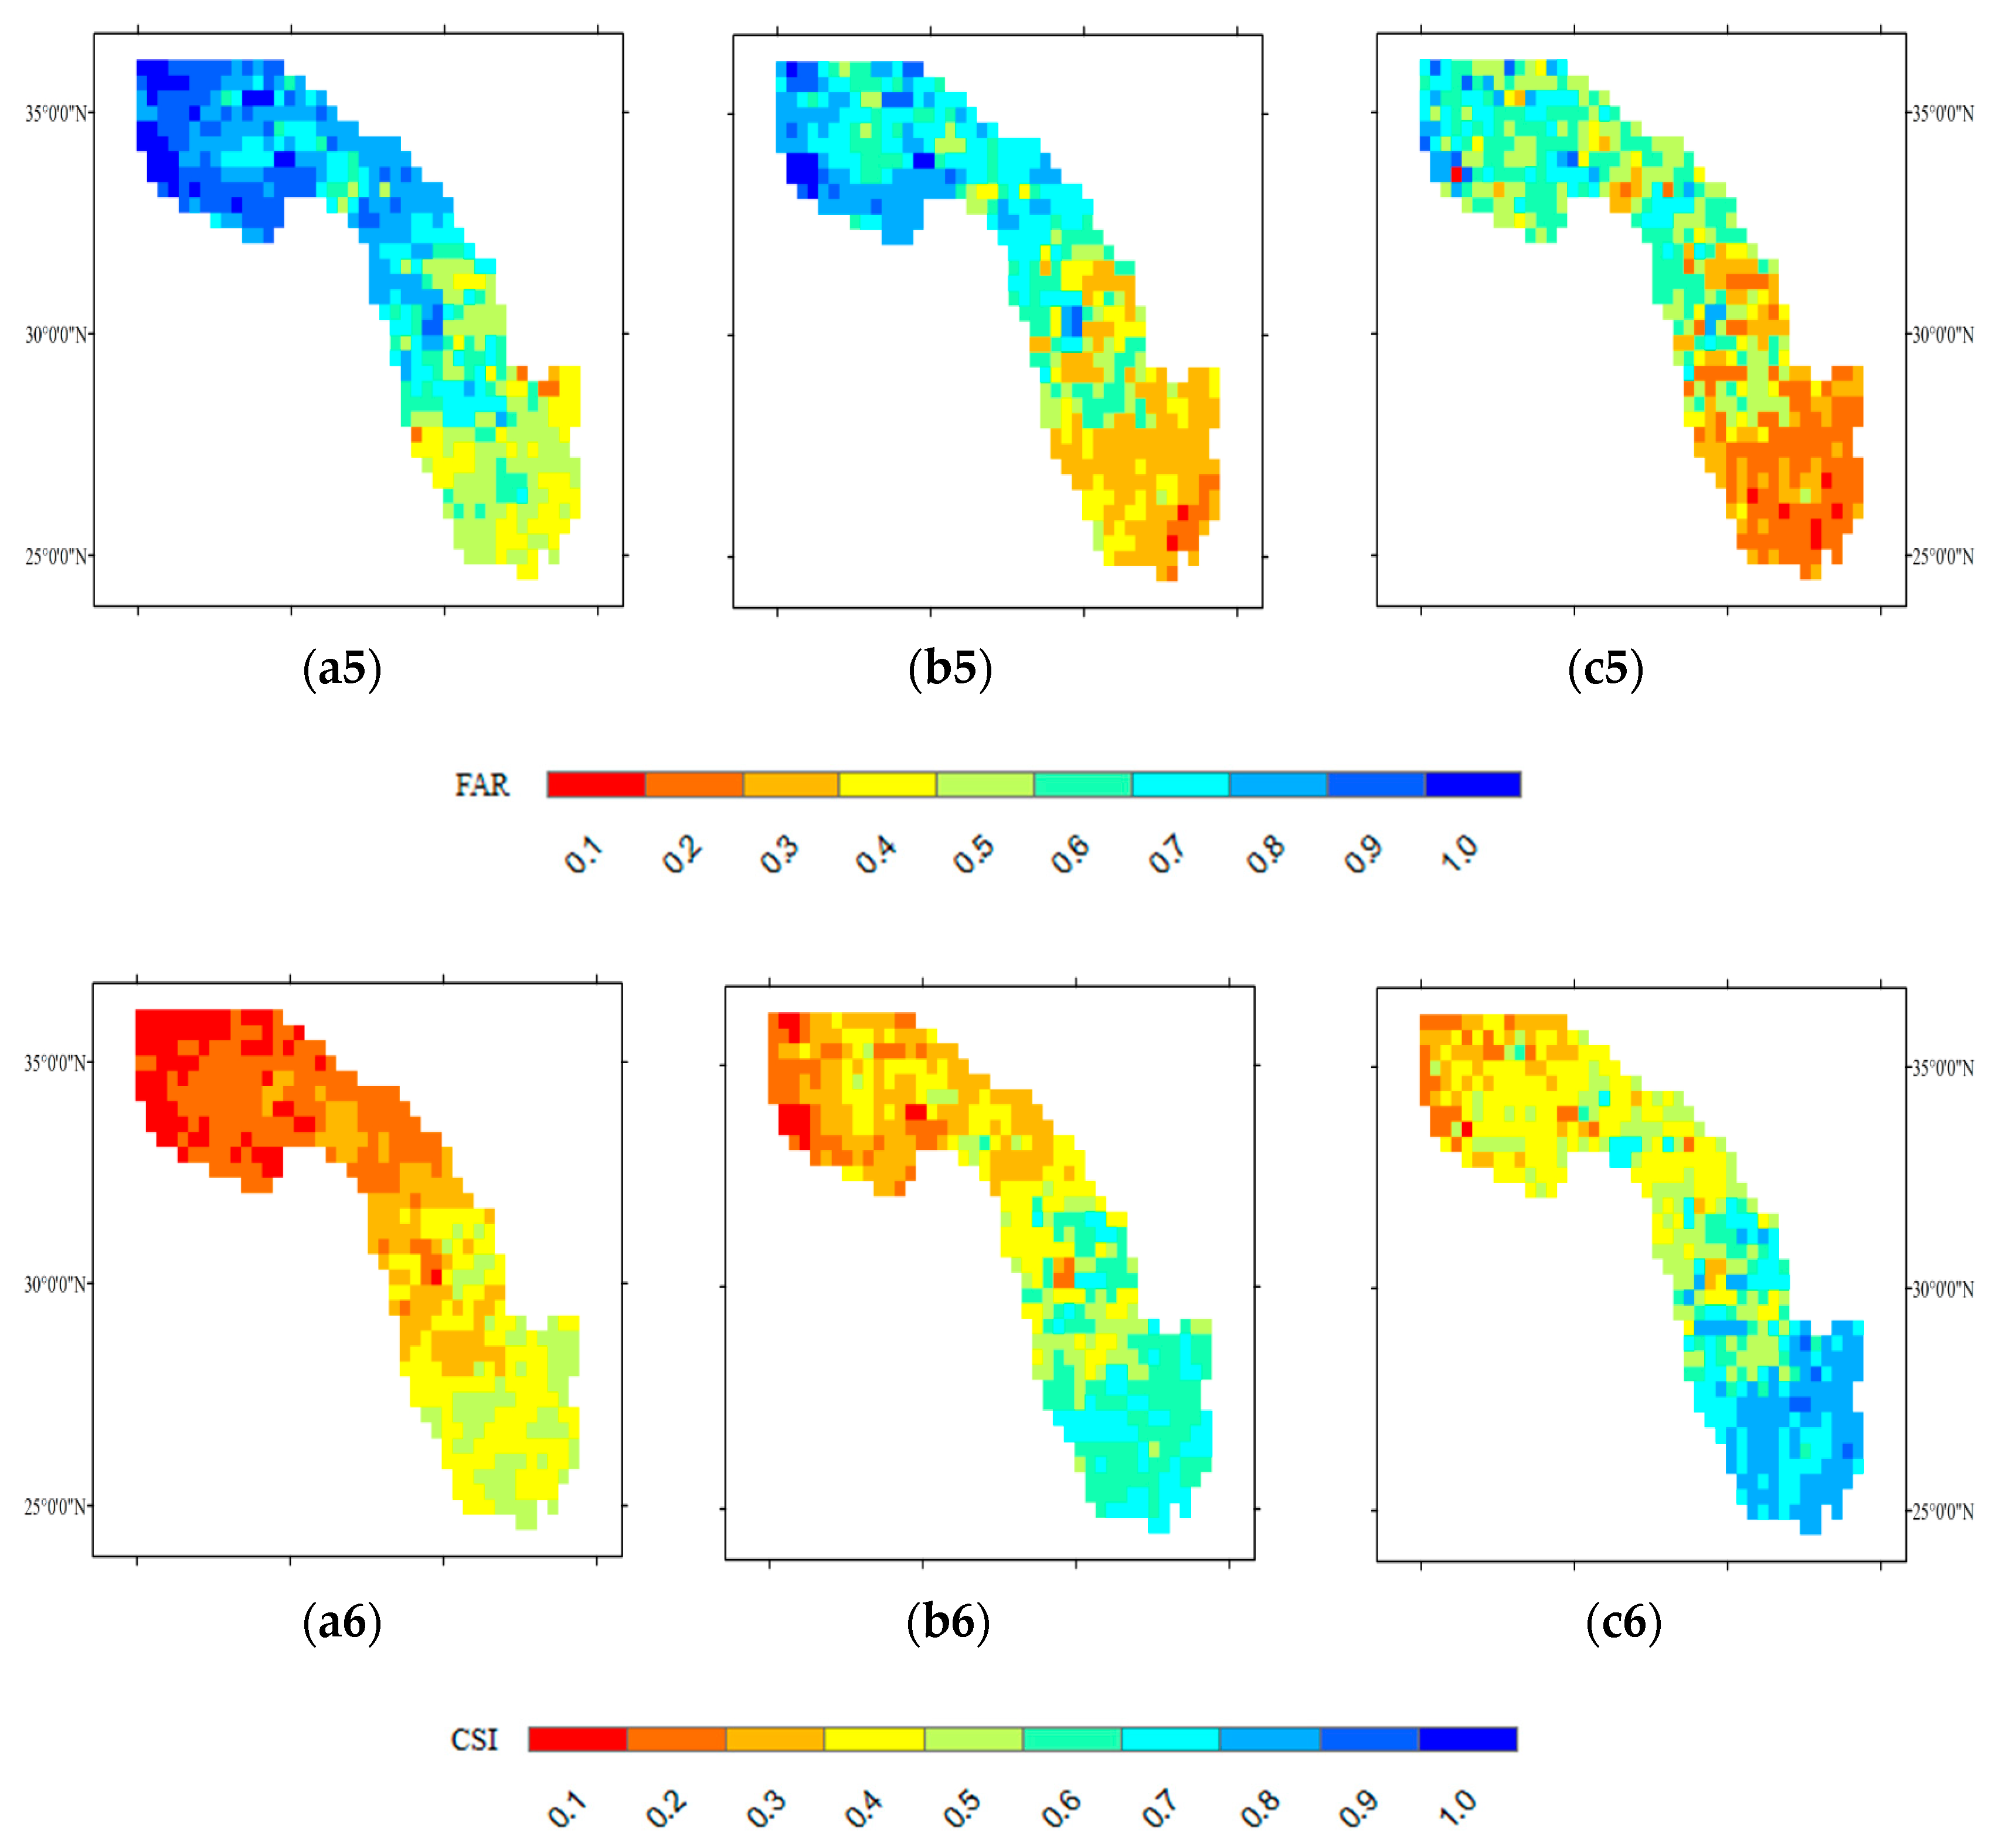
Figure 6 shows the spatial distribution status.
From 6a1–c1, we can intuitively see the performances of precipitation-related markers over the entire study period. The spatial distribution of precipitation in the Jinsha River Basin is not uniform. This is because the northwest plateau blocks moist air flow, resulting in less precipitation. In the southeast, the effects of precipitation air flow and oceanic monsoon winds causes increased precipitation. The middle of the basin is a transition zone between these 2 regimes. All 3 precipitation data products demonstrated better performance in the middle and lower reaches of the basin, areas with abundant precipitation. Due to the effects of the plateau westerly winds, the detection correlation of the precipitation data was relatively weak for the comparatively dry middle and upper reaches of the river basin. From the correlation coefficients of the 3 different precipitation products in
Figure 6a1–c1, we can see that the correlation coefficients for the middle and lower reaches of the basin were greater than those of the upper reaches and the precipitation data from the middle and lower reaches exhibited better performance(The more blue grids, the better the correlation coefficient). In comparison, CMADS showed more grid correlation coefficients that were close to 1 in the upper and middle reaches. The spatial distribution maps of PODs (
Figure 6a4–c4) proved once again that CMADS displayed relatively high POD for precipitation and its POD and CSI for precipitation in the middle and lower reaches were significantly higher than those of the upstream plateau region, while FAR was relatively low. From
Figure 6a2–c2, we can see that the RMSE markers for IMERG and CMADS generally fell within the range of 10 mm, while there was 1 downstream site in the TMPA precipitation product that was greater than 10 mm. The MEs (
Figure 6a3–c3) of the 3 products all displayed good performance. These values in the grids were generally within the 0.5 range. In addition, the ME error markers for the 3 different precipitation products all tended towards 0. This indicates that when either TMPA, IMERG or CMADS were used in the study site, both the mean error and the observed precipitation error were very small. Thus, the precipitation input can be applied to relevant studies in this river basin within a certain range. From the comparison data, we can see that the overall performances of the spatial distributions of these 3 products were consistent and the error markers and PODs for the plateau region in the upper reaches were all lower than those of the basins and plains in the middle and lower reaches. The overall correlation coefficients showed better performance in the middle and lower reaches than in the upper reaches. The overall mean errors were all within 0.5. IMERG showed slightly better POD, FAR and CSI for detection of precipitation events than TMPA and slightly poorer POD than CMADS.
4.3. Temporal Analysis
Analysis of time series distribution maps:
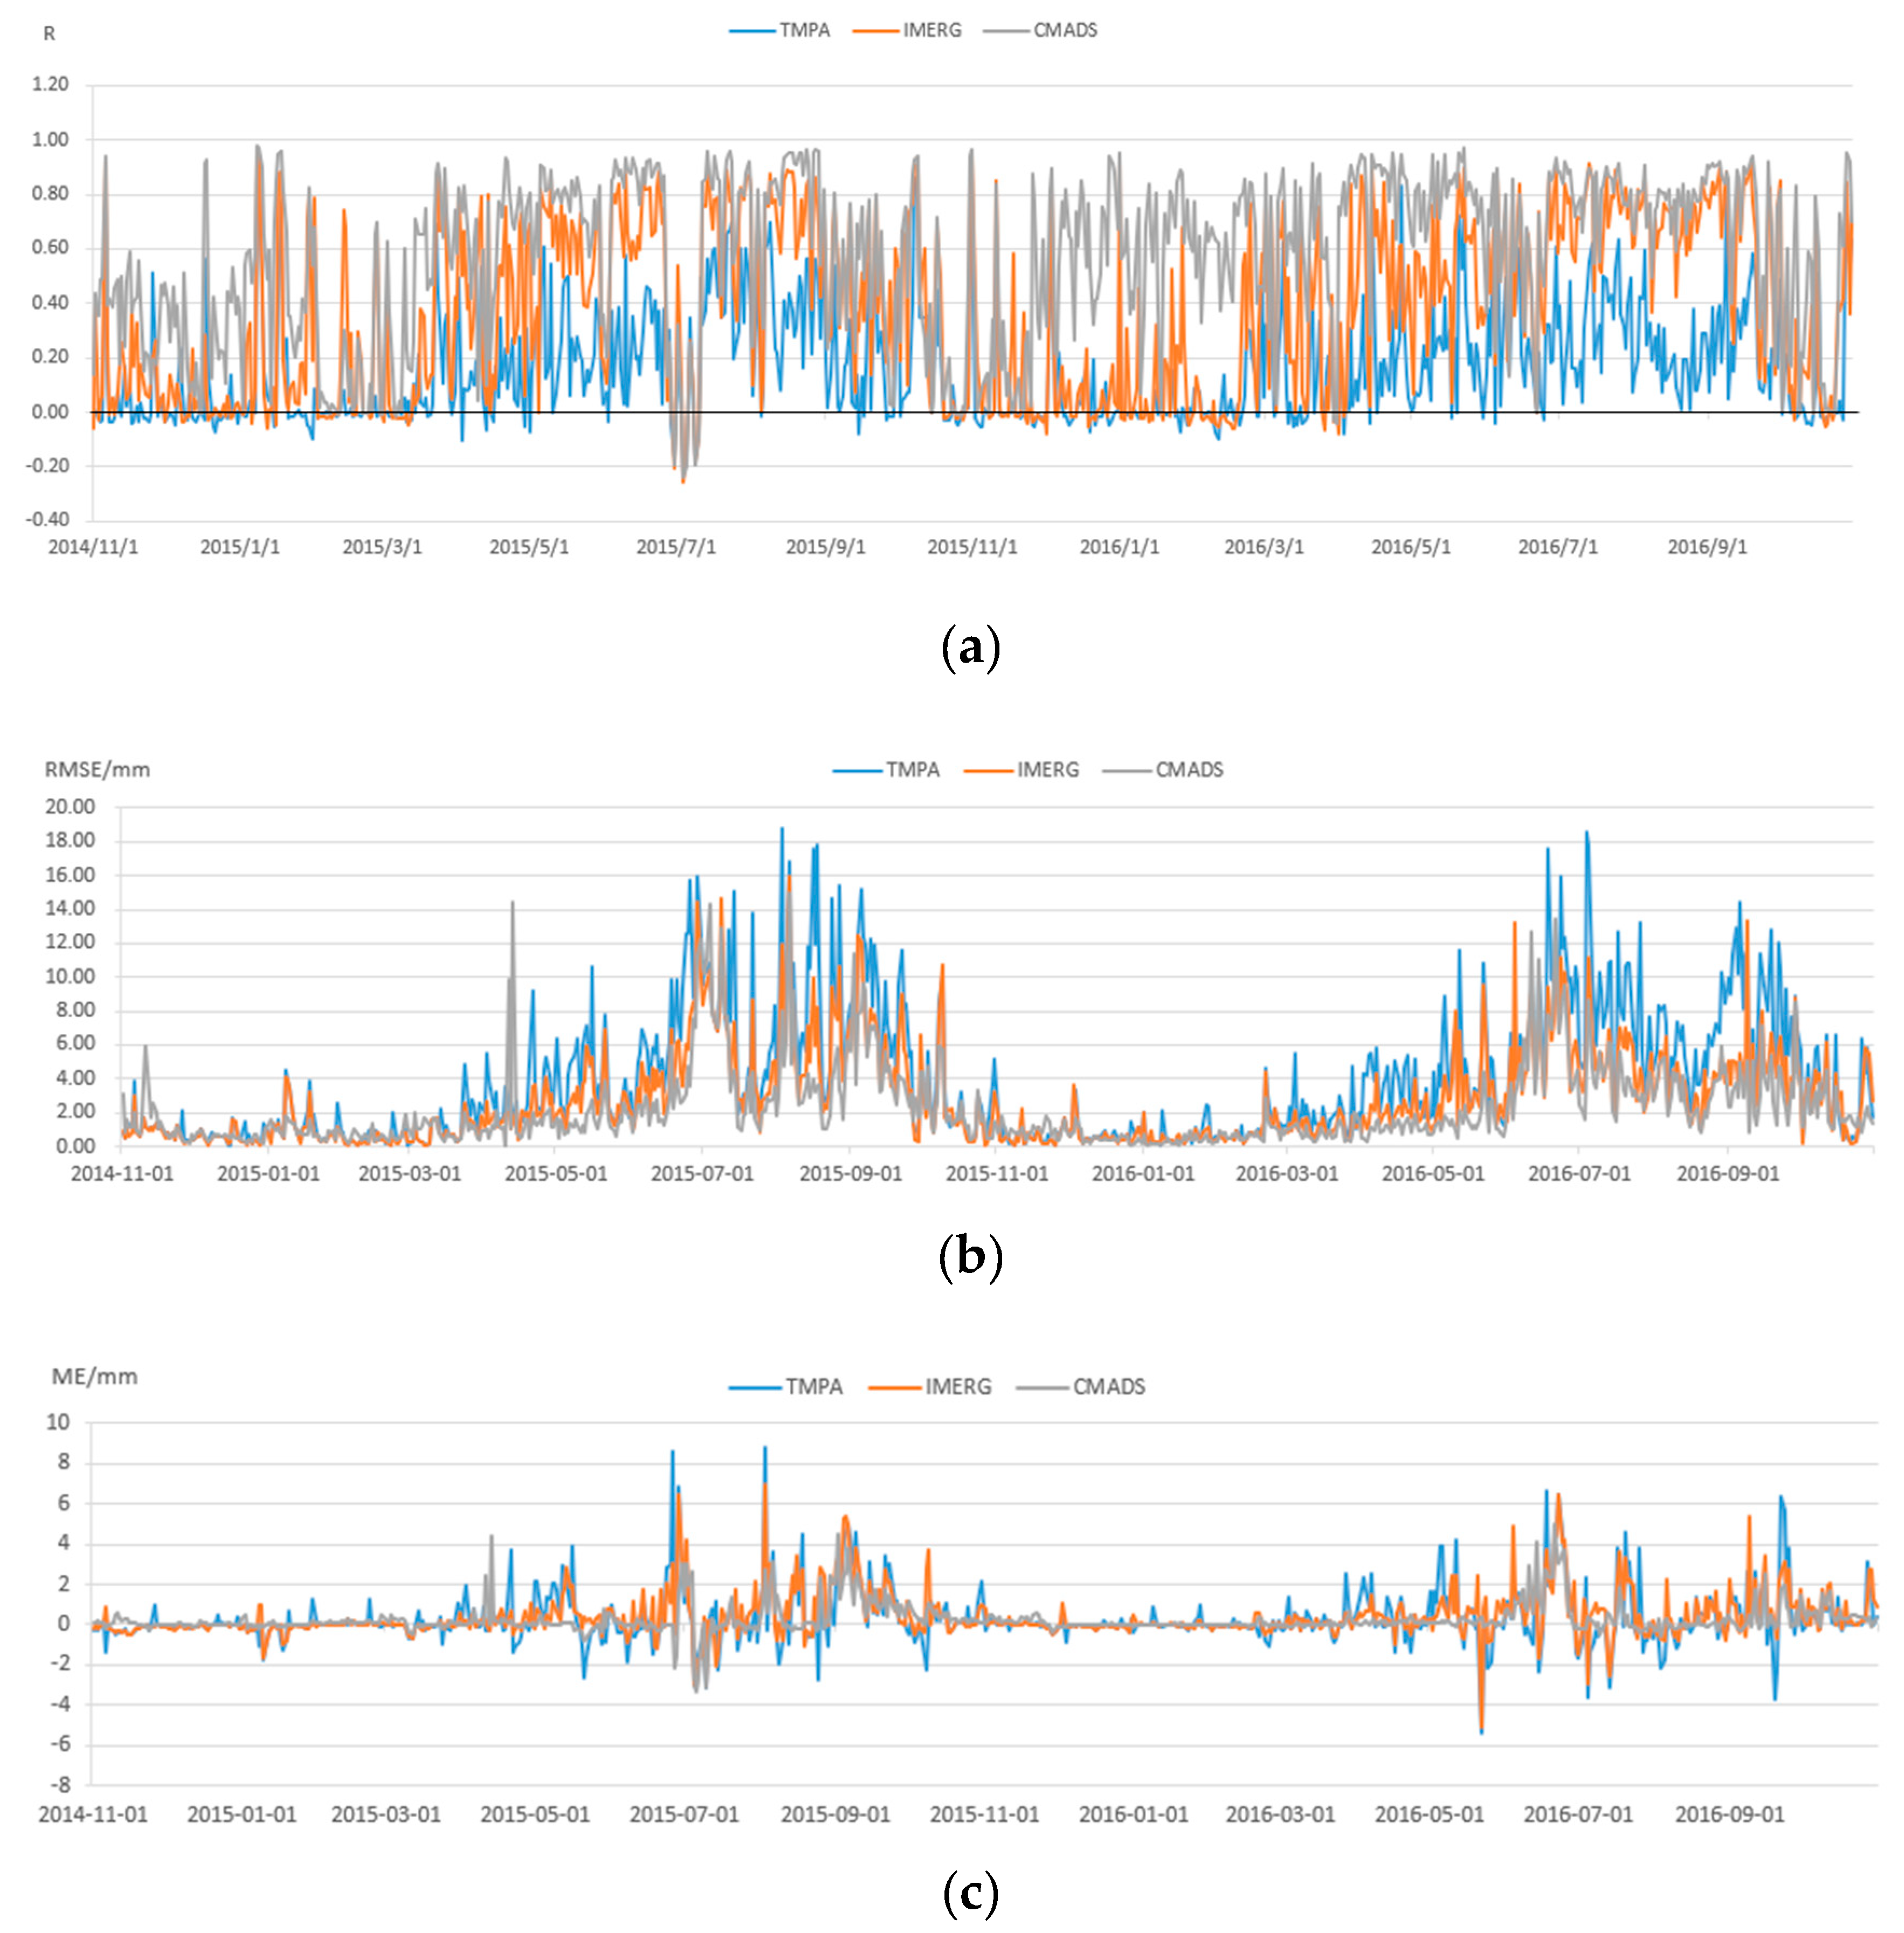
The 910 grids squares were used as study objects for the analysis calculations in order to obtain the changes of error markers over the full cycle of the 2014–2016 study period (
Figure 7).
From
Figure 7a, we can see that the correlation coefficients (Rs) of the 3 different precipitation products all tended to approach 1 during the 2 rainy seasons and their RMSE markers exhibited dry-rainy season cyclical changes. The ME showed fluctuation errors around the optimal error value line of 0. The fluctuations of the mean errors for the entire observation data were all within 10 mm.
The correlation coefficients for CMADS and IMERG were better than those of TMPA the majority of the time. In July 2015, the 3 products all had lower correlation coefficient values. This was the month there were more missing values when processing the MERG data of the satellite precipitation data since the TRMM satellite had just entered the atmosphere in June 2015. The subsequent substitute fusion precipitation product, TMPA, may show signs of instability in the first month. During the November 2015–April 2016 dry season, CMADS had a better correlation coefficient than either IMERG or TMPA. As the rainfall station data in China were corrected over the entire coverage range of CMADS, the correction results of the precipitation data from the Jinsha River Basin during this period improved. The mean annual precipitation totals for the rainy season and dry season of the Jinsha River Basin range from 244–886 mm and 12–130 mm, respectively [
57]. Since the Jinsha River Basin is characterized by a pronounced vertical gradient, the annual mean precipitation range varies significantly with elevation and climate conditions. The RMSE marker demonstrated significant periodicity during the validation period. Although the deviation of the RMSE marker was greater during the rainy season and its maximum controllable range was 20 mm, comparison of the RMSE of 20 mm with the maximum precipitation of 886 mm during the same period indicated that its relative effects on deviation was not prominent. The precipitation totals detected by TMPA and IMERG from November 2014–April 2015 were less than those detected by CMADS, which is particularly apparent in
Figure 7a. Winter precipitation is relatively scarce and plateau temperatures are relatively low, with a mean annual air temperature less than 0 °C. Subsequently, there will be some solid precipitation and plateau radiation that will test the detection capabilities of the satellite. CMADS has sparsely distributed ground station data available for correction, which provides an advantage in the form of relatively small errors.
5. Suitability Assessment for Precipitation Products in the River Basin
5.1. Construction and Calibration of River Basin Hydrological Models
In order to further validate the accuracy and suitability of precipitation data in the study region, we input the precipitation datasets into hydrological models and drove model operation to simulate the variation trends of cross-sectional runoff at the river basin outlet. The model output was then compared with actual runoff data. Comparative analysis was used to validate the results when different precipitation inputs were used to drive runoff at the river basin outlet and to provide theoretical support for applications in water resources and water environment management in this river basin. In this paper, the SWAT distributed hydrological model was used for runoff simulation. This model has demonstrated good simulation results and accuracy for many river basins and its construction is relatively mature.
The Soil and Water Assessment Tool (SWAT) model was developed in 1994 by Dr. Jeff Arnold for the United States Department of Agriculture (USDA) Agriculture Research Service. This is a GIS-based distributed river basin hydrological model. In recent years, the SWAT model has undergone rapid development and application [
58]. The physics-based SWAT distributed hydrological model takes into consideration meteorological factors, land use, soil and other elements and divides an entire river basin into different sub-basins. Each sub-basin has different current soil and land use statuses. The model can be used to simulate hydrological processes, soil erosion, chemical processes and biomass changes in a river basin [
59]. Its user-friendly interface, open-source program and high simulation accuracy have enabled it to be used in river basin water quality and water quantity simulations worldwide.
5.2. SWAT Hydrological Model Data Simulation and Calibration
In order to accurately simulate the precipitation-runoff process in the Jinsha River Basin and to allow for the effects of terrain in the river basin on surface runoff, the model first extracted the catchment area, elevation, gradient and other information based on digital elevation model (DEM) data. Next, the soil type, land use type and gradient levels in the sub-basin were determined. The sub-basin was further divided into hydrologic response units (HRUs). After this was completed, the compiled meteorological data (including precipitation, temperature, wind speed, air pressure, solar radiation and so on) were uploaded into the model. Following that, the runoff volume at the outlet of this sub-basin was added. SWAT Calibration and Uncertainty Procedures (SWAT-CUP) were used for parameter sensitivity analysis and SUF12 was used to calibrate the accuracy of model parameters. The parameters selected for sensitivity analysis were CN2, ALPHA_BF, GW_DELAY, GE_REAVP, ESCO, CH_N2, CH_K2, ALPHA_BNK, SOL_AWC, SOL_K, SOL_BD and SFTMP.
In this paper, 2014–2016 was the study period. The Pingshan hydrological station was used as the river basin control outlet. The 3 different precipitation products were used as precipitation input to simulate the daily mean runoff volume of this river basin. Based on CMADS datasets, the simulation period was used for parameter calibration and data fitting. During the validation period, we compared and analysed the performances of these 3 types of precipitation data in driving runoff and further validated the suitability of different precipitation data for the study site of this paper.
5.3. Hydrological Model Simulation Results and Analysis
In this study, the runoff simulation data during the 2014–2016 validation cycle was used for error analysis. BIAS and NSE were used as error markers to assess the runoff simulation results and to validate the runoff simulation results.
Table 4 shows the error markers for the full cycle of the study site.
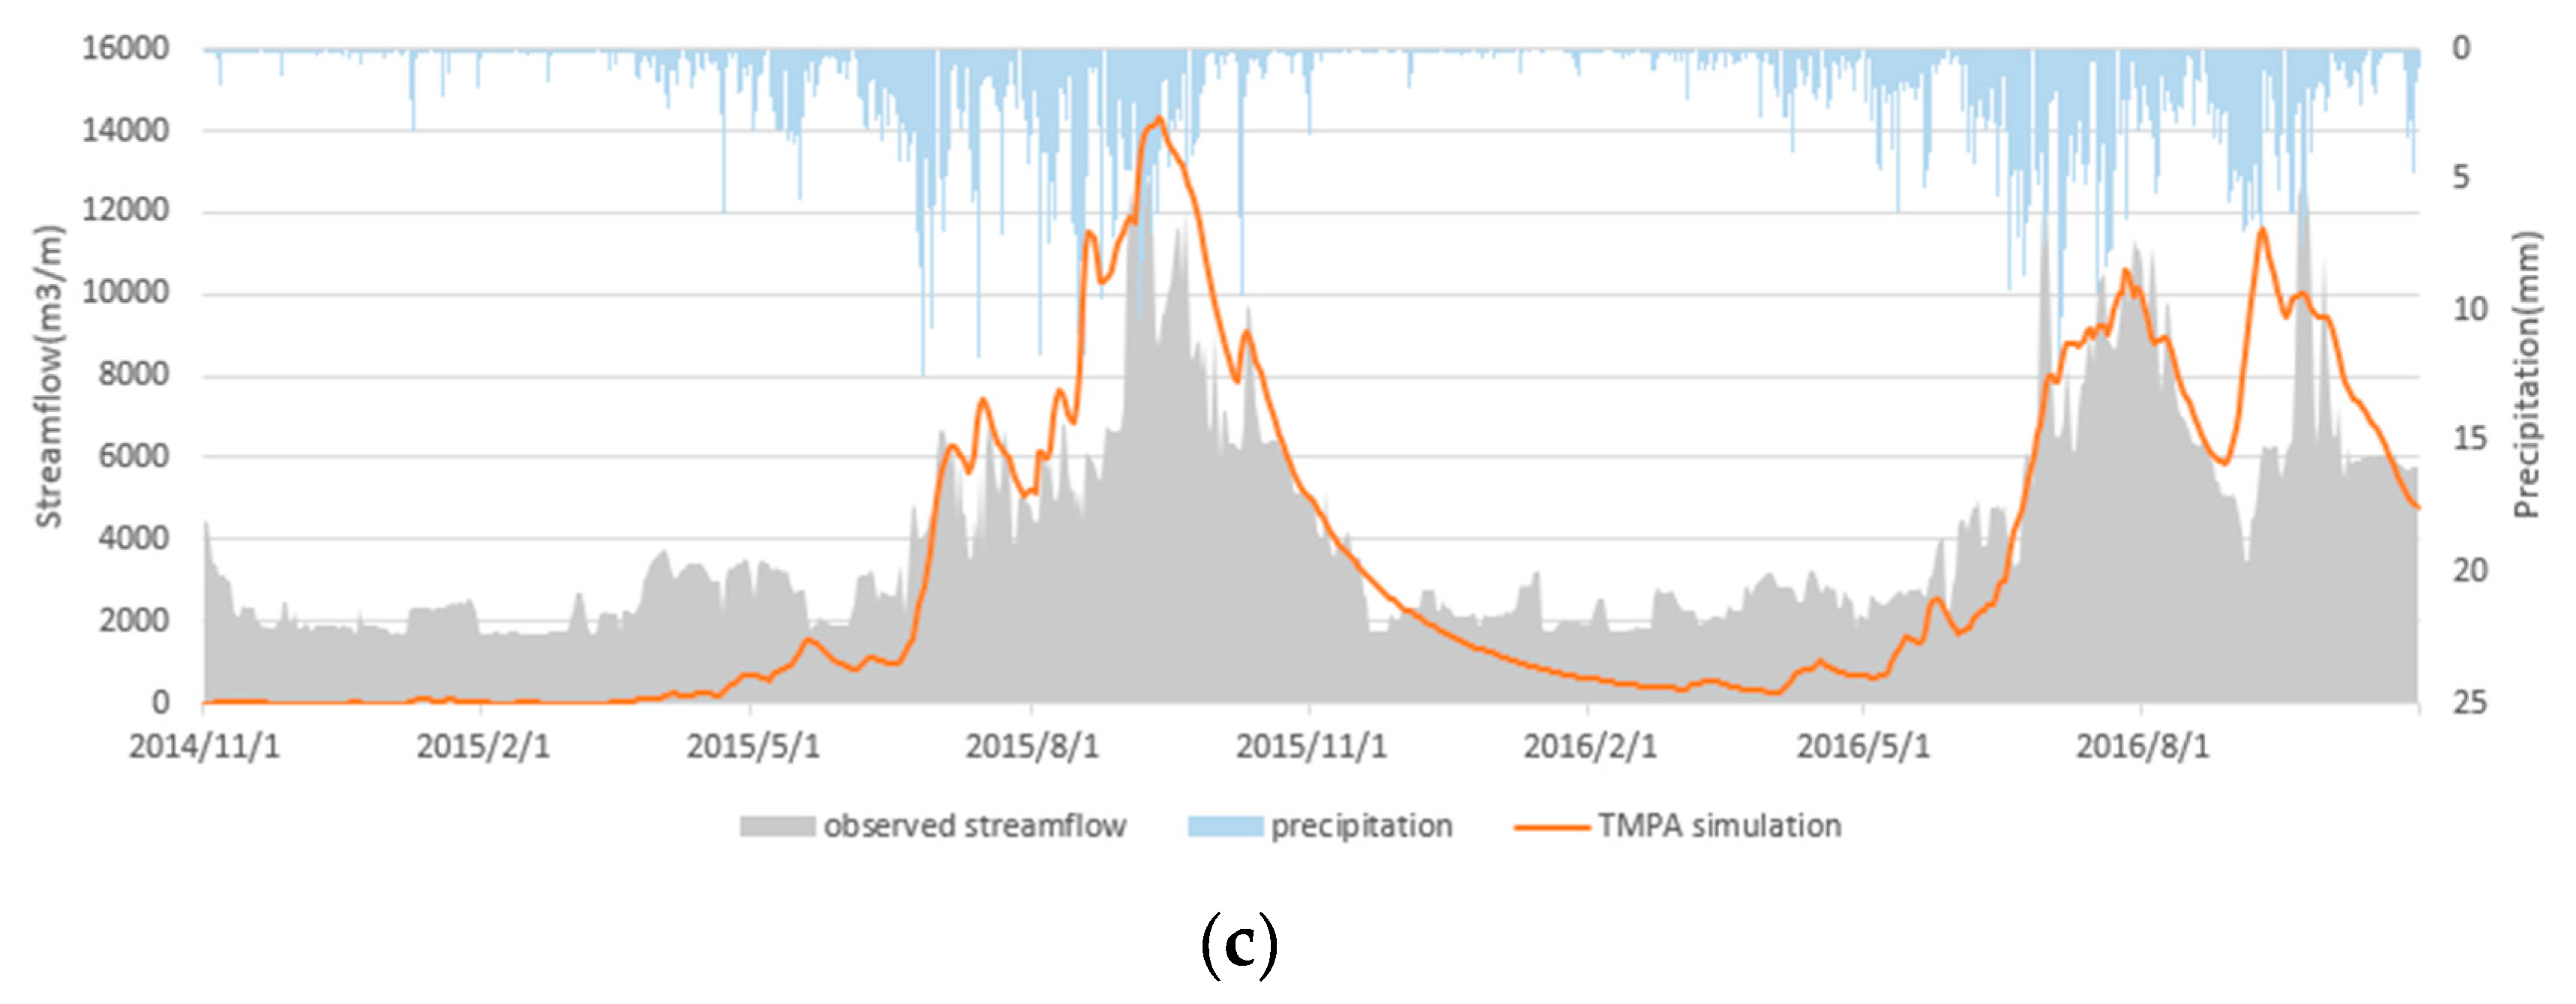
Figure 8 is the comparison chart for the simulated runoff and actual runoff in the full cycle of the study site.
By combining
Figure 8 with
Table 4, we can see from the runoff volume calculation results and runoff simulation error analysis at all timepoints in the validation cycle for the SWAT model simulation that good overall variation trends, as well as timing for trough values, peak values and flood peaks for runoff, can be simulated using the 3 products as model precipitation input. IMERG had a relatively large bias in the first dry season. This indicates that the first dry season from November 2014–April 2015 did not capture the actual runoff. The TMPA product showed a bias that was similar in magnitude to that of IMERG during the first dry season. Both the TMPA and IMERG (which is a subsequently improved version of the TMPA) precipitation products exhibited unstable performances in data quality during the study period and did not capture maximum flow at the same time. This may be due to the presence of inherent defects in the sensors of the TRMM and GPM satellites used to detect trace precipitation. The detection capabilities of these sensors require further improvements. The CMADS-driven simulated runoff captured the flow volume during this period although there was still considerable bias. On the one hand, this bias may be associated with the generation of the CMADS data, which was based on raw satellite data during the cold and dry winter months and may contain some satellite detection biases. These biases can be confirmed by the performances of the aforementioned TMPA and IMERG data. On the other hand, this bias may be due to the low total precipitation volume in the river basin during the dry season when the sensitivity of the river basin outlet simulation results to precipitation accumulation at the upper reaches was magnified. However, the ground stations in the plateau at the upper reaches of the basin that are used to correct the precipitation data are sparsely distributed. This in itself results in poor data quality. Even though there was considerable bias, the use of CMADS during this time period as precipitation input still captured the runoff volume to some extent and exhibited the best performance among the 3 products. In September 2015, the 3 different precipitation products all successfully captured the flood peak volume. The good flood peak capture performance of the 3 products during the first rainy season proved that the SWAT model has good runoff simulation accuracy for the Jinsha River Basin during the rainy season. This is particularly true for the capture of flood peak volume. IMERG did successfully capture the 2 flood peak volumes in September 2015 and October 2015. During these 2 periods, the performance of TMPA was better than that of IMERG. The relatively good hydrological performances of TMPA and IMERG proved that both of these products have application potential for future short-term flood forecasting for this river basin. During this study cycle, the NSE of CMADS was closer to 1, showing that although the capture abilities of TMPA and IMERG for some flood peaks were better than CMADS, the CMADS demonstrated better overall hydrological simulation accuracy during the entire cycle. The lowest biases for the hydrological simulations of the 3 products were TMPA: −0.02%, IMERG: −0.02% and CMADS: -0.03%. This further verified that satellite precipitation fusion products produce better simulation and detection results when precipitation is abundant.
Considering that there is no transition of parameters and data in the model at the beginning of the verification period, which may affect the accuracy of simulation. The study also took the dry seasons from November 2014 to April 2015 as the transition time of the model. Then we compared the prediction performance of runoff with the same parameters from May 2015 to October 2016. From the error markers, we can see that the relative biases for runoff simulations of the study site by the 3 different precipitation products over the entire validation period were relatively close. Excluding the simulation adaptation process during the transition period, IMERG and TMPA precipitation products were also able to approximate the simulation results of CMADS during the study period. In this article, the Nash coefficients of transitional runoff simulation are excluded to be 0.50 (TMPA), 0.45 (IMERG) and 0.55 (CMADS), respectively. According to the simulation results of Hydrological Information Forecasting Specification, it is in C program. The Nash efficiency coefficient does not reach the A and B schemes. The large reason for that is the large watershed area in the survey area (340,000 km
2) and the amount of runoff change captured in the outlet section of the basin has certain simulation accuracy limits of the global parameters. However, refer to the relevant large watershed parameters, according to He [
60] and the research results of runoff Nash coefficient (0.43 (gauge), 0.49 (tmpa), 0.53 (imerg)) in the larger watershed upstream of the Lancang River Basin (150,000 km
2). The hydrological simulation accuracy of the basin is still acceptable in this paper.
6. Discussion
Precipitation data studies have demonstrated that the generation of the TMPA precipitation data has provided a new avenue for hydrological and meteorological researchers to obtain accurate precipitation data. Researchers can download grid precipitation data for their study site free of charge and are no longer limited to the data acquisition from national hydrological and meteorological stations. This promotes hydrological and meteorological research in different research domains. The usage accuracy of TMPA in many regions and river basins has been verified by relevant studies. Assessments of the hydrological performance of IMERG, the subsequent precipitation product of TMPA, are currently underway. Therefore, in this paper, analysis in combination with observation data determined that the accuracy of the IMERG precipitation data in a river basin having a large area and complex terrain (in this case the 340,000 km2 Jinsha River Basin) can generally satisfy the hydrological simulation requirements and demonstrated improvements compared with TMPA in certain areas, as well as good accuracy for rainy seasons. The free CMADS dataset that was compiled by Chinese researchers also demonstrated good usage simulation results for the Jinsha River Basin.
For the November 2014–October 2016 time frame, we can see that the runoff simulation during the validation period produced good results, with relative biases of −0.02%, −0.02% and −0.03% for the TMPA, IMERG and CMADS products, respectively. This demonstrated the operability of the models. The SWAT model was used for runoff simulation prediction for this river basin, while the satellite precipitation data and the CMADS precipitation dataset were used to drive the SWAT model for hydrological simulation, which demonstrated good suitability for this river basin. Our simulation results indicated that when the CMADS, which was constructed by Dr. Meng for East Asia, was used as the meteorological data input to drive the SWAT model, the variation patterns and accuracy of runoff for the cross-section of the river basin outlet were both feasible, thus providing a theoretical reference for future research.
The Jinsha River Basin outlet—Pingshan hydrological station—is located at the stone ladder in Jinping Village, Pingshan County, Sichuan Province (28 km upstream from the Xiangjiaba Dam). The river segment that is measured by the Pingshan station is straight; there are 500 m upstream and 2000 m downstream of the measured segment which are bends in the river. There are no major tributaries that flow into the river near its upper or lower reaches. The station was built in August 1937. Due to the reservoir and hydropower generation of the Xiangjiaba Dam, the Pingshan station was changed to a hydrological station on 20 June 2012. The Xiangjiaba Dam is located at the Lianhuachi Campsite, town of Anbian, Yibing County, Sichuan Province. The test section is located 2 km downstream of the Xiangjiaba hydropower station, was completed in June 2008 and belongs to the Pingshan station (which is located 30 km upstream of the Xiangjiaba hydrological station). The Yangtze River Hydrological Bureau manages the operation of the dam. In 2012, the Pingshan station was removed and replaced by the Xiangjiaba hydrological station. Given this change, there will be errors in cross-sectional measurements for flow volume at the outlet of the Jinsha River Basin in long-series runoff simulations and the relevant effects can be verified by researchers in the future.
7. Summary and Conclusions
In this study, the Jinsha River Basin was used as an example for quantitative analysis and assessment of the general accuracy and hydrological accuracy of three precipitation products: TMPA, IMERG and CMADS. The following paragraphs are a summary of this paper. The major study conclusions are as follows:
(1) At the river basin grid scale, the three different precipitation products all yielded small relative errors. The next-generation satellite precipitation product IMERG demonstrated performance comparable to that of the previous generation TMPA satellite precipitation product. The overall RMSE for IMERG was only 3.82 mm /day, indicating that the data had small precipitation errors. On the other hand, the mean error for CMADS was only 0.28 mm /day. For the average river basin grid scale, the overall assessment markers were better than those of the river basin grid scale. Since the Jinsha River Basin has a large area with numerous grid squares, the average river basin scale will eliminate some positive and negative grid biases. This is also one of the reasons the average river basin scale exhibited better error performance.
(2) In terms of the detection capabilities for precipitation events, the three types of precipitation data all demonstrated better performance at the middle and lower reaches of the Jinsha River Basin than the upper reaches. The upper reaches of the Jinsha River are in the Tibetan Plateau and the differences between the upper and lower reaches are great due to the effects of melting glaciers. The relevant precipitation data may cause inferior relative error performance for solid precipitation detection capabilities. For the precipitation detection capability markers, we found that CMADS > IMERG > TMPA. This proves that IMERG has better precipitation detection capabilities than the previous generation satellite precipitation product, TMPA. The CMADS precipitation dataset that was designed for the East Asian region was corrected using ground precipitation measurement data. Therefore, it now displays outstanding performance in terms of precipitation detection.
(3) From the hydrological simulation results, we found that the three open-source free precipitation products could all accurately detect the flood peak volume during the first rainy season. Although there were varying degrees of overestimation, the overall trends were good. TMPA and IMERG showed good capture performance for flood peak volume during the two rainy seasons. However, the performance of TMPA and IMERG in precipitation POD for the first dry season was relatively poor, when no flow was detected at all. During data processing, this portion of the data had more missing values, which affected the accuracy of hydrological simulations. We analysed the reasons for this and determined that the detection capabilities by satellite precipitation data for trace amounts of precipitation during the dry season are still weak and the corresponding fusion product is still affected by the sparse distribution of ground rainfall observation stations. In the future, improved processing methods may become available, resulting in more accurate detection of small precipitation events. CMADS data successfully captured maximum flow values in the runoff simulation for the first dry season and its performance in this regard was better than that of either IMERG or TMPA. In addition, the CMADS dataset contains precipitation, atmospheric temperature, air pressure, humidity and other data. This not only makes data usage convenient but also yielded good results for the Jinsha River Basin in this study.
(4) In this paper, SWAT model simulation and sensitivity analysis of measured runoff data from the Pingshan station in 2014–2016 was applied during the study period, leading to good hydrological simulation results. The relative NSE for the full validation cycle reaches 0.55. The issue of numerous missing precipitation data values during the first dry season was the primary factor affecting the SWAT model’s simulation results and caused the bias for the first dry season to be larger, affecting the simulation accuracy for overall runoff. However, performance for the rainy season was good. In the future, researchers should continue attempting to validate the effects and errors of the Pingshan station migration on hydrological simulation and water resource management in this river basin through long-series runoff simulations.
In summary, the TMPA, IMERG and CMADS precipitation products were used for the Jinsha River Basin and displayed pros and cons in terms of precipitation error markers, precipitation POD and hydrological simulation runoff analysis markers. Their applications in river basin precipitation-runoff studies have shown acceptable ranges of error. These results demonstrate the suitability of these datasets for the Jinsha River Basin study site. TMPA, IMERG and CMADS datasets exhibited good performance in terms of predictions for the study site and can be applied in both hydrological and meteorological management for the Jinsha River Basin when the long-series product becomes available. Future researchers may investigate new precipitation products from different sources in order to analyse their application potential and to identify data and theoretical support for use in the water resource management of river basins.


