Systematic Analysis of Geothermal Resources in the Coastal Bedrock Area of Chunxiao Town (China) by Using Geochemistry and Geophysics Methods

1
State Key Laboratory of Biogeology and Environmental Geology and MOE Key Laboratory of Groundwater Circulation and Environmental Evolution, School of Water Resources and Environment, China University of Geosciences (Beijing), Beijing 100083, China
2
China Institute of Geo-Environment Monitoring, Beijing 100081, China
*
Authors to whom correspondence should be addressed.
Water 2019, 11(2), 214; https://doi.org/10.3390/w11020214
Submission received: 8 December 2018
/
Revised: 21 January 2019
/
Accepted: 24 January 2019
/
Published: 28 January 2019
(This article belongs to the Special Issue Groundwater Resources Assessment: Quantity and Quality)
Abstract
:Geochemical and geophysical investigations were carried out to obtain more evidence of the potential of geothermal resources in Chunxiao Town (China). Hydrochemical data indicate the possible existence of mixing process between deep geothermal water and shallow groundwater. Analysis with SiO2 geothermometer shows that the geothermal reservoir temperature was estimated around 40–60 °C. In addition, combination investigations with CSAMT, radioactive radon, and soil thermal-released mercury detection reveal the specific location of the conduction fractures for thermal water circulation. Furthermore, the drilling work shows the deep thermal water temperature of >55 °C and the thermal water yield of 300 m3/d. All these results could provide important guidance for the scientific exploration and effective utilization of geothermal resources in coastal area.
1. Introduction
As an important renewable clean energy, geothermal resources (including guidance and the low-to-medium temperatures) have been of extensive concern all over the world for residential and commercial purposes, such as space heating and electric power generation [1,2,3]. The low-to-medium temperature geothermal resources (i.e., below 150 °C) are widespread in the world, and represent one of the most readily-exploitable geothermal resources [4]. A systematic assessment of the low-to-medium temperature geothermal resources would provide a useful guidance for the sustainable development and utilization of thermal water.
In geothermal resource assessment, hydrogeochemistry methods are an important way to obtain some useful information, such as geothermal fluid origin, mixing processes, water–rock interactions, reservoir rock, and reservoir temperature [5]. The common hydrogeochemistry methods include hydrochemical characteristics analysis, isotopic compositions analysis, and geothermometer analysis [6,7,8,9]. By using hydrogeochemical analysis, the chemical composition differences between groundwater with natural evolution process, and that with thermal water mixed, could be identified, which could be useful for qualitatively indicating hot water leakage deep underground. With isotope composition analysis (such as strontium, oxygen, and hydrogen), the sources of the thermal fluid (rainfall or seawater) and mixing processes between thermal water and shallow groundwater can be determined [3,10] and, based on the geothermometers (such as Na–K–Ca, Na/K, Na/Li, and silica), the geothermal resource temperature can be estimated, to support the assessment of thermal resource capacity.
Geothermal resources are mostly distributed in tectonic active zones, where the lithospheric thermal activity of tectonic units is intense. By deep circulation, atmospheric precipitation could move through faults or fractures and reach the deep heat source and, finally, form geothermal resources. Therefore, after we obtain the temperature information of the thermal water, specific information, such as the depth and location of the geothermal reservoir and the fracture channels, should be investigated by using geophysical prospecting methods. Many geophysical prospecting methods have been largely used, worldwide, in the last 30 years. Generally, geophysical methods used in geothermal exploration can be divided into five main groups, depending on the physical parameters measured: potential methods, geoelectrical method [11,12,13], electromagnetic (EM) method, seismic methods, radiometric methods [14]. Electrical and electromagnetic methods, which are the most widely used, measure the electrical resistivity distribution of the ground. From the resistivity distribution in the ground, structural and stratigraphic information could be obtained, and the condition of the occurrence and circulation of the geothermal system could also be determined. So far, this method has been successfully applied in the United States, New Zealand, Turkey, Iceland, China, and other areas all over the world [15,16,17].
Generally, in geothermal resources investigation and assessment, a combined application of the geochemical and geophysical methods can provide more reliable and sufficient geological information of the geothermal reservoir.
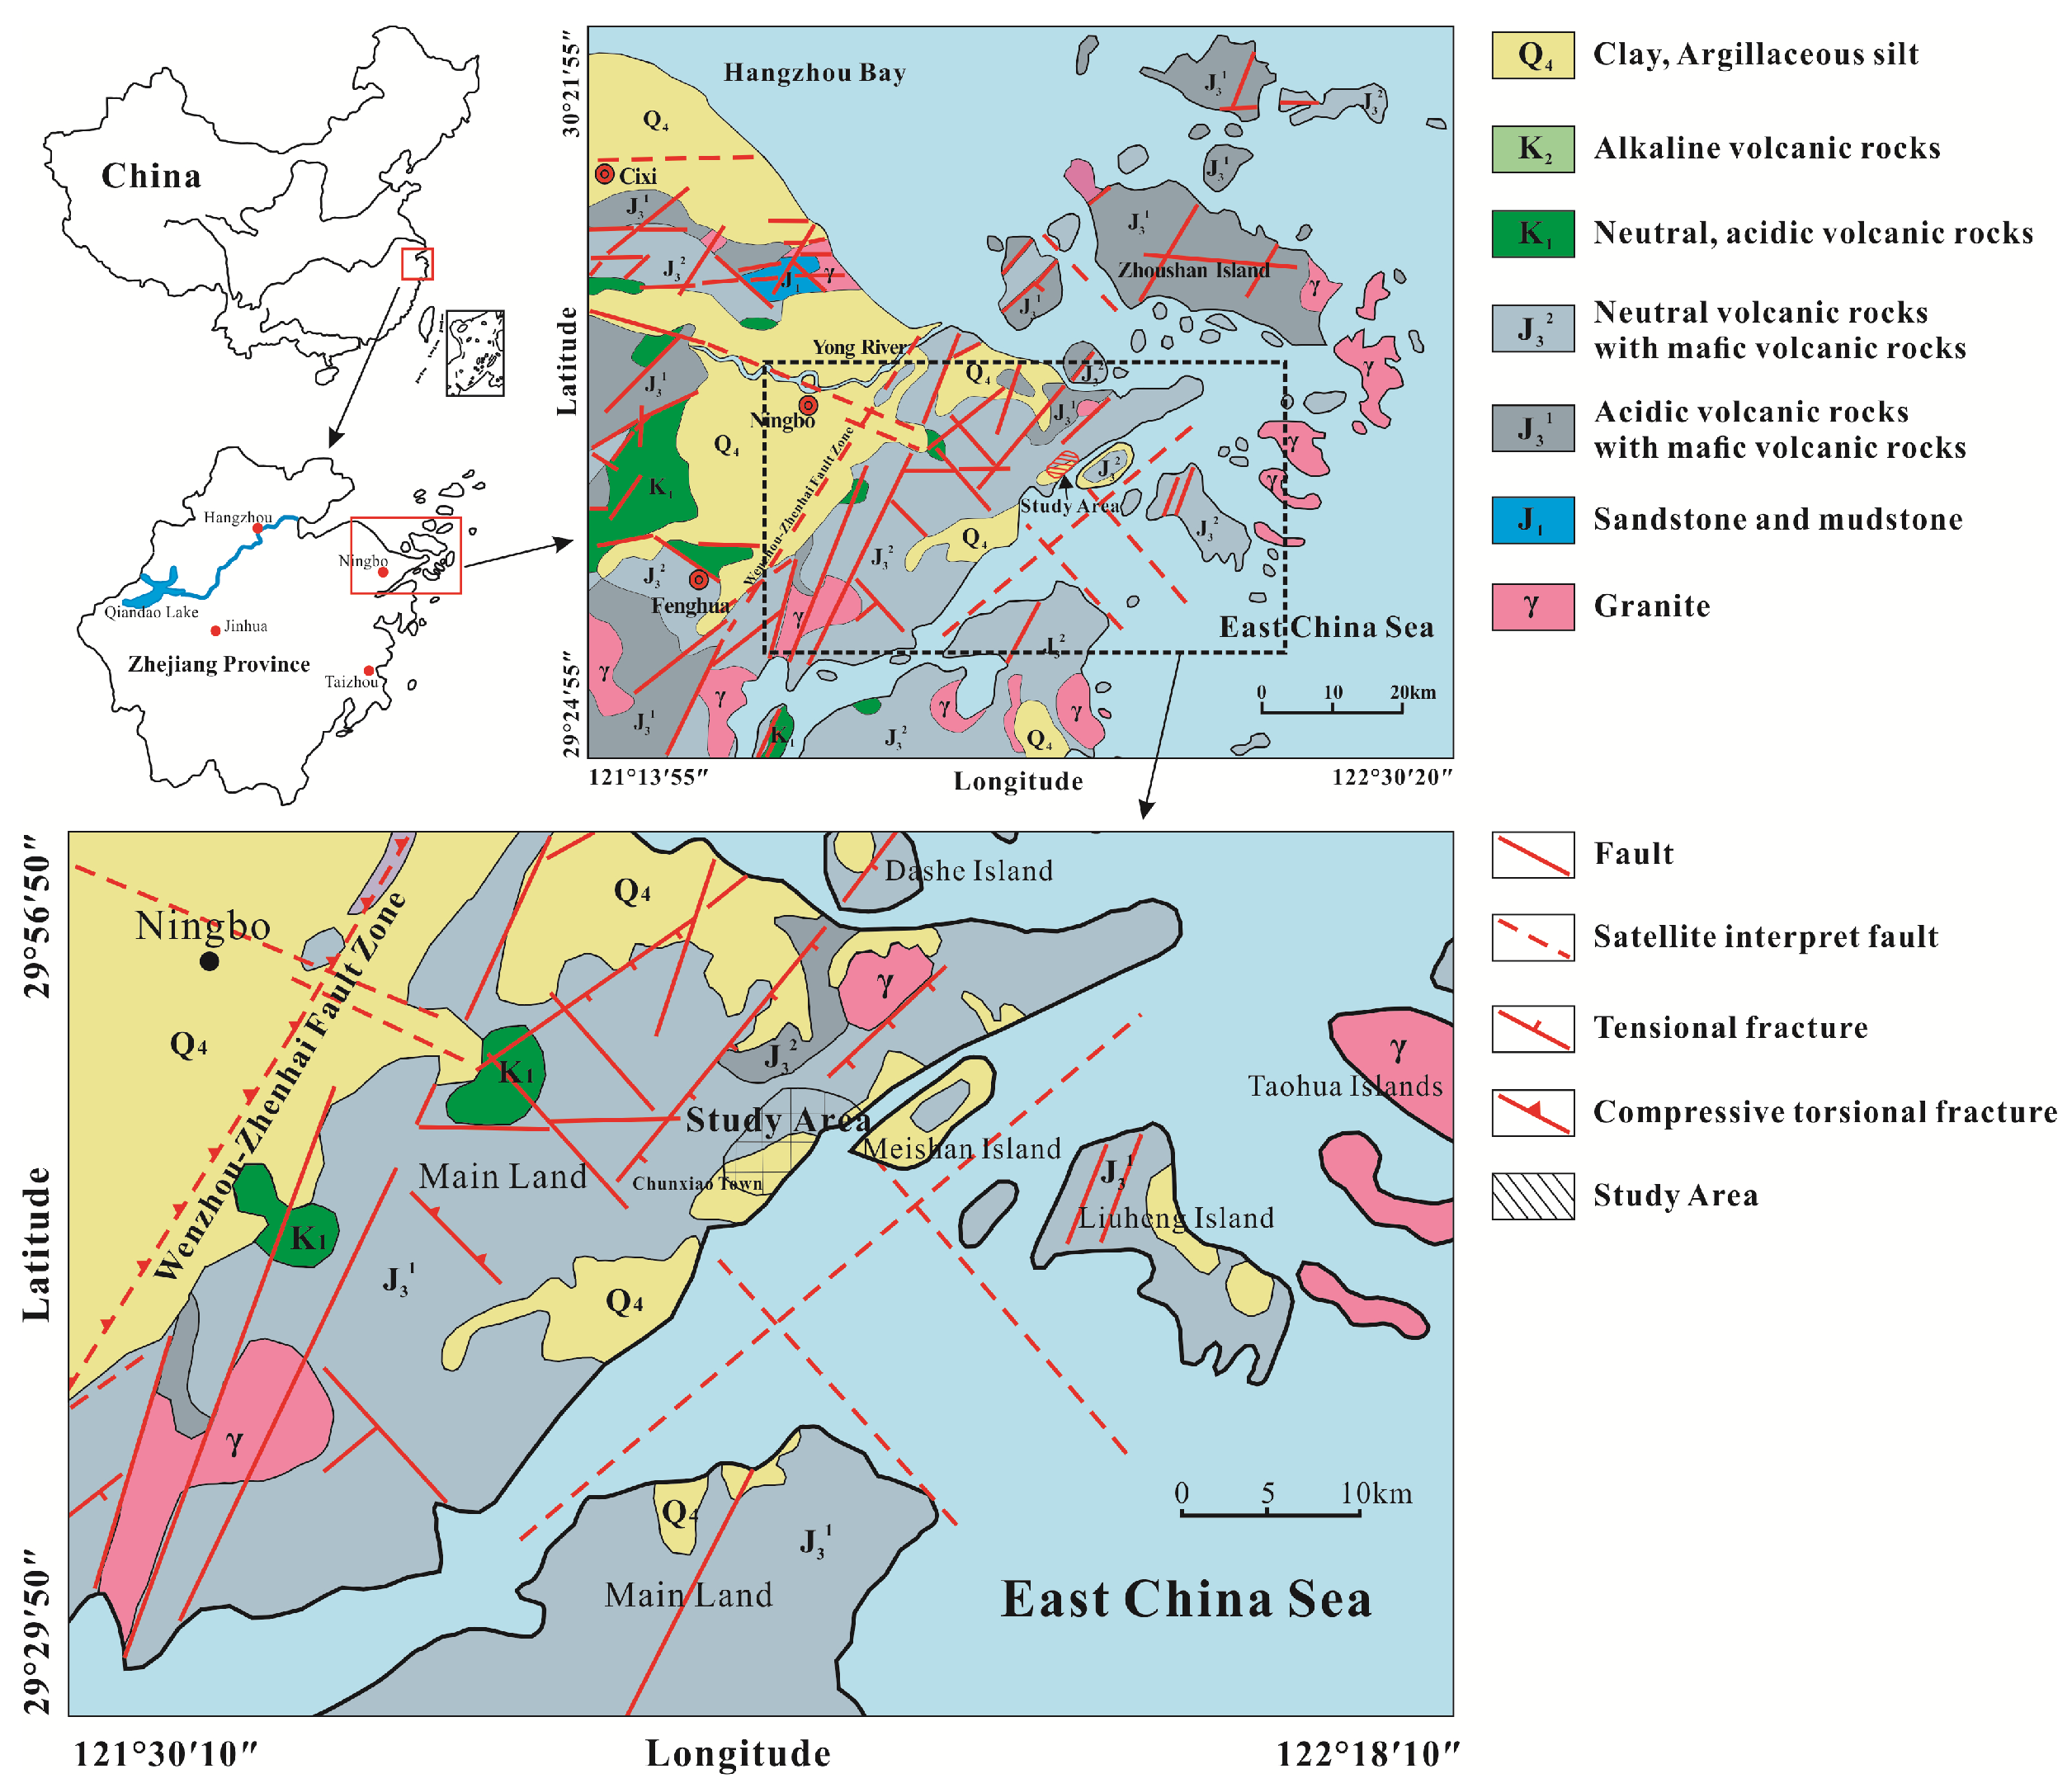
Chunxiao Town in Zhejiang Province (China) is located in a tectonic active belt in the western margin of the Pacific (Figure 1). Due to the subduction of the Pacific plate and the compression of the Philippine plate, the lithospheric thermal activity of the tectonic unit is intense, and the faults and fractures are well developed. The faults and fractures of different levels cut through the strata and formed water flowing channels in impermeable bedrocks. As long as the fracture system has reached a certain scale, it could constitute the circulation channels of geothermal water and formed geothermal resources eventually. These basic geological conditions constitute the occurrence of regional geothermal resources in this study area.
For Chunxiao Town and its surrounding area (such as Dongqianhu), there have been very few investigations on the thermal resources. Previous research [18] conducted systematic analysis with geochemistry and geophysics data in the eastern area (surrounding area of Chunxiao Town) of Ningbo city, suggesting the possibility of thermal resources in the regional area. Although Chunxiao Town is adjacent to the study area of previous research [18], it is impossible to determine the location and feature of the geothermal resource in our study area, as the geological conditions are complex (Figure 1).
Thus, it is necessary and meaningful to study more evidence of geothermal resources in Chunxiao Town for addressing sustainable urban energy needs in the future. To this end, in this study, an integrated study—with geochemical data, geophysical investigations, and drilling tests—was conducted to reveal the occurrence and feature of the geothermal resources in Chunxiao Town. We think that this systematic analysis of a low-to-medium temperature geothermal resource could be a nice example for other geothermal systems in coastal areas. Our objective was also to promote the research in low-to-medium temperature systems.
2. Materials and Methods
2.1. Geological Regional Settings of the Study Area
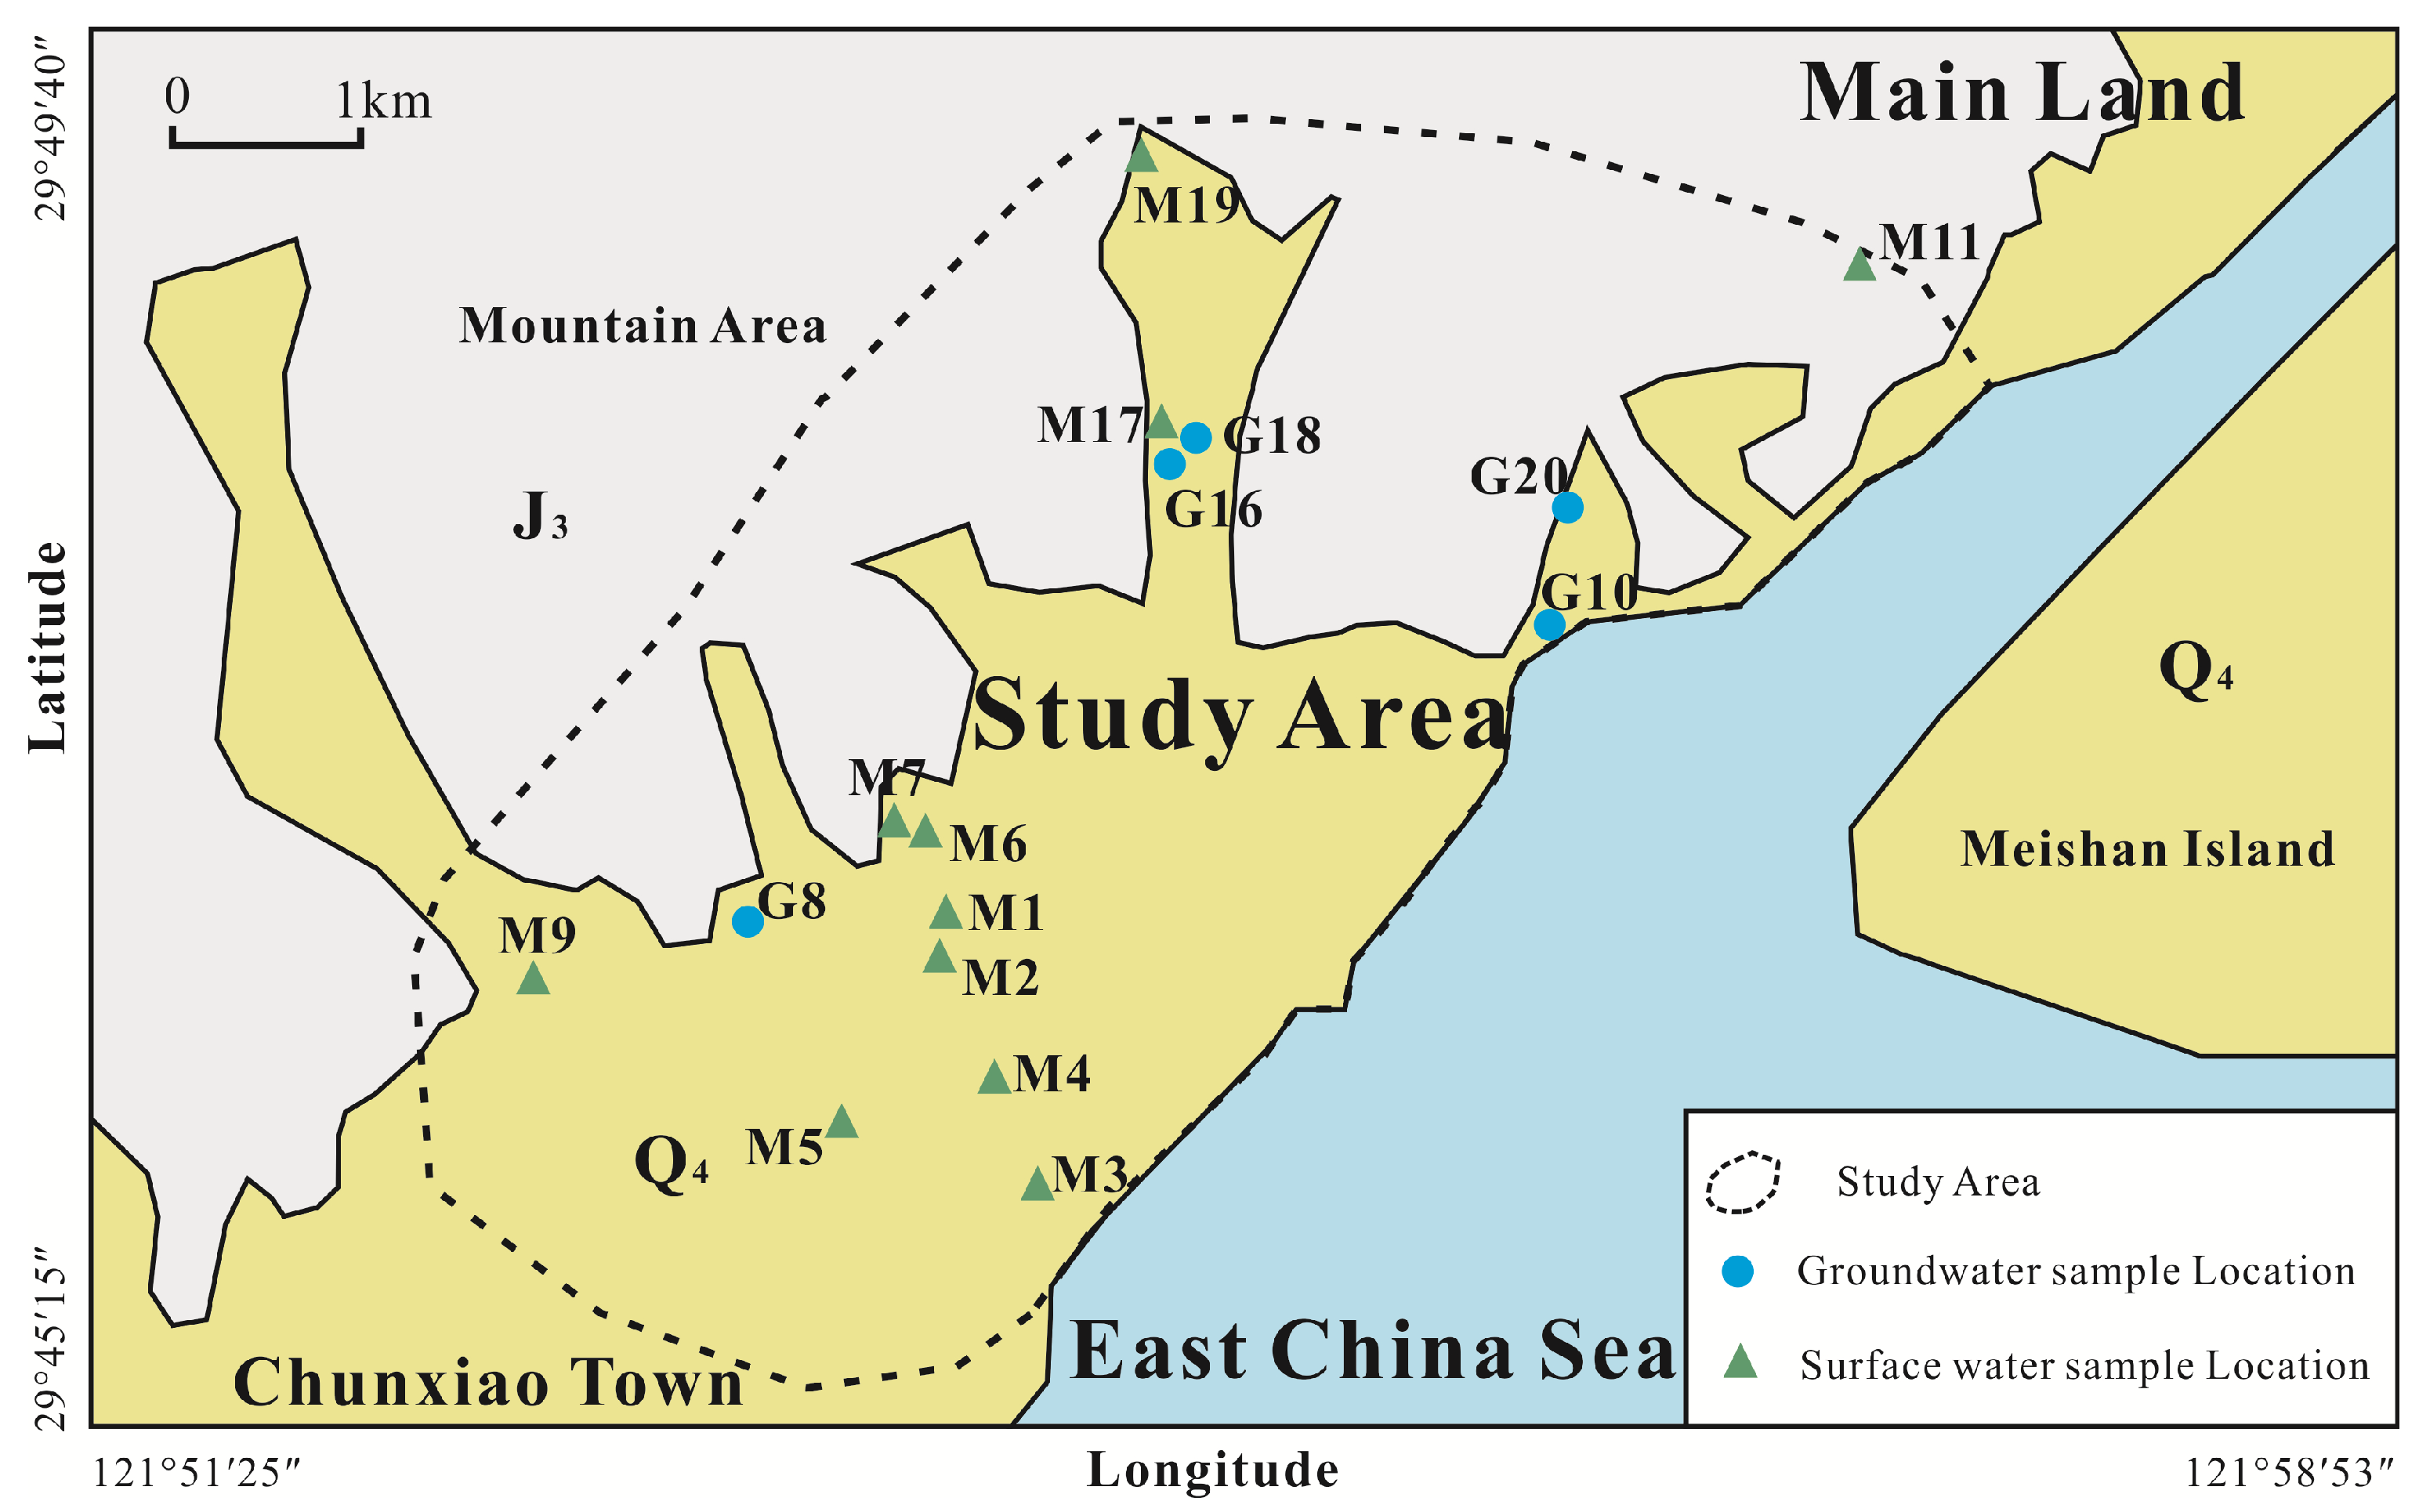
The basic strata in study area consists of upper Jurassic volcaniclastic rock with a thickness of 2000–3000 m, and thin Quaternary layer (<20 m) scattered along the coastline (Figure 1). Those geological strata constitute the aquifer system that includes unconfined pore water aquifer of the Quaternary sediment and fissure water aquifer of the Jurassic volcaniclastic rock. The pore water mainly occurs in the sand loam, with a shallow water table depth of 1–3 m. The yield of single well in pore water aquifer is about 16 m3/d [18]. The fissure water aquifer is mainly controlled by geological structures (such as fault and fracture), and the fissure water is generally discharged as spring. For example, in our study area, the sample M7 (Figure 2) is collected in a spring. According to the monitoring data, it is shown that the spring discharge rate is 0.16 L/s.
With the influence of multistage tectonic activities in history, the regional fault structures developed very well [19,20] (Figure 1). These regional faults were deeply cut and extended far, and different secondary fractures were also quite developed, which created the favorable conditions of water and heat conducting in deep strata [21].
The huge thick volcaniclastic rock strata have good thermal insulation properties, which could form the cap condition of geothermal reservoirs. As shown in Figure 1, the NNE compressive–torsional deep large fault, which connects the deep lithosphere, has better heat conduction characteristics and could make the groundwater obtain a relatively high temperature; and the NNW conjugated tensional–torsional faults are widely developed, which could constitute the ideal flowing channel and storage space of groundwater. These basic geological conditions laid the foundation for breeding and distribution of geothermal resources [22,23].
2.2. Methods
The methods used in this study include hydrogeochemical method and geophysical method. Hydrogeochemical method is one of the most direct and effective ways to understand the migration and evolution of hydrochemical components in a region [24]. In this study, Langelier–Ludwig graphic method and Piper three-line graphic method were used to analyze the hydrochemistry evolution characteristics of surface water and groundwater, and ratios of ion components were used to eliminate the interference from seawater to coastal water. With the hydrogeochemical analysis, the results of sign of geothermal water circulation and discharge in study area could be preliminarily obtained. Then, geothermometers and Na–K–Mg triangle diagram were used to assess the geothermal potential in this study area.
In addition, a geophysical method, controlled source audio magnetotelluric sounding (CSAMT), was used to obtain the location of geothermal reservoirs. In this geophysical investigation, two NE survey lines (Figure 6) were arranged in the study area to control NW tensional–torsional water conduction and water storage faults. By measuring the impedance resistivity ρs and impedance phase φ, the resistivity parameters could be jointly inverted, which was used for geological interpretation to determine the location of geothermal reservoirs.
Furthermore, radioactive radon and soil thermal-released mercury detection methods were used to assist in interpreting geophysical results. According to CSAMT survey results, those radioactive radon and soil thermal-released mercury detections (Figure 6) were arranged along the region where faults passed through. Combining the anomaly points of radioactive radon and soil thermal-released mercury detection on the surface with their migration characteristics along fault zones, the interpreted faults by geophysical methods could be further identified.
3. Results and Discussion
3.1. Chemical Characteristics of Water Samples
There is a significant chemical composition difference between geothermal water and shallow groundwater or surface water. These hydrochemical anomalies tend to transfer to groundwater or even surface water through water circulation [25]. By analyzing the hydrogeochemical characteristics of groundwater and surface water samples in the study area, it is possible to confirm whether there are signs of deep hot groundwater circulation. By using geochemistry indicators, the exploration potential of geothermal resources could be analyzed.
A total of 5 groundwater samples (G8, G10, G16, G18, and G20), 1 spring sample (M7), and 10 surface water samples were collected in the study area. The distribution of sample points covered from offshore to mountain foot (Figure 2). The 10 surface water samples include 7 river samples (M1, M2, M3, M4, M5, M9, and M17), 2 reservoir water samples (M11 and M19) and 1 pond water sample (M6). The 5 groundwater samples were pumped form wells which are generally bedrock wells. This means that the well water samples and spring sample can totally represent the fissure groundwater. Therefore, these 6 samples (5 groundwater samples and 1 spring sample) can be taken as representative of the water–rock interaction in our study area.
The hydrochemical types of surface water vary greatly. M3, M4, and M5 samples in offshore areas are Cl–Na type water, while the main anion and cation of other surface water samples are HCO3−, SO42−, Na+, and Ca2+. The hydrochemical types of groundwater are relatively similar, anions are dominated by HCO3−, SO42−, and Cl−, and cations are dominated by Ca2+, Na+, and Mg2+ (Table 1).
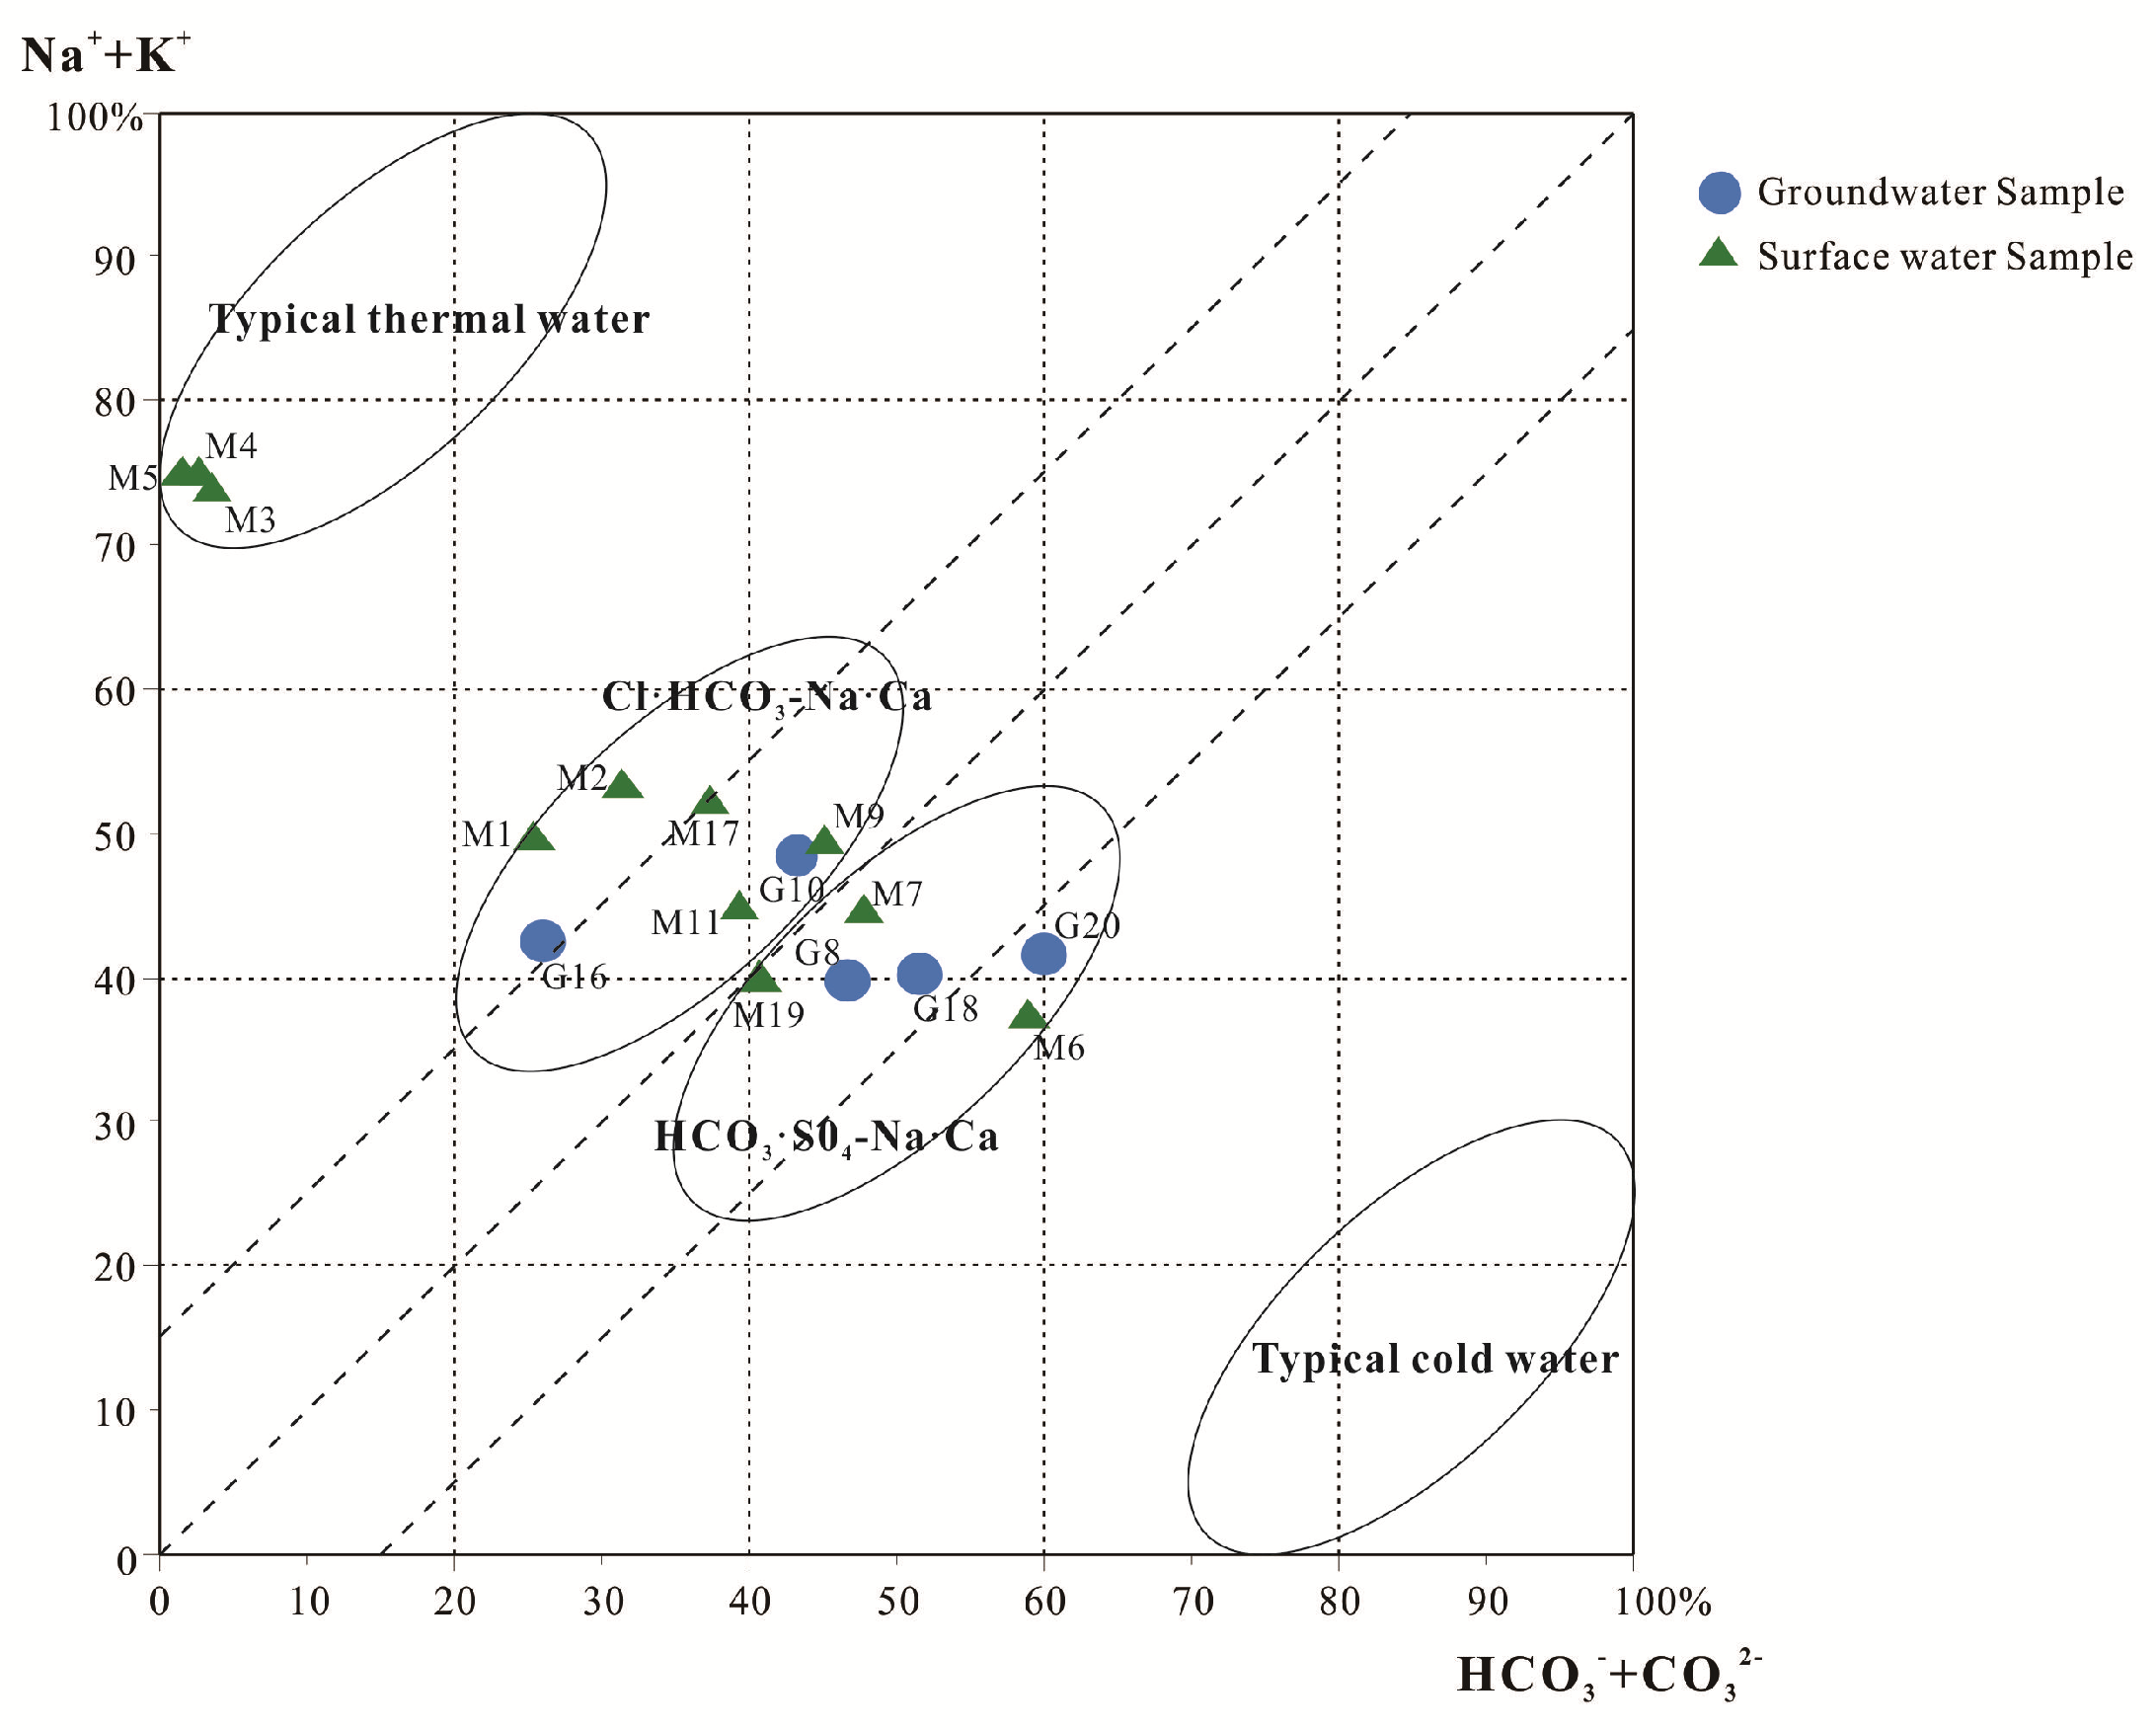
The hydrochemistry data was used to plot a Langelier–Ludwig diagram (Figure 3) to analyze the possibility of the geothermal water in this area. In the Langelier–Ludwig diagram (Figure 3), the region in upper left corner of the diagram presents typical geothermal water; the region in the bottom right corner of the diagram presents typical cold water; and the region in the center of the diagram belongs to the mixed type of cold and geothermal water with different proportions [25]. As shown in Figure 3, the M3, M4, and M5 samples are located in the geothermal anomaly region, which indicate the possibility of thermal groundwater.
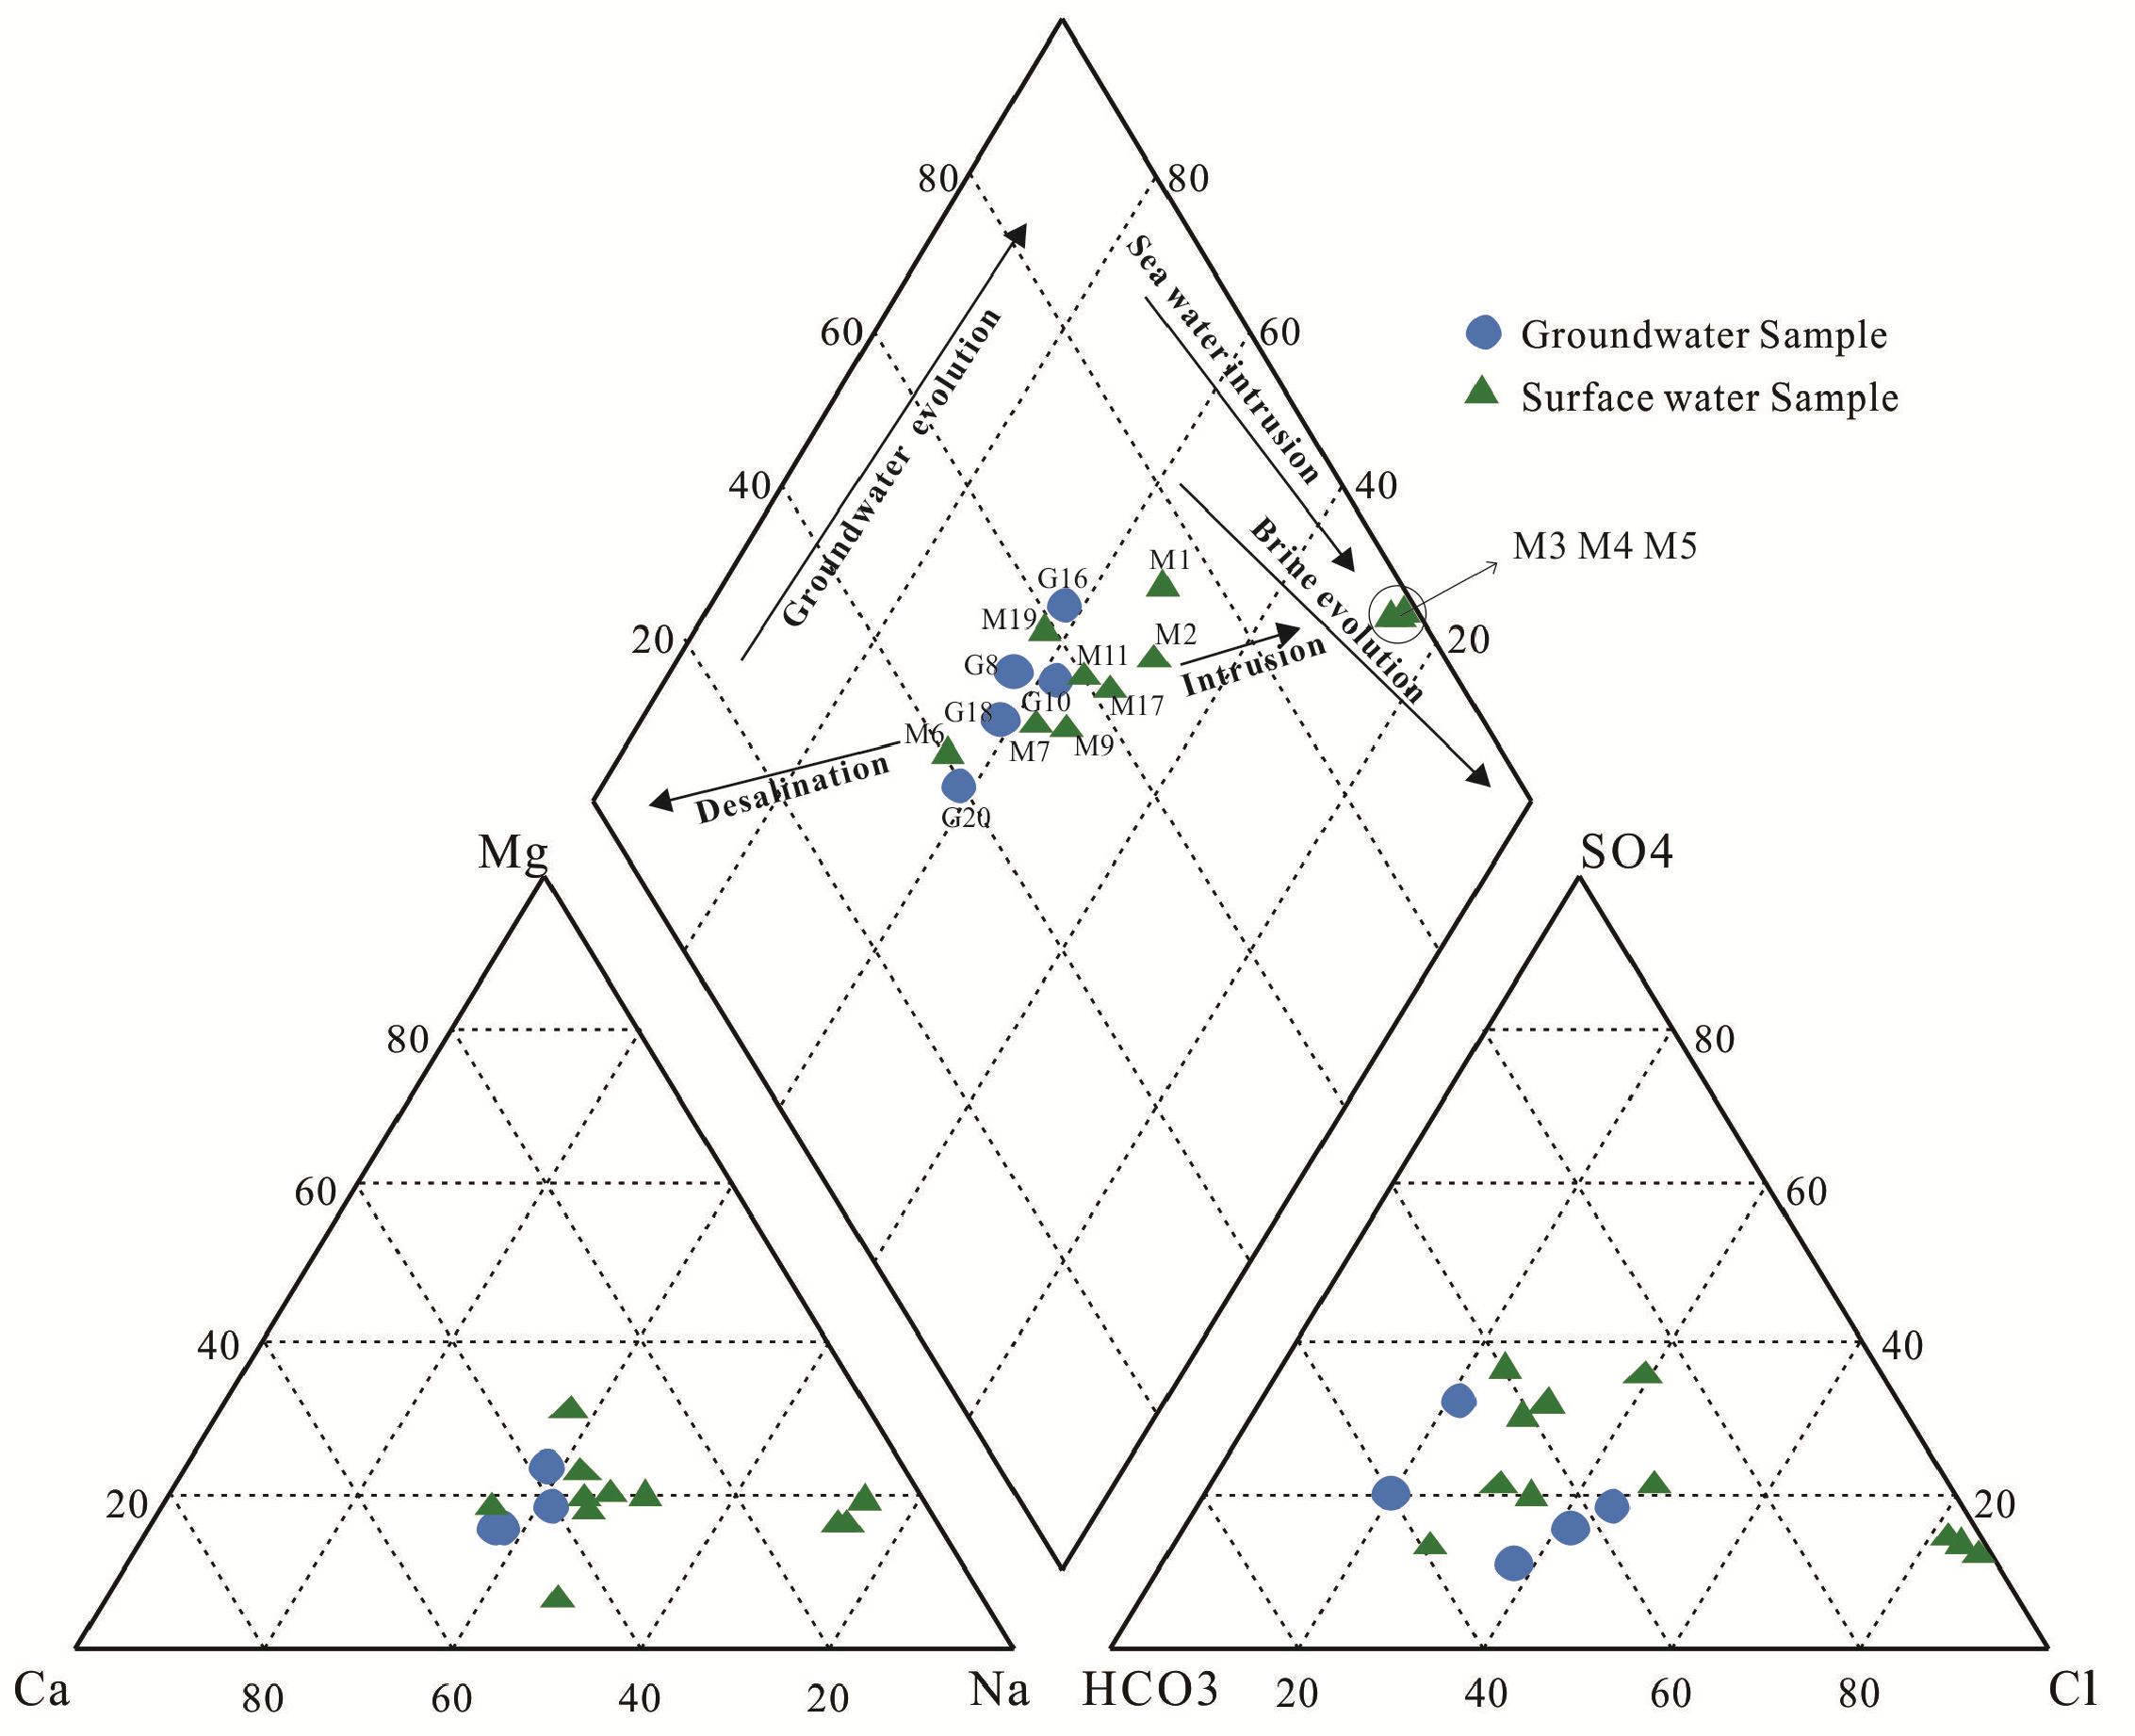
However, with the Piper plot (Figure 4), it was found that sample M3, M4, and M5 were located in the right boundary of the plot, indicating they were mixed with sea water. Meanwhile, the γNa/γCl ratio of M3, M4, and M5 is 0.856, 0.892, and 0.815, respectively, which are very close to standard seawater with γNa/γCl ratio of 0.85. Considering the spatial distribution of three samples, they are located less than 1 km from the coastline. It can be concluded that those three samples were influenced by seawater, and the above analysis also shows that the Langelier–Ludwig diagram has some limitations in determining the occurrence of geothermal water in coastal areas.
Although the three surface water samples, M3, M4, and M5, were influenced by the seawater, as shown in Figure 4 and Table 1, the other samples (including surface water and groundwater samples) have not shown a tendency to be influenced by seawater. Therefore, it can be concluded that the hydrochemical characteristics of other water samples in the study area are in a natural state without seawater influence, and those water samples (including surface water and groundwater samples) were located in the middle region of the Langelier–Ludwig diagram (Figure 3) and Piper plot (Figure 4). This result implies that water would be mixing from the geothermal water and cold water in the study area.
In addition, as shown in Table 1, the H2SiO3 content of water samples is generally more than 20 mg/L, which is significantly higher than the highest threshold of H2SiO3 content (0.65 mg/L) in natural cold groundwater. This implies the mixing process between the shallow water and deep geothermal water during the water circulation in this area.
3.2. Geochemistry Temperature Scale and Water–Rock Balance
Geothermometers could be used to estimate the water–rock equilibrium temperatures that have been reached by deep geothermal reservoirs. Classical geothermometers have their own application limitations, so using them indiscriminately to estimate reservoir temperatures might generate large deviations from the true values [26]. The study area belongs to low-medium temperature geothermal resources, and SiO2 geothermometer was chosen to estimate the equilibrium temperature of groundwater samples [27,28].
The no evaporation loss of SiO2 scale formula is
T—thermal reservoir temperature (°C), SiO2—content of SiO2 (mg/L).
According to the calculation results, it is preliminarily indicated that the reservoir temperature is around 40–60 °C (Table 2).
The SiO2 geothermometer generally re-equilibrates during fluid flow up to the surface. Moreover, the SiO2 geothermometer gives only the minimum temperature of the geothermal reservoir [29]. It should be noted that the SiO2 geothermometer depends on dilution and steam loss, while the equilibrium temperatures estimated by using other geothermometry techniques, based on the chemical equilibria in Na–K–Mg systems, are less influenced by dilution and steam loss [30].
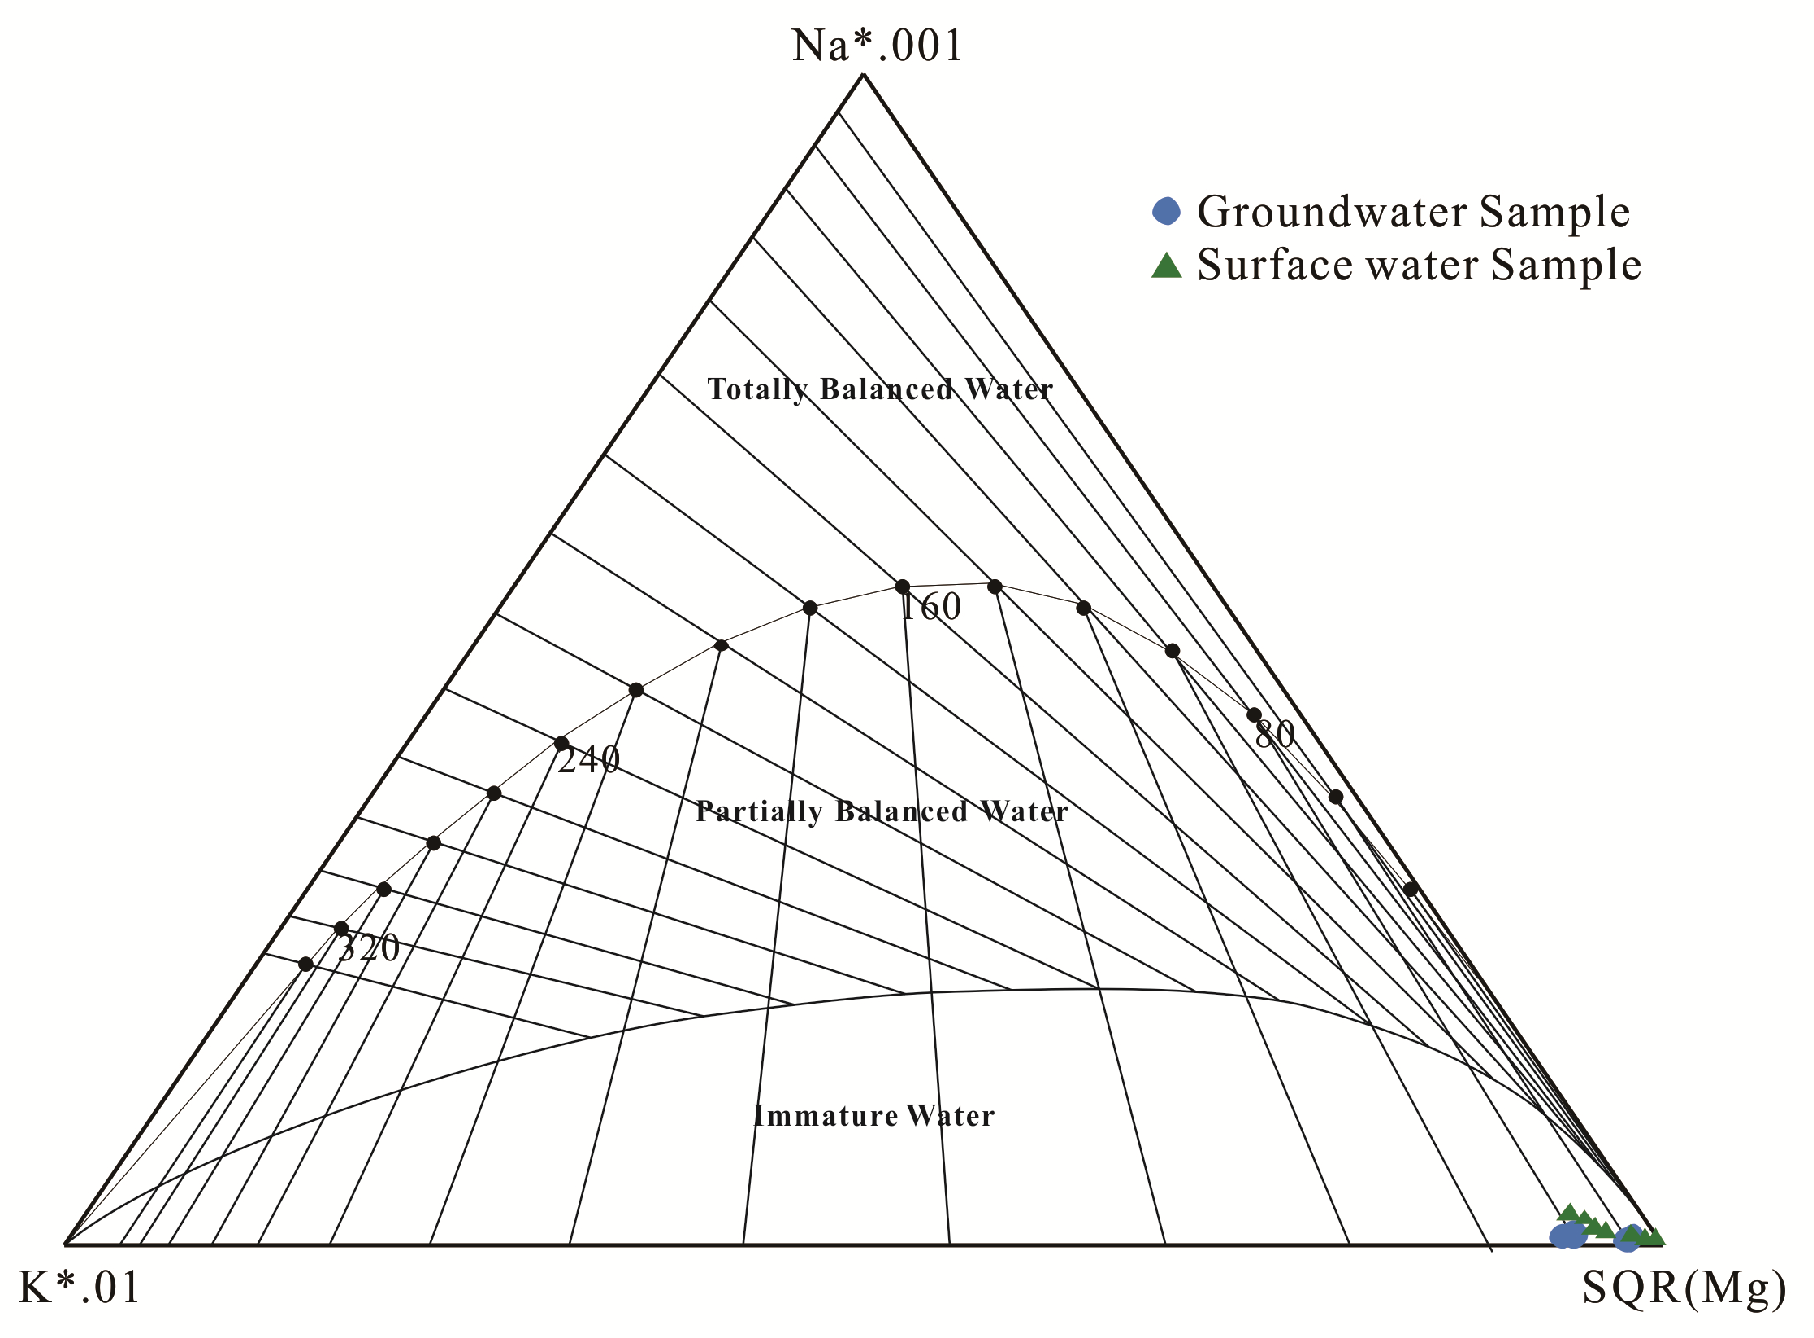
For the water samples without seawater influence, according to the Na–K and K–Mg geothermometers, the Na+/1000 − K+/10 − ternary diagram was made (Figure 5). This ternary diagram could be used to evaluate water–rock balance status, to discriminate hydrochemical types, and to estimate water–rock equilibrium temperature. As shown in Figure 5, the surface water and groundwater in the study area belong to immature water, and their water–rock balance had not yet been reached. The equilibrium temperature was estimated around 70 °C, which means there had been a mixture between geothermal water and cold water (Figure 5).
Based on those above liquid phase chemical geothermometers, we deduced the geothermal temperature to be about 42–70 °C, and sort of confirmed the existence potential of geothermal resources in this study area. It should be noted that although these geothermometers are popularly used in geothermal investigation, most of these liquid phase chemical geothermometers have limitations. This is because in the chemistry of deep thermal groundwater, re-equilibration and dilution occur during flow up to the surface. Thus, sometimes, the estimated geothermal temperatures by the liquid geothermometers should be verified with other methods.
Compared to liquid phase geothermometry, gas geothermometry (such as N2, CH4, 3He/4He, Ar) is generally more reliable because dilution is less dominant. Meanwhile, gas geothermometry can also be used to analyze more information on pressure and redox conditions in the thermal water source area. In the future investigations of geothermal resources in our study area, gas geothermometry will be conducted to diagnose the geothermal resources.
In addition, the isotope geothermometric technique (especially for gas phase isotope) could be the best way for investigating the geothermal temperature, because of the strong dependency relationship between isotope fractionation and the temperature. Thus, in our future study, the isotope geothermometry, for example, carbon isotope of the CO2–CH4 system [31,32], will be used to obtain more accurate geothermal temperature results.
After the geothermal temperature results have been deduced, it is more meaningful for geothermal resources development to investigate the geothermal reservoir distribution. To this end, in the next section, a type of geophysical method named CSMAT (controlled source audio magnetotelluric sounding), radioactive radon, and soil thermal-released mercury detection were used to investigate the location of the fault structure geothermal reservoir.
3.3. Analysis of Geothermal Reservoirs Distribution
After we obtained the information about the occurrence of geothermal resources, geophysical method was used to determine the location of the fault structure of the geothermal reservoir. According to the geological condition of this study area (Figure 1), we know that the NNW tensional faults could constitute the ideal flowing channel and storage space of thermal groundwater. Hence, geophysical survey lines were set up along the NE direction to make sure the faults could be surveyed. Meanwhile, to determine the exact location of the fault fracture, the combination methods of CSMAT, radioactive radon (Rn), and soil thermal-released mercury (Hg) detection [33] were conducted (Figure 6).
CSAMT method could effectively detect the resistivity change in bedrock at a depth less than 3000 m. Generally, a low resistivity anomaly zone can be formed along a tensional fault, because the tensional fault area is generally filled by water and clastic rock. Thus, we can interpret the location and the direction of the tensional fault according to the distribution of low resistivity anomaly zones. Furthermore, the radioactive radon and soil thermal-released mercury anomaly can provide verification information for the geophysical interpretation of the location of the fault.
The strata in the study area are relatively simple, with the average resistivity of overlying Quaternary sediments being generally less than 100 Ω·m, while the resistivity of the underlying Jurassic volcanic clastic rock has a larger resistivity, ranging from 200 Ω·m to 7000 Ω·m (Figure 7). The reasons for the wide variation range of resistivity of the volcanic clastic rock are as follows: Firstly, different weathering degrees of bedrock at different depths and locations can lead to the resistivity differences. Secondly, faults in the bedrock can also induce a wide range of resistivity. Therefore, the existence and distribution of faults could be interpreted by examining the features of variation in resistivity.
In the survey line L1 (Figure 7), there are two distinct vertical low resistivity anomaly zones A1, A2, A3, and A4, which indicate that the lithology of those four areas has changed significantly, or that there are faults passing through. However, the strata in the study area are relatively simple and nearly horizontal, so there should not be lateral lithology changes. Therefore, the low resistivity anomaly mainly indicates the occurrence of a fault. As shown in Figure 7, the low resistivity anomaly zones of A1 and A4 deeply extend along the vertical direction. Therefore, it could be deduced that there are two large faults passing through the survey section. It should be noted that the developmental conditions of faults are different along their depth. That is because that the regional tectonic stress can become large when the depth increases, which can limit the development of fault fractures.
In survey section L2 (Figure 7), there are five relatively low resistivity anomaly zones B1, B2, B3, B4, and B5. Comparing the survey sections of L2 and L1, the locations of the low resistivity anomaly zones A1 and A4, in section L1, correspond to the relatively low resistivity anomaly zones B2 and B5 in section L2. Furthermore, below depths of 1500–2000 m, distinct low resistivity anomaly areas have been detected in section L2. It can be deduced that there are several faults around the study area, and the F1 and F2 deduced by geophysical investigation are the prominent faults in our study area.
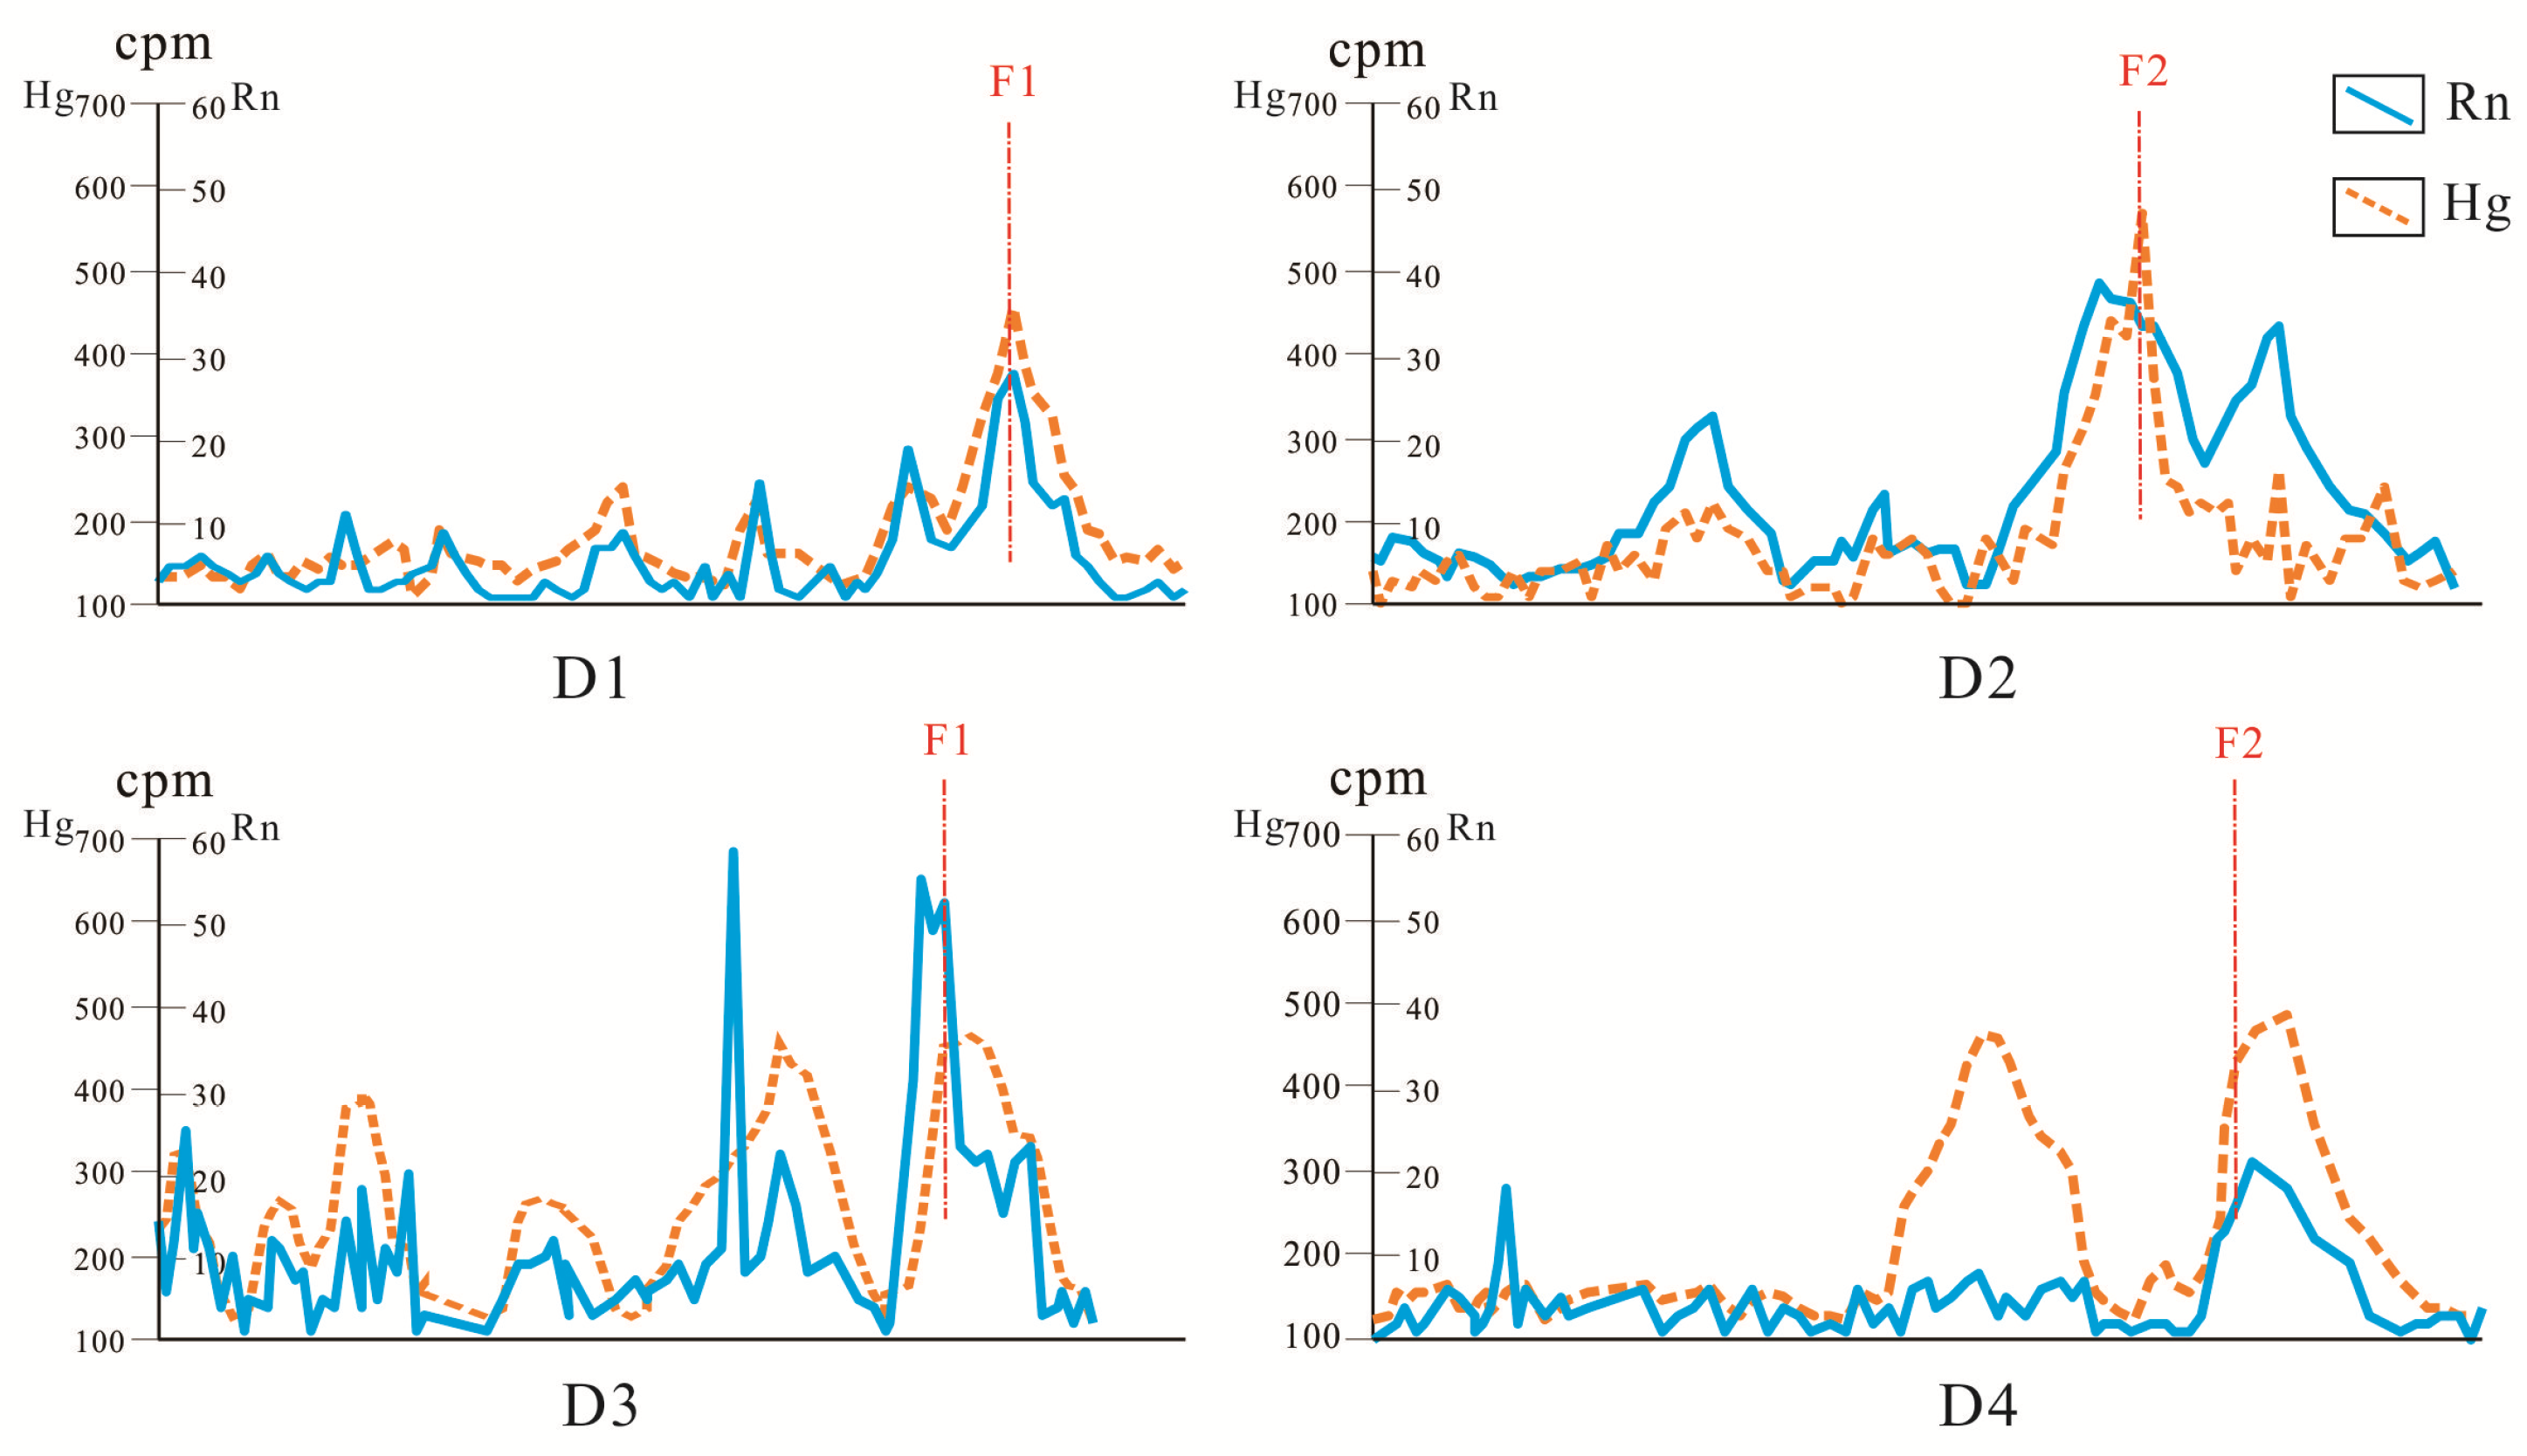
After interpreting the existence of faults using CSAMT method, radioactive radon and soil thermal-released mercury detection were used to verify the interpretation of results. As shown in Figure 8, the radioactive radon and thermal-released mercury anomalies along the fracture F1 are located in the same location of the faults. Thus, this confirms the existence of fracture F1. For the fracture F2, the interpretation result of CSAMT shows a deeply extended low resistivity anomaly zone A4 with a nearly vertical in section L1 and a nearly vertical low resistivity anomaly zone B5 in section L2.
In addition, it is noted that there is an obvious large-scale low resistivity anomaly area below a depth of 1700 m in section L2 (Figure 7), which could indicate large fault zones passing through under 1700 m. It can be guessed that there may be relatively large bedded thermal reservoirs under 1700 m. However, our guess should be verified by more drilling tests.
After confirming the existence of thermal resource and conduction fractures for thermal water circulation by hydrogeochemistry and geophysics methods, the drilling test can be conducted to verify the geothermal resources further.
3.4. Drilling Test Verification
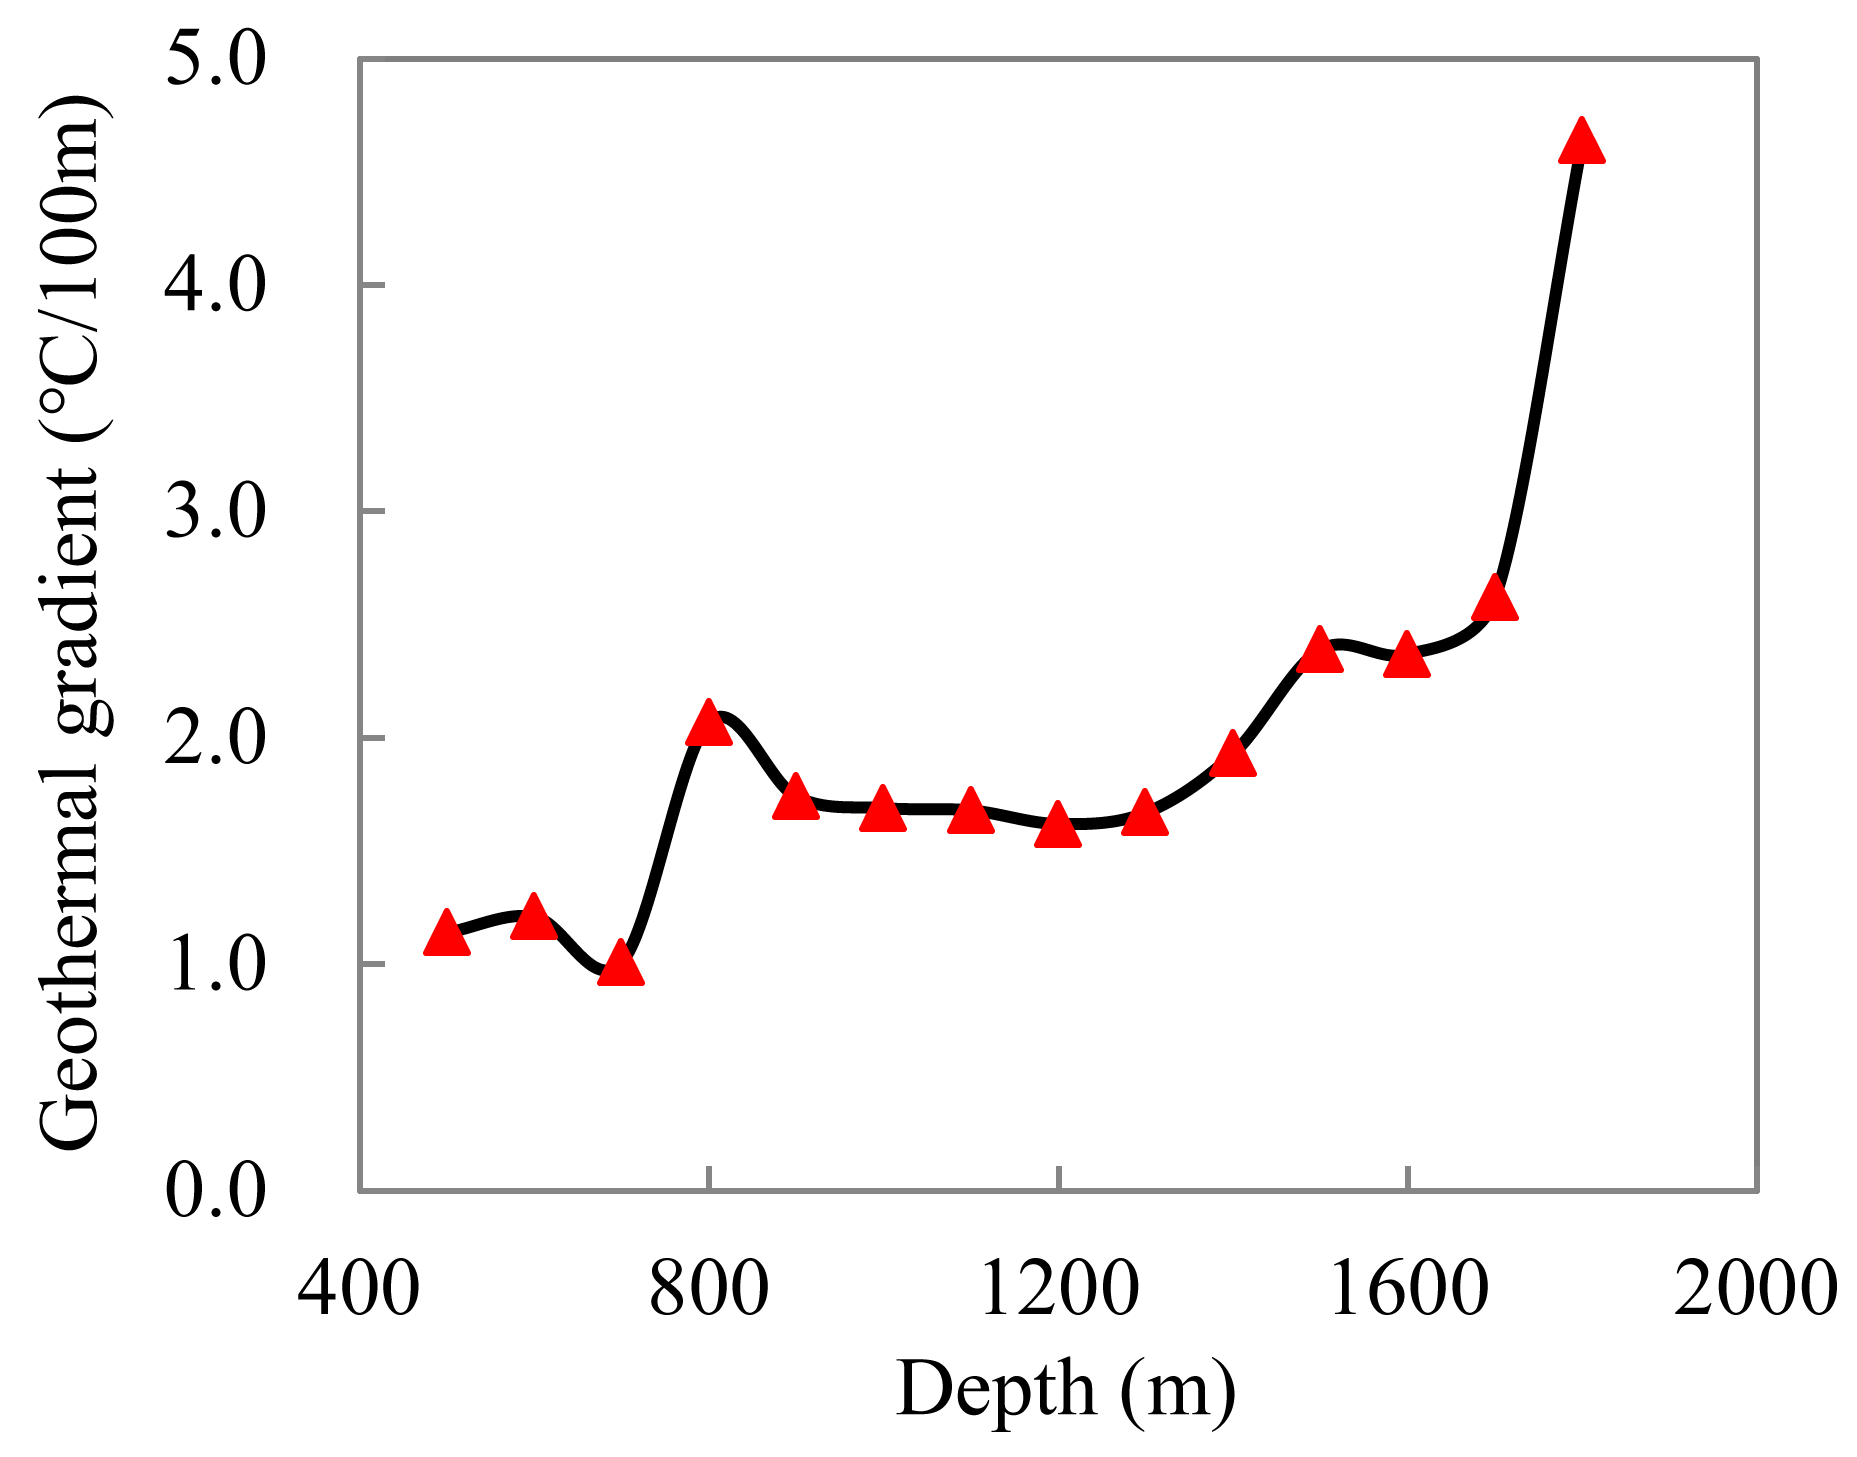
Based on the investigative results of CSAMT detection, a drilling test was conducted in the location of fracture F2, with a drilling depth of 1800 m (Figure 6). According to the well-logging results, well temperature gradient generally increases with depth (Table 3 and Figure 9). Meanwhile, as shown in Figure 9, an abrupt increase of well temperature gradient occurs at depths of 1700–1800 m, which indicates the occurrence of large thermal conductive fracture structures. In addition, from depth 1200 m to 1800 m, 3 major fractured aquifers were found: (1) from depth 1273–1279 m, max porosity is 30.80%, mean porosity is 25.60%, mean permeability k is 163.8 × 10⁻³ μm2; (2) from depth 1625–1640 m, max porosity is 34.16%, mean porosity is 31.60%, mean permeability k is 359.0 × 10⁻³ μm2; and (3) from depth 1651–1663 m, max porosity is 36.40%, mean porosity is 25.30%, mean permeability k is 226.0 × 10⁻³ μm2. Besides, several small-scale fractured aquifers were also found with mean porosity n > 25% and permeability k > 10−2 μm2 across the whole well length.
All of those conditions of relatively high temperature gradient (approximately 26–46 °C/km) and permeability indicated the occurrence of geothermal water resource in this area. This result is consistent with the hydrogeochemical analysis result (Table 2). At the same time, according to the hydraulic characteristics of this fissure water aquifer and condition of well formation, the water yield was estimated to be around 300m3/d after well completion.
Based on all the above geochemical, geophysical, and drilling methods, we successfully deciphered geothermal fluid occurrences in this study area. However, it should be noted that what we found is only an isolated geothermal system. It is more valuable to find a regional scale geothermal system for this area. Although it is not easy, in the future, we hope to conduct intensive hydrogeological and geochemical investigations and elaborate thermal modeling.
4. Conclusions
In order to study the geothermal resources in a coastal area of Chunxiao Town, China, we conducted synthetical investigation with hydrochemical, geophysical, and drilling methods, and we rationalized the occurrence of a valuable geothermal system in our study area. Our study could provide a great example for studying general features of low-to-medium geothermal resources in coastal areas.
In this study area, the volcaniclastic rock strata with huge thickness have good thermal insulation performance which constitute the cover conditions of the geothermal reservoir; moreover, the geological structure had created rich fractures that could constitute flowing channels and storage space for thermal water. All these geological features formed the basic condition for the existence of mid-low temperature fractured reservoirs in the study area.
By applying various hydrogeochemical methods, the possible existence of mixing processes between deep geothermal water and shallow groundwater was confirmed. According to SiO2 geothermometer, the geothermal reservoirs temperature was estimated at around 40–60 °C. Meanwhile, based on the geophysical methods of CSAMT, radioactive radon, and soil thermal-released mercury detection, two obvious NW faults (F1 and F2) were inferred to pass through the study area, which provided a theoretical basis for confirming the location of geothermal reservoirs. In addition, a drilling test with the depth of 1800 m was carried out at the fracture site, further inferring the existence of fault F2. According to the borehole data, it was found that several fractured aquifers were developed, with mean porosity n > 25% and permeability k > 10−2 μm2, and the bottom temperature was about 60 °C. All of these results could provide important guidance for the scientific exploration and effective utilization of geothermal resources in coastal bedrock areas.
Author Contributions
G.W. conceived the manuscript; Y.L. analyzed the chemistry data; W.Z. analyzed the geothermal reservoirs; W.Z. and P.Z. wrote the paper.
Funding
This research was funded by the National Natural Science Foundation of China (grant numbers: 41672243, 41502255, U1602233, 41602266, 41272269) and the China Geological Survey Program (grant numbers: 1212011121277, DD20189270).
Conflicts of Interest
The authors declare no conflict of interest.
References
- Lund, J.W.; Freeston, D.H.; Boyd, T.L. Direct application of geothermal energy: 2005 worldwide review. Geothermics 2005, 34, 691–727. [Google Scholar] [CrossRef]
- Goldscheider, N.; Mádl-Szónyi, J.; Eróss, A.; Schill, E. Review: Thermal water resources in carbonate rock aquifers. Hydrogeol. J. 2010, 18, 1303–1318. [Google Scholar] [CrossRef] [Green Version]
- Petrini, R.; Italiano, F.; Ponton, M.; Slejko, F.F.; Aviani, U.; Zini, L. Geochemistry and isotope geochemistry of the Monfalcone thermal waters (northern Italy): Inference on the deep geothermal reservoir. Hydrogeol. J. 2013, 21, 1275–1287. [Google Scholar] [CrossRef]
- Montanari, D.; Minissale, A.; Doveri, M.; Gola, G.; Trumpy, E.; Santilano, A.; Manzella, A. Geothermal resources within carbonate reservoirs in western Sicily (Italy): A review. Earth Sci. Rev. 2017, 169, 180–201. [Google Scholar] [CrossRef]
- Arnórsson, S.; Stefánsson, A.; Bjarnason, J. Fluid-fluid interaction in geothermal systems. Rev. Mineral. Geochem. 2007, 65, 259–312. [Google Scholar] [CrossRef]
- Battaglia, S. Variations in the chemical composition of illite from five geothermal fields: A possible geothermometer. Clay Miner. 2004, 39, 501–510. [Google Scholar] [CrossRef]
- Özen, T.; Bülbül, A.; Tarcan, G. Reservoir and hydrogeochemical characterizations of geothermal fields in Salihli, Turkey. J. Asian Earth Sci. 2012, 60, 1–17. [Google Scholar] [CrossRef]
- Sanjuan, B.; Millot, R.; Innocent, C.; Dezayes, C.; Scheiber, J.; Brachb, M. Major geochemical characteristics of geothermal brines from the Upper Rhine Graben granitic basement with constraints on temperature and circulation. Chem. Geol. 2016, 428, 27–47. [Google Scholar] [CrossRef]
- Shi, Z.; Liao, F.; Wang, G.; Xu, Q.; Mu, W.; Sun, X. Hydrogeochemical characteristics and evolution of hot springs in eastern Tibetan Plateau geothermal belt, western China: Insight from multivariate statistical analysis. Geofluids 2017, 2017, 6546014. [Google Scholar] [CrossRef]
- Barbieri, M.; Boschetti, T.; Petitta, M.; Tallini, M. Stable isotope (2H, 18O and 87Sr/86Sr) and hydrochemistry monitoring for groundwater hydrodynamics analysis in karst aquifer (Gran Sasso, central Italy). Appl. Geochem. 2005, 20, 2063–2081. [Google Scholar] [CrossRef]
- Kazakis, N.; Vargemezis, G.; Voudouris, K.S. Estimation of hydraulic parameters in a complex porous aquifer system using geoelectrical methods. Sci. Total Environ. 2016, 550, 742–750. [Google Scholar] [CrossRef] [PubMed]
- Tizro, T.A.; Voudouris, K.; Basam, Y. Estimation of porosity and specific yield by application of geoelectrical method—A case study in western Iran. J. Hydrol. 2012, 454–455, 160–172. [Google Scholar] [CrossRef]
- Tizro, T.A. Site selection for artificial recharging of groundwater by application of geoelectrical method—A case study. Bull. Geol. Soc. Malays. 2008, 54, 63–69. [Google Scholar]
- Kana, J.D.; Djongyang, N.; Raïdandi, D.; Nouck, P.N.; Dadjé, A. A review of geophysical methods for geothermal exploration. Renew. Sustain. Energy Rev. 2015, 44, 87–95. [Google Scholar] [CrossRef]
- Pellerin, L.; Johnsto, J.M.; Hohmann, G.W. A numerical evaluation of electromagnetic methods in geothermal exploration. Geophysics 1996, 61, 121–130. [Google Scholar] [CrossRef]
- Sun, S.H.; Xu, Y.; Zhao, W.T. Application of electromagnetic method in geothermal investigation in the Inner Mongolia. Adv. Mater. Res. 2014, 962–965, 251–254. [Google Scholar] [CrossRef]
- Düzen, H.; Özler, H.M. Investigation of hydrogeological and hydrogeochemical properties of Muradiye-Çaldıran (Van) geothermal field, eastern Turkey. Procedia Earth Planet. Sci. 2015, 15, 627–634. [Google Scholar] [CrossRef]
- Huang, W.Q.; Dong, Y.; Tian, T.S.; Hou, C.W.; Huang, J.P. Geothermal exploration in Dongqianhu area, Ningbo city. In Proceedings of the National Symposium on Exploitation and Protection of Geothermal Resources, Beijing, China, 1 October 2007; Volume 314, pp. 96–99. (In Chinese). [Google Scholar]
- Xu, B.T.; Zhou, S.G.; Zhang, Q.F. The geochemical system of Zhejiang geothermal fields and their heat energy potential. Geochimica 1999, 28, 163–170. (In Chinese) [Google Scholar]
- Meng, Z.; Hao, Y. Regional geological background and occurrence characteristics of geothermal resources in Zhejiang Province. Sci. Technol. Eng. 2016, 19, 30–36. (In Chinese) [Google Scholar]
- Wan, T. The new Asia tectonic map. Geol. China 2013, 5, 1351–1365. (In Chinese) [Google Scholar]
- He, L.J.; Hu, S.B.; Wang, J.Y. Thermal textures characteristics of the lithosphere in eastern China continent. Prog. Nat. Sci. 2001, 11, 966–969. (In Chinese) [Google Scholar]
- Huang, Z.; Wei, C.; Li, C. Application of integrated geophysical methods in geothermal resources exploration. J. Chongqing Univ. Sci. Technol. 2010, 1, 53–65. (In Chinese) [Google Scholar]
- Zhou, P.; Li, M.; Lu, Y. Hydrochemistry and isotope hydrology for groundwater sustainability of the coastal multilayered aquifer system (Zhanjiang, China). Geofluids 2017, 2017, 7080346. [Google Scholar] [CrossRef]
- Haizlip, J.R. Application of geochemistry to resource assessment and geothermal development projects. In Geothermal Power Generation; Woodhead Publishing: Cambridge, UK, 2016; pp. 77–106. [Google Scholar]
- Fournier, R.O.; Truesdell, A.H. An empirical Na-K-Ca geothermometer for natural waters. Geochim. Cosmochim. 1973, 37, 1255–1275. [Google Scholar] [CrossRef]
- Arnórsson, S. Application of the silica geothermometer in low temperature hydrothermal areas in Iceland. Am. J. Sci. 1975, 275, 763–784. [Google Scholar] [CrossRef]
- Ba, J.J.; Xu, S.G.; Li, C.C. Analysis and research of hydrogeochemical characteristics about Yiliang Geothermal Field. Appl. Mech. Mater. 2014, 707, 294–298. [Google Scholar] [CrossRef]
- Minissale, A.A. A simple geochemical prospecting method for geothermal resources in flat areas. Geothermics 2018, 72, 258–267. [Google Scholar] [CrossRef]
- Peralta Arnold, Y.; Cabassi, J.; Tassi, F.; Caffe, P.J.; Vaselli, O. Fluid geochemistry of a deep-seated geothermal resource in the Puna plateau (Jujuy Province, Argentina). J. Volcanol. Geotherm. Res. 2017, 338, 121–134. [Google Scholar] [CrossRef]
- Giggenbach, W.F. Redox processes governing the chemistry of fumarolic gas discharges from White Island, New Zealand. Appl. Geochem. 1987, 2, 143–161. [Google Scholar] [CrossRef]
- Horita, J. Carbon isotope exchange in the system CO2-CH4 at elevated temperatures. Geochim. Cosmochim. Acta 2001, 65, 1907–1919. [Google Scholar] [CrossRef]
- Robaa, C.A.; Cosma, C.; Codrea, V.; Codrea, V.; Olah, Ş. Correlations between radium and radon occurrence and hydrogeochemical features for various geothermal aquifers in Northwestern Romania. Geothermics 2012, 42, 32–46. [Google Scholar] [CrossRef]
Figure 1.
Regional geological structure map.

Figure 2.
Water sample location.

Figure 3.
Langelier–Ludwig diagram of water samples.

Figure 4.
Piper plot of water samples.

Figure 5.
Na–K–Mg triangular diagram of water sample.

Figure 6.
Interpretation of fault location by geophysical methods.

Figure 7.
Controlled source audio magnetotelluric sounding (CSAMT) detection results.

Figure 8.
Rn and Hg detection results.

Figure 9.
Temperature gradient vs. depth.


Table 1.
Hydrochemical characteristics of water samples.
| ID | Ion Content (mg/L) | Hydrochemical Type | ||||||||
|---|---|---|---|---|---|---|---|---|---|---|
| Na+ | K+ | Mg2+ | Ca2+ | F | Cl− | SO42− | HCO3− | H2SiO3 | ||
| M3 | 1265 | 70 | 144 | 146 | 1.1 | 2278 | 499 | 122 | 19.6 | Cl–Na |
| M4 | 850 | 46 | 98.7 | 110 | 0.97 | 1470 | 350 | 107 | 19.5 | Cl–Na |
| M5 | 2243 | 118 | 304 | 174 | 1.36 | 4244 | 796 | 120 | 18.2 | Cl–Na |
| M1 | 177 | 31.4 | 40.1 | 108 | 0.51 | 231 | 284 | 259 | 18.8 | Cl·SO4·HCO3–Na·Ca |
| M2 | 111 | 19.7 | 23.1 | 56.5 | 0.05 | 161 | 98 | 184 | 22.1 | Cl·HCO3·SO4–Na·Ca |
| M6 | 20.4 | 3.68 | 5.7 | 23.8 | 0.13 | 23.9 | 15.5 | 87.9 | 26.3 | HCO3·Cl–Ca·Na |
| M9 | 46.4 | 11.8 | 9.5 | 32.3 | 0.07 | 56.1 | 42.5 | 124 | 26.5 | HCO3·Cl–Na·Ca |
| M11 | 8.2 | 0.18 | 1.9 | 5.8 | 0.13 | 5.1 | 10.5 | 14.6 | 21.4 | HCO3·SO4–Na·Ca·Mg |
| M17 | 8.5 | 2.39 | 0.6 | 7 | 0.13 | 8.7 | 12.1 | 18.3 | 13.9 | HCO3·SO4·Cl–Na·Ca |
| M19 | 8.2 | 1.71 | 3.6 | 6.2 | 0.16 | 9 | 12.6 | 22 | 15.1 | HCO3·SO4–Na·Ca·Mg |
| G8 | 12.8 | 3.74 | 3 | 14.8 | 0.14 | 8.1 | 17.3 | 31.7 | 28.2 | HCO3·SO4–Ca·Na |
| G10 | 28.5 | 16.8 | 6.8 | 24.2 | 0.12 | 39.6 | 20.7 | 72 | 27.7 | HCO3·Cl–Na·Ca |
| G16 | 27.5 | 13.6 | 6.1 | 30.1 | 0.07 | 37.5 | 22 | 54.9 | 14.2 | Cl·HCO3–Ca·Na |
| G18 | 27.2 | 5.1 | 9.1 | 23.8 | 0.16 | 40.8 | 16.8 | 97.6 | 17 | HCO3·Cl–Ca·Na·Mg |
| G20 | 14.7 | 4.44 | 4.9 | 13 | 0.14 | 12 | 16.9 | 63.5 | 30.7 | HCO3–Ca·Na·Mg |
| M7 (spring) | 9.8 | 1.47 | 2.8 | 7 | 0.08 | 9.1 | 8.5 | 24.4 | 27.7 | HCO3·Cl–Na·Ca·Mg |
Table 2.
SiO2 geochemistry temperature scale calculation of groundwater samples.
| Sample | Temperature (°C) |
|---|---|
| G8 | 66.52 |
| G10 | 65.84 |
| G16 | 42.15 |
| G18 | 48.20 |
| G20 | 69.80 |
| M7 (spring) | 65.97 |
Table 3.
Data of well temperature.
| Depth (m) | Temperature (°C) | Temperature Gradient (°C/100 m) |
|---|---|---|
| 400 | 32.23 | - |
| 500 | 33.37 | 1.14 |
| 600 | 34.58 | 1.21 |
| 700 | 35.59 | 1.01 |
| 800 | 37.66 | 2.07 |
| 900 | 39.40 | 1.74 |
| 1000 | 41.09 | 1.69 |
| 1100 | 42.77 | 1.68 |
| 1200 | 44.39 | 1.62 |
| 1300 | 46.06 | 1.67 |
| 1400 | 47.99 | 1.93 |
| 1500 | 50.38 | 2.39 |
| 1600 | 52.75 | 2.37 |
| 1700 | 55.37 | 2.62 |
| 1800 | 60.01 | 4.64 |
© 2019 by the authors. Licensee MDPI, Basel, Switzerland. This article is an open access article distributed under the terms and conditions of the Creative Commons Attribution (CC BY) license (http://creativecommons.org/licenses/by/4.0/).
Share and Cite
MDPI and ACS Style
Zhao, W.; Lin, Y.; Zhou, P.; Wang, G. Systematic Analysis of Geothermal Resources in the Coastal Bedrock Area of Chunxiao Town (China) by Using Geochemistry and Geophysics Methods. Water 2019, 11, 214. https://doi.org/10.3390/w11020214
AMA Style
Zhao W, Lin Y, Zhou P, Wang G. Systematic Analysis of Geothermal Resources in the Coastal Bedrock Area of Chunxiao Town (China) by Using Geochemistry and Geophysics Methods. Water. 2019; 11(2):214. https://doi.org/10.3390/w11020214
Chicago/Turabian StyleZhao, Wei, Yanzhu Lin, Pengpeng Zhou, and Guangcai Wang. 2019. "Systematic Analysis of Geothermal Resources in the Coastal Bedrock Area of Chunxiao Town (China) by Using Geochemistry and Geophysics Methods" Water 11, no. 2: 214. https://doi.org/10.3390/w11020214
Note that from the first issue of 2016, this journal uses article numbers instead of page numbers. See further details here.