Evaluation of Gridded Precipitation Datasets over Arid Regions of Pakistan


1
School of Civil Engineering, Faculty of Engineering, Universiti Teknologi Malaysia (UTM), Johor Bahru 81310, Malaysia
2
Faculty of Water Resource Management, Lasbela University of Agriculture, Water and Marine Sciences, Balochistan 90150, Pakistan
3
State Key Laboratory of Hydrology-Water Resources and Hydraulic Engineering, Nanjing Hydraulic Research Institute, Nanjing 2100292, China
4
Research Center for Climate Change, Ministry of Water Resources, Nanjing 210029, China
*
Author to whom correspondence should be addressed.
Water 2019, 11(2), 210; https://doi.org/10.3390/w11020210
Submission received: 17 December 2018
/
Revised: 13 January 2019
/
Accepted: 17 January 2019
/
Published: 26 January 2019
(This article belongs to the Special Issue Hydroclimatic Variability at Local, Regional, and Global Scales)
Abstract
:The rough topography, harsh climate, and sparse monitoring stations have limited hydro-climatological studies in arid regions of Pakistan. Gauge-based gridded precipitation datasets provide an opportunity to assess the climate where stations are sparsely located. Though, the reliability of these datasets heavily depends on their ability to replicate the observed temporal variability and distribution patterns. Conventional correlation or error analyses are often not enough to justify the variability and distribution of precipitation. In the present study, mean bias error, mean absolute error, modified index of agreement, and Anderson–Darling test have been used to evaluate the performance of four widely used gauge-based gridded precipitation data products, namely, Global Precipitation Climatology Centre (GPCC), Climatic Research Unit (CRU); Asian Precipitation Highly Resolved Observational Data Integration towards Evaluation (APHRODITE), Center for Climatic Research—University of Delaware (UDel) at stations located in semi-arid, arid, and hyper-arid regions in the Balochistan province of Pakistan. The result revealed that the performance of different products varies with climate. However, GPCC precipitation data was found to perform much better in all climatic regions in terms of most of the statistical assessments conducted. As the temporal variability and distribution of precipitation are very important in many hydrological and climatic applications, it can be expected that the methods used in this study can be useful for the better assessment of gauge-based data for various applications.
1. Introduction
Precipitation is the key element of the global water cycle and influences the socio-economic development of any region [1,2]. In recent decades, variations and changes in climate have drawn the attention of scientific society [3,4]. Precipitation data are important for studying the changes in the regional and global climate [5,6]. The major problem often encountered in conducting such studies is the unavailability of climatic data over a longer period. Notwithstanding available data, irregular distribution and scarceness of stations, mainly over the uninhabited regions, makes the data unsuitable for the hydrological applications [7]. Furthermore, it is observed that available data quality is mostly not suitable for hydro-climatological assessments.
The development of sophisticated equipment and state-of-the-art computing technologies has provided an opportunity for the hydro-climate scientists to estimate climate variables and develop reliable data over a longer period, mainly for the areas where data is mostly unavailable [8,9]. These datasets are generally categorized into reanalysis, satellite products, gauge-based observations, and combinations of various datasets. Gauge-based gridded precipitation datasets are regularly utilized by the climate scientists due to their availability over longer spatial and temporal scale. Several gauge-based gridded precipitation datasets are developed in the previous decade to improve hydrological studies [10,11]. These products are categorized into regional and global datasets. The regional products were developed for specific regions or countries, for example, climate dataset was developed by Haylock, et al. [12] for Europe, Yatagai, et al. [13] for Asia, Maurer, et al. [14] and Liebmann and Allured [15] for the north and the South America, Herrera, et al. [16] for Spain, Belo-Pereira, et al. [17] for Portugal and, Schiemann, et al. [18] for Switzerland. At the same time, different global precipitation datasets are also available from different organizations, such as, the Global Historical Climatology Network (GHCN) [19], National Oceanic and Atmospheric Administration (NOAA) [20], Climatic Research Unit (CRU) [21], the WorldClim dataset [22], the University of Delaware research Center (UDel) [23], and Global Precipitation Climatology Center (GPCC) [24].
The global precipitation datasets have different spatio-temporal resolutions and durations. The quality of gridded precipitation datasets is governed by the data assimilation system, its optimization and the quality of observation data used [2,25]. The differences/biases in stations can introduce specious variability and trends into gauge-based gridded precipitation datasets [26]. Furthermore, there are uncertainties associated with gridded datasets, because of large natural, spatial and temporal variability, lack of observation data over large areas, changes in station networks, rain gauge types, and observational practices [27,28]. Therefore, the reliability of gauge-based gridded precipitation data varies with time and regional climate [10,29]. Thus, it is necessary to evaluate the capability of gridded data before its application over certain locations.
The assessment of gauge-based gridded precipitation data is usually done by comparing with reliable observed data. Several studies are conducted to evaluate the reliability of various global gauge-based gridded precipitation datasets in many regions of the globe [30,31]. In most cases, correlation coefficient, mean bias error (MBE), and root mean square error (RMSE) were used to evaluate the capability of gridded precipitation data products. However, the assessment of performance based on RMSE and correlations is often misleading. RMSE varies with variability in the squared errors, and therefore, it is not possible to determine the degree to which the RMSE reflects average errors and to what extent it reflects variability in the distribution of squared errors [32,33] On the other hand, the correlation coefficient is highly sensitive to outliers, and may not explain the model capabilities fully [34,35]. The drawbacks of conventional performance assessment methods can be overcome by using the indices like mean absolute error (MAE), mean bias error (MBE), and modified index of agreement (md). MAE is used to detect average errors and noted to be less sensitive compared with RMSE in terms of large modelling errors [36]. MBE is used to assess the mean in over and underestimations of models, and therefore can have negative values. The major advantage of md is, it weights the errors and differences which is not inflated by squared values and therefore, its sensitivity is low to outliers [37,38].
Besides mean, it is also vigorous to justify the variability and distribution of gauge-based gridded precipitation. Temporal variability of precipitation is an imperative parameter in the hydrological application [39]. Hydrological measurements based on the investigation of precipitation highly depend on the data distribution pattern [40]. Hydro-meteorological disasters or extreme weather-related studies heavily depend on properties of extreme precipitation events [41,42]. Therefore, it is very important to evaluate the capability of precipitation datasets to mimic the temporal variability and distribution adequately. This emphasises to evaluate the distribution of gauge-based gridded precipitation data. Therefore, along with MAE, MBE, and md, Anderson–Darling test was applied to evaluate the distribution of precipitation datasets.
In the present study, precipitation datasets of (1) Global Precipitation Climatology Center, version V.7 (GPCC) [43]; (2) Climatic Research Unit, University of East Angelia, version CRU TS Version 3.21 (CRU) [21]; (3) Asian Precipitation—Highly-Resolved Observational Data Integration Towards Evaluation (APHRODITE) project version (V1101R2/APHRO_MA/050deg) [13]; and (4) the Center for Climatic Research, University of Delaware V 3.02 (UDel) [23] were selected to assess their performance in Balochistan province of Pakistan. The capability of precipitation datasets products was found to vary with geographic and climatic regions [44,45,46,47]. Therefore, the performance of those products was assessed in different climatic zones of Balochistan province of Pakistan namely, semi-arid, arid, and hyper-arid.
2. Study Area and Datasets
Balochistan province of Pakistan (Figure 1) is regarded as one of the most vulnerable regions to climate change [48,49]. The province often experiences droughts and water stress conditions due to its arid climate and limited water resources [50]. It is expected that increase in temperature due to global warming will derive more droughts and water stress conditions which will affect the agro-economy of the province [51]. This emphasizes the need for hydro-climatological studies in the region in order to avoid any major crises in water and food scarcity. Hydro-climatological studies often required long-term data, i.e., 30 to 50 years [52]. One of the major problems in working with Balochistan climatic data is its missing values, inhomogeneity, fewer number of stations, and data lengths [53].
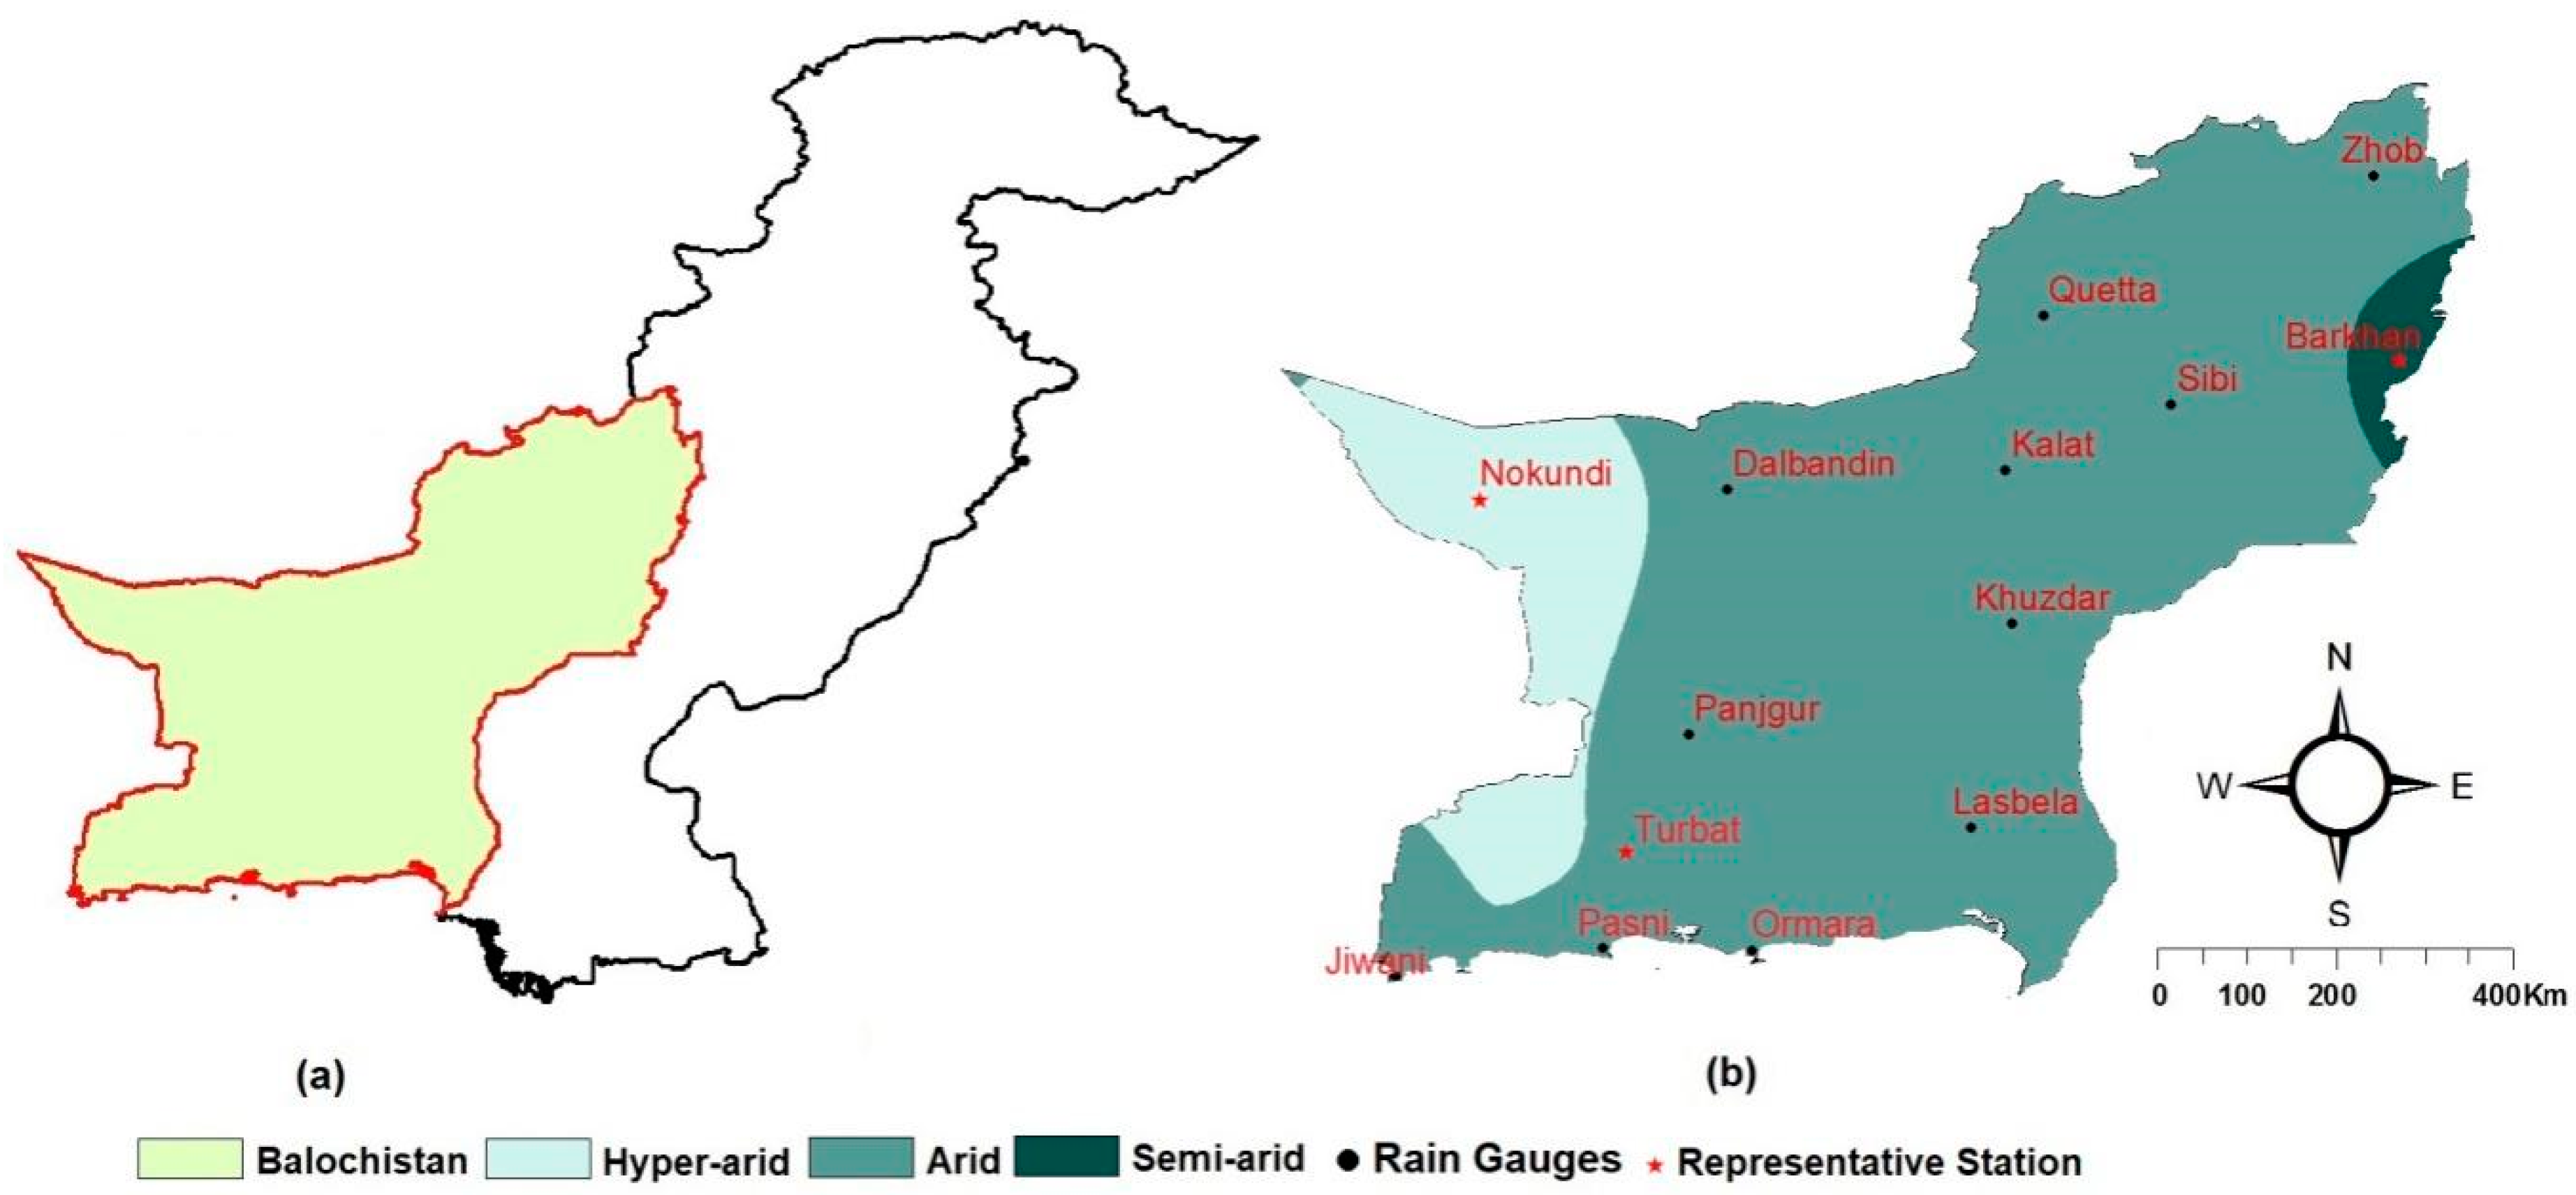
The observed precipitation data recorded at fourteen stations located at semi-arid, arid, and hyper-arid climatic zones of Balochistan were collected from the Pakistan Meteorological Department. The locations of rain gauges in the map of Pakistan are shown in Figure 1. The Figure showed that most of the stations are located in arid region, which covers a large area of the province. The mean and the standard deviation of annual precipitation at different stations are presented in Table 1. The table shows that Barkhan station (located in the northeast of the province) receives the highest precipitation of 389.32 mm and Nokkundi station (located in the southeast) receives the lowest precipitation. The highest and the lowest standard deviation in annual precipitation are also recorded at Barkhan and Nokkundi station, respectively. The percentage of missing data at different stations for the period 1961–2007 is also shown in Table 1. Complete set of precipitation data was found at Dalbandin, Khuzdar, Lasbela, Panjgur, Quetta, and Zhob. The highest amount of missing data (8.74%) is observed at Kalat followed by Pasni (7.73%). The performance of gridded data at each station was assessed using available data at the station.
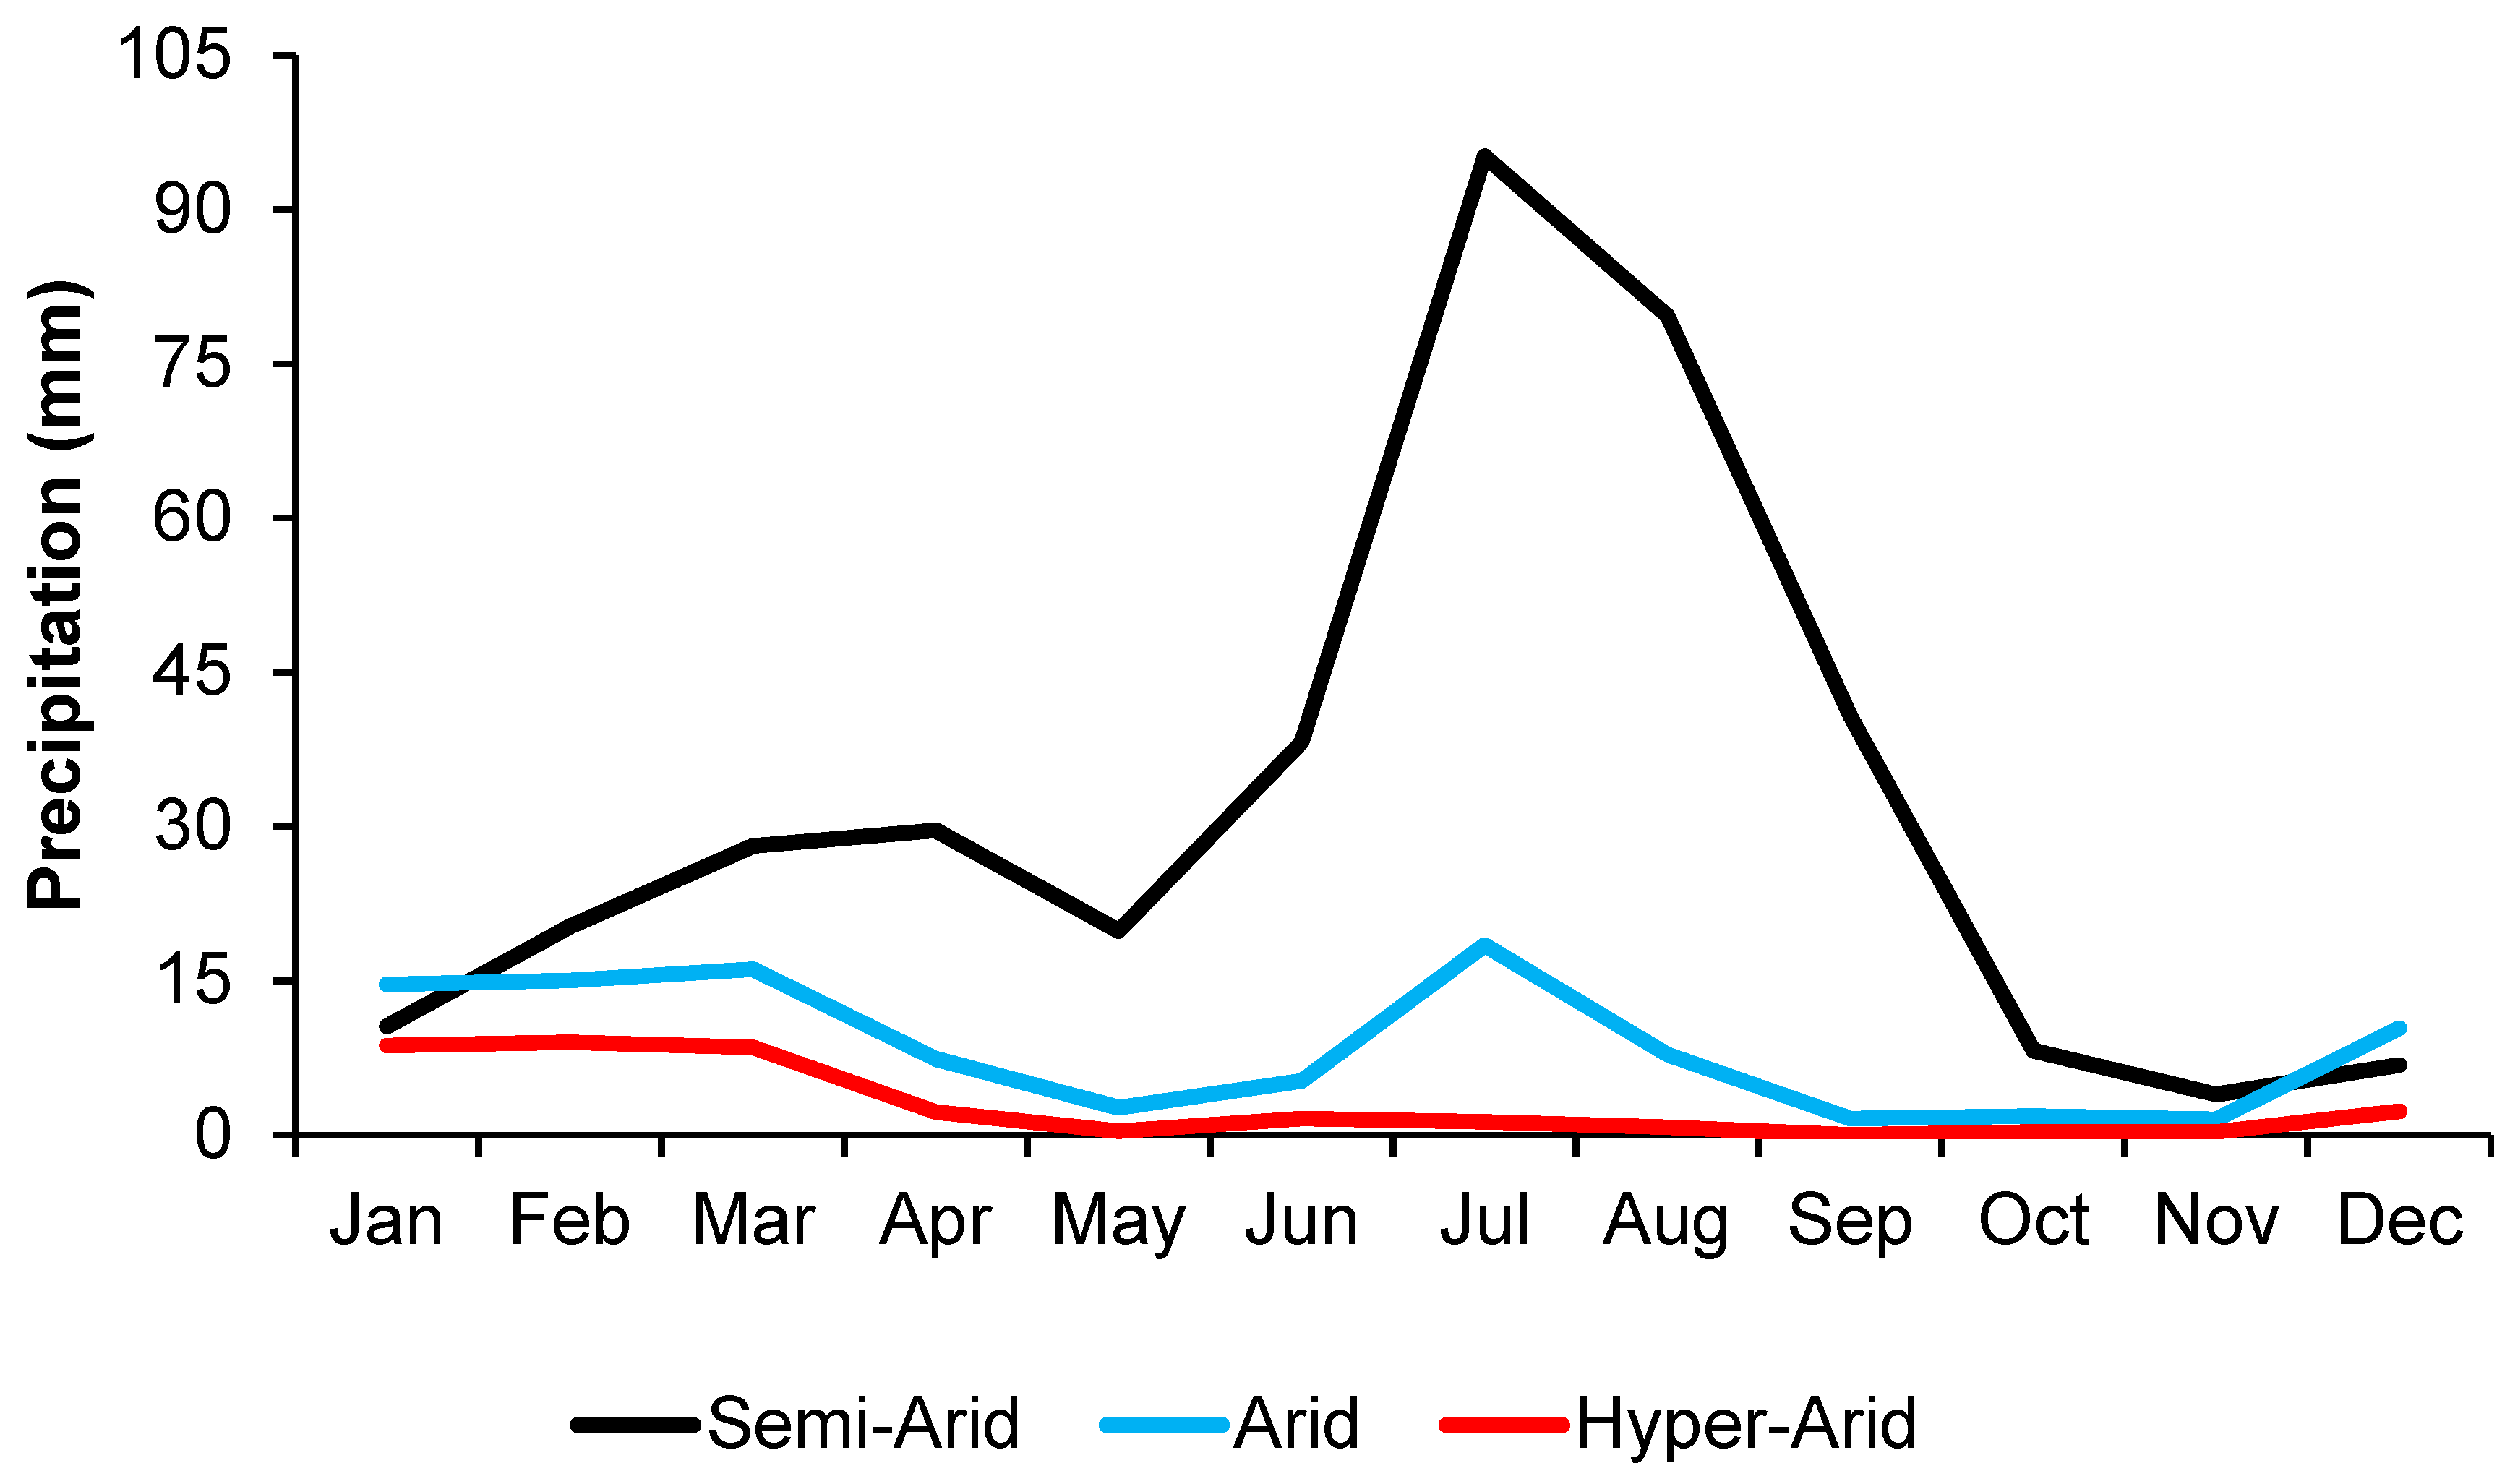
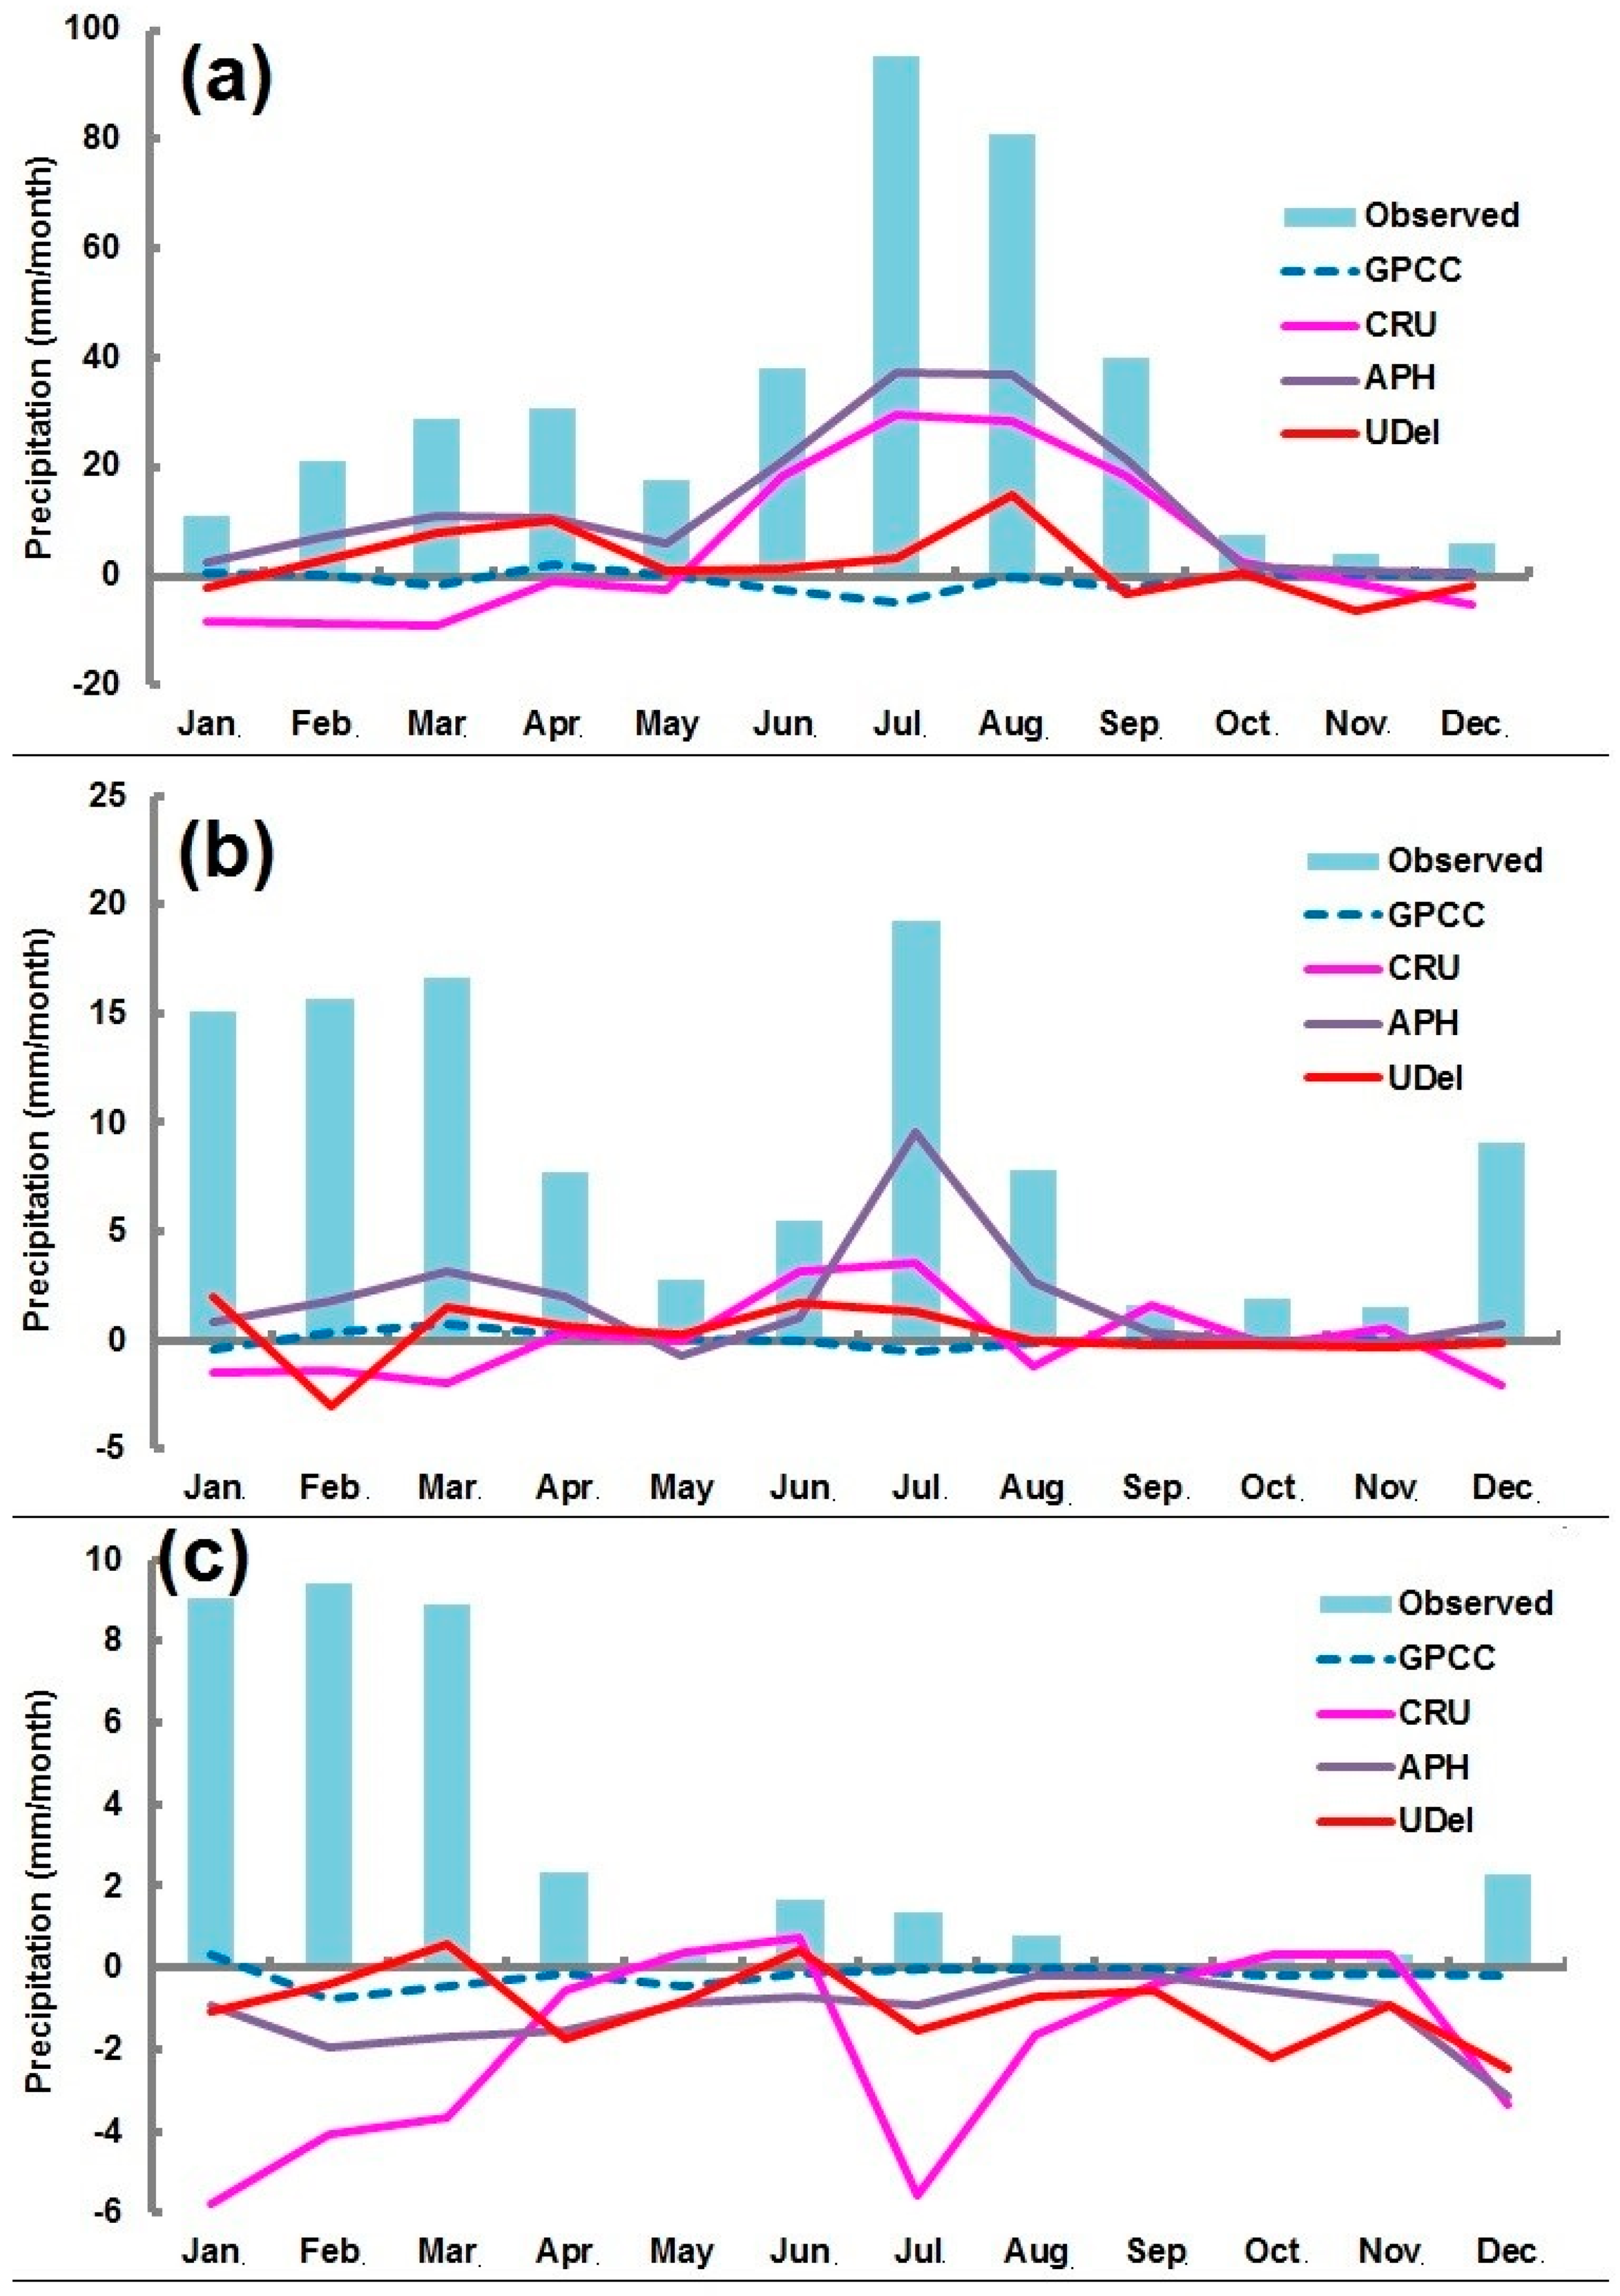
The monthly areal average distributions of precipitation at semi-arid, arid, and hyper-arid stations are shown in Figure 2. The figure clearly shows that there are seasonal differences in different climatic zones of the province.
The monthly gridded data of GPCC, CRU, APHRODITE, and UDel with 0.5o spatial resolution from 1961 to 2007 were extracted from the websites of corresponding organizations. The daily precipitation data of APHRODITE was converted to monthly series for comparison.
3. Methodology
The study was carried out in two steps. Initially, the observed data for the time period 1961–2007 were arranged and each calendar month was separated from time series for homogeneity test. The data homogeneity was assessed by using standard normal homogeneity test (SNHT) [54], Buishand range test [55], Pettitt test [56], and Von Neumann ratio test [57]. A sequential Student’s t-test was also used to assess the homogeneity by confirming whether data is derived from the same population or not. In the second step, the capability of gridded precipitation datasets was evaluated by visual inspection and using statistics. The visual inspection was done by the comparison of observed and gauge-based gridded precipitation for the whole period as well as for each month along with residuals and scatter plots. The details of the statistics used in the present study to validate gauge-based gridded data are given below.
3.1. Mean Bias Errors (MBE)
The MBE is a statistical index used to assess the mean difference between two data products and therefore, widely used to measure the over and under-estimation in data products. MBE can be calculated as
where, xgridded and xobs refers to ith gridded and observed data, and n is used to represent the number of data. The positive and negative value of MBE refers to the over and under-estimation of model respectively. Smaller absolute MBE value indicates a better performance of the model.
3.2. Mean Absolute Error (MAE)
The MAE measures the average magnitude of the differences between the two sets of data. It measures accuracy for continuous variables without considering the direction of the error. MAE, endorsed by American Society of Civil Engineering is widely used to assess error in simulated time series. MAE can be calculated as
where, xgridded and xobs refers ith gridded and observed data, and n is used to represent the number of data. It is a non-negative metric that has no upper bound and zero value indicates a perfect model.
3.3. Modified Index of Agreement
The modified index of agreement (md) is used as a standardized measure of the degree of model prediction error. It is the modified version of the index of agreement (d) proposed by Wilmott (1981). Compared to its original form, the modified version is less sensitive to extreme values [58]. The modified index of agreement represents the ratio between the mean square error and the “potential error” [59], and therefore, can detect additive and proportional differences in the data [37]. It is calculated as
where xobs and xgridded are observed and gridded precipitation values, while j is exponent to be used in the computation of md. The value of md varies from 0 to 1, where 1 shows perfect agreement while 0 shows no agreement at all [34].
3.4. Distribution of Precipitation Data
Anderson–Darling test was used to measure the difference in the probability distributions of observed and gauge-based gridded precipitation. The Anderson–Darling is a powerful test for comparing the similarity in distribution of two samples. The selection and rejection of null hypothesis of equal distribution are arbitrary. In the present study, a significance level (p-value) of 0.05 was used, which means that the hypothesis of equal distribution was rejected if the test yields value less than 0.05.
4. Results
4.1. Homogeneity Test
The homogeneity of the monthly precipitation data assessed using SNHT, Buishand range test, Pettitt test and von Neumann ratio test for a significance level of 0.05 showed that the observed precipitation data at all stations were homogenous. The result of sequential Student’s t-test showed that the differences between the sub-set series were not significant at a significance level of 0.05 for any station. Therefore, it was considered that the observed precipitation data are homogeneous.
There are two general ways to compare gridded data with station observation: (i) areal average precipitation for each grid box is computed from available station data and then grid-to-grid comparison is conducted [60,61,62]; (ii) gridded data is interpolated to station location and then compared with observed data. The grid-to-grid comparison is often preferred over point-to-point comparison [63]. Arithmetic mean, isohyetal analysis, Thiessen polygon, and distance weighting or gridding are generally used for estimation of areal precipitation from point data. Distance weighting methods are used for the gridding of observed data with same spatial resolution of gridded data to be compared when the gauges are sufficiently dense and well distributed [64,65]. On the other hand, a simple averaging of station data within the grid box is preferred to compute the areal average rainfall when gauges are sparse and unevenly distributed [66,67]. In case of only one observed station within a grid box, pairwise statistical analyses between the grid point rainfall estimates and rain gauge estimates is carried out assuming that station rainfall is the average observed rainfall for the grid box. This method has been adopted for evaluation of gridded data with in situ measurements by [67,68,69,70,71]. In the present study, no grid box was found to have more than one observed station. Therefore, the performance of different gauge-based gridded precipitation datasets was compared with single station data located within the grid box. However, the results obtained from one station located in each climate zones, hyper-arid, arid, and semi-arid region are presented in details. The locations of these three representative stations are shown in Figure 1. Details of the obtained results are discussed in the following sections.
4.2. Performance of Gauge-Based Gridded Precipitation Data
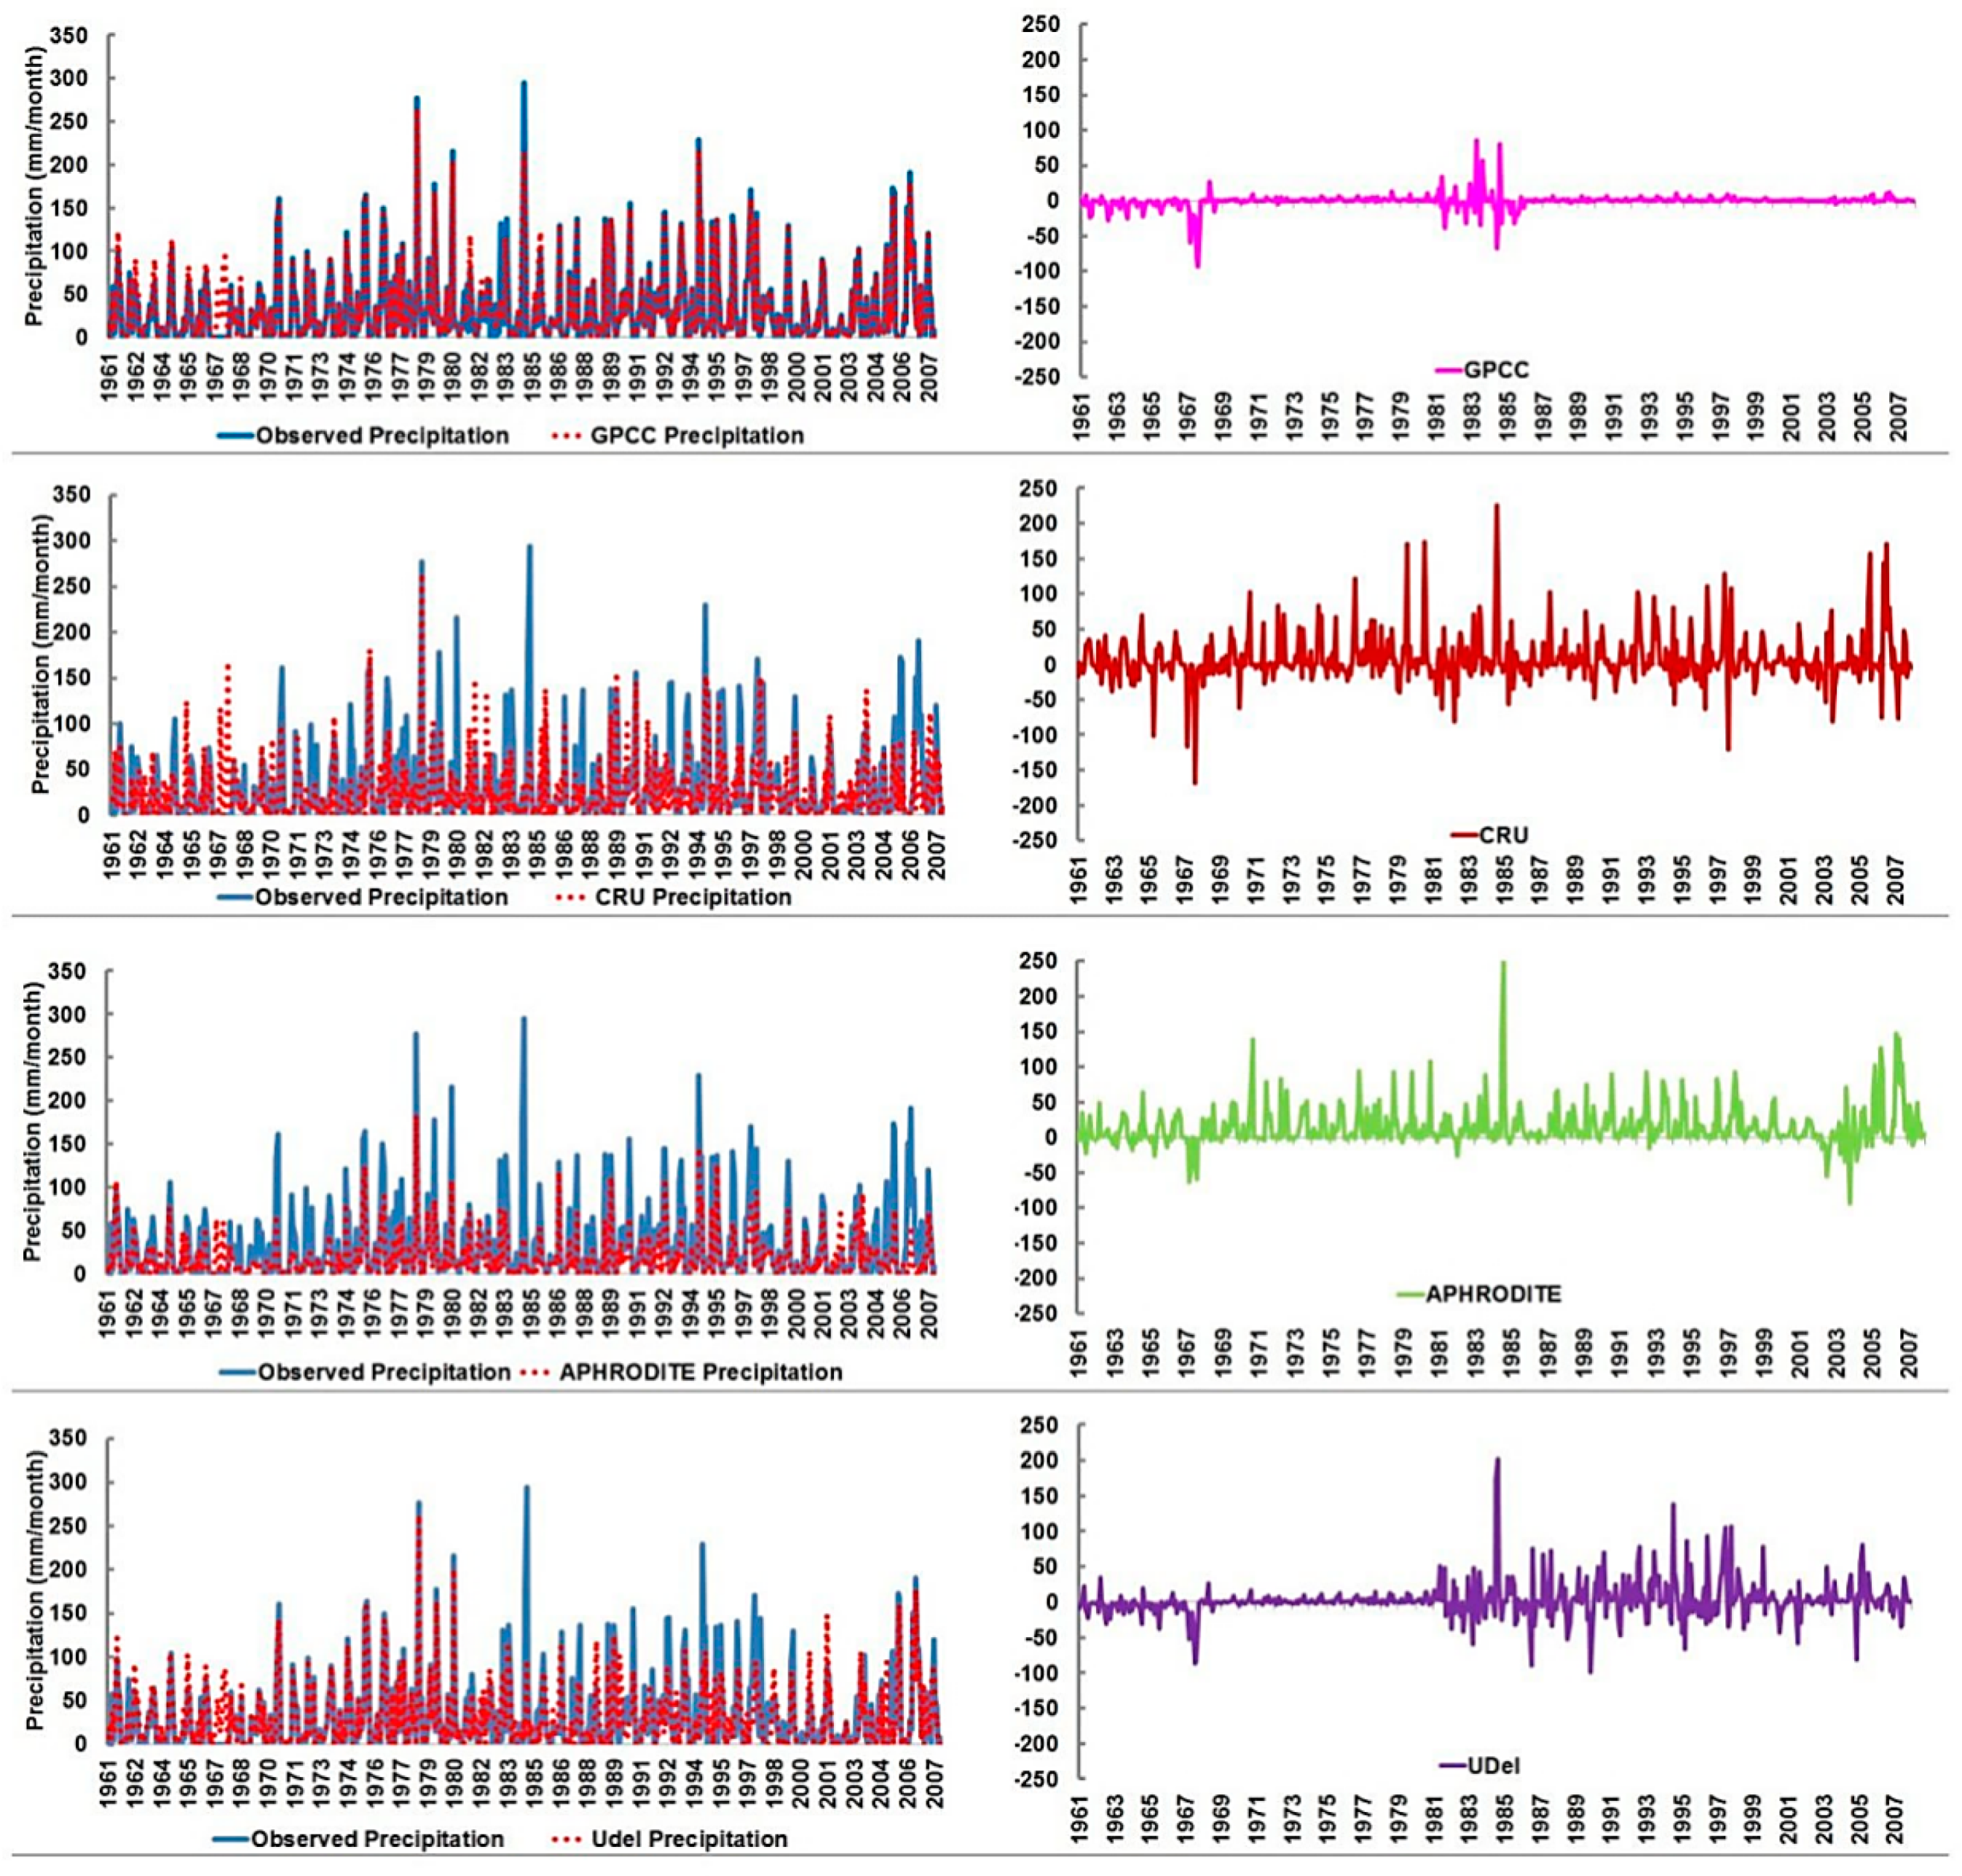
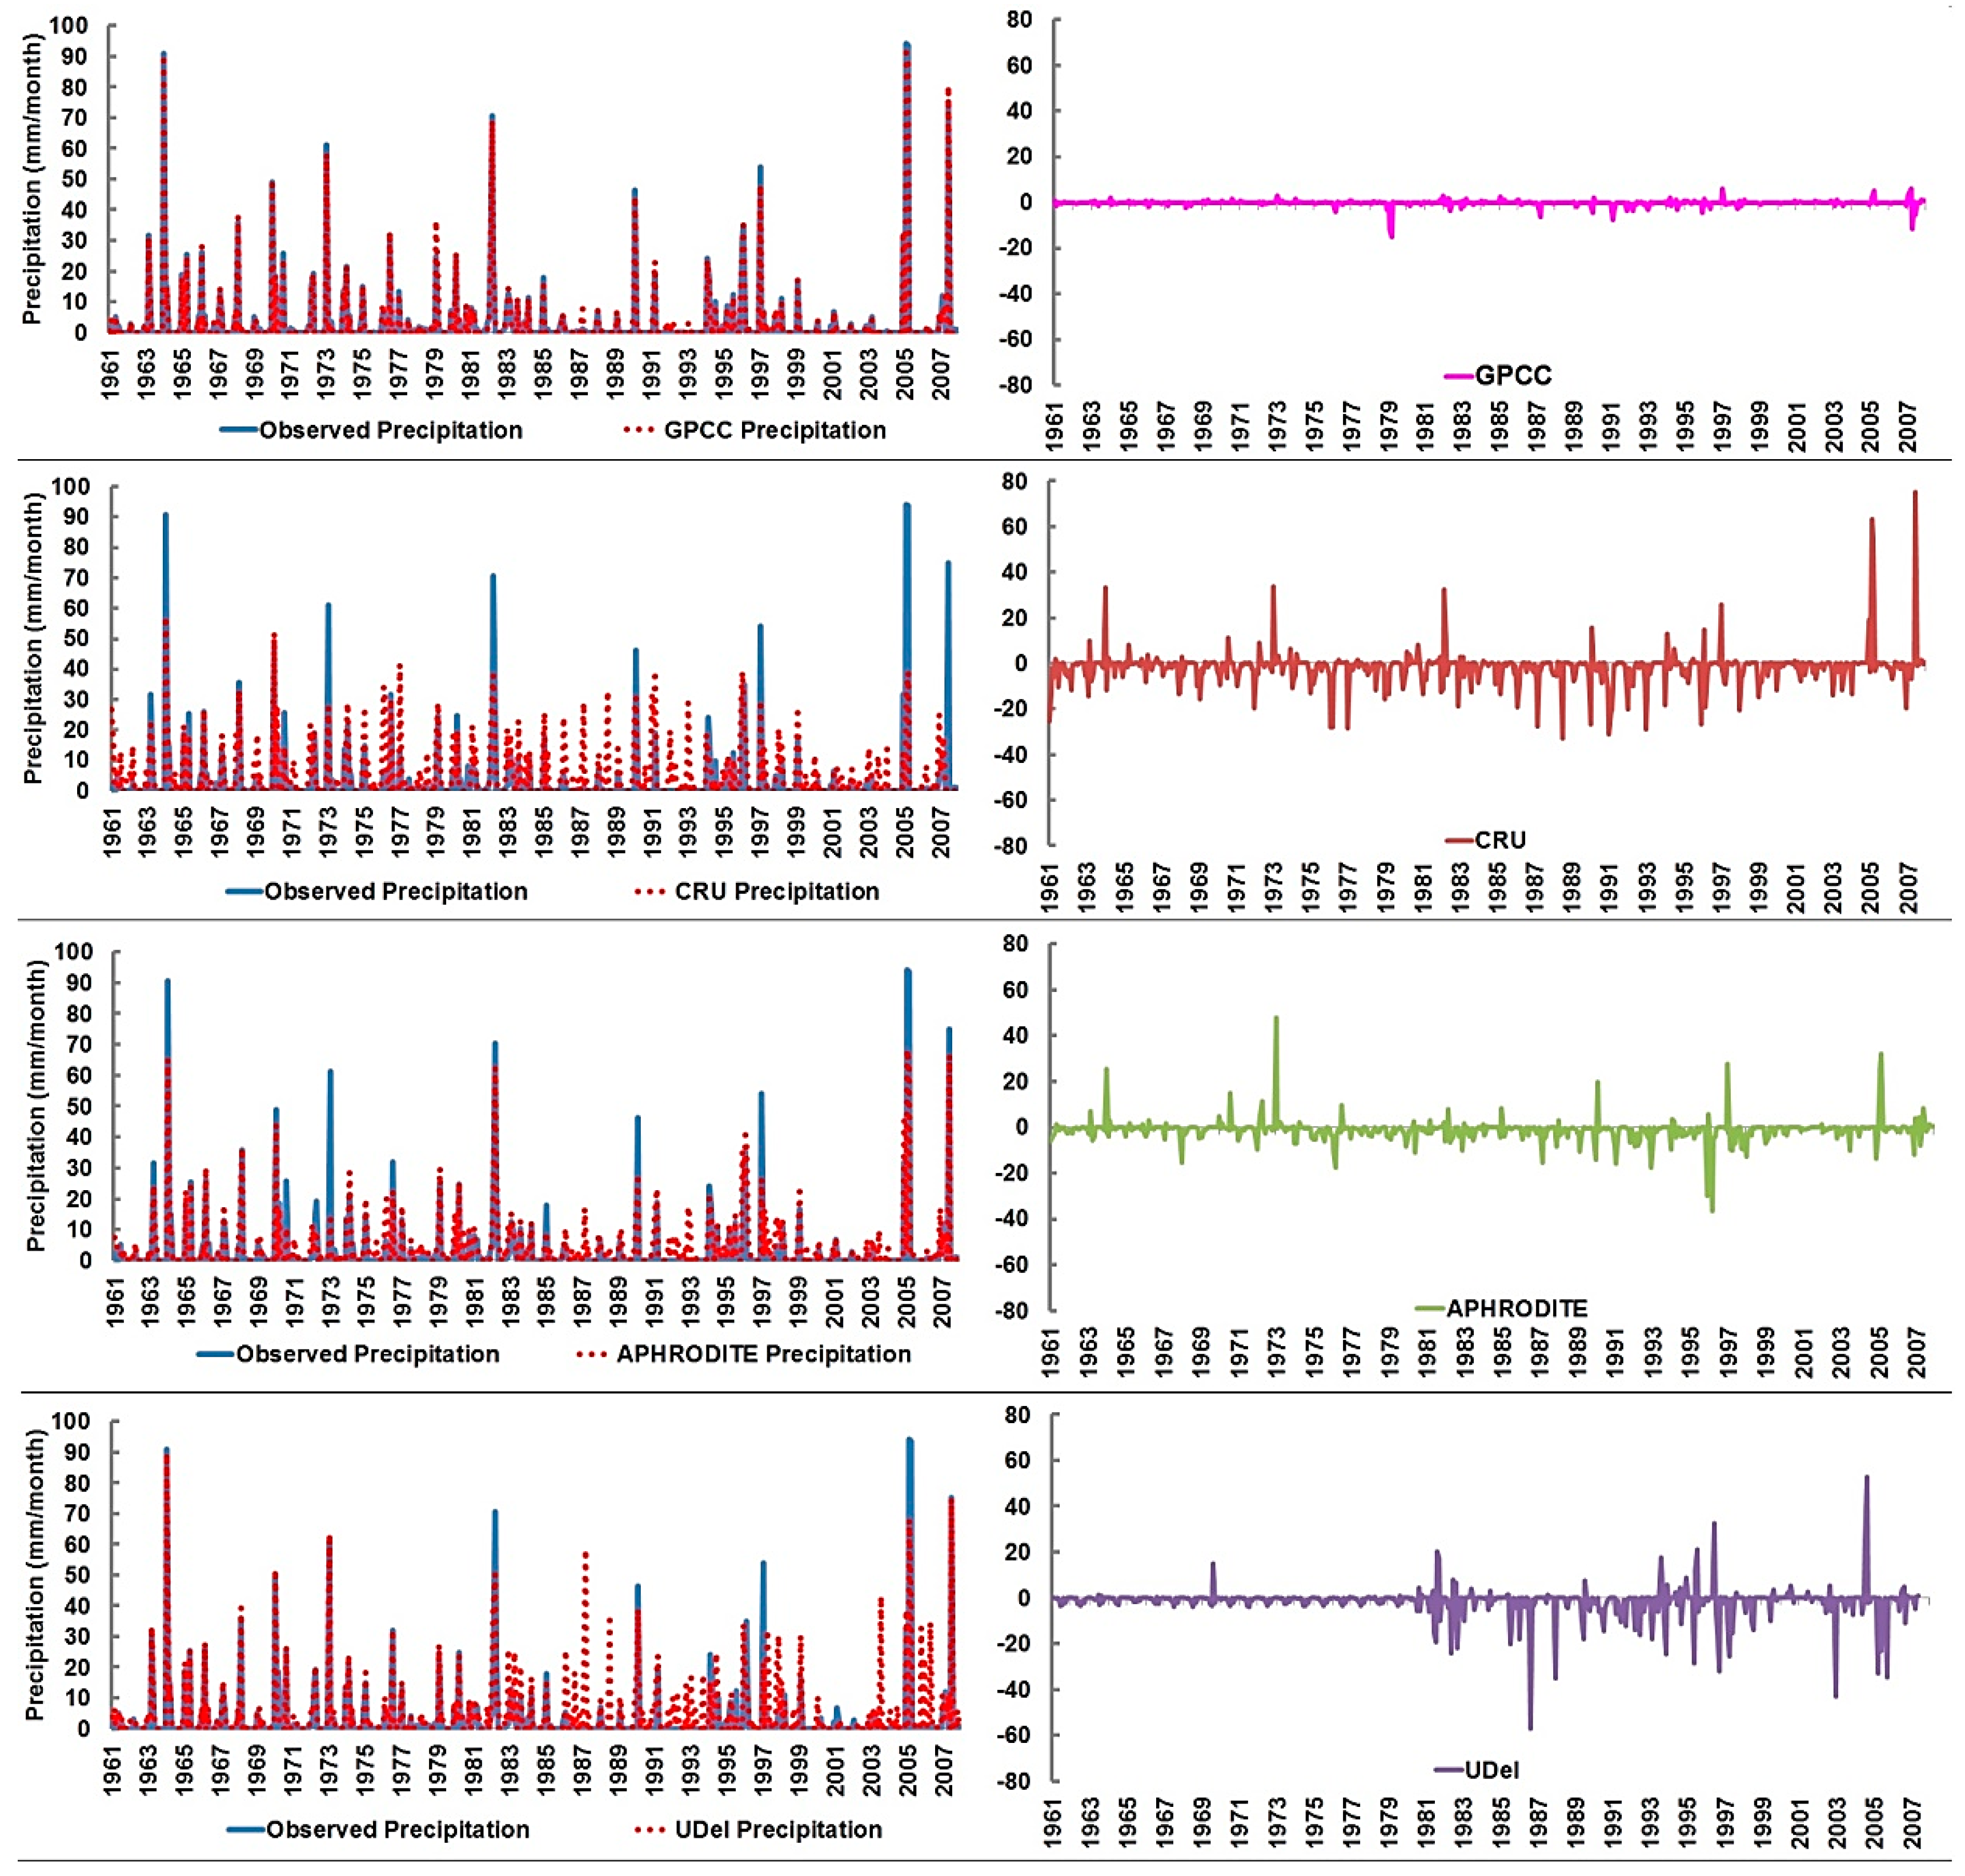
First, the monthly time series of observed and gauge-based gridded precipitation datasets were compared to show the ability of different precipitation datasets in representing the observed precipitation. The residuals or the differences between observed and precipitation datasets at different stations located in the hyper-arid, arid, and semi-arid region are shown in Figure 3, Figure 4 and Figure 5, respectively as examples.
The time series of observed and gridded precipitation and the residuals at the semi-arid station (Figure 3) shows that all precipitation datasets followed a similar pattern like the observed data. Nonetheless, gridded precipitation was found under- and over-predicted in some months. The visual comparison of time series reveals that GPCC precipitation matches well with observed precipitation compared to other precipitation products. GPCC was also found to capture most of the peaks in time series compared to other products. For example, GPCC replicated the highest precipitation of 294 mm recorded in August 1984. Other datasets estimated this extreme precipitation event less than 100 mm. In the estimation of dry sequence, all the models except GPCC were found to fail. For example, only GPCC is found to reasonably capture the dry spell in 1967 when no precipitation occurred for the whole year.
Analysis of residual time series revealed that GPCC precipitation has the lowest errors over the period of assessment. The error in GPCC was within the range of ±10 mm, except in the year 1990 when the error was 29 mm. On the other hand, the residuals of other data products were found to vary between 250 mm and −150 mm. The errors were found positive in most of the months which indicate that those precipitation data products underestimated the precipitation. This is found especially true for APHRODITE. Errors in APHRODITE were found positive in most of the months except in a few months after 2000. The residual plot of UDel showed that errors abruptly increased after 1981. Overall, the results show that GPCC precipitation has captured the observed precipitation more accurately compared to others.
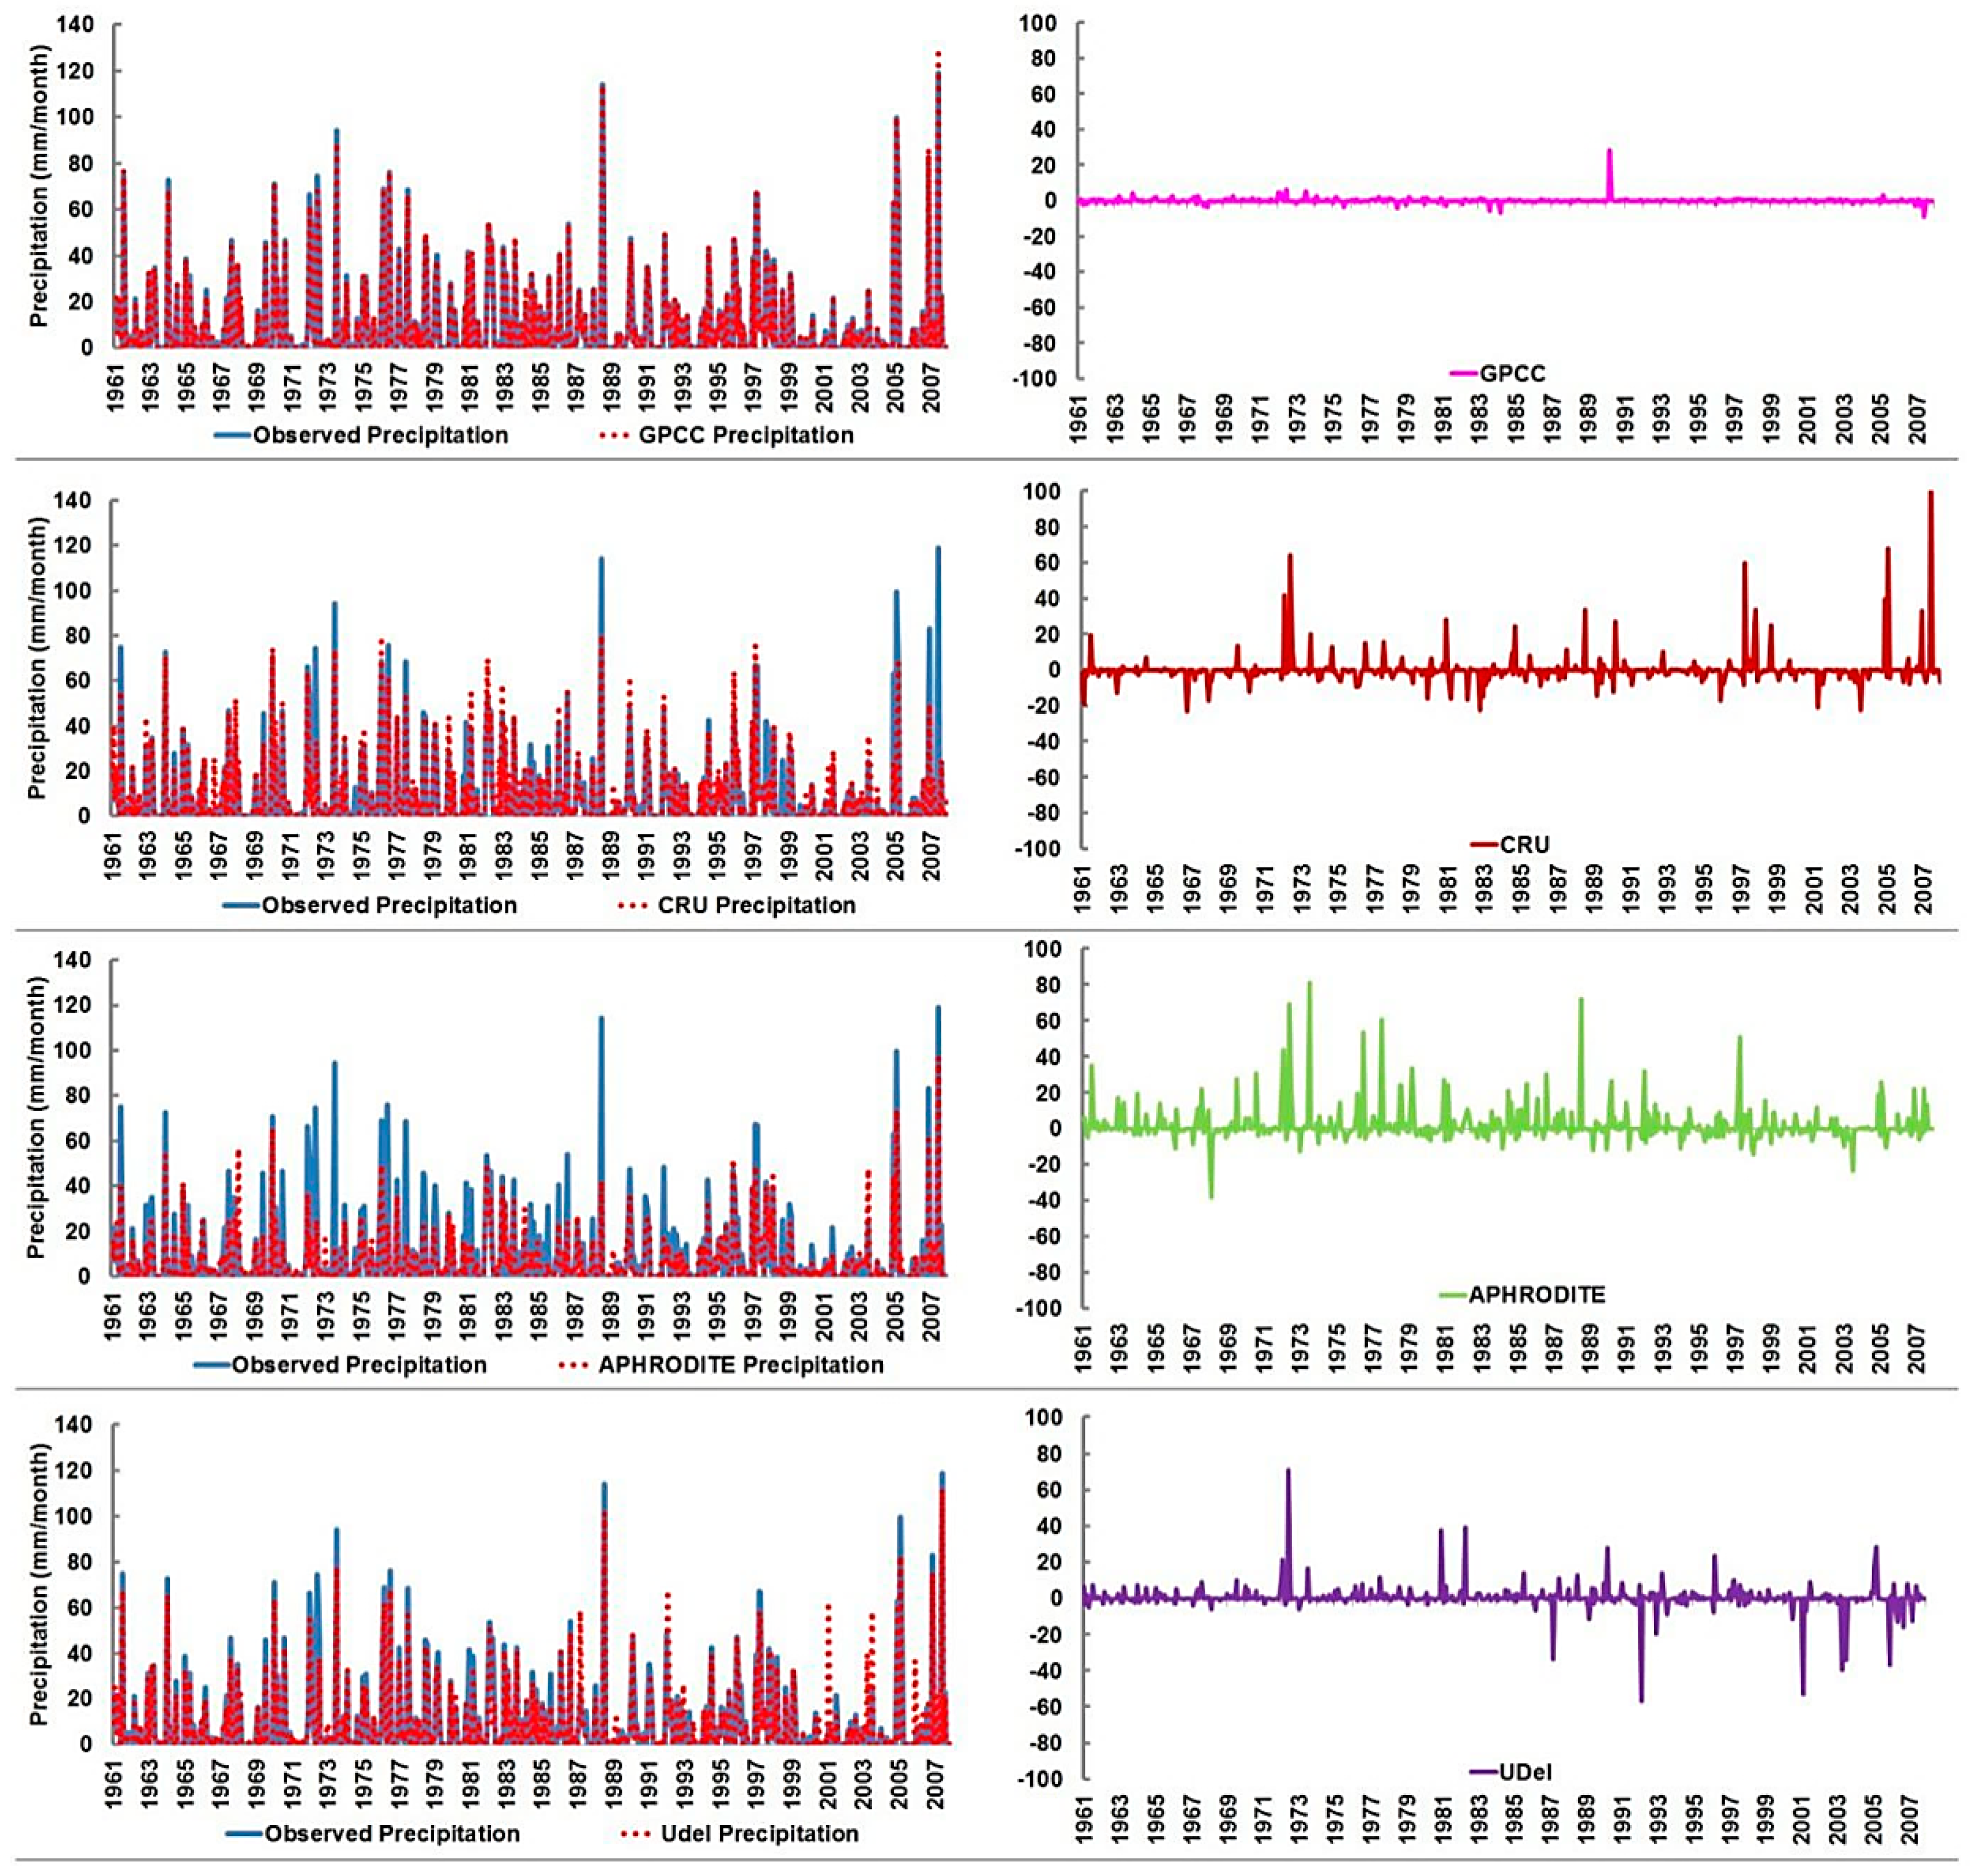
Figure 4 illustrates the comparison of observed and gauge-based gridded precipitation datasets as well as their differences in the arid region. The precipitation at this station varies from 0 to 120 mm in different months. The comparison of gauge-based gridded precipitation datasets showed that GPCC and UDel are much closer to observed precipitation in the region. On the other hand, the CRU and APHRODITE were found to under-predict the precipitation. It can be seen from Figure 4 that GPCC precipitation perfectly matched with observed precipitation in most of the months, except few random under and overestimations. UDel was also found to replicate the observed precipitation more closely in most of the months. The residual plots of each dataset provide an improved understanding of the nature and sign of errors. The errors in gridded precipitation were found to vary between −60 and 100 mm for different datasets. However, no consistency was found in errors among different datasets. For example, GPCC produced the highest error of about 30 mm in 1990; CRU showed an error of 100 mm in 2007, while APHRODITE and UDel produced highest errors of 80 mm and 70 mm in 1973 and 1972, respectively. Overall, the visual inspection of the figure showed that GPCC precipitation has the lowest error, while APHRODITE has the highest errors.
The time series of observed and gridded precipitation as well as their differences at the hyper-arid station is shown in Figure 5. The precipitation at this station varies from 0 to 100 mm. About 68% of the data at this station is zero. The results show that the highest precipitation of 94 mm is recorded in 2005 at this station was well replicated by GPCC and UDel, while APHRODITE and CRU were found to underestimate this precipitation event. The GPCC precipitation was found to replicate the observed precipitation time series at this station more accurately compared to other products. The UDel was found to replicate the precipitation more accurately in the first half of the time series, but under-estimate the precipitation after 1981. The residual plots (Figure 5) show that errors in GPCC range between 6 and −20, while errors for CRU, APHRODITE, and UDel range between 40 and −40.
Generally, the regions with low precipitation are called upon to yield small differences between observed and estimated data. We also analyzed the residuals of the mean monthly observed precipitation against mean monthly gauge-based gridded data given in Figure 6. It was observed that differences are high in months where the precipitation is high and small where the precipitation amount is low. These differences vary in different gauge-based gridded datasets. For example, in the semi-arid station, the highest observed precipitation of 95.18 mm is recorded in the months of July and GPCC estimated 99.95 mm where the highest difference of −4.8 is also noted on the (Figure 6a) for GPCC. Similarly, the lowest precipitation of 3.86 mm is recorded in the month of November, and the lowest difference is also found in the same month. Overall, it can be viewed that GPCC showed the lowest differences while inconsistencies were observed in the highest and lowest mean residuals of other products.
Figure 6b showed the mean monthly residuals in the arid station. It is clear on the figure that GPCC has yielded fewer residuals and can be seen near the zero line. The highest precipitation at this station is received in the month of July and all datasets showed the highest errors in that month. Among semi-arid and arid stations, the lowest errors in the hyper-arid station (Figure 6c) is also noted in GPCC dataset. It is noted that observed precipitation in the month of September is zero where GPCC and APHRODITE showed the lowest errors in the same month. On the other hand, the highest precipitation of 9.40 mm is received in the month of February, and the highest difference is also found in same from GPCC data.
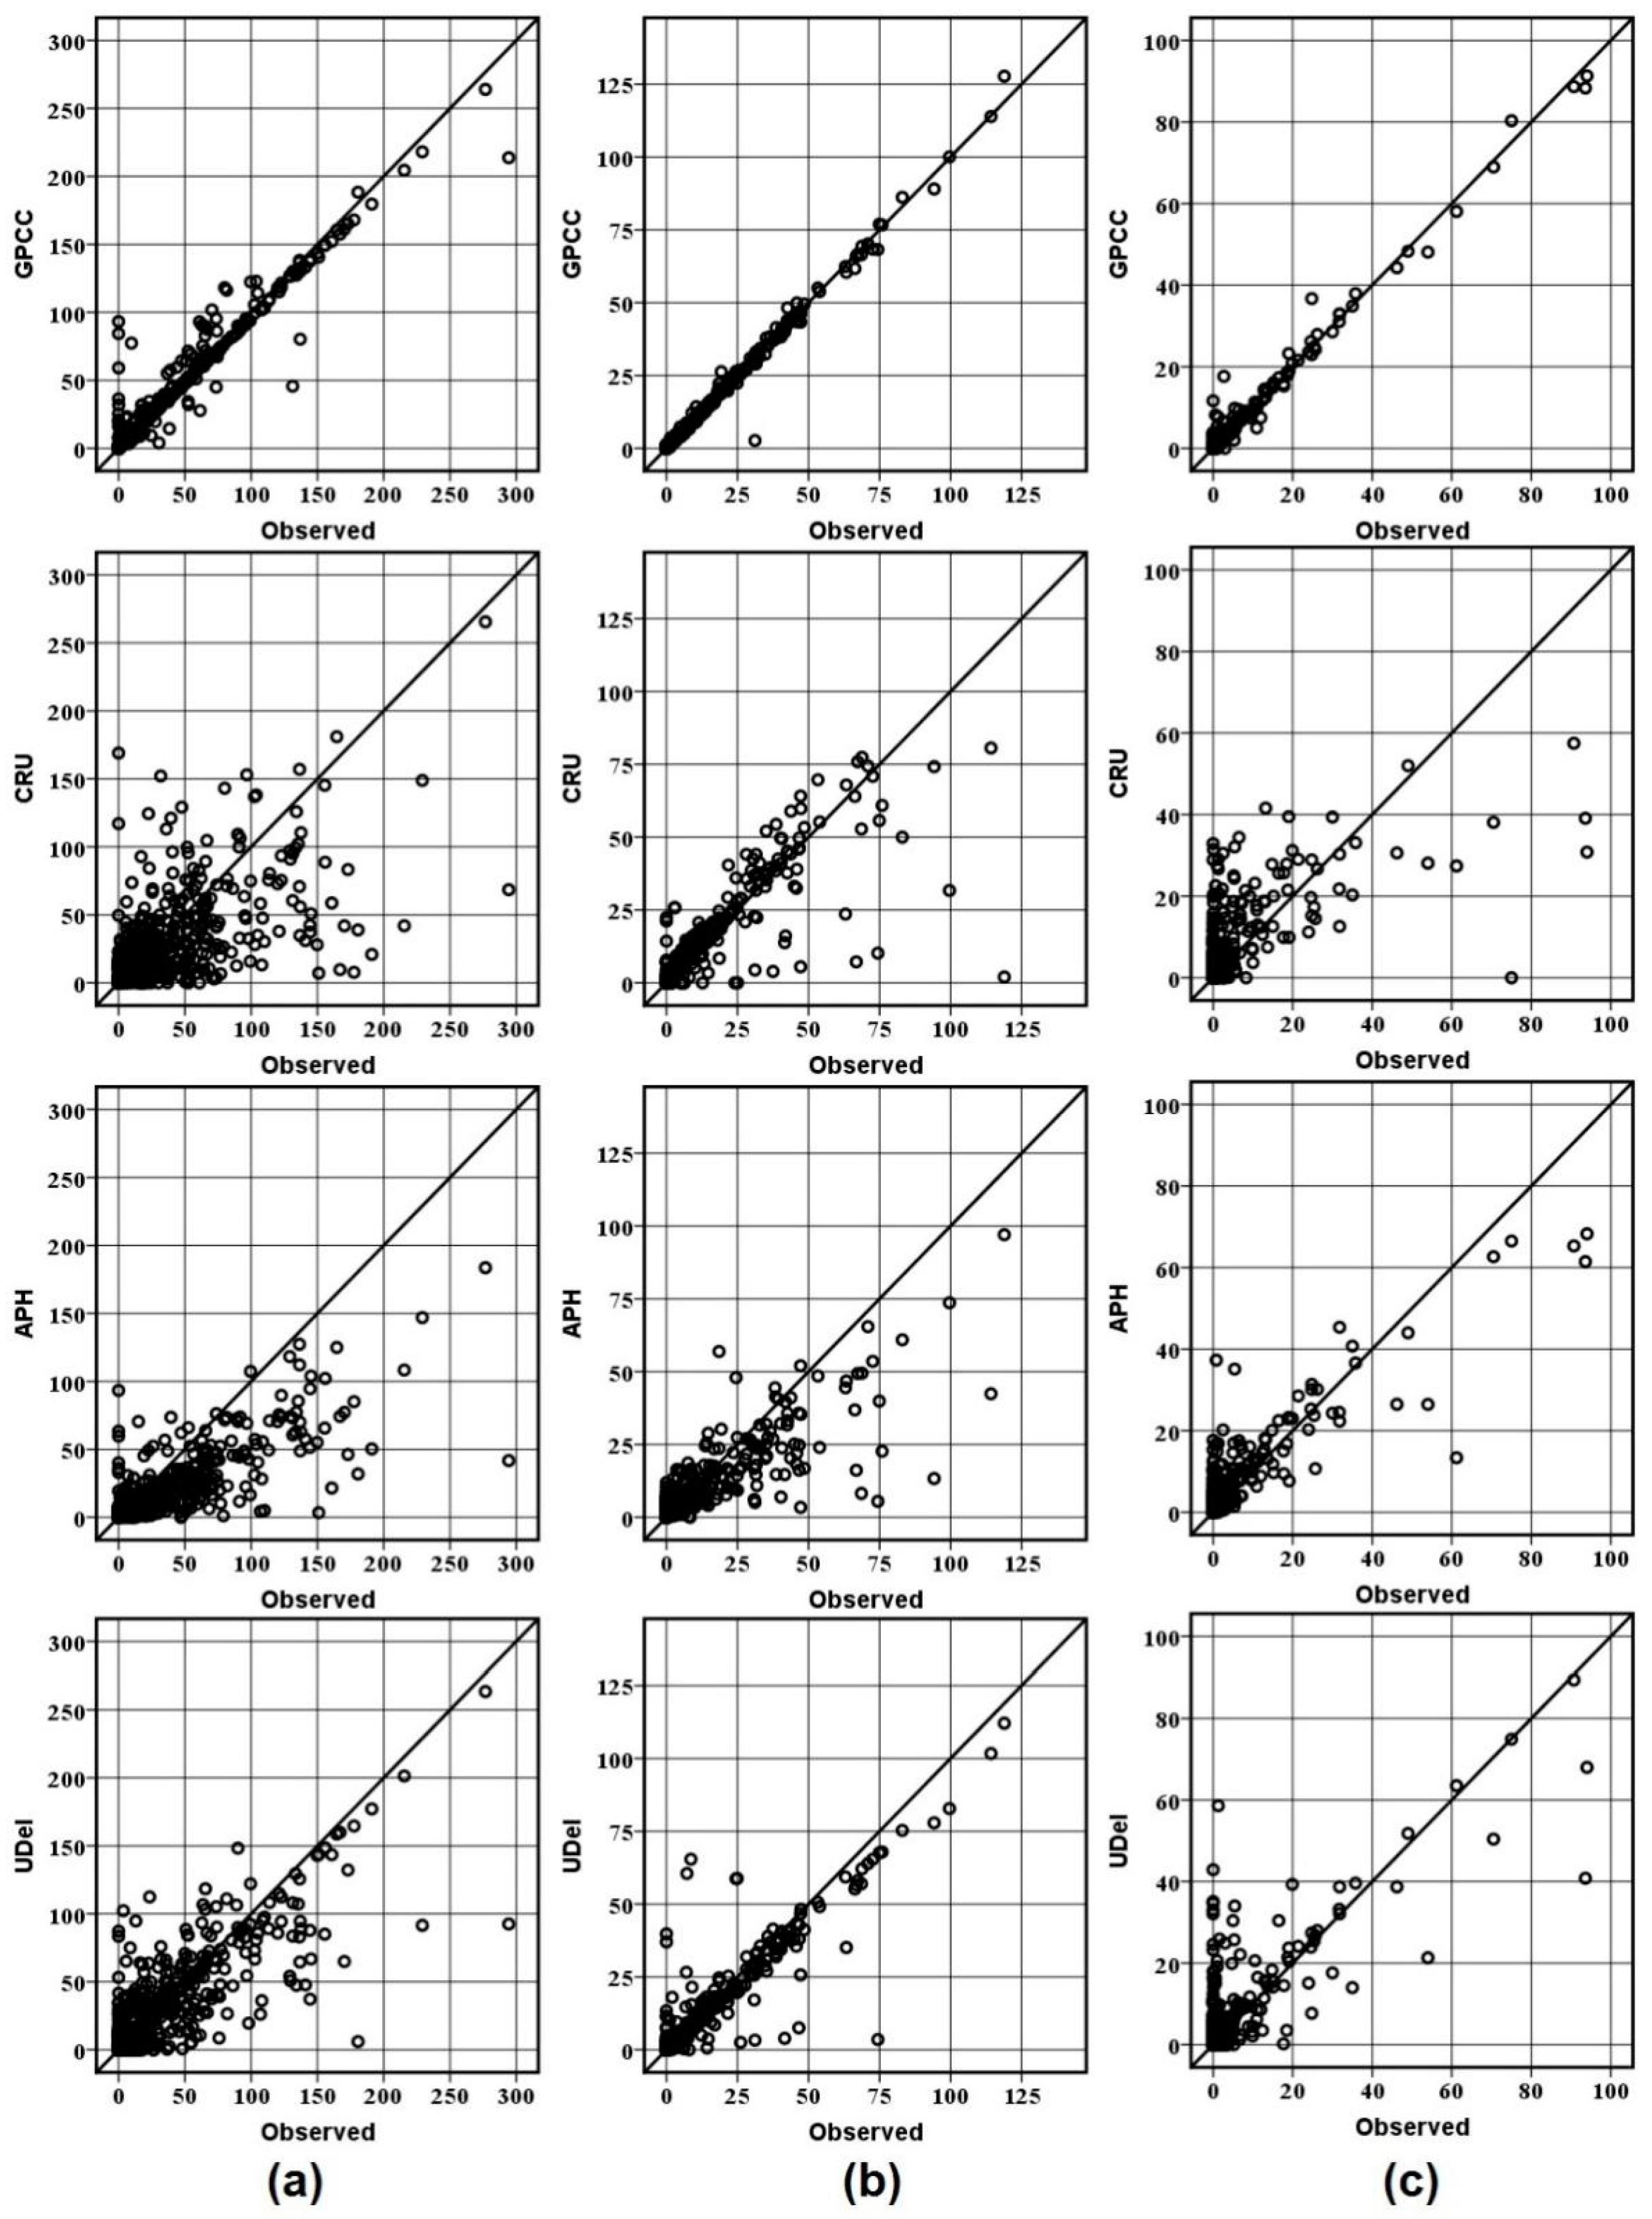
Scatter plot is also useful to reveal errors in different parts of the data. No matter how data is displayed, it is used to better understand how well the data products have estimated the observed data. Figure 7 shows the scatter plots of observed against gauge-based gridded precipitation for different climatic zones. The plots for each station are arranged in the vertical direction for comparison among different datasets. The plots for different data products at the semi-arid station are given in Figure 7a. GPCC plot shows a narrower scatter, which shows a large part of GPCC data is near to the observed value. It can be seen that most of the data of CRU and APHRODITE is dispersed and located away from the 45-degree line. The data above 100 mm is mostly under-predicted by these two products. Overall, the performance of GPCC was found better by predicting low as well as extreme values as compared to other data products at this station.
Figure 7 b showed the scatter plot between observed and gauge-based gridded precipitation in the arid station. It can be observed that all data have performed better as compared to the semi-arid station. It can be seen that most of APHRODITE data is underpredicted. The performance of UDel at this station was found better as most of the data is located near the bisector line. The scatter plot of the hyper-arid station is shown in Figure 7c. It can be observed in the figure that GPCC exhibited a good accuracy for estimating observed data while CRU was failed to maintain accuracy in predicting low precipitation values. Most of the data in CRU are over-estimated while APHRODITE was found better as compared to CRU and UDel at this station.
4.3. Mean Bias Error (MBE)
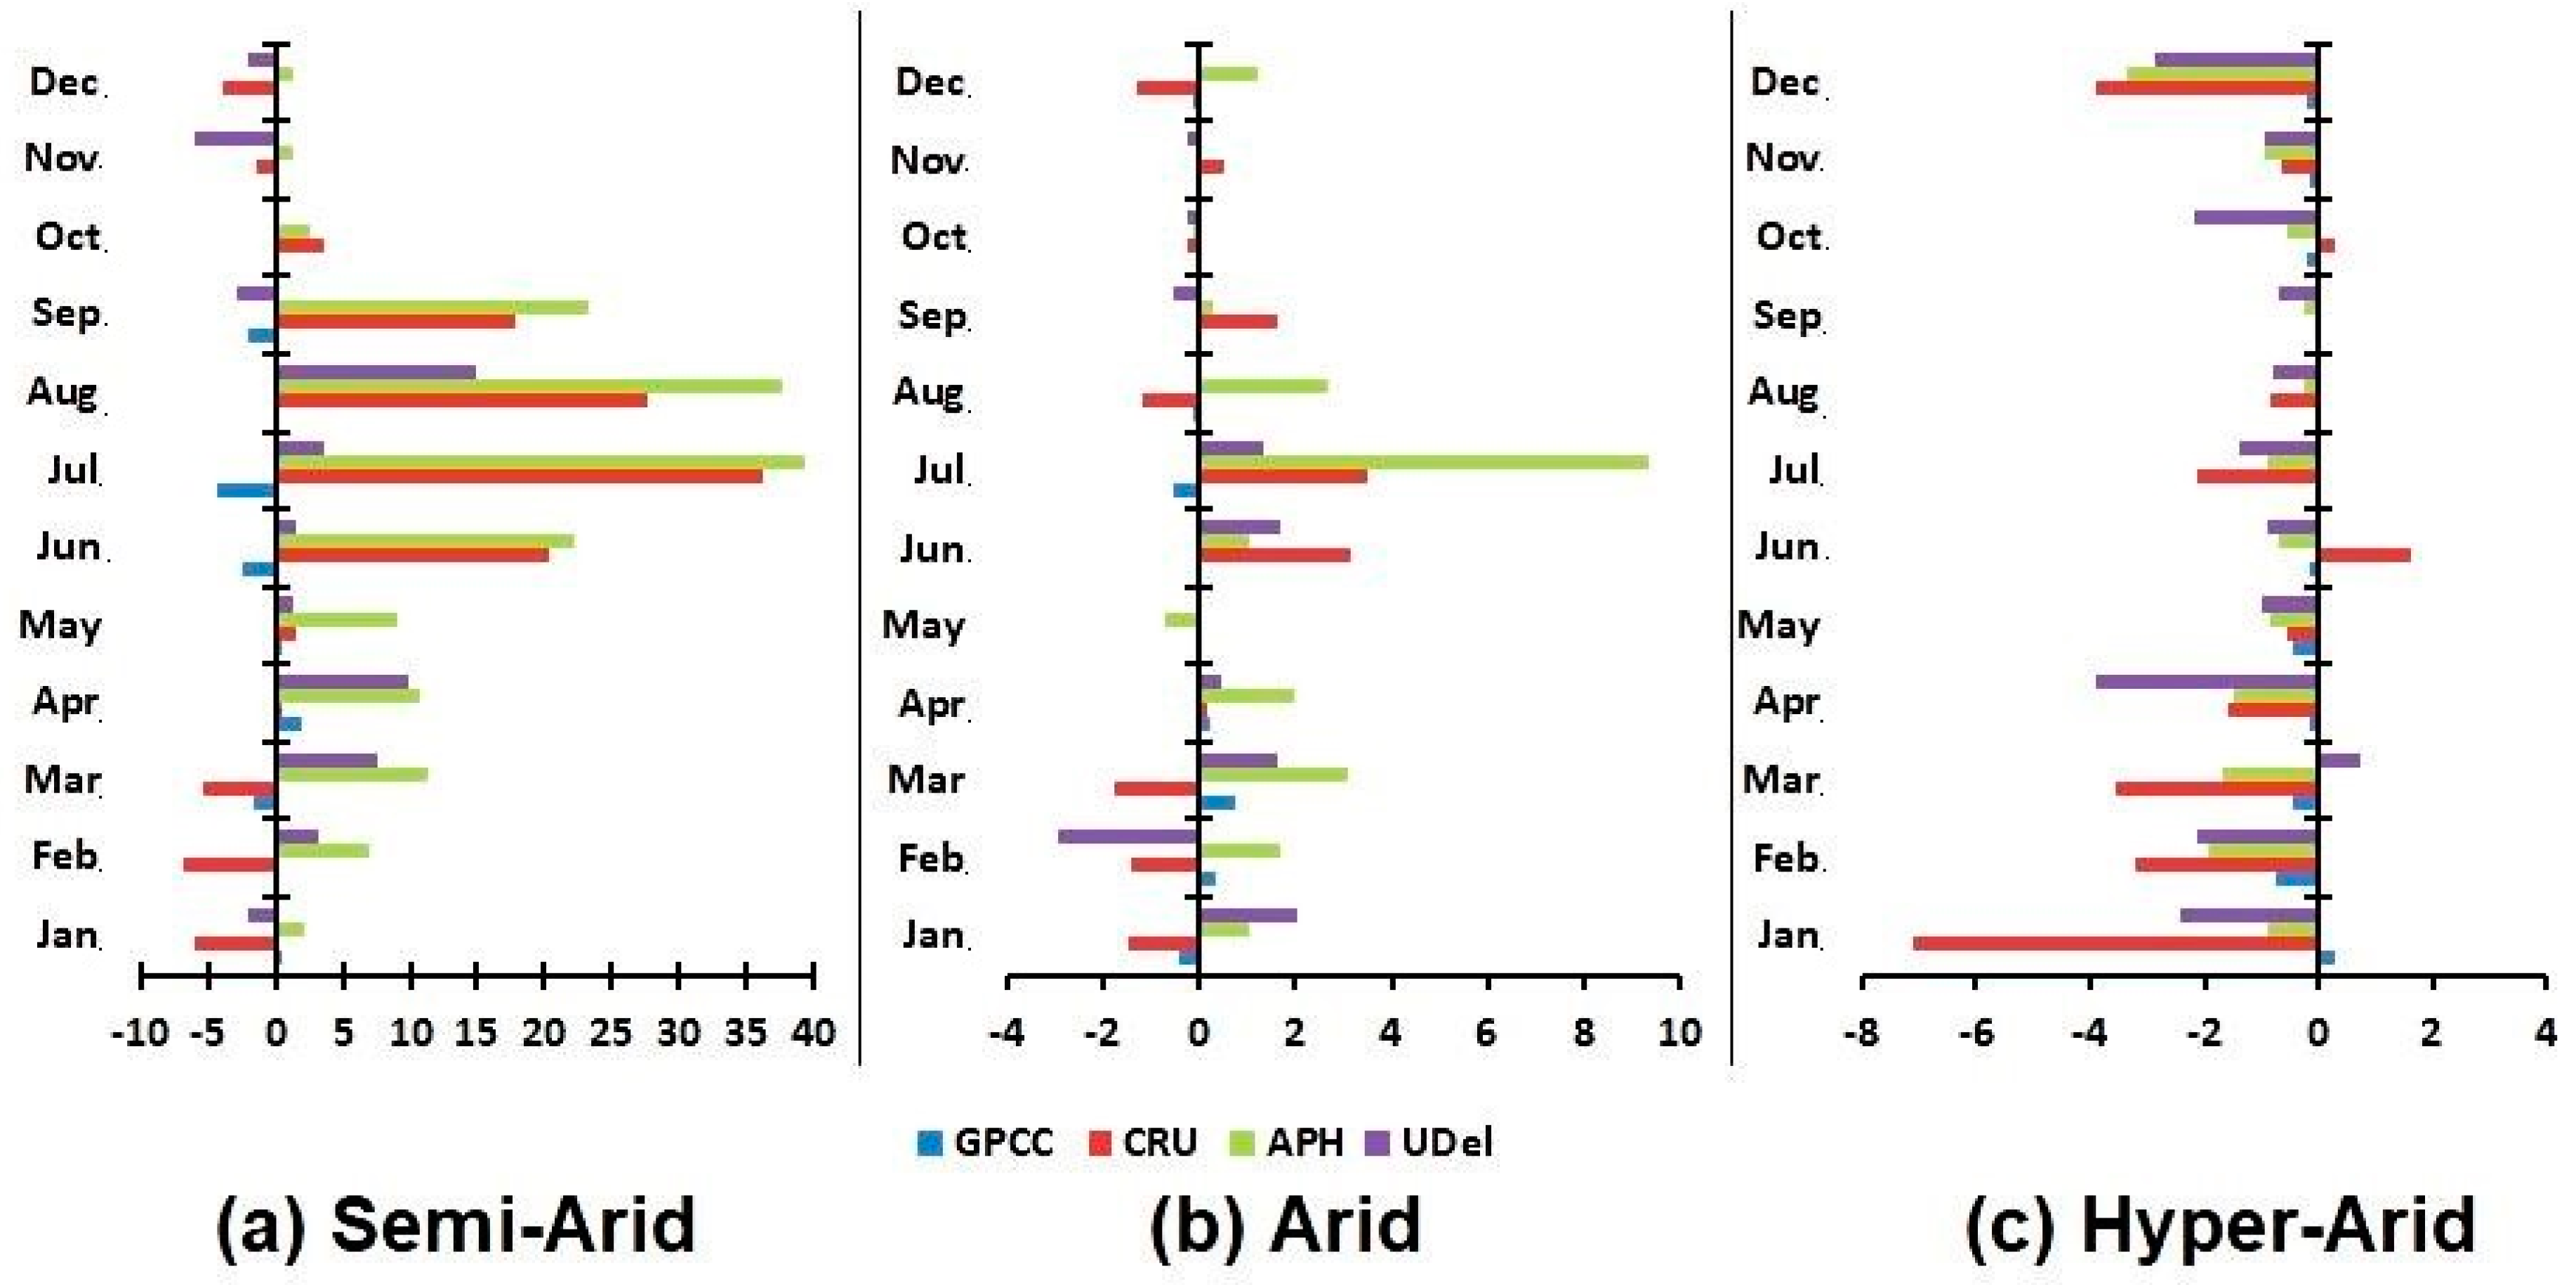
Mean bias errors (MBE) in different gauge-based gridded precipitation data are presented in Figure 8. It was found that the biases of different gauge-based gridded precipitation data products vary according to climatic zones. However, it was observed that most of the months have yielded the lowest errors in GPCC. In the semi-arid station, biases vary from positive to negative in different months and in different data products except for APHRODITE where all the errors were found positive. The lowest error of GPCC and UDel varies from around −5 to 1 and −6 to 15, respectively. On the other hand; CRU and APHRODITE yielded higher errors that vary from around −6 to 36 and 2 to 40 respectively. It is also observed that there is no consistency in the lowest errors for different months of data products. For example in GPCC and CRU, the lowest error was found in November and in April. In APHRODITE and UDel, lowest errors were found in November and October. Comparisons among different data product showed that GPCC gave the lowest errors in all months except April, June, July, and October. The lowest error in April was found in CRU while in June, July, and October lowest errors were obtained in UDel.
In the arid station (Figure 8b), it was observed that there is no consistency in the lowest errors in different datasets. Like, semi-arid and hyper-arid stations, biases vary from positive to negative in different months and different data products. It can also be noted that different datasets were found to have the lowest bias in various months. For example, GPCC data showed the lowest bias in the months of January, February, March, June, September, October, and November. CRU gave the lowest bias in April and May while UDel showed the lowest bias in May, August, and December respectively.
In hyper-arid station (Figure 8c), biases vary from positive to negative in different months of GPCC, CRU, and UDel products while APHRODITE was found to have negative biases in all the months. Precipitation amount at this station is very small, and it was expected and observed that biases at this station are also low. Unlike, semi-arid and arid stations data; there was a consistency in the lowest errors of different data products. The lowest error was found in September for all products since the observed data of September was zero. Overall, the performance of GPCC was found better at all stations in term of mean bias by giving lowest bias error in most of the months.
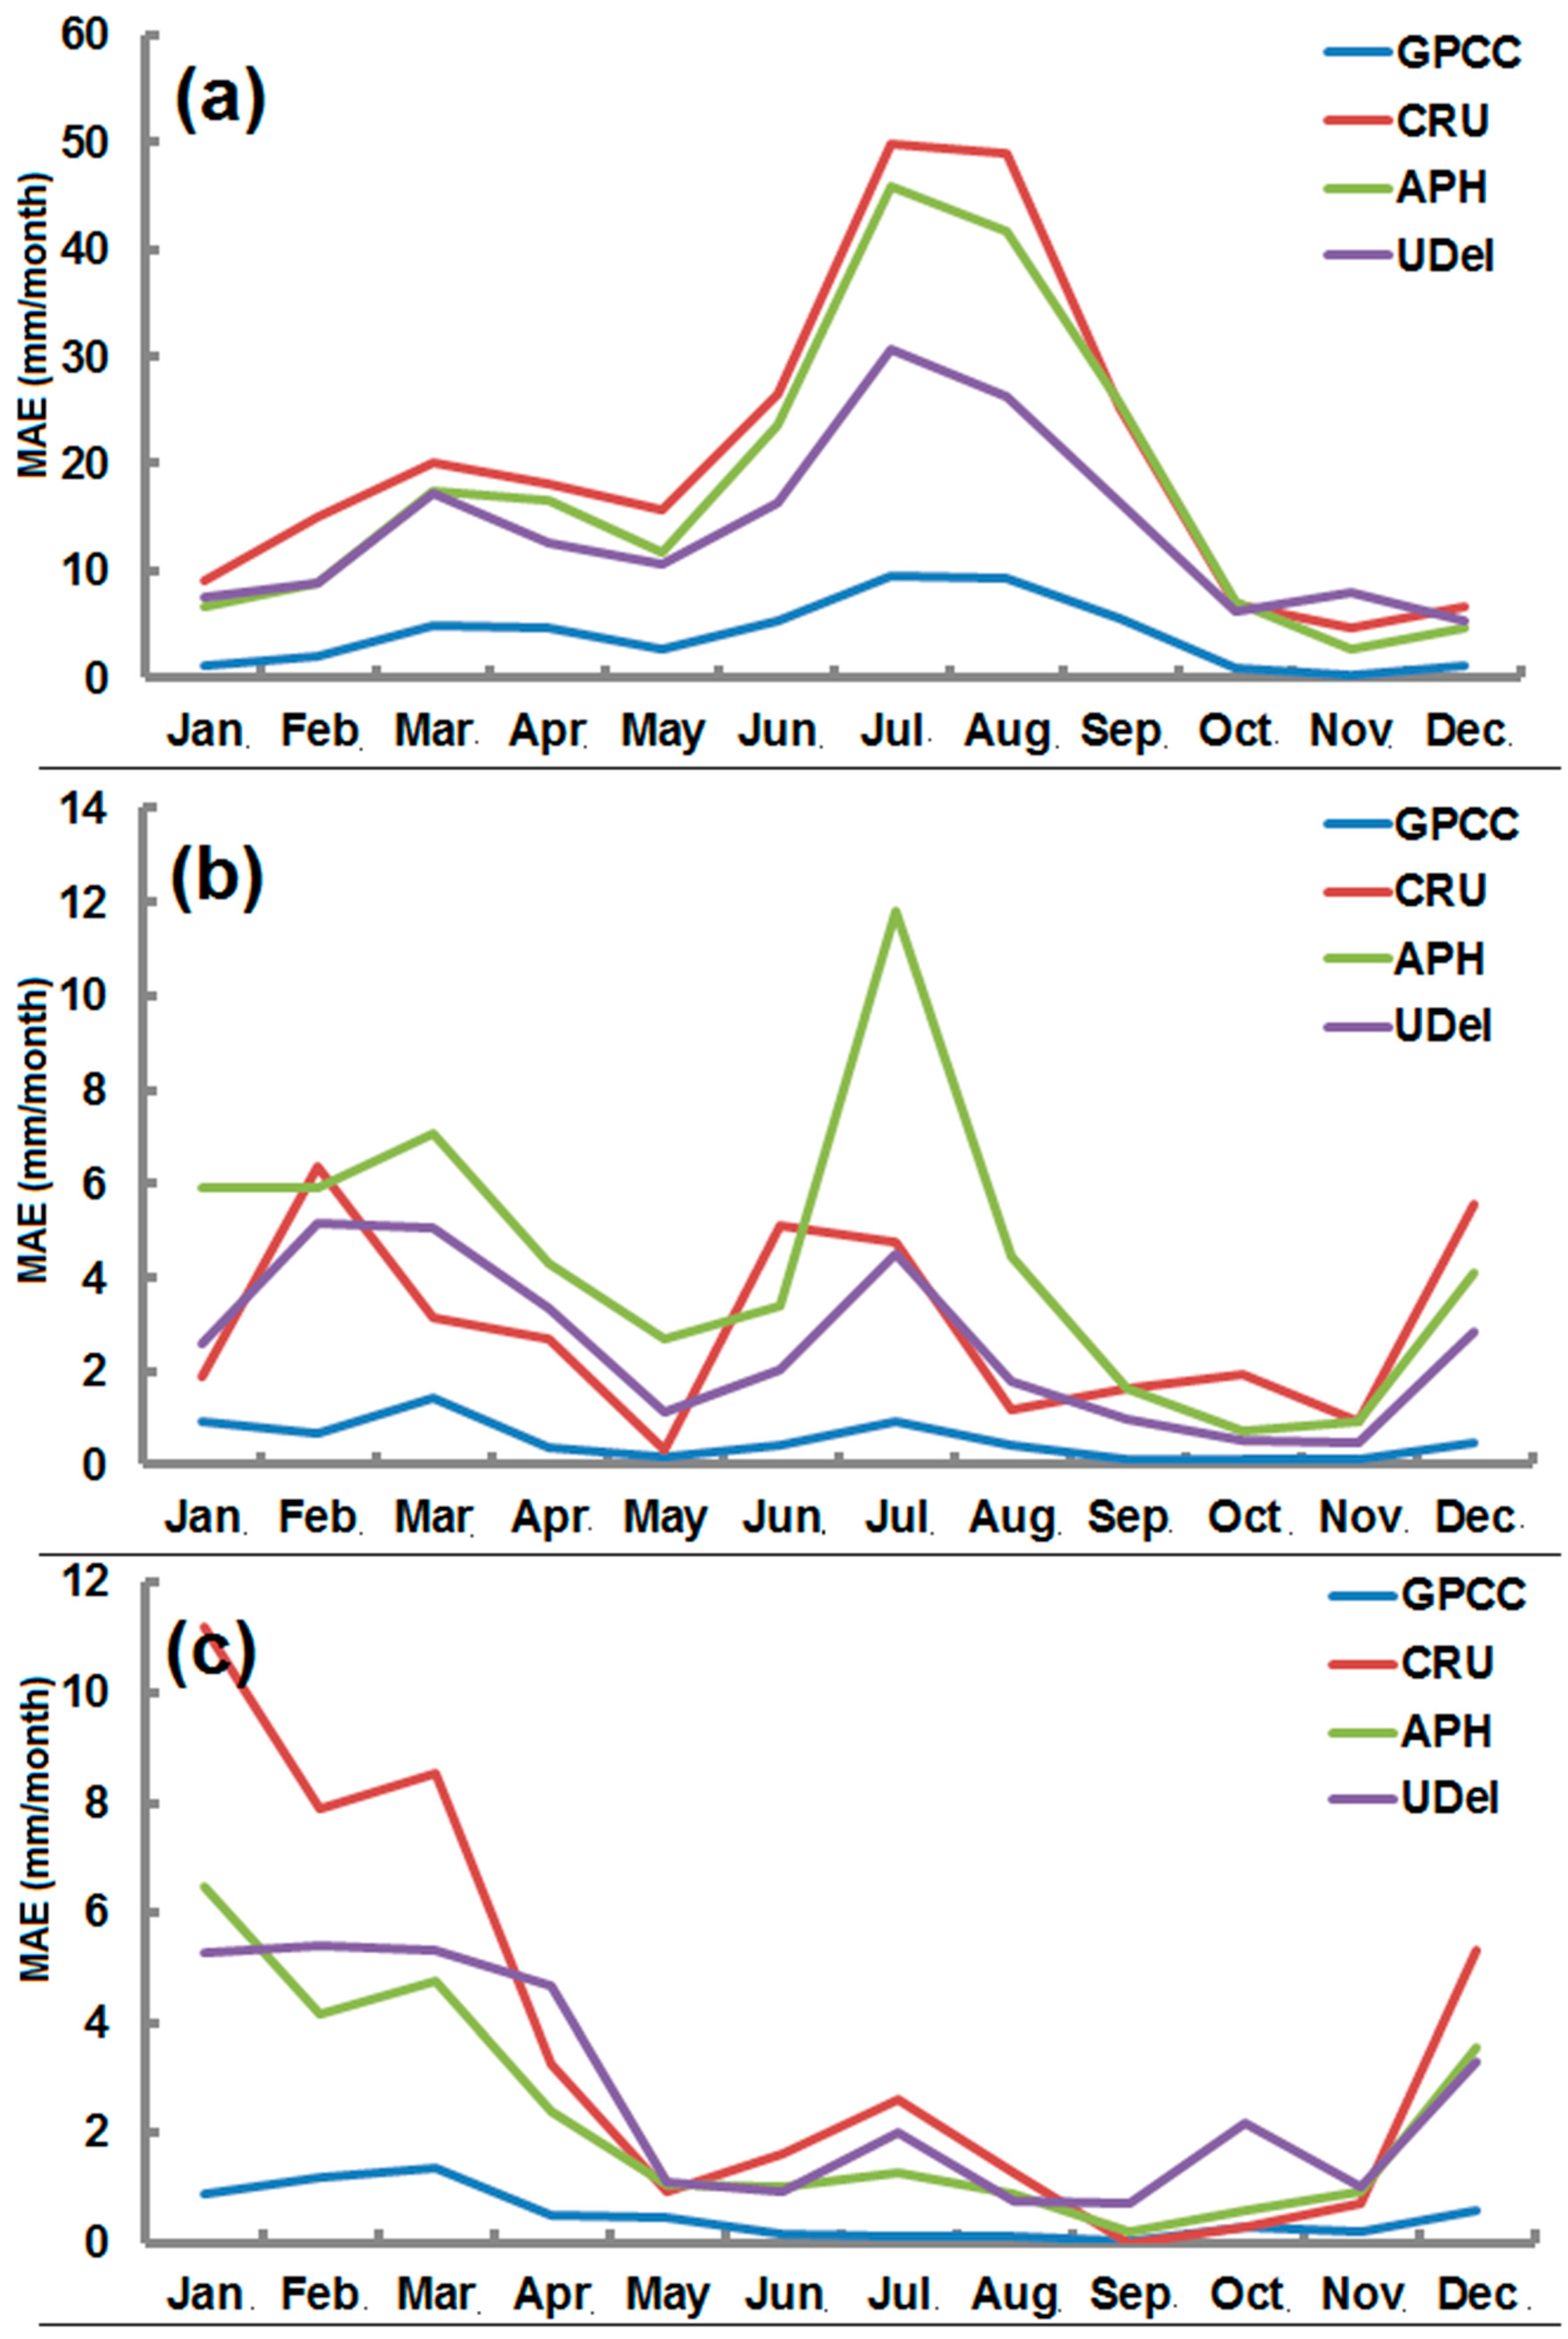
4.4. Mean Absolute Error (MAE)
Mean absolute errors for semi-arid, arid, and hyper-arid are given in Figure 9. The figure showed that GPCC dataset is closer with zero in all stations, indicating that errors are less in GPCC. In semi-arid station (Figure 8a), CRU showed highest errors followed by APHRODITE and UDel. It is also observed that the errors are high in the months where precipitation is high and less where precipitation is less. The highest errors can be seen in the months of July and August while the lowest can be seen in the months of October, November, and December for all products.
The results of the arid station are presented in Figure 9b. The errors vary from 0.1 to 12. Most of the errors are found in APHRODITE. Highest errors in APHRODITE can be seen in the month of July which is relatively high as compared to other products. The lowest errors can be seen in the GPCC where errors range from 0.1 to 2. The highest errors in GPCC were obtained in the month of March. The CRU and UDel have similar types of results and were found less than APHRODITE.
The results in the hyper-arid station in (Figure 9c), It can be noted that the errors of GPCC are less than 2 mm. Highest errors in GPCC can be seen in the month of March while the lowest can be seen in the months of July to December. The comparison of MAE at this station showed that CRU has highest followed by UDel and APHRODITE.
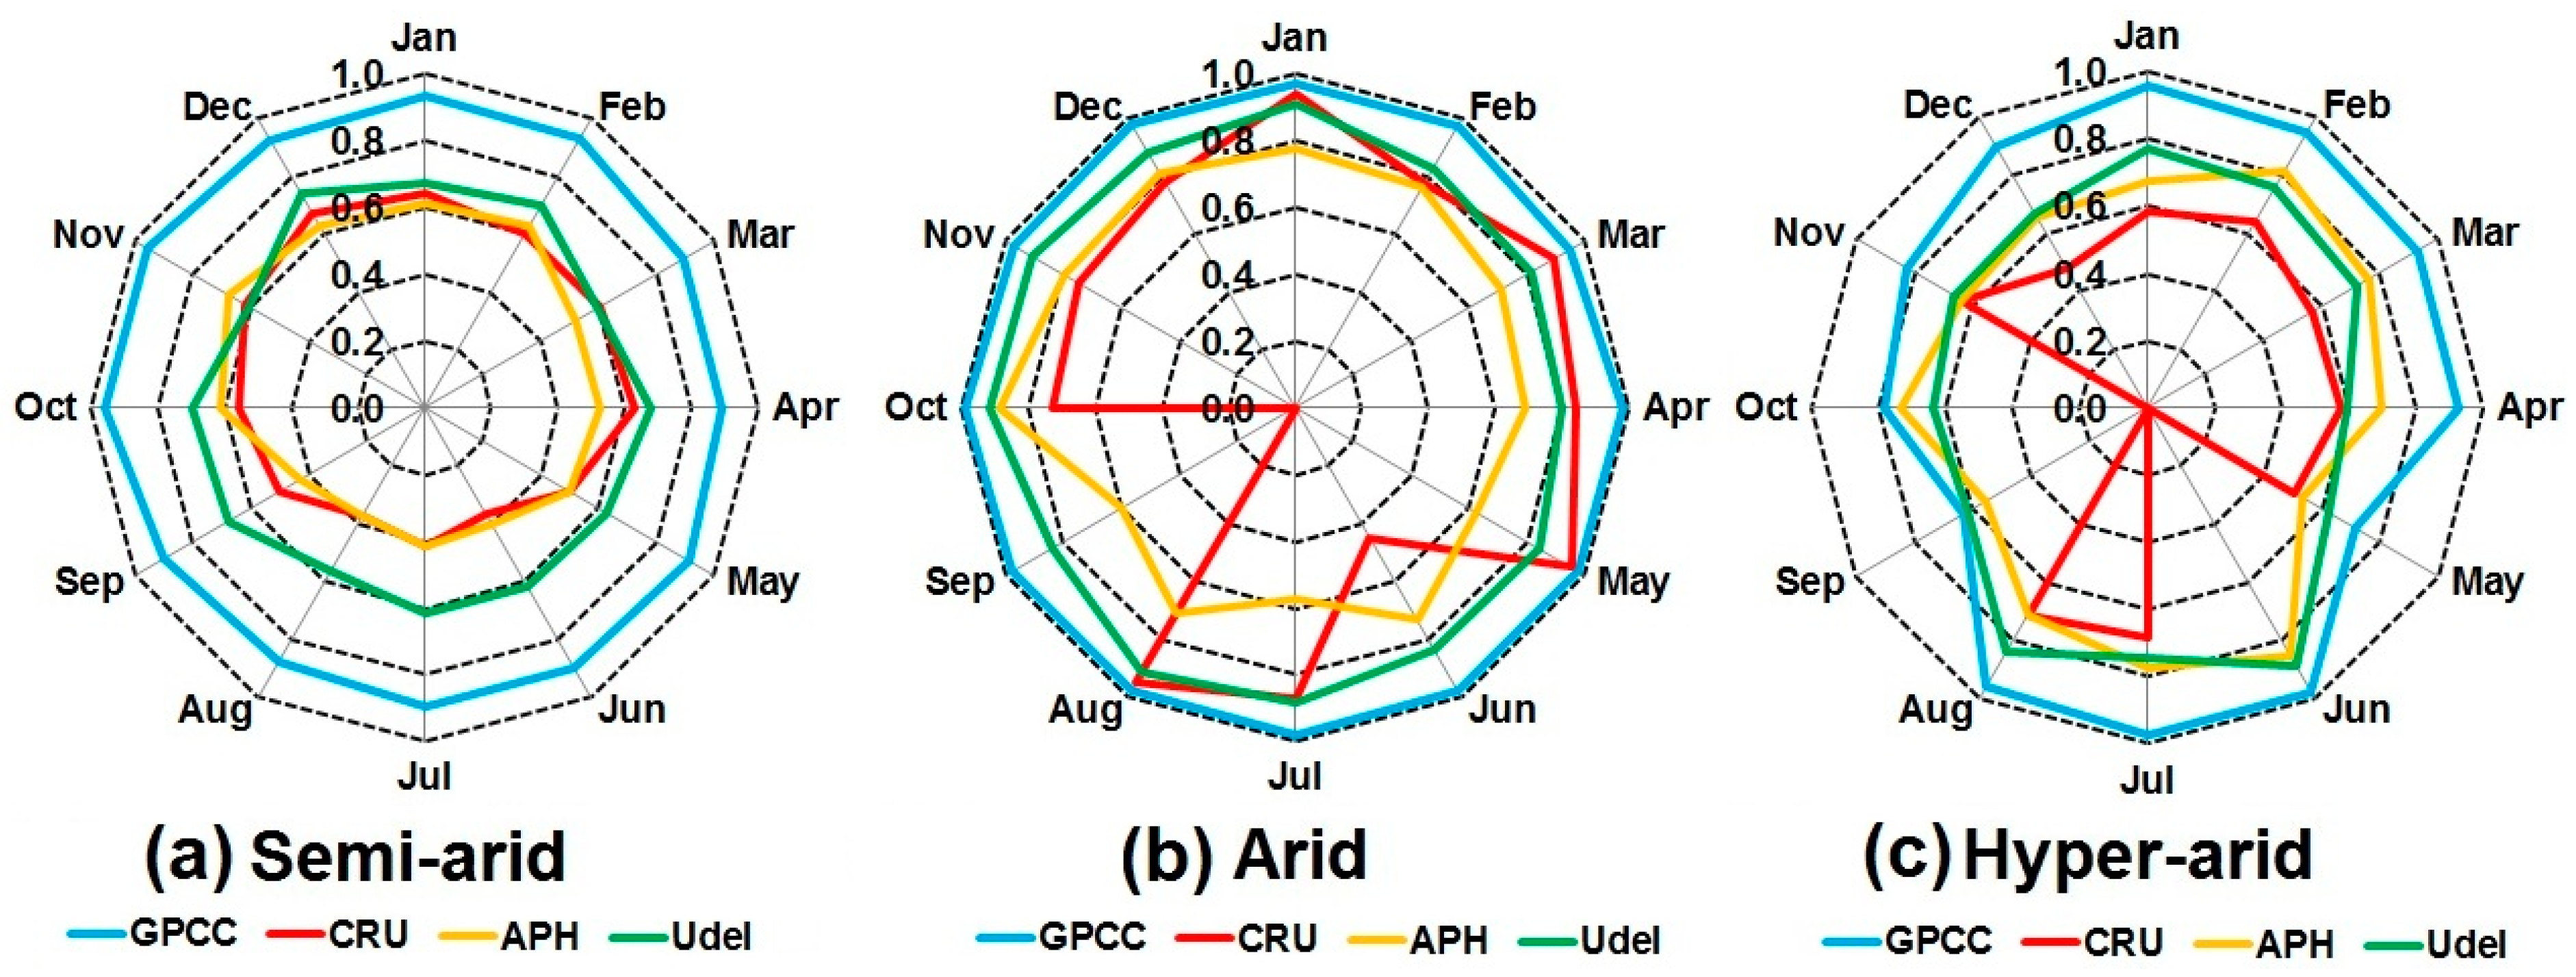
4.5. Modified Index of Agreement
The modified index of agreement between gauge-based gridded data with observed data is shown in Figure 10. The figure displays the clear superiority of GPCC datasets over others. It can be seen that in the semi-arid station (Figure 10a) highest index of the agreement is obtained between GPCC and observed datasets for all the months that range from 0.80 to 1.0. It can also be seen that CRU and APHRODITE have similar kind of agreements with observed data. Most of the months have very close values with each other; however, it is apparent that there is a slight difference in the months of March, April, and September. On the hand, UDel was found to have a better agreement as compared to APHRODITE and CRU. It can be observed that almost all the months of UDel have agreement values above 0.5 while APHRODITE and CRU have agreement values above 0.30.
The results of the arid station are shown in Figure 10b. The higher index of GPCC can be visualized on the figure. It can be seen from the figure that GPCC have agreement above 0.90 in all the months. A better performance of other products can also be seen. CRU has the good agreement of above 0.70 with observed data in most of the months except June and September where the agreement of 0.45 and 0.0 is obtained. In the APHRODITE dataset, most of the months have the agreement of less than 0.70 that is quite low as compared to other datasets. It can also be noted that UDel has very close values with one in some of the months that indicate the superiority of UDel over APHRODITE and CRU.
Figure 10c also clearly indicates the distinct superiority of GPCC over other datasets in the hyper-arid station. It can be seen that most of the months have good agreement with observed data that falls in the range of 0.80 to 1.0 except the month of May, September and October have values less than 0.80. It can be found in the figure that CRU has zero agreement in the months of May, and September. In addition to this, other months also showed very minimal agreement, where most of the months have values less than 0.60. APHRODITE and UDel showed better agreement as compared to CRU, as most of the month of APHRODITE showed values higher than 0.60 and UDel gave higher values in all months.
4.6. Test of Similarity in Data Distribution
The results of the similarity test using the Anderson–Darling test are shown in Table 2. Rejection level of 0.05 was used to verify the null hypothesis of similar distribution in observed and gauge-based gridded precipitation data. It was observed that distributions of GPCC and UDel precipitation were similar to observed distributions in nine months in the semi-arid station. In arid and hyper-arid stations, GPCC was also found to replicate similar to observed distributions in more than seven months. Therefore, the GPCC can be considered as the most reliable precipitation data in term of data distribution.
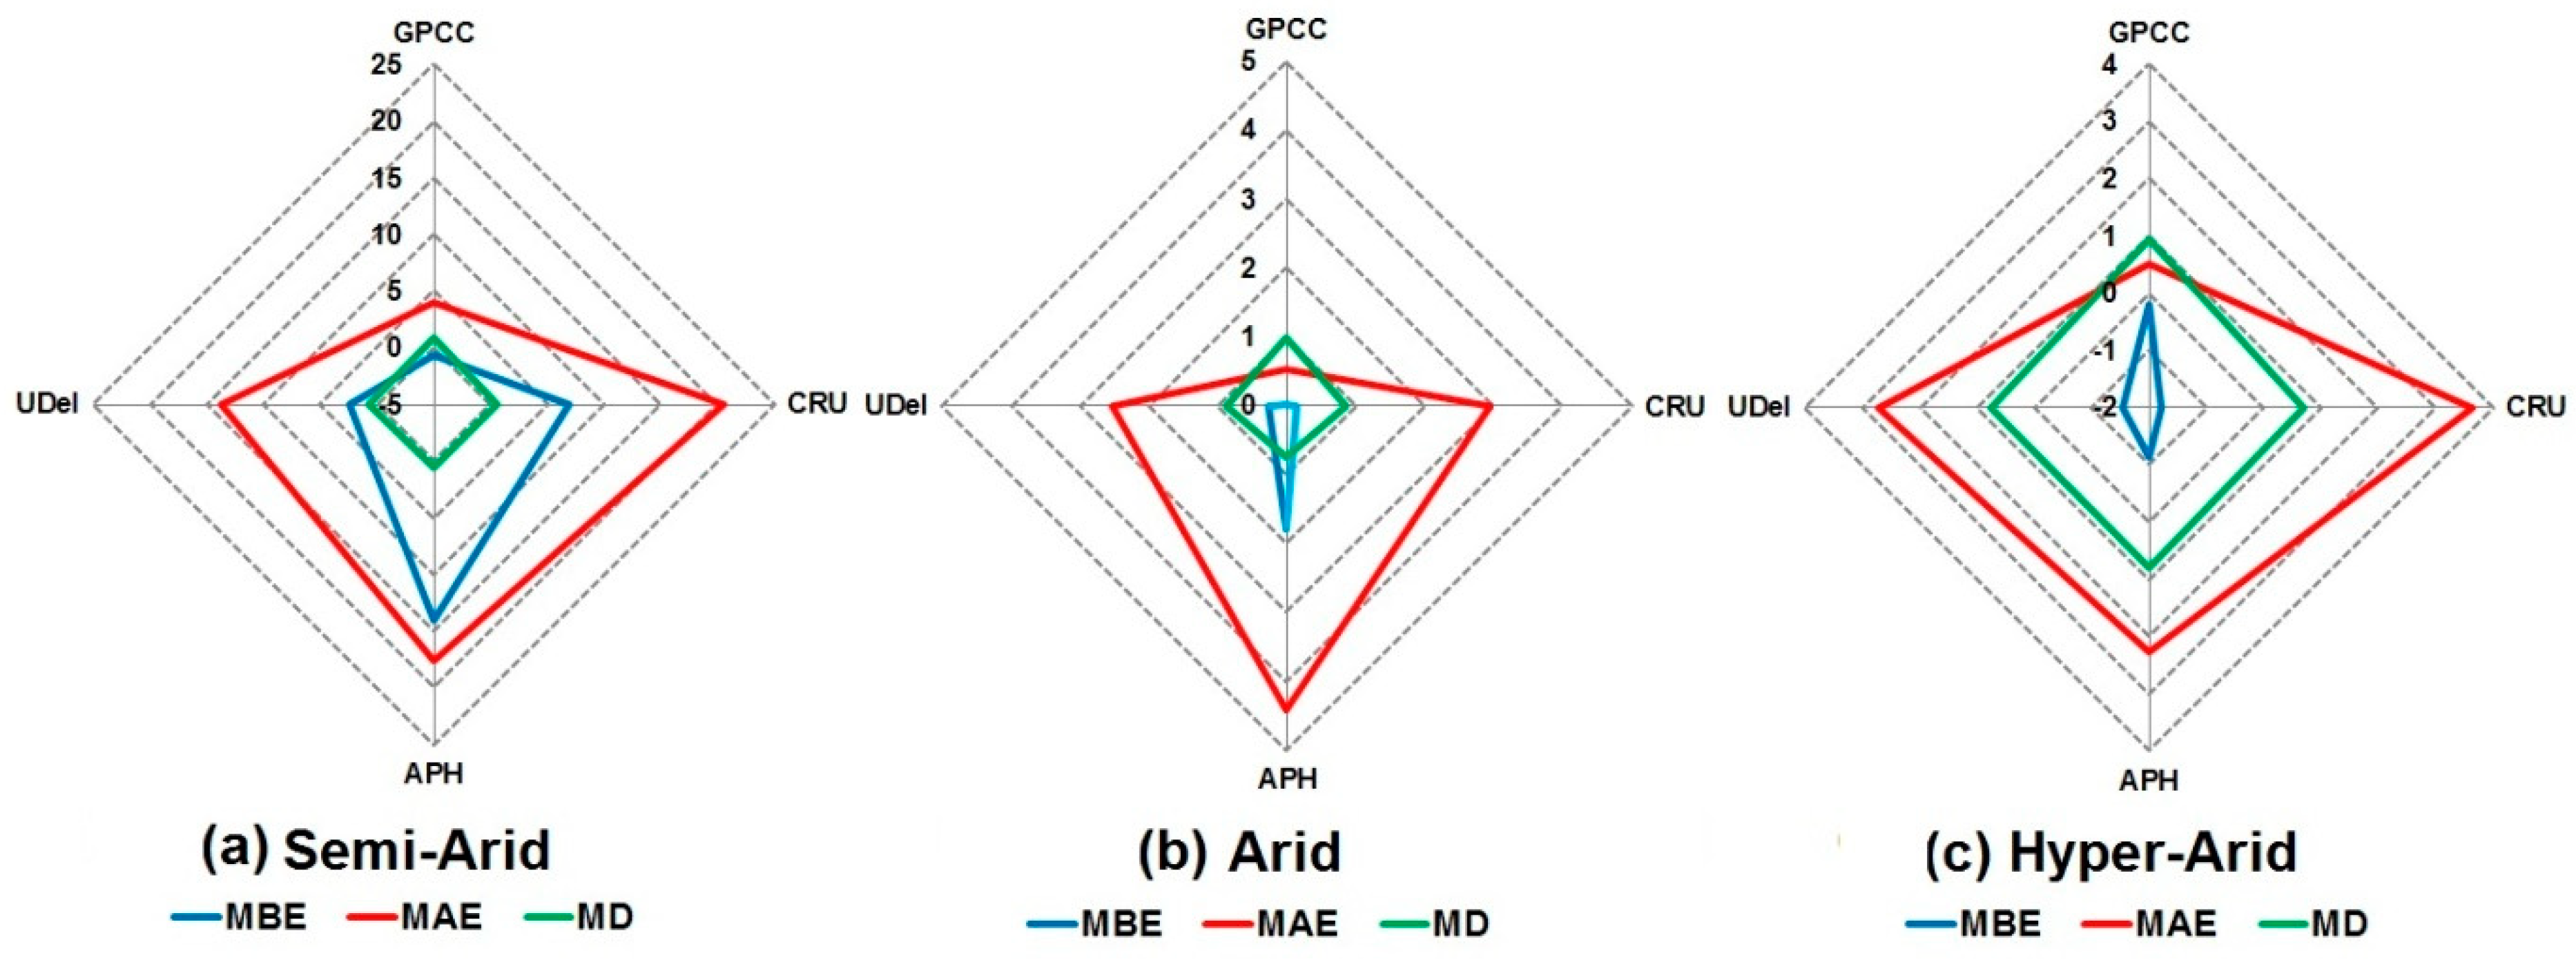
4.7. Multivariate Analysis
Multivariate diagrams were prepared to have concise information on the statistical summary of different gauge-based gridded data products. The diagrams for semi-arid, arid, and hyper-arid stations are shown in Figure 11. Different colors are used to represent different statistical parameters such as blue represents mean bias error, red indicates mean absolute error while green is used to identify the modified index of agreement. It can be seen from the figure that in the case of GPCC, mean bias error (blue) and mean absolute errors are closed to zero, modified index of agreement (green) was found close to one at all stations. This clearly indicates the overall superiority of GPCC over other datasets. Overall, it is clear from the figure that GPCC is superior followed by UDel and APHRODITE. However, CRU was found poor in most of the statistics and stations.
5. Discussions
The comparison of the results obtained using various statistical tests showed the differences in performance of different gauge-based gridded precipitation data at different climatic zones. There is a number of factors that contribute to the better performance of gridded datasets, e.g., temporal domain, sources of data, the method of interpolation, etc. In addition to that, number, distribution, quality of stations, and topography of the area affect the capability of data products [72,73]. In the present study, GPCC data was found better compared to CRU, APHRODITE, and UDel in terms of all statistical tests conducted. Similar results are also reported by Duethmann et al. [74] in comparing a number of gauge-based gridded precipitation products using conventional statistical methods.
One of the major causes of better accuracy of GPCC data is the used of relatively more number of observed stations in the construction of this gauge-based gridded precipitation data. Schneider et al. [24] reported that GPCC databases collect monthly precipitation data from more than 85000 stations around the world. The CRU was developed from more than 4000 weather stations distributed around the world [21]. On the other hand, the number of the valid station used for the constructing APHRODITE gauge-based gridded precipitation data is between 5000 and 12,000 [13], and for UDel between 4100 and 22,000 [23]. Therefore, we also assessed station numbers considered for the generation of gridded data over Balochistan by GPCC, CRU, and UDel. The number of the station used by APHRODITE was not available. It was observed that these data products have used the different number of gauged stations in different months and in different years. It is difficult to provide the number of station per month in all years under consideration. Thus, the number of stations in first, middle, and last year of data series are shown in Table 3. It can be seen that a number of the station are higher in GPCC followed by UDel and CRU. It is observed that numbers of stations used by GPCC are about double of CRU.
The quality of raw data used for the construction of gauge-based gridded precipitation product is also very crucial. In many cases, the quality of long-term precipitation data is not good enough. Often, the data are found inhomogeneous, particularly for the stations located in developing countries. Therefore, each observed time series is generally included into gauge-based gridded precipitation database after checking its quality. However, the quality control processes are different for different gauge-based gridded precipitation products. For GPCC, the data has to pass through with successive automatic and visual checks. Since outliers and extreme values are common and cannot be discarded in the analysis, additional checks are also performed to verify the unusual data [24]. The rigorous quality control system has made the GPCC product more attractive and reliable. In CRU, all the data are passed through a two-stage extensive manual and semi-automatic quality control measures. In the first stage, the data is checked for the consistency and in the second stage, the stations or months are removed which gives a large error during the interpolation process [21,75]. In APHRODITE, brief screening based on the geographic location of the station is done, and the data found outside the national boundary are rejected for the further process [13]. On the other hand, the quality control of UDel was not well documented. Different procedures used for quality control have an effect on the quality of gauge-based gridded precipitation product. The reliability of GPCC products may be due to the most robust procedures used in data quality control.
Another major factor which contributes to the reliability of gauge-based gridded precipitation data is the method used for interpolation of data over grid points. The spatial interpolation methods that consider the orography is often advantageous over other methods in predicting precipitation in mountainous terrain [76]. The high variability in topography influences the precipitation pattern over the short distance. Therefore, most of the gauge-based gridded precipitation data are unable to capture accurate precipitation over rough and mountainous areas. However, GPCC uses SPHEREMAP, which is found to be robust as it considers elevation during interpolation, and consequently, the ability to enhance estimation accuracies [71]. Schneider et al. [24] claimed that GPCC data has the ability to better reproduce precipitation amount and patterns over rough terrains.
The APHRODITE dataset was constructed for the Asian countries. The current datasets are also available for Russia, Middle East, and Monsoon Asia. The monsoon rain enters Balochistan from the eastern side, and therefore, some parts of the study area receive more precipitation during monsoon. The comparison of observed annual precipitation and APHRODITE precipitation showed a wide difference. The observed mean annual precipitation in the semi-arid station of Balochistan is 387 mm, while APHRODITE produced a precipitation of 221 mm. The comparison of monthly precipitation also showed that the APHRODITE has underestimated precipitation during the months of monsoon. The area receives maximum precipitation of 97 mm in the month of July, but the APHRODITE estimated the precipitation only 57 mm. Similar, underestimated results were found in other months and stations. The obtained results also agree with the results of Ali et al. [77], who reported the underestimation of APHRODITE in humid and sub-humid parts of Pakistan. The underestimation of APHRODITE was also reported by other authors [44,74]. It is expected that the APHRODITE gauge-based gridded precipitation can give better results during the months of monsoon and at the station where monsoon winds have influence. However, the poor performance of APHRODITE in the study area may be due to the raw data collected from Pakistan. Yatagai, Arakawa, Kamiguchi, Kawamoto, Nodzu, and Hamada [13] reported that APHRODITE represents the missing data by zero that may lead to underestimation of precipitation and other statistical errors.
Several authors such as Pour et al. [78] reported that in general, extreme events frequently occur at the micro scale, therefore, gridded data may not have the capability to capture those phenomena precisely at point level. Schneider et al. [79] argued that extreme events in the gridded data at micro or small scale can only be captured precisely with a greater number of observed stations or dense network of stations over an area. The lack of a dense network of stations is one of the major causes of data scarcity in most of the regions around the world. Therefore, in spite of a number of drawbacks in gridded datasets such as reduction of peak rainfall and increase in wet days, gridded datasets are the only source to conduct hydro-climatic studies in the areas where observed data are not available.
6. Conclusions
The performances of four gauge-based gridded precipitation products, namely, GPCC, CRU, APHRODITE, and UDel, which are widely used as an alternative to observed precipitation, were evaluated in this paper. The performance of data was assessed by comparing time series graphs, residuals and scatter plots to understand the magnitudes, signs, and nature of the errors, as well as their temporal variability. Further mean bias error, mean absolute error, and modified index of agreement was used to assess the performance. Anderson–Darling test was also conducted for data distribution to compare the gauge-based gridded precipitation products in three different climatic stations, namely, semi-arid, arid, and hyper-arid. The results revealed a clear superiority of GPCC monthly precipitation product over other gauge-based gridded precipitation data products in the region. MBE and MAE values indicate the consistency of GPCC product in giving lowest errors in most of the months of a year at all the stations. Modified index of the agreement indicates a good association between observed and GPCC precipitation in all the months. In addition to this, GPCC datasets also replicated observed precipitation data distribution in all climatic stations. The results obtained through the present study can be further verified in other regions having different climate and topographic setup. It is expected that different statistical methods used in the present study can be used in other parts of the world to select better performing data products.
Author Contributions
K.A., S.S., and X.W. designed the research and wrote the manuscript. N.N. and N.K. critically reviewed the paper.
Funding
This research was funded by Young Top-Notch Talent Support Program of National High-level Talents Special Support Plan and the Post-Doctoral Fellowship Scheme of Universiti Teknologi Malaysia (PDRU) via grant (no. Q.J130000.21A2.04E10).
Acknowledgments
We are grateful to the developers of GPCC, CRU, APHRODITE, and UDel for providing gridded precipitation datasets.
Conflicts of Interest
The authors declare no conflict of interest.
References
- Trenberth, K.E. Changes in precipitation with climate change. Clim. Res. 2011, 47, 123–138. [Google Scholar] [CrossRef] [Green Version]
- Mekis, E.; Donaldson, N.; Reid, J.; Zucconi, A.; Hoover, J.; Li, Q.; Nitu, R.; Melo, S. An Overview of Surface-Based Precipitation Observations at Environment and Climate Change Canada. Atmos. Ocean. 2018, 56, 1–25. [Google Scholar] [CrossRef]
- You, Q.; Min, J.; Zhang, W.; Pepin, N.; Kang, S. Comparison of multiple datasets with gridded precipitation observations over the Tibetan Plateau. Clim. Dyn. 2014, 45, 1–16. [Google Scholar] [CrossRef]
- Luo, M.; Feng, J.; Xu, Z.; Wang, Y.; Dan, L. Evaluating the performance of five twentieth-century reanalysis datasets in reproducing the severe drought in northern China during the 1920s–1930s. Theor. Appl. Climatol. 2018, 1–13. [Google Scholar] [CrossRef]
- Feng, S.; Hu, Q.; Qian, W. Quality control of daily meteorological data in China, 1951–2000: A new dataset. Int. J. Climatol. 2004, 24, 853–870. [Google Scholar] [CrossRef]
- Asfaw, A.; Simane, B.; Hassen, A.; Bantider, A. Variability and time series trend analysis of rainfall and temperature in northcentral Ethiopia: A case study in Woleka sub-basin. Weather Clim. Extrem. 2018, 19, 29–41. [Google Scholar] [CrossRef]
- Ahmed, K.; Shahid, S.; Ali, R.O.; Harun, S.B.; Wang, X.-J. Evaluation of the performance of gridded precipitation products over Balochistan Province, Pakistan. Desalination 2017, 79, 73–86. [Google Scholar] [CrossRef]
- Yang, Y.; Wang, G.; Wang, L.; Yu, J.; Xu, Z. Evaluation of Gridded Precipitation Data for Driving SWAT Model in Area Upstream of Three Gorges Reservoir. PLoS ONE 2014, 9, e112725. [Google Scholar] [CrossRef] [PubMed]
- Khan, N.; Shahid, S.; Ismail, T.; Ahmed, K.; Nawaz, N. Trends in heat wave related indices in Pakistan. Stoch. Environ. Res. Risk Assess. 2018, 1–16. [Google Scholar] [CrossRef]
- Sun, Q.; Miao, C.; Duan, Q.; Ashouri, H.; Sorooshian, S.; Hsu, K.L. A review of global precipitation data sets: Data sources, estimation, and intercomparisons. Rev. Geophys. 2018, 56, 79–107. [Google Scholar] [CrossRef]
- Ahmed, K.; Shahid, S.; Nawaz, N.; Khan, N. Modeling climate change impacts on precipitation in arid regions of Pakistan: A non-local model output statistics downscaling approach. Theor. Appl. Climatol. 2018, 1–18. [Google Scholar] [CrossRef]
- Haylock, M.; Hofstra, N.; Klein Tank, A.; Klok, E.; Jones, P.; New, M. A European daily high-resolution gridded data set of surface temperature and precipitation for 1950–2006. J. Geophys. Res. Atmos. 2008, 113. [Google Scholar] [CrossRef]
- Yatagai, A.; Arakawa, O.; Kamiguchi, K.; Kawamoto, H.; Nodzu, M.I.; Hamada, A. A 44-year daily gridded precipitation dataset for Asia based on a dense network of rain gauges. Sola 2009, 5, 137–140. [Google Scholar] [CrossRef]
- Maurer, E.P.; Wood, A.; Adam, J.; Lettenmaier, D.P.; Nijssen, B. A long-term hydrologically based dataset of land surface fluxes and states for the conterminous United States. J. Clim. 2002, 15, 3237–3251. [Google Scholar] [CrossRef]
- Liebmann, B.; Allured, D. Daily precipitation grids for South America. Bull. Am. Meteorol. Soc. 2005, 86, 1567–1570. [Google Scholar] [CrossRef]
- Herrera, S.; Gutiérrez, J.M.; Ancell, R.; Pons, M.R.; Frías, M.D.; Fernández, J. Development and analysis of a 50-year high-resolution daily gridded precipitation dataset over Spain (Spain02). Int. J. Climatol. 2012, 32, 74–85. [Google Scholar] [CrossRef]
- Belo-Pereira, M.; Dutra, E.; Viterbo, P. Evaluation of global precipitation data sets over the Iberian Peninsula. J. Geophys. Res. Atmos. 2011, 116. [Google Scholar] [CrossRef]
- Schiemann, R.; Liniger, M.; Frei, C. Reduced space optimal interpolation of daily rain gauge precipitation in Switzerland. J. Geophys. Res. Atmos. 2010, 115. [Google Scholar] [CrossRef]
- Vose, R.S.; Schmoyer, R.L.; Steurer, P.M.; Peterson, T.C.; Heim, R.; Karl, T.R.; Eischeid, J. The Global Historical Climatology Network: Long-Term Monthly Temperature, Precipitation, Sea Level Pressure, and Station Pressure Data; Oak Ridge National Laboratory: Oak Ridge, TN, USA, 1992; Volume 3912. [Google Scholar]
- Chen, M.; Xie, P.; Janowiak, J.E.; Arkin, P.A. Global Land Precipitation: A 50-yr Monthly Analysis Based on Gauge Observations. J. Hydrometeorol. 2002, 3, 249–266. [Google Scholar] [CrossRef]
- Harris, I.; Jones, P.D.; Osborn, T.J.; Lister, D.H. Updated high-resolution grids of monthly climatic observations—The CRU TS3.10 Dataset. Int. J. Climatol. 2014, 34, 623–642. [Google Scholar] [CrossRef]
- Hijmans, R.J.; Cameron, S.E.; Parra, J.L.; Jones, P.G.; Jarvis, A. Very high resolution interpolated climate surfaces for global land areas. Int. J. Climatol. 2005, 25, 1965–1978. [Google Scholar] [CrossRef] [Green Version]
- Matsuura, K.; Willmott, C. Terrestrial Precipitation: 1900–2010 Gridded Monthly Time Series (1900–2010)(v 3.01 added 6/14/12). University of Delaware. 2012. Available online: http://climate.geog.udel.edu/~climate/html_pages/download.html (accessed on 15 April 2018).
- Schneider, U.; Becker, A.; Finger, P.; Meyer-Christoffer, A.; Ziese, M.; Rudolf, B. GPCC’s new land surface precipitation climatology based on quality-controlled in situ data and its role in quantifying the global water cycle. Theor. Appl. Climatol. 2014, 115, 15–40. [Google Scholar] [CrossRef]
- Eum, H.-I.; Dibike, Y.; Prowse, T.; Bonsal, B. Inter-comparison of high-resolution gridded climate data sets and their implication on hydrological model simulation over the Athabasca Watershed, Canada. Hydrol. Process. 2014, 28, 4250–4271. [Google Scholar] [CrossRef]
- Dee, D.; Balmaseda, M.; Balsamo, G.; Engelen, R.; Simmons, A.; Thépaut, J.-N. Toward a consistent reanalysis of the climate system. Bull. Am. Meteorol. Soc. 2014, 95, 1235–1248. [Google Scholar] [CrossRef]
- Zhang, L.; Zhou, T. An assessment of monsoon precipitation changes during 1901–2001. Clim. Dyn. 2011, 37, 279–296. [Google Scholar] [CrossRef] [Green Version]
- Hunziker, S.; Gubler, S.; Calle, J.; Moreno, I.; Andrade, M.; Velarde, F.; Ticona, L.; Carrasco, G.; Castellón, Y.; Oria, C. Identifying, attributing, and overcoming common data quality issues of manned station observations. Int. J. Climatol. 2017, 37, 4131–4145. [Google Scholar] [CrossRef]
- Khairul, I.M.; Rasmy, M.; Koike, T.; Takeuchi, K. Inter-Comparison of Gauge-Corrected Global Satellite Rainfall Estimates and Their Applicability for Effective Water Resource Management in a Transboundary River Basin: The Case of the Meghna River Basin. Remote Sens. 2018, 10, 828. [Google Scholar] [CrossRef]
- Dinku, T.; Connor, S.J.; Ceccato, P.; Ropelewski, C.F. Comparison of global gridded precipitation products over a mountainous region of Africa. Int. J. Climatol. 2008, 28, 1627–1638. [Google Scholar] [CrossRef] [Green Version]
- Naumann, G.; Dutra, E.; Barbosa, P.; Pappenberger, F.; Wetterhall, F.; Vogt, J.V. Comparison of drought indicators derived from multiple data sets over Africa. Hydrol. Earth Syst. Sci. 2014, 18, 1625–1640. [Google Scholar] [CrossRef] [Green Version]
- Willmott, C.J.; Matsuura, K. Advantages of the mean absolute error (MAE) over the root mean square error (RMSE) in assessing average model performance. Clim. Res. 2005, 30, 79–82. [Google Scholar] [CrossRef] [Green Version]
- Willmott, C.J.; Matsuura, K. On the use of dimensioned measures of error to evaluate the performance of spatial interpolators. Int. J. Geogr. Inf. Sci. 2006, 20, 89–102. [Google Scholar] [CrossRef]
- Willmott, C.J. On the validation of models. Phys. Geogr. 1981, 2, 184–194. [Google Scholar] [CrossRef]
- Teegavarapu, R.S. Floods in a Changing Climate: Extreme Precipitation; Cambridge University Press: Cambridge, UK, 2012. [Google Scholar]
- Cortesi, N.; Trigo, R.M.; Gonzalez-Hidalgo, J.C.; Ramos, A.M. Modelling monthly precipitation with circulation weather types for a dense network of stations over Iberia. Hydrol. Earth Syst. Sci. 2013, 17, 665–678. [Google Scholar] [CrossRef] [Green Version]
- Legates, D.R.; McCabe, G.J., Jr. Evaluating the use of” goodness-of-fit” measures in hydrologic and hydroclimatic model validation. Water Resour. Res. 1999, 35, 233–241. [Google Scholar] [CrossRef]
- Willmott, C.J.; Robeson, S.M.; Matsuura, K. A refined index of model performance. Int. J. Climatol. 2012, 32, 2088–2094. [Google Scholar] [CrossRef]
- Wang, Y.; He, B.; Takase, K. Effects of temporal resolution on hydrological model parameters and its impact on prediction of river discharge. Hydrol. Sci. J. 2009, 54, 886–898. [Google Scholar] [CrossRef]
- Jeniffer, K.; Su, Z.; Woldai, T.; Maathuis, B. Estimation of spatial–temporal rainfall distribution using remote sensing techniques: A case study of Makanya catchment, Tanzania. Int. J. Appl. Earth Obs. Geoinf. 2010, 12 (Suppl. 1), S90–S99. [Google Scholar] [CrossRef]
- Khan, N.; Shahid, S.; Ismail, T.B.; Wang, X.-J. Spatial distribution of unidirectional trends in temperature and temperature extremes in Pakistan. Theor. Appl. Climatol. 2018, 1–5. [Google Scholar] [CrossRef]
- Noor, M.; Ismail, T.; Chung, E.-S.; Shahid, S.; Sung, J. Uncertainty in Rainfall Intensity Duration Frequency Curves of Peninsular Malaysia under Changing Climate Scenarios. Water 2018, 10, 1750. [Google Scholar] [CrossRef]
- Becker, A.; Finger, P.; Meyer-Christoffer, A.; Rudolf, B.; Schamm, K.; Schneider, U.; Ziese, M. A description of the global land-surface precipitation data products of the Global Precipitation Climatology Centre with sample applications including centennial (trend) analysis from 1901–present. Earth Syst. Sci. Data 2013, 5, 71–99. [Google Scholar] [CrossRef] [Green Version]
- Nair, S.; Srinivasan, G.; Nemani, R. Evaluation of Multi-Satellite TRMM Derived Rainfall Estimates over a Western State of India. J. Meteorol. Soc. Jpn. 2009, 87, 927–939. [Google Scholar] [CrossRef] [Green Version]
- Shen, Y.; Xiong, A.; Wang, Y.; Xie, P. Performance of high-resolution satellite precipitation products over China. J. Geophys. Res. Atmos. 2010, 115. [Google Scholar] [CrossRef]
- Ayehu, G.T.; Tadesse, T.; Gessesse, B.; Dinku, T. Validation of new satellite rainfall products over the Upper Blue Nile Basin, Ethiopia. Atmos. Meas. Tech. 2018, 11, 1921–1936. [Google Scholar] [CrossRef] [Green Version]
- Hu, Q.; Yang, D.; Li, Z.; Mishra, A.K.; Wang, Y.; Yang, H. Multi-scale evaluation of six high-resolution satellite monthly rainfall estimates over a humid region in China with dense rain gauges. Int. J. Remote Sens. 2014, 35, 1272–1294. [Google Scholar] [CrossRef]
- Ashraf, M.; Routray, J.K. Spatio-temporal characteristics of precipitation and drought in Balochistan Province, Pakistan. Nat. Hazards 2015, 77, 229–254. [Google Scholar] [CrossRef]
- Ahmed, K.; Shahid, S.; Harun, S.B.; Wang, X.-J. Characterization of seasonal droughts in Balochistan Province, Pakistan. Stoch. Environ. Res. Risk Assess. 2015, 30, 747–762. [Google Scholar] [CrossRef]
- Ahmed, K.; Shahid, S.; Nawaz, N. Impacts of climate variability and change on seasonal drought characteristics of Pakistan. Atmos. Res. 2018, 214, 364–374. [Google Scholar] [CrossRef]
- Adnan, S.; Ullah, K.; Shuanglin, L.; Gao, S.; Khan, A.H.; Mahmood, R. Comparison of various drought indices to monitor drought status in Pakistan. Clim. Dyn. 2017, 51, 1–15. [Google Scholar] [CrossRef]
- Von Storch, H.; Navarra, A. Analysis of Climate Variability: Applications of Statistical Techniques; Springer Science & Business Media: Berlin/Heidelberg, Germany, 1999. [Google Scholar]
- Ahmed, K.; Shahid, S.; Ismail, T.; Nawaz, N.; Wang, X.-J. Absolute homogeneity assessment of precipitation time series in an arid region of Pakistan. Atmosfera 2018, 31, 301–316. [Google Scholar] [CrossRef]
- Alexandersson, H. A homogeneity test applied to precipitation data. J. Climatol. 1986, 6, 661–675. [Google Scholar] [CrossRef]
- Buishand, T.A. Some methods for testing the homogeneity of rainfall records. J. Hydrol. 1982, 58, 11–27. [Google Scholar] [CrossRef]
- Pettitt, A.N. A Non-Parametric Approach to the Change-Point Problem. J. R. Stat. Soc. Ser. C Appl. Stat. 1979, 28, 126–135. [Google Scholar] [CrossRef]
- Von Neumann, J. Distribution of the ratio of the mean square successive difference to the variance. Ann. Math. Stat. 1941, 12, 367–395. [Google Scholar] [CrossRef]
- Allen, S.C.; Greenslade, D.J. Indices for the objective assessment of tsunami forecast models. Pure Appl. Geophys. 2013, 170, 1601–1620. [Google Scholar] [CrossRef]
- Willmott, C.J. On the evaluation of model performance in physical geography. In Spatial Statistics and Models; Springer Netherland: Heidelberg, Germany, 1984; pp. 443–460. [Google Scholar]
- Lovino, M.; García, N.O.; Baethgen, W. Spatiotemporal analysis of extreme precipitation events in the Northeast region of Argentina (NEA). J. Hydrol. Reg. Stud. 2014, 2, 140–158. [Google Scholar] [CrossRef] [Green Version]
- Gervais, M.; Tremblay, L.B.; Gyakum, J.R.; Atallah, E. Representing extremes in a daily gridded precipitation analysis over the United States: Impacts of station density, resolution, and gridding methods. J. Clim. 2014, 27, 5201–5218. [Google Scholar] [CrossRef]
- Yin, H.; Donat, M.G.; Alexander, L.V.; Sun, Y. Multi-dataset comparison of gridded observed temperature and precipitation extremes over China. Int. J. Climatol. 2015, 35, 2809–2827. [Google Scholar] [CrossRef]
- Hu, Z.; Hu, Q.; Zhang, C.; Chen, X.; Li, Q. Evaluation of reanalysis, spatially interpolated and satellite remotely sensed precipitation data sets in central Asia. J. Geophys. Res. Atmos. 2016, 121, 5648–5663. [Google Scholar] [CrossRef]
- Prakash, S.; Gairola, R.M.; Mitra, A.K. Comparison of large-scale global land precipitation from multisatellite and reanalysis products with gauge-based GPCC data sets. Theor. Appl. Climatol. 2015, 121, 303–317. [Google Scholar] [CrossRef]
- Bushair, M.; Prakash, S.; Patel, S.; Gairola, R. Assessment of Kalpana-1 Rainfall Product over Indian Meteorological Sub-Divisions During the Summer Monsoon Season. J. Indian Soc. Remote Sens. 2016, 44, 67–76. [Google Scholar] [CrossRef]
- Kursinski, A.L.; Zeng, X. Areal estimation of intensity and frequency of summertime precipitation over a midlatitude region. Geophys. Res. Lett. 2006, 33. [Google Scholar] [CrossRef]
- Nkiaka, E.; Nawaz, N.; Lovett, J. Evaluating global reanalysis precipitation datasets with rain gauge measurements in the Sudano-Sahel region: Case study of the Logone catchment, Lake Chad Basin. Meteorol. Appl. 2017, 24, 9–18. [Google Scholar] [CrossRef]
- Robeson, S.M.; Ensor, L.A. Daily Precipitation Grids for South America. Bull. Am. Meteorol. Soc. 2006, 87, 1095–1096. [Google Scholar]
- Worqlul, A.W.; Maathuis, B.; Adem, A.A.; Demissie, S.S.; Langan, S.; Steenhuis, T.S. Comparison of rainfall estimations by TRMM 3B42, MPEG and CFSR with ground-observed data for the Lake Tana basin in Ethiopia. Hydrol. Earth Syst. Sci. 2014, 18, 4871–4881. [Google Scholar] [CrossRef] [Green Version]
- Hu, Z.; Zhang, C.; Hu, Q.; Tian, H. Temperature changes in Central Asia from 1979 to 2011 based on multiple datasets. J. Clim. 2014, 27, 1143–1167. [Google Scholar] [CrossRef]
- Salman, S.A.; Shahid, S.; Ismail, T.; Al-Abadi, A.M.; Wang, X.-J.; Chung, E.-S. Selection of gridded precipitation data for Iraq using compromise programming. Measurement 2018, 132, 87–98. [Google Scholar] [CrossRef]
- Fu, Y.; Xia, J.; Yuan, W.; Xu, B.; Wu, X.; Chen, Y.; Zhang, H. Assessment of multiple precipitation products over major river basins of China. Theor. Appl. Climatol. 2014, 1–12. [Google Scholar] [CrossRef]
- Sun, Q.; Miao, C.; Duan, Q.; Kong, D.; Ye, A.; Di, Z.; Gong, W. Would the ‘real’observed dataset stand up? A critical examination of eight observed gridded climate datasets for China. Environ. Res. Lett. 2014, 9, 015001. [Google Scholar] [CrossRef]
- Duethmann, D.; Zimmer, J.; Gafurov, A.; Güntner, A.; Kriegel, D.; Merz, B.; Vorogushyn, S. Evaluation of areal precipitation estimates based on downscaled reanalysis and station data by hydrological modelling. Hydrol. Earth Syst. Sci. 2013, 17, 2415–2434. [Google Scholar] [CrossRef] [Green Version]
- New, M.; Lister, D.; Hulme, M.; Makin, I. A high-resolution data set of surface climate over global land areas. Clim. Res. 2002, 21, 1–25. [Google Scholar] [CrossRef] [Green Version]
- Tobin, C.; Nicotina, L.; Parlange, M.B.; Berne, A.; Rinaldo, A. Improved interpolation of meteorological forcings for hydrologic applications in a Swiss Alpine region. J. Hydrol. 2011, 401, 77–89. [Google Scholar] [CrossRef]
- Ali, G.; Rasul, G.; Mahmood, T.; Zaman, Q.; Cheema, S. Validation of APHRODITE precipitation data for humid and sub humid regions of Pakistan. Pak. J. Meteorol. 2012, 9, 57–69. [Google Scholar]
- Pour, S.H.; Harun, S.B.; Shahid, S. Genetic programming for the downscaling of extreme rainfall events on the East Coast of Peninsular Malaysia. Atmosphere 2014, 5, 914–936. [Google Scholar] [CrossRef]
- Schneider, U.; Finger, P.; Meyer-Christoffer, A.; Rustemeier, E.; Ziese, M.; Becker, A. Evaluating the hydrological cycle over land using the newly-corrected precipitation climatology from the Global Precipitation Climatology Centre (GPCC). Atmosphere 2017, 8, 52. [Google Scholar] [CrossRef]
Figure 1.
(a) The Balochistan Province in the map of Pakistan. (b) The location of rain gauges in different climatic zones of Balochistan.
Figure 1.
(a) The Balochistan Province in the map of Pakistan. (b) The location of rain gauges in different climatic zones of Balochistan.

Figure 2.
Monthly distribution of precipitation at semi-arid, arid, and hyper-arid regions.

Figure 3.
Time series of observed with gauge-based gridded precipitation, and residuals at the semi-arid region.
Figure 3.
Time series of observed with gauge-based gridded precipitation, and residuals at the semi-arid region.

Figure 4.
Time series of observed with gauge-based gridded precipitation; and their differences (residuals) at the arid region.
Figure 4.
Time series of observed with gauge-based gridded precipitation; and their differences (residuals) at the arid region.

Figure 5.
Time series of observed with gauge-based gridded precipitation and residuals at the hyper-arid region.
Figure 5.
Time series of observed with gauge-based gridded precipitation and residuals at the hyper-arid region.

Figure 6.
Monthly distribution of observed precipitation and residuals of different datasets at (a) semi-arid, (b) arid, and (c) hyper-arid station.
Figure 6.
Monthly distribution of observed precipitation and residuals of different datasets at (a) semi-arid, (b) arid, and (c) hyper-arid station.

Figure 7.
Scatter plot of observed and gauge-based gridded precipitation at (a) semi-arid, (b) arid, and (c) hyper-arid stations.
Figure 7.
Scatter plot of observed and gauge-based gridded precipitation at (a) semi-arid, (b) arid, and (c) hyper-arid stations.

Figure 8.
Mean bias error for different gauge-based gridded precipitation data products at (a) semi-arid, (b) arid, and (c) hyper-arid stations.
Figure 8.
Mean bias error for different gauge-based gridded precipitation data products at (a) semi-arid, (b) arid, and (c) hyper-arid stations.

Figure 9.
Mean absolute error (MAE) between observed and gauge-based gridded datasets at (a) semi-arid, (b) arid, and (c) hyper-arid station.
Figure 9.
Mean absolute error (MAE) between observed and gauge-based gridded datasets at (a) semi-arid, (b) arid, and (c) hyper-arid station.

Figure 10.
Index of agreement between observed and gauge-based gridded datasets at (a) semi-arid, (b) arid, and (c) hyper-arid station.
Figure 10.
Index of agreement between observed and gauge-based gridded datasets at (a) semi-arid, (b) arid, and (c) hyper-arid station.

Figure 11.
Multivariate diagrams showing a statistical summary of precipitation data at (a) semi-arid (b), arid, and (c) hyper-arid station.
Figure 11.
Multivariate diagrams showing a statistical summary of precipitation data at (a) semi-arid (b), arid, and (c) hyper-arid station.


Table 1.
Mean and standard deviation of annual precipitation, and the percentage of missing data during 1961 to 2007 at different stations
Table 1.
Mean and standard deviation of annual precipitation, and the percentage of missing data during 1961 to 2007 at different stations
| Station | Annual Precipitation (mm) | Standard Deviation | Missing Data (%) |
|---|---|---|---|
| Barkhan | 389.32 | 158.64 | 1.02 |
| Dalbandin | 85.02 | 47.49 | 0.00 |
| Jiwani | 103.82 | 86.05 | 0.21 |
| Kalat | 161.12 | 118.54 | 8.74 |
| Khuzdar | 246.08 | 117.79 | 0.00 |
| Lasbela | 153.60 | 94.49 | 0.00 |
| Nokkundi | 36.10 | 38.36 | 0.61 |
| Ormara | 110.36 | 95.94 | 2.93 |
| Panjgur | 104.93 | 62.82 | 0.00 |
| Pasni | 99.80 | 73.31 | 7.73 |
| Quetta | 253.08 | 143.72 | 0.00 |
| Sibbi | 158.31 | 101.98 | 2.44 |
| Turbat | 98.85 | 87.93 | 2.24 |
| Zhob | 288.15 | 117.14 | 0.00 |
Table 2.
Results of the Anderson–Darling test of data distribution.
| Month | Semi-Arid | Arid | Hyper-Arid | |||||||||
|---|---|---|---|---|---|---|---|---|---|---|---|---|
| GPCC | CRU | APH | UDel | GPCC | CRU | APH | UDel | GPCC | CRU | APH | UDel | |
| Jan. | 0.70 | 0.01 | 0.07 | 0.99 | 0.21 | 0.88 | 0.07 | 0.96 | 0.97 | 0.00 | 0.00 | 0.00 |
| Feb. | 0.72 | 0.06 | 0.11 | 0.28 | 0.76 | 0.77 | 0.17 | 0.03 | 0.70 | 0.00 | 0.00 | 0.00 |
| Mar. | 0.41 | 0.05 | 0.05 | 0.43 | 0.29 | 1.00 | 0.07 | 0.95 | 0.99 | 0.00 | 0.00 | 0.00 |
| Apr. | 0.82 | 0.94 | 0.15 | 0.19 | 0.48 | 0.59 | 0.00 | 0.32 | 0.92 | 0.00 | 0.00 | 0.00 |
| May | 0.52 | 0.94 | 0.05 | 0.12 | 0.00 | 0.98 | 0.00 | 0.00 | 0.00 | 0.00 | 0.00 | 0.00 |
| Jun. | 0.72 | 0.00 | 0.00 | 0.02 | 0.00 | 0.08 | 0.00 | 0.05 | 0.29 | 0.03 | 0.00 | 0.00 |
| Jul. | 0.86 | 0.01 | 0.00 | 0.39 | 0.26 | 0.65 | 0.00 | 0.03 | 0.63 | 0.00 | 0.00 | 0.00 |
| Aug. | 0.85 | 0.00 | 0.00 | 0.19 | 0.70 | 0.00 | 0.00 | 0.00 | 0.73 | 0.00 | 0.00 | 0.00 |
| Sep. | 0.66 | 0.00 | 0.00 | 0.05 | 0.00 | 0.00 | 0.00 | 0.00 | 0.00 | 0.00 | 0.00 | 0.00 |
| Oct. | 0.00 | 0.98 | 0.24 | 0.00 | 0.00 | 0.33 | 0.00 | 0.00 | 0.00 | 0.01 | 0.00 | 0.00 |
| Nov. | 0.00 | 0.86 | 0.77 | 0.17 | 0.00 | 0.21 | 0.00 | 0.00 | 0.15 | 0.00 | 0.00 | 0.00 |
| Dec. | 0.02 | 0.00 | 0.03 | 0.58 | 0.98 | 0.06 | 0.00 | 0.25 | 1.00 | 0.00 | 0.00 | 0.00 |
* Bold number represents p > 0.05.
Table 3.
Number of stations used by different datasets over Balochistan.
| Month | 1961 | 1984 | 2007 | ||||||
|---|---|---|---|---|---|---|---|---|---|
| GPCC | CRU | UDel | GPCC | CRU | UDel | GPCC | CRU | UDel | |
| Jan. | 12 | 6 | 12 | 10 | 5 | 7 | 14 | 5 | 11 |
| Feb. | 12 | 6 | 12 | 10 | 5 | 6 | 14 | 5 | 11 |
| Mar. | 12 | 6 | 12 | 10 | 5 | 3 | 14 | 5 | 11 |
| Apr. | 12 | 5 | 12 | 10 | 5 | 7 | 14 | 5 | 11 |
| May | 12 | 5 | 12 | 9 | 4 | 7 | 14 | 4 | 11 |
| Jun. | 12 | 6 | 12 | 10 | 5 | 6 | 14 | 0 | 11 |
| Jul. | 12 | 6 | 12 | 10 | 5 | 6 | 14 | 5 | 11 |
| Aug. | 12 | 6 | 12 | 10 | 5 | 4 | 14 | 5 | 11 |
| Sep. | 12 | 4 | 12 | 10 | 3 | 7 | 14 | 4 | 11 |
| Oct. | 12 | 5 | 12 | 10 | 5 | 5 | 14 | 5 | 11 |
| Nov. | 12 | 6 | 12 | 10 | 5 | 5 | 14 | 5 | 11 |
| Dec. | 12 | 6 | 12 | 10 | 6 | 7 | 14 | 5 | 11 |
© 2019 by the authors. Licensee MDPI, Basel, Switzerland. This article is an open access article distributed under the terms and conditions of the Creative Commons Attribution (CC BY) license (http://creativecommons.org/licenses/by/4.0/).
Share and Cite
MDPI and ACS Style
Ahmed, K.; Shahid, S.; Wang, X.; Nawaz, N.; Khan, N. Evaluation of Gridded Precipitation Datasets over Arid Regions of Pakistan. Water 2019, 11, 210. https://doi.org/10.3390/w11020210
AMA Style
Ahmed K, Shahid S, Wang X, Nawaz N, Khan N. Evaluation of Gridded Precipitation Datasets over Arid Regions of Pakistan. Water. 2019; 11(2):210. https://doi.org/10.3390/w11020210
Chicago/Turabian StyleAhmed, Kamal, Shamsuddin Shahid, Xiaojun Wang, Nadeem Nawaz, and Najeebullah Khan. 2019. "Evaluation of Gridded Precipitation Datasets over Arid Regions of Pakistan" Water 11, no. 2: 210. https://doi.org/10.3390/w11020210
Note that from the first issue of 2016, this journal uses article numbers instead of page numbers. See further details here.