Exploring Drought Conditions in the Three River Headwaters Region from 2002 to 2011 Using Multiple Drought Indices


1
State Key Laboratory of Hydroscience and Engineering, Tsinghua University, Beijing 100084, China
2
State Key Laboratory of Plateau Ecology and Agriculture, Qinghai University, Xining 810016, China
*
Author to whom correspondence should be addressed.
Water 2019, 11(2), 190; https://doi.org/10.3390/w11020190
Submission received: 21 November 2018
/
Revised: 16 January 2019
/
Accepted: 18 January 2019
/
Published: 23 January 2019
(This article belongs to the Section Hydrology)
Abstract
:The Three River Headwaters Region (TRHR) has great uncertainty on drought conditions under climate change. The aim of this study is to compare the drought conditions detected by multiple drought indices across the TRHR. We applied four single drought indices, i.e., Precipitation Condition Index (PCI), Temperature Condition Index (TCI), Soil Moisture Condition Index (SMCI), and Vegetation Condition Index (VCI), and two combined drought indices, i.e., Combined Meteorological Drought Index (CMDI) and Combined Vegetation drought index (CVDI), to explore the drought conditions across the TRHR. Three in situ drought indices, Standardized Precipitation Index (SPI), Standardized Precipitation Evapotranspiration Index (SPEI) and Standardized Non-Parametric Index (SNPI) were used to evaluate the performances of multiple drought indices. The results include various drought conditions detected by multiple drought indices, as well as a comparative study among different drought indices. Through the comparative study, we found that PCI was a desirable single index to monitor meteorological drought. TCI was suitable for monitoring agricultural/vegetation drought. SMCI and VCI should be avoided for monitoring drought in this region. CMDI was an appropriate meteorological drought index, and CVDI was a promising indicator in monitoring agricultural/vegetation drought.
1. Introduction
Drought is one kind of the costliest and the most complex disasters, which may bring devastating damages to agriculture, vegetation ecology, industry and even threat human life [1,2,3]. Droughts can be categorized into four types, including meteorological drought, hydrological drought, agricultural/vegetation drought and social economic drought [4]. Among them, the first three drought types are related to water deficit in the hydrological cycle [5]. The below-normal precipitation might result in meteorological drought. Hydrological drought is related to the deficit of streamflow or groundwater. Agricultural/vegetation drought may occur when soil moisture falls below the mean level. Social economic drought is associated with complicated social conditions, besides the hydrological cycle aspect.
Numerous drought indices have been developed to evaluate droughts effectively by integrating the station-based data into an indicator in previous studies, such as Standardized Precipitation Index (SPI) [6,7], Standardized Precipitation Evapotranspiration Index (SPEI) [8] and Palmer Drought Severity Index (PDSI) [9,10]. They have their own applications, advantages and effectiveness with respect to different drought types. SPI was calculated based on in situ precipitation data, and could be obtained over space and time [6,7]. SPEI was obtained by standardizing the in situ precipitation and evapotranspiration data [8]. According to research purposes of monitoring different drought types, SPI and SPEI could be calculated at flexible time durations (e.g., 1-, 3-, 6-, 9-, 12-, and 24-month durations) [11]. These in situ drought indices can effectively monitor drought conditions around the weather stations, but they lack sufficient spatial details to elaborate and characterize the spatial distribution and variations of droughts. Although the statistical techniques, such as spatial interpolation, could provide gridded data, the accuracy and the level of spatial resolution is subject to the interpolation process and the distribution of weather stations [12]. Since remote sensing data can provide spatial details, especially for the areas with limited ground observations, drought indices based on satellite-based remote sensing data have attracted more attentions [13,14].
Remote sensing technology has enhanced the development of CI-based (Condition Index-based) drought indices with simple input data, simple calculations and detailed spatial information, e.g., Vegetation Condition Index (VCI) [15,16], Temperature Condition Index (TCI) [17], Standardized Vegetation Index (SVI) [18] and Normalized Multiband Drought Index (NMDI) [19]. More recently, drought indices based on the combined satellite-based remote sensing data were developed. The Vegetation Health Index (VHI), combing VCI and TCI, was developed to evaluate the stress of vegetation with respect to both water and temperature [16]. Rhee et al. [20] established the scaled drought condition index (SDCI) through the combination of VCI, Precipitation Condition Index (PCI), and TCI. Zhang and Jia [12] described the microwave integrated drought index (MIDI) for metrological drought by integrating PCI, SMCI, and TCI. The optimized meteorological drought index (OMDI), and optimized vegetation drought index (OADI) were introduced by Hao et al. [21] by combing VCI, TCI, PCI, and SMCI.
Different drought indices own different characteristics, restrictions and applications. Previous efforts mainly focused on establishing more drought indices. In fact, the applicability of different drought indices may vary with respect to different environmental conditions. For example, Seiler et al. [22] evaluated the severity of drought in Argentina using PCI and VCI, suggesting that the similar patterns of precipitation and these CI-based drought indices. Rhee et al. [20] used SDCI, the weighted combination of PCI, TCI and VCI, to evaluate the drought conditions in both the arid regions and the humid regions, and then found that the drought conditions showed discrepancies in spatial distribution in different areas. Quiring and Ganesh [23] compared the station-based drought indices with VCI in Texas, and indicated that the in situ drought indices showed significant correlations with VCI in the counties of northwestern and southwestern Texas. All these results indicated the otherness of different drought indices. Thus, the comparative study of drought conditions using multiple drought indices can provide not only a better understanding of drought events, but also a comprehensive analysis of the sensitivity of drought indices.
China is vulnerable to the costly drought impacts according to past drought events [3]. Previous studies reported that an average annual crop area affected by drought was about 209,000 km2 and the annual direct economic losses exceeded 32 billion Yuan (based on the 2013 price levels) in the period from 1949 to 2013 [24,25,26]. Thus, the variation of drought conditions in China ranging from regional to national scales under the context of climate change has become a hotspot in China. In several studies, the drought conditions in China were analyzed regionally by using the station-based drought indices. For example, previous drought studies by using SPI indicated that the eastern part of China was prone to be more hazardous than the western part of China [27]; an increase in the drought severity was observed in Xinjiang [28]; locations of the drought area had a forward trend from south to north and from west to east in northwest China [29]. In recent years, more endeavors have been made to study the drought conditions in China through remotely sensed data. Zhang et al. [30] proposed a remotely sensed Drought Severity Index (DSI), integrating both vegetation and evapotranspiration information, and found that the DSI was effective to quantify moisture conditions at the province level in North China. Based on a modified Temperature Vegetation Drought Index (mTVDI), Zhao et al. [31] found that droughts occurred more frequently in Northwest China and the southwest of Tibet, and the Huanghuaihai Plain and Yunnan-Guizhou Plateau were identified as the drought centers, respectively. Although such a variety of studies have aimed at the variations of drought conditions in China, yet the regional studies about different characteristics of different drought indices are still limited. Studying drought phenomena across a wide range of geographical region using various drought indices can help us not only to understand the drought events better, but also to comprehensively understand the drought indices.
The Three-River Headwaters Region (TRHR), located in western China, is well known as the sources of the Yangtze River, the Yellow River and the Lancang River, and plays an important role in China’s ecological system. The TRHR belongs to a typical plateau continental climate with obvious interannual and interdecadal variations in precipitation. Summer experiences frequent rainstorms with relatively high temperature. Meanwhile, the distribution of precipitation is extremely uneven, and precipitation mainly occurs in the eastern and southern regions. In view of the importance of the TRHR in ecological and water resources security, regional droughts monitoring and exploration have practical significance. Several previous studies have monitored the drought conditions in TRHR by using the station-based weather data [32,33]. Only a few studies explored the drought events based on remote-sensing data [34,35]. In terms of regional drought conditions in the TRHR, few studies compared the performances of different CI-based drought indices to deeply study drought phenomenon and comprehensively analyze different drought indices. In the summer of 2006, the TRHR experienced one of the worst droughts in the history of this region [36]. Thus, July 2002–2011 and April–October 2006 were selected to exemplify the spatial variation of drought conditions in this study.
This study explores the drought conditions in the TRHR by using multiple drought indices. Two specific questions are addressed: (1) For the drought conditions across the TRHR, what are the drought statuses of different drought types? (2) For the CI-based drought indices, what are the features of drought indices across the TRHR, Western China? The rest of this paper is organized as follows. Section 2 describes materials and methods, which includes the study area, the data and the methods used in this study. Section 3 presents the drought conditions based on multiple drought indices, and discusses the performances of different drought indices through a comparative study. Discussion and Conclusions are drawn in Section 4 and Section 5.
2. Materials and Methods
2.1. Study Area
The study area (31.53–37.10° N, 89.41–102.40° E) is located in the hinterland of the Qinghai-Tibet Plateau (Figure 1a). It covers an area of 312,000 km2, which involves the source regions of the Yellow Rivers (46%), Yangtze Rivers (44%) and Lancang Rivers (10%). The TRHR experiences a wet and warm summer, and a cool and dry winter. Due to the high elevation and the influence of the Asian monsoon, approximately 85% of the annual precipitation occurs between May to September, and the average temperature is −1.45 °C. As a result of the large spatial and temporal variations in precipitation and a rapid increase in air temperature, the drought events in this region were found to increasingly expand after the 1990s [37]. Figure 1 also shows other information of TRHR, including the distribution of the annual mean values of vegetation, precipitation and temperature for the study period of 2002 to 2011. The mean values of Normalized Difference Vegetation Index (NDVI) during the study period is derived from GIMMS (Global Inventory Modelling and Mapping Studies) AVHRR (Advanced Very High Resolution Radiometer) NDVI dataset [38], which could reflect the growth status of vegetation and the degree of vegetation coverage. From Figure 1b, it is observed that the NDVI values in this region have obvious spatial differences with a decreasing trend from the southeastern part to the northwestern part. The spatial distribution of mean annual precipitation values for the study period, which is derived from China’s Ground Precipitation 0.5° × 0.5° Gridded Dataset (V2.0) [39], is shown in Figure 1c. The annual precipitation has an obvious spatial inhomogeneous, of which the precipitation in the southeastern part is more than that of in the northwestern part. The spatial distribution of annual mean values in the air temperature during the study period, which is derived from China’s Ground Temperature 0.5° × 0.5° Gridded Dataset (V2.0) [40], is shown in Figure 1d. The annual average temperature becomes low with high elevation. Figure 1e describes the land use situation of TRHR, which is derived from the FROM-GLC (Finer Resolution Observation and Monitoring of Global Land Cover). FROM-GLC is the first 30-meter resolution global land cover maps produced by using Landsat Thematic Mapper (TM) and Enhanced Thematic Mapper Plus (ETM+) data [41,42]. Details of the GLC dataset were described in FROM-GLC [43]. As shown in Figure 1e, there are nine types of land in TRHR, i.e., croplands, forest, grassland, shrubland, wetland, water, impervious surface, bareland and snow/ice.
2.2. Data
A wide range of local and remote datasets was used in the present study to calculate the in situ drought indices and the multiple CI-based drought indices in the TRHR for the period of June 2002 to October. 2011.
2.2.1. In Situ Reference Data
Monthly precipitation and mean temperature data over the TRHR were obtained from China’s Ground Precipitation/Temperature 0.5° × 0.5° Gridded Dataset (V2.0) [39,40], which were compiled from the 2472 ground stations over China. The spatial interpolation is carried out by using Thin Plate Spline Interpolation method coupling with Global 30 Arc-Second Elevation (GTOPO30) Digital Elevation Model (DEM) dataset [44]. Details of the gridded data were described in National Meteorological Information Center (NMIC) [39,40]. This gridded dataset has been widely used in previous studies [45,46], thus we used the gridded precipitation and temperature from this gridded dataset directly in this study. Table 1 lists the general information of meteorological stations shown in Figure 1 within the TRHR. In this study, the gridded precipitation and mean temperature data were then interpolated to 0.25° resolution to match the corresponding remote sense pixel (0.25° × 0.25°) by using cubic convolution interpolation method [47,48].
2.2.2. GIMMS AVHRR NDVI
In this study, the monthly GIMMS (Global Inventory Modelling and Mapping Studies) AVHRR (Advanced Very High Resolution Radiometer) NDVI dataset, which was obtained from the NASA Earth Exchange [49] with a spatial resolution of 8 km, was used to calculate vegetation-related drought index. The Maximum Value Composite (MVC) method was applied to the NDVI dataset to avoid the data noises. Studies showed that the degree of influence of clouds, sun angle, water vapors, aerosols and directional surface reflectance was minimized in MVC NDVI imagery [50]. The data were resampled to be 0.25° resolution by using pixel aggregate method.
2.2.3. CHIRPS Precipitation
The monthly CHIRPS (Climate Hazards Group Infrared Precipitation with Stations) precipitation dataset from Climate Hazards Group [51] with a spatial resolution of 0.05° was used in this study to reflect precipitation variations and precipitation-related drought conditions. Like the NDVI dataset mentioned above, the data were resampled to maintaining the consistency of spatial resolution in this study.
2.2.4. MODLT1M Temperature
The land surface temperature data for calculating temperature-related drought indices in this study was derived from MOD11 products [52] by Chinese Academy of Sciences with a spatial resolution of 1 km [53]. The average values of MODLT1T product were calculated as the values of the monthly temperature dataset.
2.2.5. AMSR-E Soil Moisture
In this study, soil moisture product from the National Snow and Ice Data Center (NSIDC) was used. The spatial resolution of the dataset is 25 km × 25 km and the temporal resolution is one day. The maximum value of ascending and descending orbits was chosen as the value of the raster. Then, the average value of a month was defined as the monthly value of each raster cell.
2.3. Methods
2.3.1. In Situ Drought Indices
Three in situ drought indices, SPI, SPEI and SNPI, are used in this study to evaluate the performance of CI-based drought indices across the TRHR. All of these three drought indices were designed to quantify the drought conditions at multiple time durations [6,7]. In this study, the gridded monthly precipitation and mean temperature series from 1970 to 2011 were used to construct SPI, SPEI and SNPI series at 1-, 3-, 6-, 9- and 12-month time durations for each grid cells. The 1-month SPI /SEPI/SNPI values were considered as the proper indicators for the meteorological drought, while the 3-month and 6-month SPI/SPEI/SNPI values were applicable for agricultural/vegetation drought [20,54].
Standardized Precipitation Index (SPI)
The SPI values are used to reproducing the wet and drought conditions contributed by precipitation change in the TRHR [6,7]. In the present study, the monthly precipitation time series from 1970–2011 are used. The procedure of calculating SPI is briefly described as follows. First, a proper probability distribution is selected to fit the precipitation values. Then the cumulative probability is calculated from the fitted distribution. Lastly, the standard normal deviation is converted from the cumulative probability with mean zero and standard deviation unity. In this study, the log-distribution is used [5,55].
Standardized Precipitation Evapotranspiration Index (SPEI)
SPEI is a multiscale drought index based on climatic variables [8]. The monthly precipitation and air temperature time series from 1970–2011 are used in this study to obtained the SPEI series. There are several steps for calculating the SPEI values: (1) calculating the monthly values of potential evapotranspiration (PET) by using the meteorological parameters; (2) calculating the differences between the precipitation (P) and PET for a given month with the PET value; (3) aggregating the calculated differences at different time durations; (4) calculating the probability density function by using the log-logistic probability distribution function based on three parameters; (5) standardizing the probability distribution function to obtain the SPEI values.
Among them, calculating PET is difficult because it involves numerous parameters, e.g., surface temperature, air humidity, soil incident radiation, water vapor and sensible heat fluxes. Different methods have been developed to calculate PET based on different meteorological parameters measured from weather stations [56,57]. Studies recently showed that the use of simple or complex methods to calculate the PET could obtain similar results when a drought index is calculated [58]. Thus, we have used one of the simple approaches, i.e., the Thornthwaite method, to calculate PET [59,60], which owns the advantage of only the monthly mean temperature required. Following this method, the monthly PET (mm m−1) is obtained as follows:
where T is the monthly mean air temperature in °C; I is a heat index, which is calculated as the sum of 12 monthly index values i, i is derived from mean monthly temperature:
a is given by a third-order polynomial in the heat index I: , and x is a correction coefficient computed as a function of the latitude and month:
where NDM is the number of days of the month, and N is the maximum number of sunshine duration (hr), which is estimated by the following formula:
where is the latitude in radians and J is the average Julian day of the month.
Standardized Non-Parametric Index (SNPI)
SNPI is a new non-Parametric drought index that has been proposed recently [61]. Results indicated that the SNPI values were highly comparable to the SPEI values in characterizing the meteorological dry and wet conditions, but with minimally skewness [61]. In this study, the monthly precipitation insufficiency (precipitation minus potential evapotranspiration) series from 1970–2011 was used to obtain the SNPI series. The procedure for calculating SNPI is two-fold. Firstly, temporal aggregation of the monthly time series at the given relevant time scale (e.g., 1-month, 3-month) is performed. Secondly, the aggregated results are used to obtain SNPI series by using the non-parametric rescaling. The negative and positive SNPI values are used to characterize the dry and wet conditions of TRHR, respectively.
2.3.2. Single CI-Based Drought Indices
Four single CI-based drought indices were calculated to detect the drought conditions from a comprehensive prospect, including Precipitation Condition Index (PCI), Soil Moisture Condition Index (SMCI), Temperature Condition Index (TCI), and Vegetation Condition Index (VCI).
The PCI is used to evaluate the precipitation variations and drought conditions [20], which is calculated as
where I = 1, 2, 3…, n denotes for year and j = 1, 2, 3…, 12 denotes for month. Pmax,j and Pmin,j are the maximum and minimum values of the precipitation for month j, respectively. As described by the equation, PCI values are calculated based on the group of 12 maximum and minimum values for each grid cell, which are used to minimize the influences of seasonality to the results.
The VCI is the percentage of NDVI with respect to its maximum amplitude. The VCI is calculated as
where NDVImax,j and NDVImin,j are the maximum and minimum values of the NDVI for month j, respectively.
The TCI is used to determine the temperature-related vegetation stress caused by excessive wetness [30], which is calculated as
where Tmax,j and Tmin,j are the maximum and minimum values of the temperature for month j, respectively.
Similarly, SMCI [21] is also introduced to monitor the drought condition of the study area, which is calculated as
where SMmax,j and SMmin,j are the maximum and minimum values of the soil moisture for month j, respectively.
2.3.3. Combined Drought Indices
Two combined CI-based drought indices, i.e., Combined Meteorological Drought Index (CMDI) and Combined Vegetation Drought Index (CVDI), were also applied in this study to explore the evolution of droughts across the TRHR. The combined drought indices were calculated as the optimum linear combinations of CI-based indices, with the objective of maximum correlation with in situ indices, i.e., SPI or SPEI or SNPI. The calculation is carried out as follows [21]:
subject to
where X includes SPI/SPEI/SNPI indices calculated by in situ reference data. Y is the combined drought indices derived from TCI, PCI, SMCI and VCI. The first row of Y is CMDI, and the other row is CVDI with the inclusion of VCI. σx and σy are the standard deviations of X and Y, ux and uy are the means of X and Y, E is the expectation. α, β and γ are optimization variables for TCI, PCI and SMCI when f(x,y) reaches its highest value. The Constrained Nonlinear Optimization algorithm is used in this study for determining the optimal weights (α, β and γ) [21].
3. Results
3.1. Combined Drought Indices
Based on the data and the methods described above, four single CI-based drought indices are first calculated, i.e., VCI from GIMMS AVHRR NDVI dataset, PCI from CHIRPS precipitation dataset, TCI from MODLT1M temperature dataset and SMCI from AMSR-E soil moisture dataset. The combined drought indices are then derived from four single CI-based drought indices by using the constrained optimization method described in Section 2.3.3. The best weights for CMDI and CVDI are listed in Table 2.
From Table 2, it is observed that CMDI has a higher correlation with SPI-1 and SPEI-1, suggesting that it is a reasonable indicator for meteorological drought. The percentage of PCI in CMDI is 64%, followed by TCI (29%) and SMCI (7%). This indicates that precipitation might provide more precise information, while SMCI has the minimum effects on monitoring meteorological drought across the study area. Although the percentage of VCI is only 4%, CVDI obtains a controlling factor of TCI and receives higher correlation with SPEI-3, which indicates that CVDI considers more information of the vegetation drought in this region. The dominant proportion of TCI suggests the importance of surface temperature for exploring the vegetation drought in this study area. Overall, both CMDI and CVDI consider the detailed information of the single drought indices, and the high correlation coefficients indicate that they are desirable indicators for monitoring meteorological drought and vegetation drought, respectively.
The scatter plots between monthly combined drought indices (CDIs) averaged over the whole region and averaged in situ drought indices (i.e., SPI, SPEI and SNPI) are presented in Figure 2a,b. Both CMDI and CVDI show high correlations with in situ drought indices and passed the 99% significant level. Yearly changes of CDIs averaged over the whole region are compared to in situ drought indices in July (Figure 2c,d). From Figure 2c, it is observed that the driest year appears in 2006 and the wettest year appears in 2009 for both CMDI and the in situ drought indices. The driest year is 2006 for both CVDI and SPEI-3, while the wettest year is 2009 for CVDI (see Figure 2d). The yearly changes show some discrepancies between different drought indices. CMDI and SPI/SPEI-1 change consistently each other, while CMDI and SNPI-1 behave differently around 2003. CVDI shows the good consistency with SPI-3 and SPEI-3, whereas CVDI seems overestimate the drought extent in 2003 when compared with the SNPI-3 value. Overall, yearly changes of CDIs agree well with changes of in situ drought indices in most cases, but CMDI is more consistent with SPI/SPEI-1, and CVDI is more consistent with SPI/SPEI-3.
3.2. Drought Patterns
3.2.1. Monthly Maps
The drought index maps for April to October in 2006 display the seasonal variations among different CI-based drought indices. In this study, CI-based drought indices less than 0.2 can be identified as severe drought according to Zhang and Jia [12] and Hao et al. [21] (see Table 3). As illustrated in Figure 3, the location and severity of droughts vary greatly from months to months. TCI shows that severe drought mainly occurs in June and July in most areas of TRHR, while PCI shows that most areas of TRHR are not under drought conditions in June. SMCI shows that the major areas of TRHR are experiencing drought conditions in July. VCI shows the greatest differences from the other single CI-based drought indices, of which severe drought mainly occurs in October. The single drought indices TCI, PCI, SMCI and VCI do not show obviously spatial coincidence in seasonal level. The similar conditions are observed between combined CI-based drought indices. Meteorological drought and agricultural drought conditions are obviously distinguished by using CMDI and CVDI. Severe meteorological droughts mainly occur in July in most area of TRHR, and in May, June and October in the west TRHR, while most areas of TRHR are under severe agricultural/vegetation drought during the same period. The spatial distributions of CMDI and CVDI agree with previous studies of Liu et al. [32], which indicated that the northern and western regions of TRHR were more prone to drought.
3.2.2. Year-to Year Maps
From Figure 4, drought patterns in July from 2002 to 2011 are discovered. Both TCI and SMCI indicate that severe drought occurs over the most areas of TRHR in 2006, while PCI shows that severe drought occurs over the most areas of TRHR in 2003. Moreover, drought mainly occurs in the western regions in 2006 as for PCI, while drought mainly occurs in the western regions in 2002 and 2004. VCI indicates that only a few regions are experiencing drought in July among all these years, which is different from the other drought indices. As regards the combined CI-based drought indices, the meteorological drought areas in 2003, 2004, 2006 and 2007 are larger than that in the other years. The distribution of agricultural/vegetation drought is much similar to that of meteorological drought. These results are consistent with the results from Zheng et al. [44], which indicated that drought occurred in 2002–2004 and 2007–2009 across the TRHR based on the station-based drought indices. Severe agricultural/vegetation droughts are barely identified during the period of 2002 to 2011. Overall, droughts in TRHR show regional and seasonal differences, which require fine distinctions of the regional and seasonal fluctuations in drought provided by these CI-based drought indices from remote sensing data.
3.3. Correlation Analysis
3.3.1. Monthly Temporal Comparisons
Based on the massive datasets, we can determine the temporal similarity between multiple CI-based drought indices and in situ indices across the TRHR. Maps showing the monthly correlation coefficients between CI-based drought indices and in situ indices in the whole study period, the growing season (April–September) and the non-growing season (October–March) are drawn in Figure 5.
For the monthly correlations, the correlation coefficients between CI-based indices and in situ drought indices vary for different drought indices and for different time durations (Figure 5a). In general, all the single CI-based drought indices do not always show significant correlations with SPI, with r ranging from −0.28 to 0.70. PCI always show the highest correlation with 1-month in situ drought indices, and then the value decreases as time durations increases. TCI shows the highest correlation with SPI-3/SPEI-3, which indicates that TCI is suitable for monitoring agricultural/vegetation drought. Both SMCI and VCI show a higher correlation with long-term drought indices (e.g., SPI/SPEI-9 and SPI/SPEI-12). The correlation coefficients of single drought indices are much similar among different in situ drought indices, especially for SPI and SPEI, where the correlation coefficients vary from −0.29 to 0.67 (p < 0.01). In general, PCI has the best correlation with one-month in situ drought indices, followed by TCI, SMCI and VCI, which indicate that the remote sensing data from CHIRPS can provide valuable information for meteorological drought monitoring. TCI shows a high correlation with three-month drought indices, which indicate that TCI contributes more for monitoring agricultural/vegetation drought. The results show that both CMDI and CADI perform better than the single CI-based drought indices (r ranging from 0.24 to 0.73 with p < 0.01), which suggest that CMDI and CADI are more suitable to describe the meteorological and vegetation drought conditions for the study area, respectively.
From Figure 5b, it is founded that PCI shows stronger correlations with SPI-1, SPEI-1 and SNPI-1 than the other single indices in the growing season. This indicates that PCI is a preferable indicator for monitoring meteorological drought in the growing season. TCI varies slightly among different time scales in the growing season, and shows a better performance than SMCI generally, especially for the long-time drought. Although correlations between VCI and in situ drought indices are improved in the growing season, VCI is still not significantly correlated to the in situ drought indices nearly at all the time scales. This might be because the human-induced variations reduce the correlation between vegetation and the water balance in this region, such as over cultivating, over grazing and so on. Generally, the combined drought indices perform better than the single drought indices in the growing season. However, the advantages of both CMDI and CVDI are not significant for the long-term drought, e.g., SPI-9, SPI-12, SPEI-9, SPEI-12, SNPI9 and SNPI12.
In general, correlations between all the drought indices and the in situ drought indices are lower in the non-growing season than that in the growing season. Correlations between PCI and SPI-1/SPEI-1/SNPI-1 are higher than that of the other single drought indices, suggesting that it is still appropriate for monitoring vegetation drought in the non-growing season (see Figure 5c). The VCI in the non-growing season shows a strong negative correlation with SPI/SPEI/SNPI, which may due to the reason that vegetation has a rapid response to water stress situation to adapt the water loss conditions under the low-level water balance. Moreover, the vegetation type of the study area is mainly evergreen coniferous forest, and snow/ice covers the major area of the TRHR in the non-growing season. These have determined that water balance condition is not the principal influencing factor to vegetation in the non-growing season. Although the combined drought indices (CMDI and CVDI) perform worse in the non-growing season than in the growing season, they are still recommended among all the CI-based indices.
Overall, although the correlation coefficients vary greatly at different seasons, the combined drought indices are more favorable in monitoring one-month drought (meteorological drought) and three-month drought (vegetation drought) among all these CI-based drought indices. Furthermore, all these CI-based drought indices have lower correlations with 6-, 9-, 12-SPI/SPEI/SNPI, which indicate that CI-based drought indices are non-appropriate for monitoring the long-time drought (more than six months). This might be because that all these CI-based drought indices are calculated by using the current month data, which could not reflect the delay processes more than six months.
3.3.2. Monthly Spatial Comparisons
Figure 6 displays maps describing the spatial distributions of the monthly correlation coefficients between the CI-based indices and the in situ drought indices. TCI shows a stronger correlation with SPI-3 in the south part of the TRHR than the other single indices considered expect PCI. Additionally, TCI shows a stronger correlation with SPEI-3 than all the other single drought indices in almost all parts of the TRHR. However, the correlations between TCI and SPNI values are low in most of the TRHR. The correlations between PCI and one-month in situ drought indices are higher than those of TCI, SMCI and VCI in majority area of the TRHR, which indicate that PCI could properly describe the meteorological conditions in this region. Both SMCI and VCI show the weak correlation in this region, which indicates that both of them might not be suitable for drought detection as single drought indices. As for the combined CI-based drought indices, CMDI shows a stronger correlation with SPI-1/SPEI-1 than all the other single drought indices except PCI, which has a coefficient >0.5 in most regions of TRHR. CVDI shows a stronger correlation with long-term drought (i.e., three months) than CMDI. CVDI improves the correlations in the southern and eastern regions of TRHR. Despite there exists some disagreement among different in situ drought indices. We could still get some general conclusions, which are listed as follows. From the above analysis, we find that PCI is a desirable index for monitoring meteorological drought indices. TCI would be more reliable for monitoring agricultural/vegetation drought. Both VCI and SMCI should be avoided for monitoring drought in this region because of their low correlations with in situ drought indices. For the Combined CI-based drought indices, the constrained nonlinear optimization method can improve the performance of drought indices, although the improvement is not dramatically.
4. Discussion
There exist some uncertainties that can affect the performances and the comparison results of different drought indices. Firstly, the validation scale might affect the results from different drought indices. The in situ reference data, i.e., the monthly precipitation and mean temperature series from 1970–2011, is collected from the stations, and then interpolated to grids. Although the station-based meteorological data are accurate and widely used all over the world, the distribution and density of meteorological stations are inadequate to provide the spatial detail for drought detection [12]. The spatial distribution of drought is unable to be determined properly unless the meteorological stations are well distributed throughout the region. Even so, the time and cost requirements for data preparation may hinder the drought mitigation procedures. Moreover, although the station-based data can provide gridded information by using the spatial interpolation technology, e.g., the gridded dataset used in this study, they can only give a rough estimation of the study area, due to the subject of the station locations and the limitations of interpolation technology. The details of these gridded data are incompatible with the fine pixel values from the remote sensing data, which may result in the phenomenon that the values recorded at local stations may not be accurately represented by remote sensing drought indices.
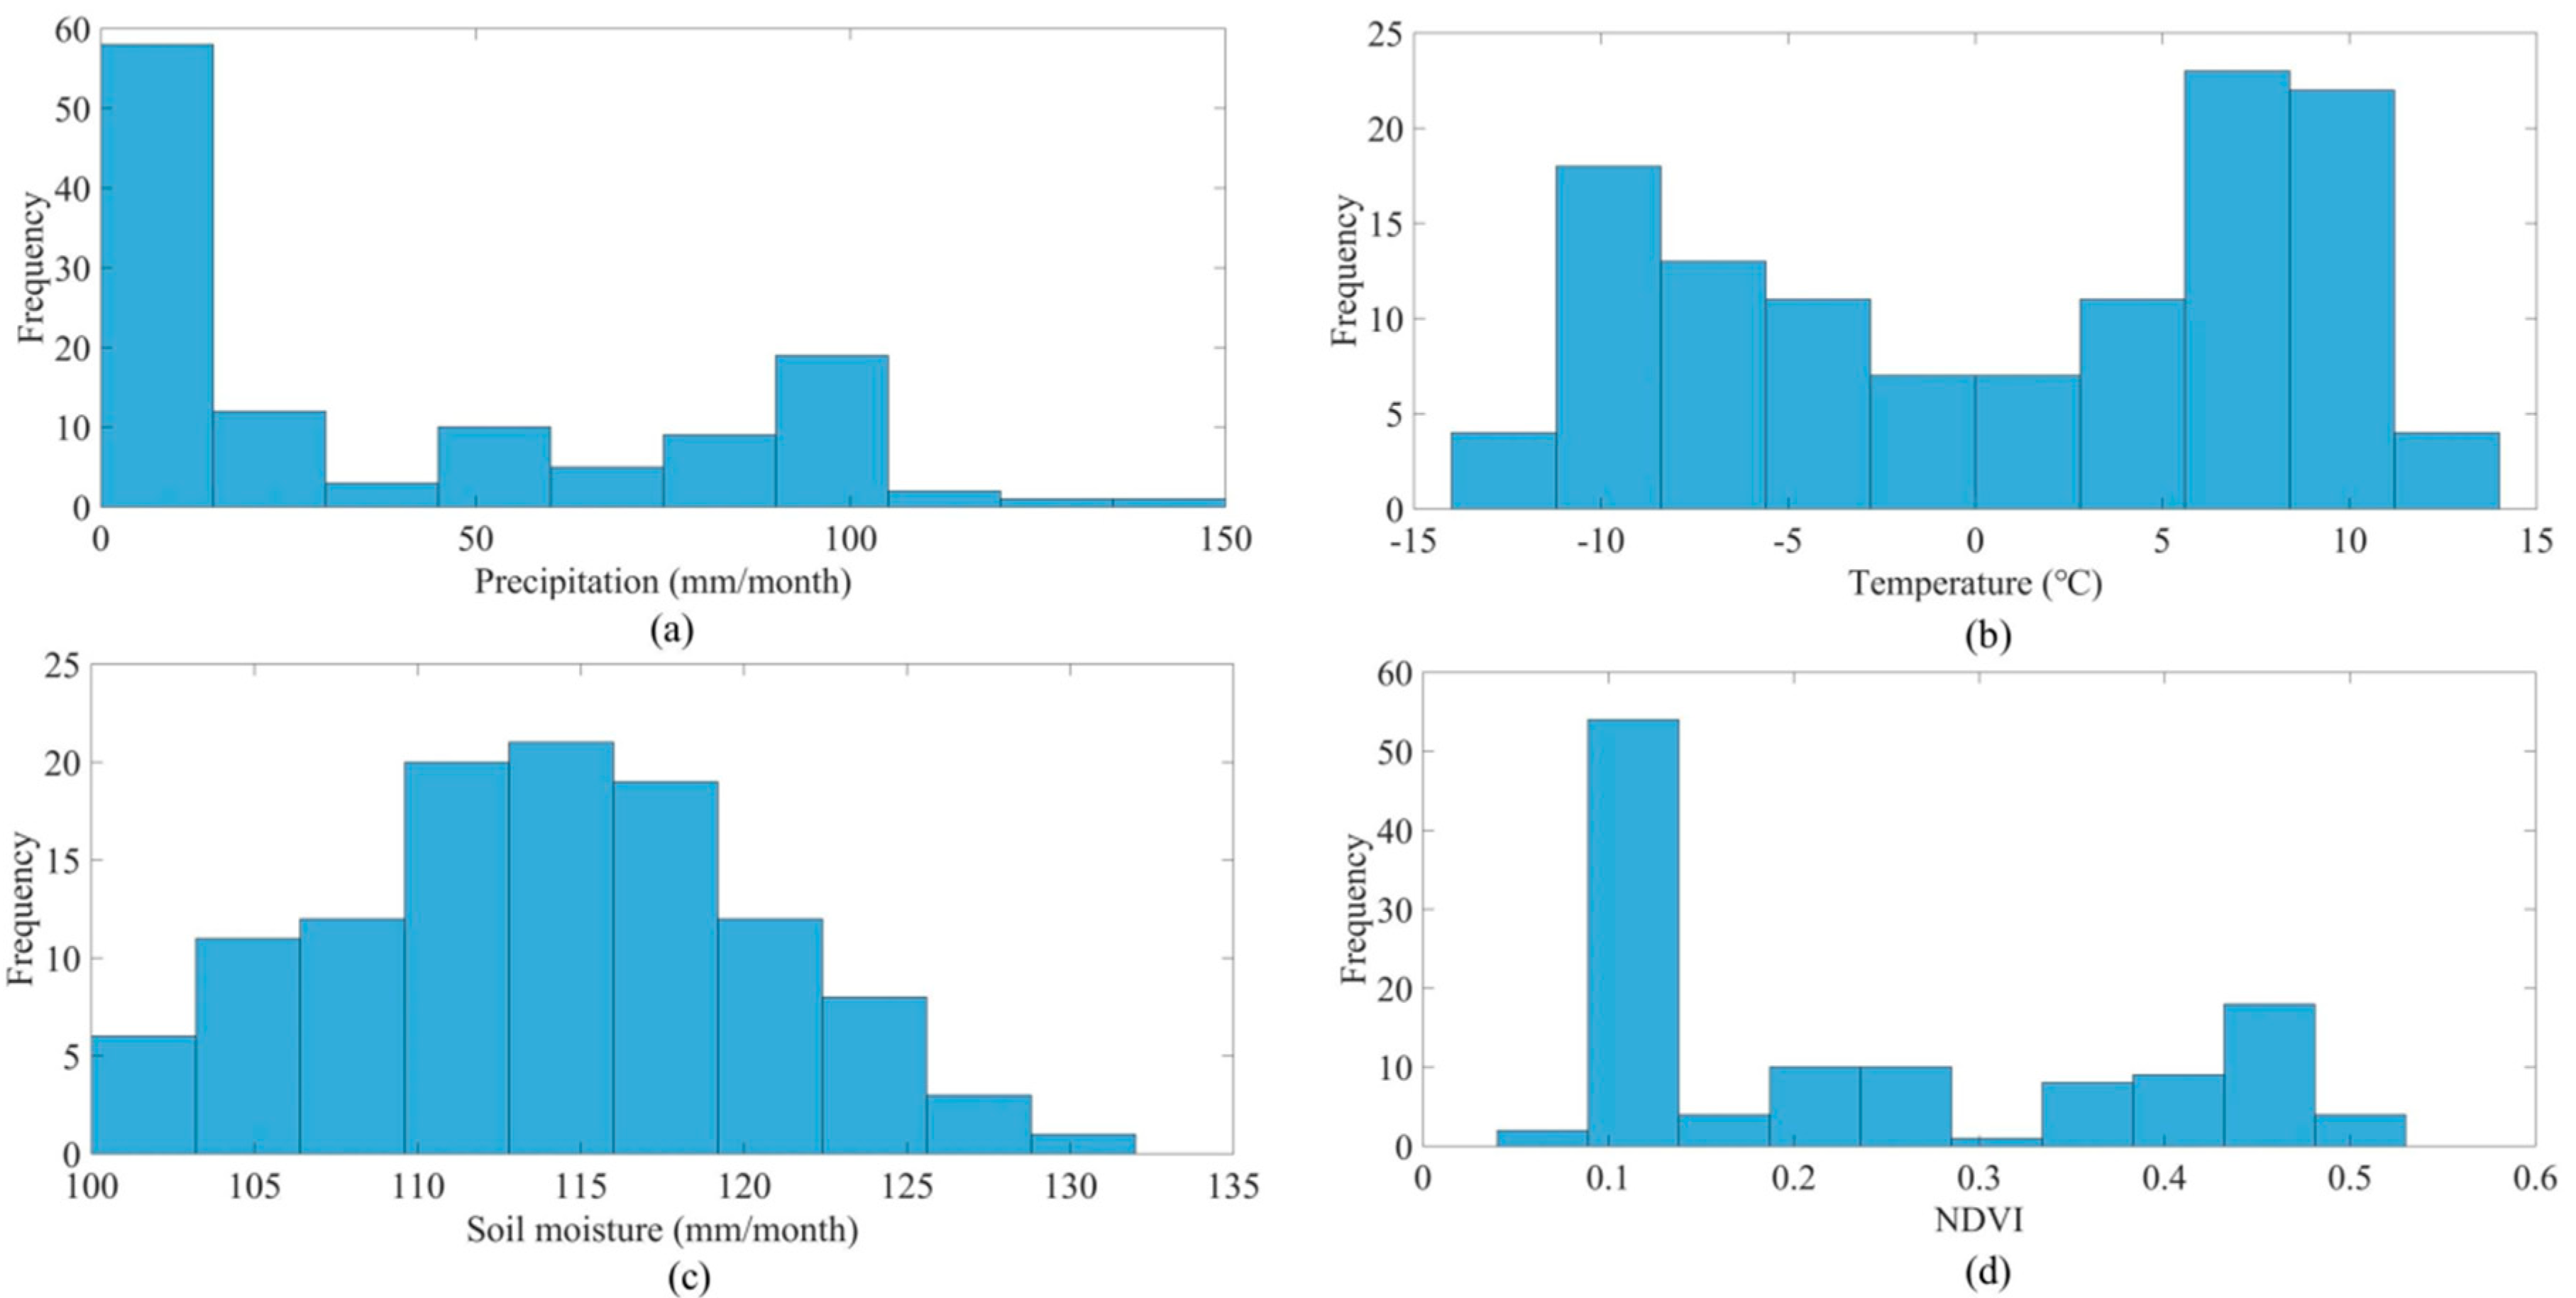
Also, the method limitations may also affect the analysis of drought phenomenon by using CI-based drought indices. In the present study, the single CI-based drought indices, e.g., PCI, VCI, TCI and SMCI, are all normalized with respect to the minimum and maximum observation. The CI-based drought indices have been proven useful for monitoring the related variables. For example, VCI is considered useful as a means for drought onset detection, and drought impact measurement in regions around the world [62,63,64]. However, some studies have indicated that the application of VCI should be treated with caution. For example, there existed some disagreement when the VCI was compared to in situ drought indices over the desert and desert steppe regions of Mongolia [65]. A similar situation was observed in our study as well. The rough standardized method might be another reason for this situation except for the validation scale. The standardization method used in this study is the Max-Min method. The reason for choosing this method is that it requires simple calculation and is easily applied. However, considering the fact that the remotely sensing time series used in this study obey skewed distribution rather than normal distribution generally (see Figure 7), the Max-Min method used in this study might affect the performances of the CI-based series. For example, if a time series shows a positive skewness, the CI-based drought indices tend to overestimate the drought conditions. On contrary, if a time series shows a negative skewness, the CI-based drought indices tend to underestimate drought conditions.
Using a standardization method considering the distribution types of a time series seems to be an effective way to solve this problem. However, seeking for proper way to standardize the time series with respect to the distribution types is a complicated task, because different types of data own different characteristics, and obey different distributions. The standardization method for calculating SPI values is one widely used method in this aspect [6,7]. SPI takes into account the fact that precipitation follows the skewed distribution, and then carries out the normal standardization processing. Thus, drought index can reflect the variations of water resources at different time scales. However, due to the intrinsic statistical nature of such indices, a period of at least 25–30 years is necessary to ensure the reliability of the indices [6,7]. In most cases, the length of the remote sensing time series is not long enough to support this method, especially for soil moisture series. Thus, although the limitations mentioned above might affect the performances of CI-based drought indices, we still use the widely used method (Max-Min), because this method is intuitive and simple. And a lot of researchers have applied this method to remotely sensing data for drought detection and obtained some valuable findings [12,13,14,20,21,22]. Moreover, the performances of different CI-based drought indices were verified by using the qualitative analysis with previous studies, and the quantitative analysis based on correlation analysis in this study. In general, this simple standardized method is both an advantage and a disadvantage in this study. One of the major advantages of these CI-based drought indices is that they provide continuous spatial information and attempt to detect drought conditions directly by using a simple method. The disadvantage of this approach is that this is a rough way without considering the distribution types of data. Thus, seeking a proper standardization method with respect to the distribution types of time series needs further exploration in future studies.
Moreover, several additional factors may also influence the analysis of drought phenomenon from this study. Residual cloud pollution in remote sensing images might affect the drought conditions in a specific region. Different in situ drought indices might also influence the analysis of drought conditions. In this study, we used three different station-based drought indices to even out the influence from the choice of selection of the methods to derive drought indices. Although there still exists some differences among different station-based drought indices, we can still get some general conclusions from the comparative study. For example, although the values of correlation coefficients vary greatly for PCI, PCI is more related with 1-month drought indices than that of three-month drought indices, especially in the southeastern region (see Figure 6). These results indicate that PCI is a proper index for monitoring meteorological drought. In addition, the different resolution and the different length of the remote sensing data means that the pixel values must be resampled to be the same spatial resolution and the same length (0.25 degrees and 10 years in the study), which might hinder the drought analysis procedures at a finer spatial resolution and longer period.
5. Conclusions
The main feature of CI-based drought indices, e.g., TCI, VCI, PCI, and SMCI and so on, is that they require limited computation, and can be easily applied over global, continental or regional scales. In this study, a comparison study is conducted between CI-based drought indices and in situ drought indices across the TRHR from 2002 to 2011. The drought patterns derived from these CI-based drought indices show that CI-based drought indices vary greatly at temporal and spatial scales. These CI-based drought indices are capable of detecting the drought conditions of the TRHR between 2002 and 2011.
From the comparison of drought indices in regions of the TRHR, PCI is a desirable choice to monitor meteorological drought conditions because of the stronger correlation with one-month in situ drought indices. Both SMCI and VCI are poor indicators to monitor droughts as its low sensitivity to local conditions. As regards the combined drought indices, the optimized method can improve the performance of drought indices, although the improvement is limited. This study discloses that CI-based drought indices can be reasonably monitoring drought, but how to apply different drought indices according to their own characteristics needs further exploration. By comparing multiple CI-based drought indices, this study makes it possible to study the regional drought phenomena more accurately. Therefore, this study would be useful for investigating regional drought conditions, which might be valuable for the regional water resources security with respect to future climate change. For future work, more extensive validation at the wider regional scale is recommended to help us understand the performances of different drought indices. Also, improving the accuracy of the input data is a promising way to enhance the capacity of these CI-based drought indices.
Author Contributions
Formal analysis, J.W. and T.L.; Methodology, K.W.; Data curation, K.W.; Writing—original draft, K.W.; Writing—review and editing, J.W. and T.L.
Funding
This research was funded by National key research and development project, grant numbers 2016YFE0201900, 2017YFC0403600.
Acknowledgments
Comments and suggestions from anonymous reviewers, the Associate Editor, and the Editor are greatly appreciated.
Conflicts of Interest
The authors declare no conflict of interest.
References
- Hagman, G. Prevention Better than Cure: Report on Human and Natural Disasters in the Third World; Swedish Red Cross: Stockholm, Sweden, 1984. [Google Scholar]
- Svoboda, M.; LeComte, D.; Hayers, M.; Heim, R.; Gleason, K.; Angel, J.; Rippey, B.; Tinker, R.; Palecki, M.; Stooksbury, D.; et al. The Drought Monitor. Bull. Am. Meteorol. Soc. 2002, 83, 1181–1190. [Google Scholar] [CrossRef]
- Huang, J.; Zhai, J.; Jiang, T.; Wang, Y.; Li, X.; Wang, R.; Xiong, M.; Su, B.; Fischer, T. Analysis of future drought characteristics in china using the regional climate model CCLM. Clim. Dyn. 2018, 50, 507. [Google Scholar] [CrossRef]
- Keyantash, J.; Dracup, J.A. The quantification of drought: An evaluation of drought indices. Bull. Am. Meteorol. Soc. 2002, 83, 1167–1180. [Google Scholar] [CrossRef]
- Mishra, A.K.; Singh, V.P. A review of drought concepts. J. Hydrol. 2010, 391, 201–206. [Google Scholar] [CrossRef]
- McKee, T.B.; Doesken, N.J.; Kleist, J. The relationship of drought frequency and duration to timescales. In Proceedings of the 8th Conference on Applied Climatology, Anaheim, CA, USA, 17–22 January 1993. [Google Scholar]
- Gu, L.; Chen, J.; Xu, C.Y.; Wang, H.M. Synthetic Impacts of Internal Climate Variability and Anthropogenic Change on Future Meteorological Droughts over China. Water 2018, 10, 1702. [Google Scholar] [CrossRef]
- Vicente-Serrano, S.M.; López-Moreno, J.I. The influence of atmospheric circulation at different spatial scales on winter drought variability through a semi-arid climatic gradient in northeast Spain. Int. J. Climatol. 2010, 26, 1427–1453. [Google Scholar] [CrossRef]
- Rao, A.R.; Voeller, T.L. Development and testing of drought indicators. Water Resour. Manag. 1997, 11, 119–136. [Google Scholar] [CrossRef]
- Zhu, Y.; Liu, Y.; Ma, X.Y.; Ren, L.L.; Singh, V.P. Drought Analysis in the Yellow River Basin Based on a Short-Scalar Palmer Drought Severity Index. Water 2018, 10, 1526. [Google Scholar] [CrossRef]
- Guttman, N.B. Accepting the standardized precipitation index: A calculation algorithm. J. Am. Water Resour. Assoc. 1999, 35, 311–322. [Google Scholar] [CrossRef]
- Zhang, A.Z.; Jia, G.S. Monitoring meteorological drought in semiarid regions using multi-input microwave remote sensing data. Remote Sens. Environ. 2013, 134, 12–23. [Google Scholar] [CrossRef]
- Zhang, L.; Jiao, W.; Zhang, H.; Huang, C.; Tong, Q. Studying drought phenomena in the continental United States in 2011 and 2012 using various drought indices. Remote Sens. Environ. 2017, 190, 96–106. [Google Scholar] [CrossRef]
- Xu, P.; Zhou, T.; Zhao, X.; Luo, H.; Gao, S.; Li, Z.; Cao, L. Diverse responses of different structured forest to drought in southwest China through remotely sensed data. Int. J. Appl. Earth Obs. 2018, 69, 217–225. [Google Scholar] [CrossRef]
- Kogan, F.N. Drought of the late 1980s in the United States as derived from NOAA polar-orbiting satellite data. Bull. Am. Meteorol. Soc. 1995, 76, 655–668. [Google Scholar] [CrossRef]
- Kogan, F.N. Application of vegetation index and brightness temperature for drought detection. Adv. Space Res. 1995, 15, 91–100. [Google Scholar] [CrossRef]
- Unganai, L.S.; Kogan, F.N. Drought monitoring and corn yield estimation in Southern Africa from AVHRR data. Remote Sens. Environ. 1998, 63, 219–232. [Google Scholar] [CrossRef]
- Peters, A.J.; Walter-Shea, E.A.; Ji, L.; Vina, A.; Hayes, M.; Svoboda, M.D. Drought monitoring with NDVI-based standardized vegetation index. Photogramm. Eng. Remote Sens. 2002, 68, 71–75. [Google Scholar]
- Wang, L.; Qu, J.J. NMDI: A normalized multi-band drought index for monitoring soil and vegetation moisture with satellite remote sensing. Geophys. Res. Lett. 2007, 34. [Google Scholar] [CrossRef] [Green Version]
- Rhee, J.Y.; Im, J.H.; Carbone, G.J. Monitoring agricultural drought for arid and humid regions using multi-sensor remote sensing data. Remote Sens. Environ. 2010, 114, 2875–2887. [Google Scholar] [CrossRef]
- Hao, C.; Zhang, J.; Yao, F. Combination of multi-input remote sensing data for drought monitoring over Southwest China. Int. J. Appl. Earth Obs. 2015, 35, 270–283. [Google Scholar] [CrossRef]
- Seiler, R.; Kogan, F.; Sullivan, J. AVHRR-based vegetation and temperature condition indices for drought detection in Argentina. Adv. Space Res. 1998, 21, 481–484. [Google Scholar] [CrossRef]
- Quiring, S.M.; Ganesh, S. Evaluating the utility of the vegetation condition index (VCI) for monitoring meteorological drought in Texas. Agric. For. Meteorol. 2010, 150, 330–339. [Google Scholar] [CrossRef]
- Zhai, J.Q.; Gao, B.; Zhu, X.Y. Fact sheet on climate disasters in China. In Annual Report on Actions to Address Climate Change; Wang, G.W., Zheng, G.G., Eds.; Social Sciences Academic Press: Beijing, China, 2014. [Google Scholar]
- Qin, D.; Zhang, J.; Shan, C.; Song, L. China National Assessment Report on Risk Management and Adaptation of Climate Extremes and Disasters; Science Press: Beijing, China, 2015; pp. 70–124. [Google Scholar]
- Zhai, J.; Huang, J.; Su, B.; Cao, L.; Wang, Y.; Jiang, T.; Fischer, T. Intensity–area–duration analysis of droughts in China 1960–2013. Clim. Dyn. 2017, 48, 151–168. [Google Scholar] [CrossRef]
- He, B.; Lü, A.; Wu, J.; Liu, M. Drought hazard assessment and spatial characteristics analysis in China. J. Geogr. Sci. 2011, 21, 235–249. [Google Scholar] [CrossRef]
- Yao, J.; Zhao, Y.; Chen, Y.; Yu, X.; Zhang, R. Multi-scale assessments of droughts: A case study in Xinjian, China. Sci. Total Environ. 2018, 630, 444–452. [Google Scholar] [CrossRef] [PubMed]
- Ren, Y.L.; Shi, Y.J.; Wang, J.S.; Li, Y.P.; Zhu, Y.J.; Yang, Z.H.; Wei, B.L. Spatial and temporal variation characteristics of drought in Northwest China during 1961–2009 with standardized precipitation index. J. Glaciol. Geocryol. 2013, 35, 938–948. [Google Scholar]
- Zhang, J.; Mu, Q.; Huang, J. Assessing the remotely sensed drought severity index for agricultural drought monitoring and impact analysis in north China. Ecol. Indic. 2016, 63, 296–309. [Google Scholar] [CrossRef]
- Zhao, S.; Cong, D.; He, K.; Yang, H.; Qin, Z. Spatial-temporal variation of drought in China from 1982 to 2010 based on a modified temperature vegetation drought index (mTVDI). Sci. Rep. 2017, 7, 17473. [Google Scholar] [CrossRef]
- Liu, R.R.; Lu, B.H.; Chen, Y.T.; Dong, C.; Ruan, X.B.; Tang, W.T. Analysis on features of dry climate in the Three-Rivers Headwaters based on palmer drought severity index. Yellow River 2013, 35, 59–62. (In Chinese) [Google Scholar]
- Bai, X.L.; Wei, J.H.; Xie, H.W. Characteristics of wetness/dryness variation and their influences in the Three-River Headwaters region. Acta Geol. Sin. 2017, 37, 8397–8410. (In Chinese) [Google Scholar]
- Zeng, H.W.; Li, L.J. Accuracy validation of TRMM 3B43 data in Lancang river basin. Acta Geol. Sin. 2011, 66, 994–1004. (In Chinese) [Google Scholar]
- Gao, W.; An, R.; Wang, Z. Drought Index and Its Application Based on Microwave Remote Sensing Technology: A Case Study in the Three-River Headwaters Region. Arid Zone Res. 2017, 34, 541–550. (In Chinese) [Google Scholar]
- Dai, S.; Li, L.; Wang, Z.Y. The diagnosis analysis of exceptional drought Three-River Headwaters Region in the summer of 2006. J. Qinghai Meteorol. 2007, 3, 39–42. (In Chinese) [Google Scholar]
- Yi, X.S.; Yin, Y.Y.; Li, G.S.; Peng, J.T. Temperature Variation in Recent 50 Years in the Three-River Headwaters Region of Qinghai Province. Acta Geol. Sin. 2011, 66, 1451–1465. (In Chinese) [Google Scholar]
- Rouse, J., Jr.; Haas, R.; Schell, J.; Deering, D. Monitoring vegetation systems in the Great Plains with ERTS. NASA Spec. Publ. 1974, 1, 309–317. [Google Scholar]
- National Meteorological Information Center Home Page. Available online: http://data.cma.cn/data/cdcdetail/dataCode/SURF_CLI_CHN_PRE_MON_GRID_0.5.html (accessed on 1 September 2018). (In Chinese).
- National Meteorological Information Center Home Page. Available online: http://data.cma.cn/data/cdcdetail/dataCode/SURF_CLI_CHN_TEM_MON_GRID_0.5.html (accessed on 1 September 2018). (In Chinese).
- Gong, P.; Wang, J.; Yu, L.; Zhao, Y.; Zhao, Y.; Liang, L.; Niu, Z.; Huang, X.; Fu, H.; Liu, S.; et al. Finer resolution observation and monitoring of global land cover: First mapping results with Landsat TM and ETM+ data. Int. J. Remote Sens. 2013, 34, 2607–2654. [Google Scholar] [CrossRef]
- Yu, L.; Wang, J.; Gong, P. Improving 30m global land-cover map from-GLC with time series Modis and auxiliary data sets: A segmentation-based approach. Int. J. Remote Sens. 2013, 34, 5851–5867. [Google Scholar] [CrossRef]
- Finer Resolution Observation and Monitoring—Global Land Cover Home Page. Available online: http://data.ess.tsinghua.edu.cn/fromglc2017v1.html (accessed on 24 December 2018).
- Zheng, Y.T.; Huang, Y.F.; Wang, K.Y. Response of Vegetation to Water Stress in the Three River Headwaters Region of China. J. Basic Sci. Eng. 2018, 26, 249–262. (In Chinese) [Google Scholar]
- Wu, X.; Wang, Z.; Zhou, X.; Lai, C.; Lin, W.; Chen, X. Observed changes in precipitation extremes across 11 basins in China during 1961–2013. Int. J. Climatol. 2016, 36, 2866–2885. [Google Scholar] [CrossRef]
- Dong, L.; Zhang, M.J.; Wang, S.J.; Zhu, X.F.; Ren, Z.G.; Wang, Q. Extreme precipitation events in arid areas in Northwest China based on gridded data. J. Nat. Resour. 2014, 29, 2048–2057. (In Chinese) [Google Scholar]
- Shi, J.; Reichenbach, S.E. Image interpolation by two-dimensional parametric cubic convolution. IEEE Trans. Image Process. 2006, 15, 1857–1870. [Google Scholar] [Green Version]
- Shi, H.; Li, T.; Wei, J.H. Evaluation of the gridded CRU ts precipitation dataset with the point rain gauge records over the Three River Headwaters Region. J. Hydrol. 2017, 548, 322–332. [Google Scholar] [CrossRef]
- NASA Earth Exchange Home Page. Available online: https://nex.nasa.gov/nex/ (accessed on 10 October 2018).
- Simoniello, T. On the relevance of accurate correction and validation procedures in the analysis of AVHRR-NDVI time series for long-term monitoring. J. Geophys. Res. Atmos. 2004, 109, D20107. [Google Scholar] [CrossRef]
- Climate Hazards Group Home Page. Available online: http://chg.geog.ucsb.edu/index.html (accessed on 10 October 2018).
- Moderate Resolution Imaging Spectroradiometer Home Page. Available online: https://modis.gsfc.nasa.gov/data/dataprod/mod11.php (accessed on 10 October 2018).
- Geospatial Date Cloud Home Page. Available online: http://www.gscloud.cn/ (accessed on 10 October 2018).
- Rouault, M.; Richard, Y. Intensity and spatial extent of droughts in southern Africa. Geophys. Res. Lett. 2005, 32, L15702. [Google Scholar] [CrossRef]
- Niu, J.; Chen, J.; Sun, L. Exploration of drought evolution using numerical simulations over the Xijiang (West River) basin in south china. J. Hydrol. 2015, 526, 68–77. [Google Scholar] [CrossRef]
- Allen, R.G.; Pereira, L.S.; Raes, D. M Smith Crop Evapotranspiration: Guidelines for Computing Crop Requirements; Irrigation and Drainage Paper 56; FAO: Roma, Italy, 1998. [Google Scholar]
- Droogers, P.; Allen, R.G. Estimating reference evapotranspiration under inaccurate data conditions. Irrig. Drain. Syst. 2002, 16, 33–45. [Google Scholar] [CrossRef]
- Mavromatis, T. Drought index evaluation for assessing future wheat production in Greece. Int. J. Climatol. 2007, 27, 911–924. [Google Scholar] [CrossRef] [Green Version]
- Thornthwaite, C.W. An approach toward a rational classification of climate. Geogr. Rev. 1948, 38, 55–94. [Google Scholar] [CrossRef]
- Vicente-Serrano, S.M.; Beguería, S.; López-Moreno, J.I. A multi-scala drought index sensitive to global warming: The standardized precipitation evapotranspiration index—SPEI. J. Clim. 2012, 23, 1696–1718. [Google Scholar] [CrossRef]
- Onyutha, C. On Rigorous Drought Assessment Using Daily Time Scale: Non-Stationary Frequency Analyses, Revisited Concepts, and a New Method to Yield Non-Parametric Indices. Hydrology 2017, 4, 48. [Google Scholar] [CrossRef]
- Jain, S.K.; Keshri, R.; Goswami, A.; Sarkar, A.; Chaudhry, A. Identification of drought-vulnerable areas using NOAA AVHRR data. Int. J. Remote Sens. 2009, 30, 2653–2668. [Google Scholar] [CrossRef]
- Brown, J.F.; Wardlow, B.D.; Tadesse, T.; Hayes, M.J.; Reed, B.C. The Vegetation Drought Response Index (VegDRI): A new integrated approach for monitoring drought stress in vegetation. GISci. Remote Sens. 2008, 45, 16–46. [Google Scholar] [CrossRef]
- Jiao, W.; Zhang, L.; Chang, Q.; Fu, D.; Cen, Y.; Tong, Q. Evaluating an enhanced vegetation condition index (VCI) based on VIUPD for drought monitoring in the continental United States. Remote Sens. 2016, 8, 224. [Google Scholar] [CrossRef]
- Bhuiyan, C.; Singh, R.P.; Kogan, F.N. Monitoring drought dynamics in the Aravalli region (India) using different indices based on ground and remote sensing data. Int. J. Appl. Earth Obs. 2006, 8, 289–302. [Google Scholar] [CrossRef]
Figure 1.
Location of the Three River Headwaters Region (TRHR) and meteorological stations in the TRHR (a), the spatial distribution of annual mean values of Normalized Difference Vegetation Index (NDVI) (b), precipitation (c) and temperature (d) across the TRHR and the land use of the TRHR (e).
Figure 1.
Location of the Three River Headwaters Region (TRHR) and meteorological stations in the TRHR (a), the spatial distribution of annual mean values of Normalized Difference Vegetation Index (NDVI) (b), precipitation (c) and temperature (d) across the TRHR and the land use of the TRHR (e).

Figure 2.
Comparisons of combined drought indices and in situ drought indices (a) scatter plots of monthly CMDI and 1-month in situ drought indices, (b) scatter plots of monthly CVDI and three-month in situ drought indices, (c) year-to-year changes in July of CMDI and 1 month in situ drought indices, and (d) year-to-year changes in July of CVDI and three-month in situ drought indices.

Figure 3.
Seasonal changes of drought monitored by CI-based (Condition Index-based) drought indices from April to October in 2006.
Figure 3.
Seasonal changes of drought monitored by CI-based (Condition Index-based) drought indices from April to October in 2006.

Figure 4.
Spatial distribution of drought monitored by CI-based drought indices in July from 2002 to 2011.
Figure 4.
Spatial distribution of drought monitored by CI-based drought indices in July from 2002 to 2011.

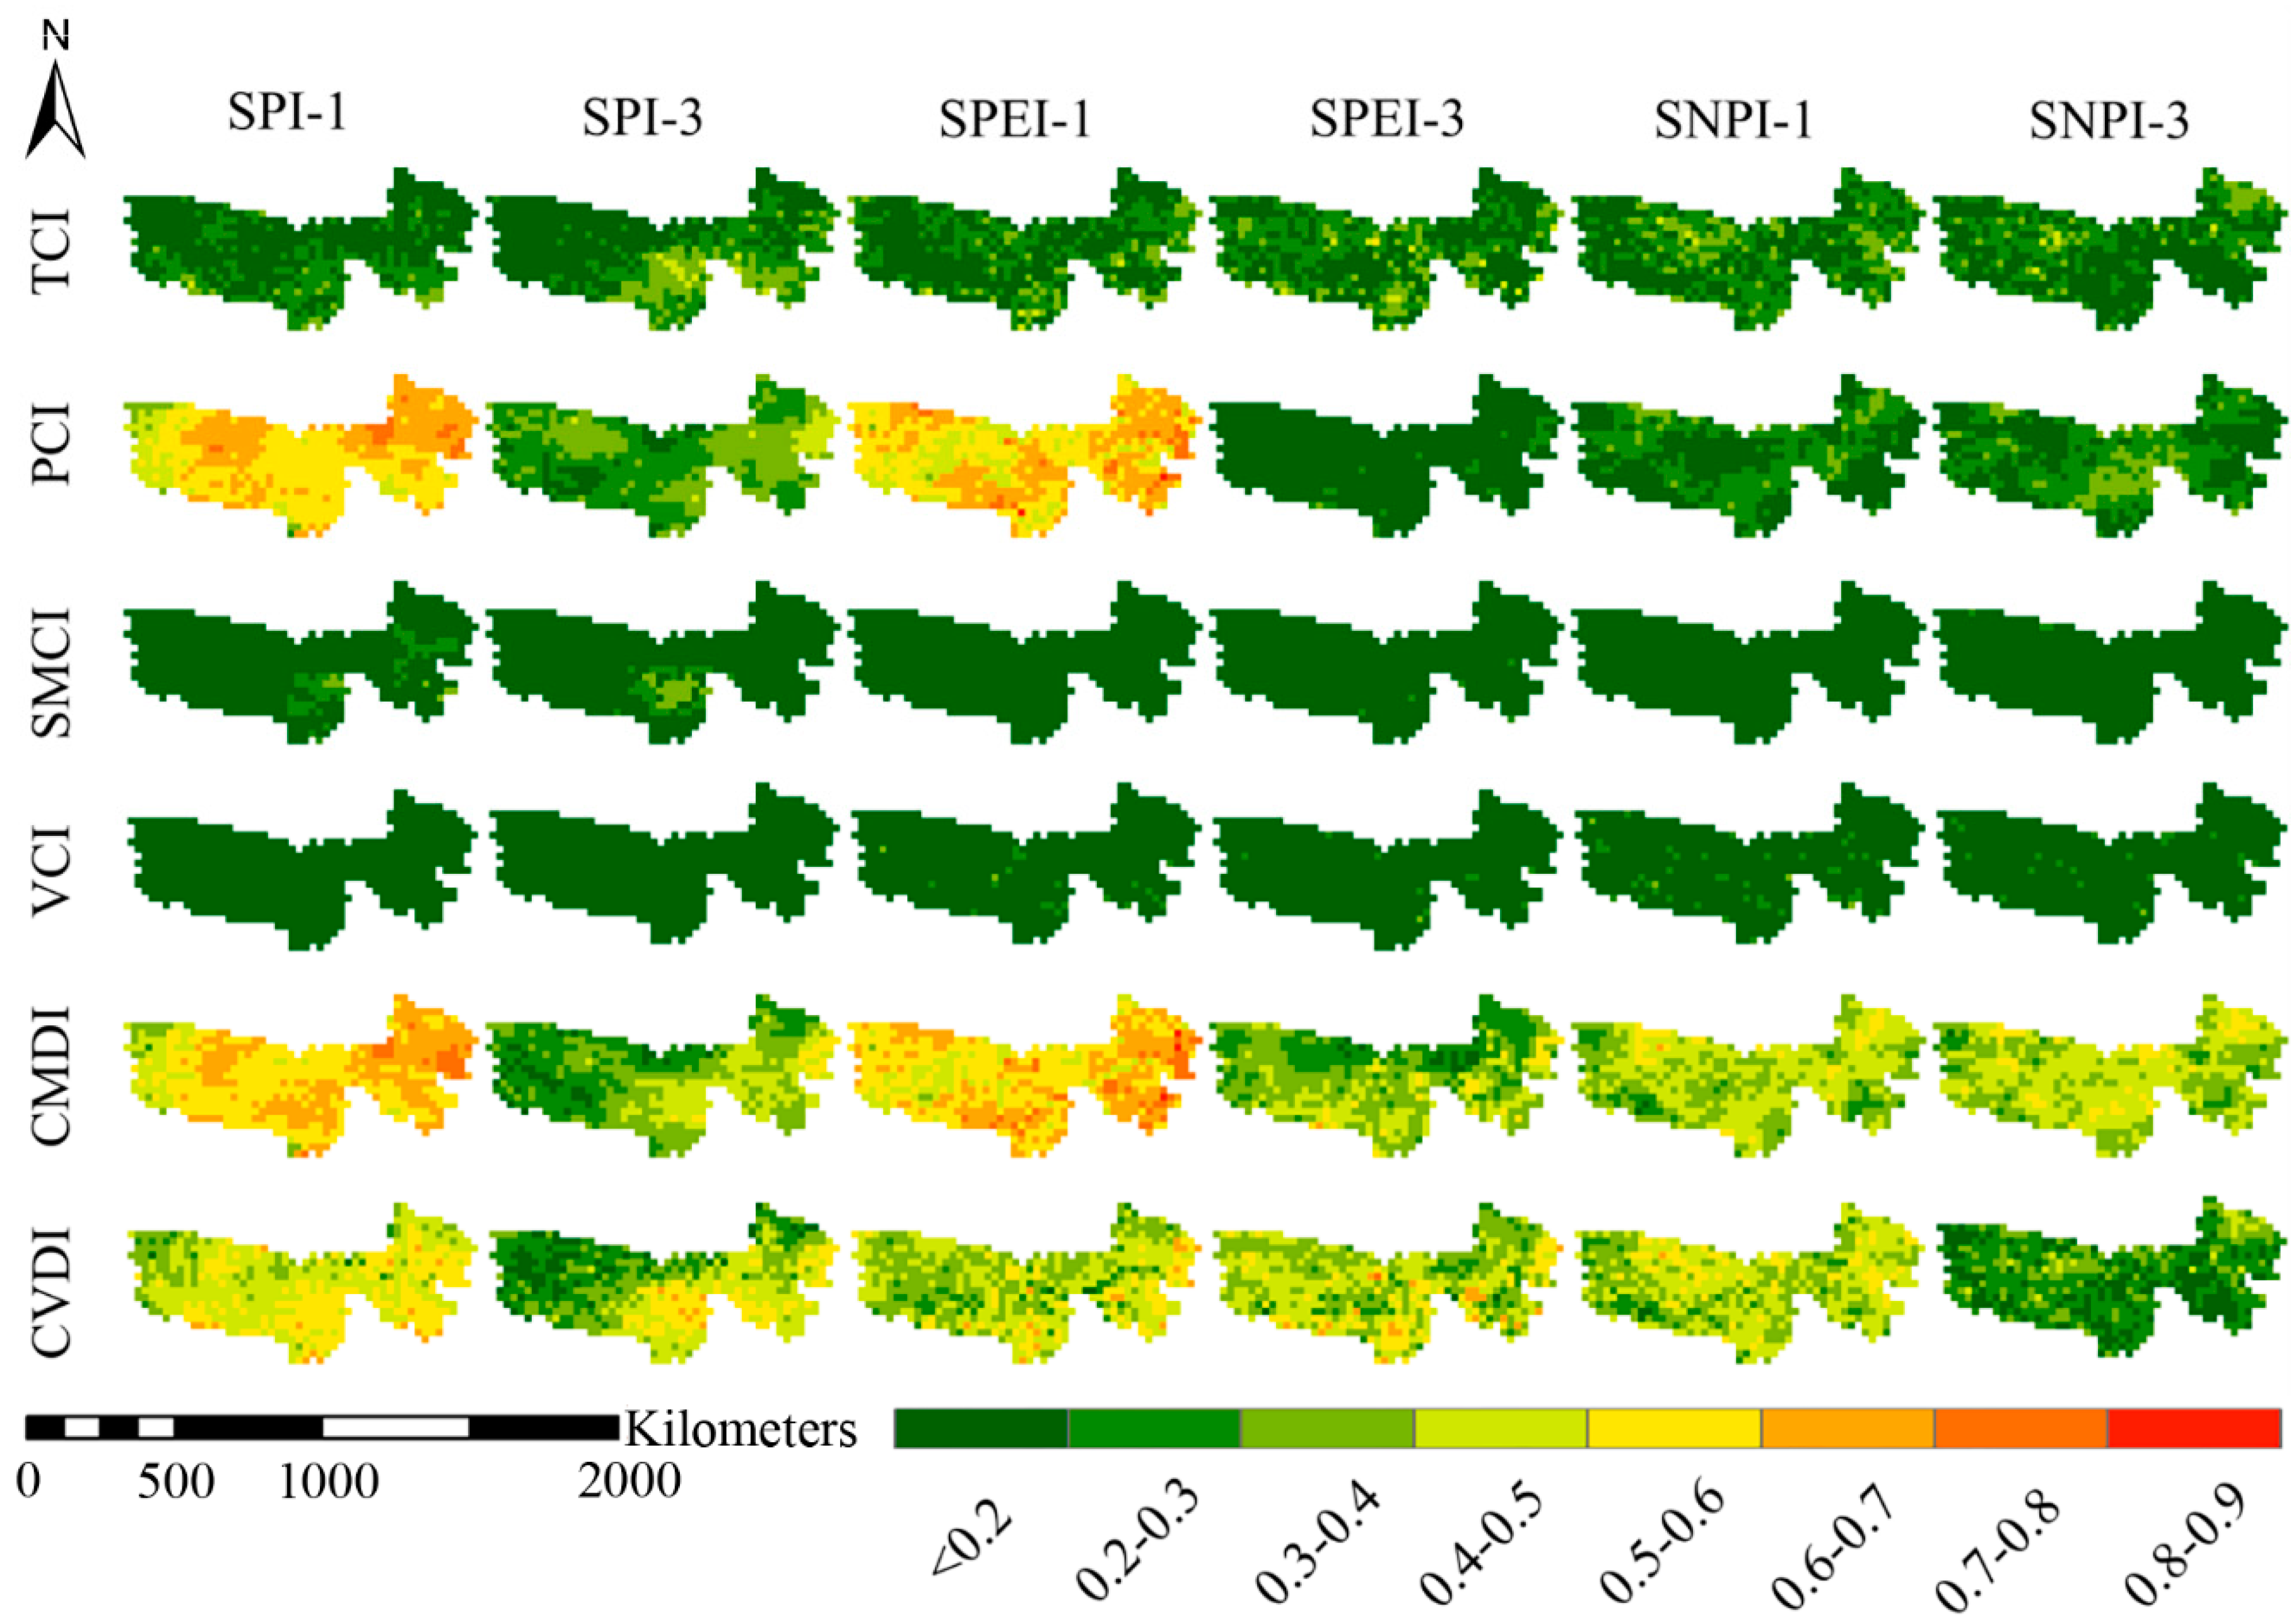
Figure 5.
Correlation coefficients (r) between CI-based drought indices (columns) and in situ drought indices (rows) (a) monthly correlations, (b) monthly correlations in the growing season, (c) monthly correlations in non-growing season.
Figure 5.
Correlation coefficients (r) between CI-based drought indices (columns) and in situ drought indices (rows) (a) monthly correlations, (b) monthly correlations in the growing season, (c) monthly correlations in non-growing season.

Figure 6.
Monthly correlation coefficients between the CI-based drought indices and in situ drought indices.
Figure 6.
Monthly correlation coefficients between the CI-based drought indices and in situ drought indices.

Figure 7.
Frequency distribution of monthly remote sensing data used in this study across the TRHR (a) Precipitation, (b) Temperature, (c) Soil moisture and (d) NDVI.
Figure 7.
Frequency distribution of monthly remote sensing data used in this study across the TRHR (a) Precipitation, (b) Temperature, (c) Soil moisture and (d) NDVI.


Table 1.
General information on the meteorological stations in the TRHR.
| Station Name | Longitude (° E) | Latitude (° N) | Elevation (m) |
|---|---|---|---|
| Jiangxigou | 100.29 | 36.35 | 3201 |
| Gonghe | 100.37 | 36.16 | 2835 |
| Guide | 101.22 | 36.01 | 2237 |
| Huangzhong | 101.35 | 36.3 | 2668 |
| Wudaoliang | 93.05 | 35.13 | 4612 |
| Shazhuyu | 100.16 | 36.16 | 2872 |
| Xinghai | 99.59 | 35.35 | 3323 |
| Guinan | 100.44 | 35.35 | 3120 |
| Tongde | 100.36 | 35.15 | 3148 |
| Jianzha | 102.01 | 35.56 | 2086 |
| Zeku | 101.28 | 35.02 | 3663 |
| Xunhua | 102.27 | 35.51 | 1921 |
| Tongren | 102.01 | 35.31 | 2491 |
| Tuotuohe | 92.26 | 34.13 | 4533 |
| Zhiduo | 95.37 | 33.51 | 4179 |
| Zaiduo | 95.17 | 32.53 | 4066 |
| Qumalai | 95.48 | 34.07 | 4175 |
| Yushu | 96.58 | 33.00 | 3717 |
| Maduo | 98.13 | 34.55 | 4272 |
| Qingshuihe | 97.08 | 33.48 | 4415 |
| Maxin | 100.14 | 34.29 | 3719 |
| Gande | 99.54 | 33.58 | 4050 |
| Dari | 99.39 | 33.45 | 3968 |
| Henan | 101.36 | 34.44 | 3500 |
| Jiuzhi | 101.29 | 33.26 | 3629 |
| Nangqian | 96.28 | 32.12 | 3644 |
Table 2.
Correlations of Combined Meteorological Drought Index (CMDI) and Combined Vegetation drought (CVDI) with in situ drought indices.
Table 2.
Correlations of Combined Meteorological Drought Index (CMDI) and Combined Vegetation drought (CVDI) with in situ drought indices.
| Index | Percent | SPI-1 | SPI-3 | SPI-6 | SPEI-1 | SPEI-3 | SPEI-6 | SPNI-1 | SNPI-3 | SNPI-6 | |||
|---|---|---|---|---|---|---|---|---|---|---|---|---|---|
| TCI | PCI | SMCI | VCI | ||||||||||
| CMDI | 29.00% | 64.00% | 7.00% | - | 0.70 | 0.44 | 0.32 | 0.73 | 0.53 | 0.31 | 0.58 | 0.32 | 0.31 |
| CVDI | 65.00% | 26.00% | 6.00% | 4.00% | 0.57 | 0.49 | 0.34 | 0.65 | 0.63 | 0.40 | 0.56 | 0.34 | 0.32 |
Table 3.
Classification of drought severity for the CI-based drought indices used in this study.
| Name | PCI | TCI | SMCI | VCI | CMDI | CVDI |
|---|---|---|---|---|---|---|
| Extreme drought | 0–0.1 | 0–0.1 | 0–0.1 | 0–0.1 | 0–0.1 | 0–0.1 |
| Severe drought | 0.1–0.2 | 0.1–0.2 | 0.1–0.2 | 0.1–0.2 | 0.1–0.2 | 0.1–0.2 |
| Moderate drought | 0.2–0.3 | 0.2–0.3 | 0.2–0.3 | 0.2–0.3 | 0.2–0.3 | 0.2–0.3 |
| Mild drought | 0.3–0.4 | 0.3–0.4 | 0.3–0.4 | 0.3–0.4 | 0.3–0.4 | 0.3–0.4 |
| Abnormally dry | 0.4–0.5 | 0.4–0.5 | 0.4–0.5 | 0.4–0.5 | 0.4–0.5 | 0.4–0.5 |
| No drought | 0.5–1 | 0.5–1 | 0.5–1 | 0.5–1 | 0.5–1 | 0.5–1 |
© 2019 by the authors. Licensee MDPI, Basel, Switzerland. This article is an open access article distributed under the terms and conditions of the Creative Commons Attribution (CC BY) license (http://creativecommons.org/licenses/by/4.0/).
Share and Cite
MDPI and ACS Style
Wang, K.; Li, T.; Wei, J. Exploring Drought Conditions in the Three River Headwaters Region from 2002 to 2011 Using Multiple Drought Indices. Water 2019, 11, 190. https://doi.org/10.3390/w11020190
AMA Style
Wang K, Li T, Wei J. Exploring Drought Conditions in the Three River Headwaters Region from 2002 to 2011 Using Multiple Drought Indices. Water. 2019; 11(2):190. https://doi.org/10.3390/w11020190
Chicago/Turabian StyleWang, Keyi, Tiejian Li, and Jiahua Wei. 2019. "Exploring Drought Conditions in the Three River Headwaters Region from 2002 to 2011 Using Multiple Drought Indices" Water 11, no. 2: 190. https://doi.org/10.3390/w11020190
Note that from the first issue of 2016, this journal uses article numbers instead of page numbers. See further details here.