Climate-Driven High Primary Production and Contrasting Export Production in the Eastern North Pacific Subtropical Gyre
 Joo-Eun Yoon
 Ju-Hyoung Kim
 Il-Nam Kim
- 1Department of Marine Science, Incheon National University, Incheon, South Korea
- 2Department of Aquaculture and Aquatic Sciences, Kunsan National University, Gunsan, South Korea
The eastern North Pacific subtropical gyre (NPSG) contributes significantly to global primary production (PP) and export production (EP). In this study, we have investigated the impact of the North Pacific gyre oscillation (NPGO) mode on the temporal changes in the relationship between PP and EP in the eastern NPSG, using long-term time series of oceanographic observations at Station ALOHA. The positive NPGO phases (N2+: 1998–2004, N4+: 2007–2013), exhibiting a deeper mixed layer depth (MLD), coincided with high PP. Moreover, the N2+ phase showed high EP, associated with an increase in the nano-sized phytoplankton group, and inorganic and organic nitrogen-to-phosphorus ratios. However, multiple physical and biogeochemical factors, such as thermocline depression, increase in pico-sized phytoplankton groups, smallest-sized mesozooplankton, and heterotrophic bacteria, have induced low EP during the N4+ phase, despite deep MLD and increased PP conditions. Enhanced stratification under prolonged warming indicates that the surface eastern NPSG may experience a permanent shift toward small cells.
Introduction
The eastern region of the North Pacific subtropical gyre (NPSG), a well-known crucial open-ocean ecosystem, is characterized by basin-scale ocean circulation. Therefore, the physical characteristics of the water column and the biological productivity in the eastern NPSG can be directly and indirectly attributed to the variations in the two leading North Pacific climate modes: the Pacific decadal oscillation (PDO; which is primarily associated with the changes in the strength of the Aleutian low-pressure system) and the North Pacific gyre oscillation (NPGO; which is directly connected to the variations in the north-south dipole pattern of sea-level pressure) (Mantua et al., 1997; Di Lorenzo et al., 2008; Lukas and Santiago-Mandujano, 2008; Chhak et al., 2009; Messié and Chavez, 2011; Letelier et al., 2019) (detailed summary of the physical–biogeochemical–ecological conditions associated with the PDO and NPGO can be found in Supplementary Table 1). Previous studies have reported that the PDO is closely related to the interannual variations in sea surface temperature (T) anomalies in the eastern NPSG (Miller et al., 1994; Mantua et al., 1997; Johnstone and Mantua, 2014); however, biological responses may have a weak connection with PDO (Bond et al., 2003; Di Lorenzo et al., 2008; Dave and Lozier, 2010; Saba et al., 2010). Meanwhile, recent studies have revealed that the NPGO develops favorable physical conditions for phytoplankton growth by enhancing nutrient supply to the surface layer (i.e., euphotic zone), resulting from deep mixed layer depths (MLDs) through wind forcing and lateral advection by highly saline waters (Di Lorenzo et al., 2008; Chhak et al., 2009; Dave and Lozier, 2010; Saba et al., 2010; Valencia et al., 2016). However, a few intensive and integrated studies of NPGO-driven biogeochemical factors, such as biological productivity and nutrient dynamics, have been conducted.
The primary production (PP) is the total amount of organic matter produced by phytoplankton in the surface layer, and the fraction of PP exported from the surface layer is called “export production” (EP) or “biological pump” (Falkowski et al., 2003). Owing to the large proportion of the ocean surface, the eastern NPSG contributes significantly to global PP and EP. Hence, it is crucial to understand the temporal variations in the relationship between PP and EP in the eastern NPSG (Emerson et al., 1997; Karl, 1999). Previous studies have revealed that deep carbon sequestration occurs in the eastern NPSG, indicating high efficiency of EP via low remineralization in surface waters, thereby rapidly sinking the particles into the deep (Eppley and Peterson, 1979; Scharek et al., 1999; Karl et al., 2012; Mouw et al., 2016). However, detailed information regarding temporal changes in the relationship between PP and EP and its controlling factors in the eastern NPSG is lacking. Furthermore, both climate change and anthropogenic effects are aggravating in this region, thereby creating increasingly complex and unpredictable ocean ecosystems (Barnett et al., 2005; Pörtner et al., 2019; Litzow et al., 2020).
In this study, we investigated (1) how the relationship between PP and EP has evolved in relation to the NPGO mode, and (2) what factors have changed from high PP and EP (i.e., “coupling”) to high PP and low EP (i.e., “uncoupling”) conditions, using long-term time series of oceanographic observations conducted at Station ALOHA (22.75°N and 158°W), which was established as a site chosen to be representative of the expansive eastern NPSG (Karl and Lukas, 1996).
Data and Methods
Station ALOHA Data
We analyzed the physical and biogeochemical datasets of the eastern NPSG based on water samples obtained by the Hawaii Ocean time-series (HOT) group at Station ALOHA at approximately monthly intervals starting from January 1992 (Karl, 1999). Station ALOHA data with high temporal resolution were downloaded from the HOT-DOGS website.1 Water samples were collected using a Niskin rosette sampler. All details regarding the data, methods, and programs are publicly available on the HOT program website.2
To understand the response of the physical properties of eastern NPSG to NPGO, the variations in T and salinity (S) in the surface layer (here, defined as 0–100 m) and MLD during the study period were investigated. The potential T and practical S were obtained using a Seabird CTD sensor system (Karl and Lukas, 1996). The monthly average T and S data were calculated from the surface layer after removing the outliers, that is, the data points (i.e., ∼1%) falling above three standard deviations (STDs) from the mean values of climatological data over the study period (Garcia et al., 2013). To quantify the warming trend in the eastern NPSG during the study period, the linear trends of the surface and subsurface T were estimated using a simple least-squares method (Tofallis, 2009). Surface T anomalies were standardized after linear detrending to remove the warming trend. Annual T and S data were calculated by averaging the monthly mean values of each year for the surface layers. The MLD represents the depth marking an offset of 0.125 kg m–3 in the potential density relative to its value at a depth of 10 m (Huang and Russell, 1994). The potential density was estimated as a function of T and absolute S (Millero and Poisson, 1981; Fofonoff and Millard, 1983), where the latter was calculated from practical S (McDougall et al., 2012). To investigate the stratification of the water column, the mean T averaged from the subsurface layer of 100–200 m (T100–200) and the 20°C isothermal depth (Z20), corresponding to the upper thermocline (Sakamoto et al., 2004; White et al., 2007), were estimated using linearly interpolated T profiles.
The biogeochemical and ecological responses of the eastern NPSG to the NPGO mode were analyzed by comparing the variability in biological (PP), geological [contents of sediment-trap-based particulate organic carbon flux (POC150), particulate organic nitrogen flux (PON150), and particulate organic phosphorus flux (POP150)], chemical [dissolved inorganic nitrogen (DIN), dissolved inorganic phosphorus (DIP), low-level nitrate + nitrite (LLN), and low-level phosphate (LLP)], and ecological (surface phytoplankton size fractions, heterotrophic bacteria abundance, and smallest-sized mesozooplankton biomass) factors. To consider the major sources of sinking POC caught in sediment traps deployed at 150 m, we investigated biogeochemical and ecological parameters for the upper 100 m of the water column, which reflect the organic carbon produced in the upper winter MLD (December, January, and February; 81.5 ± 25.8 m) (Lampitt et al., 2008; Yoon et al., 2018).
Primary production samples were measured via the 14C-radiotracer method (Nielsen, 1952) and vertically integrated into the upper 100 m following linear interpolation of the values from sampling depths (≥4), using the values between the first sampling point from 10 m and the last sampling point within 120–180 m.
Phytoplankton-sized structures were estimated from pigment data measured via high-performance liquid chromatography (HPLC) (Wright et al., 2005). The chlorophyll-a (Chl-a) biomass of individual phytoplankton communities (e.g., Chl-a of Prochlorococcus is defined as Chl-aProchlorococcus) was estimated from pigment algorithms (Andersen et al., 1996) using the biomarker pigment HPLC data of individual phytoplankton communities (i.e., all five taxa) in the surface layer, that is, divinyl Chl-a (Prochlorococcus), 19′-hexanoyloxyfucoxanthin (haptophytes), 19′-butanoyloxyfucoxanthin (pelagophytes), fucoxanthin (diatoms), and peridinin (dinoflagellates) (Wright et al., 2005). Phytoplankton-sized Chl-a biomass was estimated as the Chl-a biomass of each group based on all five taxa, namely, pico-sized group (0.2–2 μm; Chl-aProchlorococcus), nano-sized group (2–20 μm; a sum of Chl-aHaptophytes and Chl-aPelagophytes), and micro-sized group (20–200 μm; a sum of Chl-aDiatoms and Chl-aDinoflagellates). Phytoplankton-sized fractions (%) were estimated as the Chl-a contribution of each group (i.e., pico-, nano-, and micro-) to the total group (a sum of Chl-aProchlorococcus, Chl-aHaptophytes, Chl-aPelagophytes, Chl-aDiatoms, and Chl-aDinoflagellates). Three different phytoplankton-sized groups comprised 61, 34, and 5% of the total phytoplankton, respectively. The abundances of surface heterotrophic bacteria and Prochlorococcus were determined via dual-beam flow cytometry (Monger and Landry, 1993; Campbell et al., 1994). Phytoplankton-sized Chl-a biomass and abundance were averaged over the upper 100 m.
Mesozooplankton was collected using oblique tows of a plankton net of 1 m2 (202-μm mesh netting) from the surface to 200 m (Landry et al., 2001; Landry, 2002). The dry weight biomass of the mesozooplankton was determined after thawing and oven drying (at 60°C for at least 24 h). The smallest-sized mesozooplankton (i.e., 0.2–0.5 mm) was sorted by gently wet sieving through nested Nitex screens of 0.5 and 0.2 mm.
We estimated POC150, PON150, and POP150 contents collected at 150 m in a free-floating sediment trap array designed to hold 12 replicate cylindrical traps (Karl et al., 1996). To investigate the efficiency of the “biological pump,” the EP ratio (%) was estimated as the ratio of monthly mean POC150 to monthly mean PP (Eppley and Peterson, 1979; Dunne et al., 2007). PON150:POP150 was calculated as the ratio of monthly PON150 to monthly POP150. Annual ratios were calculated as the mean of the monthly ratios.
Surface DIN and DIP concentrations were determined colorimetrically using an autoanalyzer (Dore et al., 1996; Karl and Lukas, 1996). We calculated the monthly surface ratio of DIN to DIP (i.e., DIN:DIP) from monthly mean nutrient concentrations averaged over the upper 100 m. Annual averaged DINs:DIPs were calculated by averaging the monthly mean DIN:DIP. As the surface eastern NPSG is extremely nutrient-limited, the nutrients were analyzed at nanomolar levels, that is, LLN and LLP, which are typically detected using high-sensitivity analytical techniques (Cox, 1980; Karl and Tien, 1992). The nutrient data of the surface layer were averaged after removing the outliers, that is, points lying at more than three STDs from the climatological averages (Garcia et al., 2013).
Climate Modes
The PDO index, the first leading mode of T in the North Pacific Ocean, was obtained from the University of Washington3 (Mantua et al., 1997). The NPGO index, the second leading mode of the Northeast Pacific sea surface height (SSH), was obtained from the Georgia Institute of Technology4 (Di Lorenzo et al., 2008).
Statistical Analysis
To remove any potential seasonal weighting of observational datasets at the ALOHA station driven by non-uniform sampling intervals, uniform physical and biogeochemical time series of monthly intervals was generated by filling the missing data points with linear interpolation using MATLAB (fillmissing function, version R2019a, MathWorks). Furthermore, monthly physical and biogeochemical parameters were analyzed with removed seasonality using MATLAB’s seasonal adjustment function of an additive decomposition model (Findley et al., 1998).
To compare the physical and biogeochemical parameters between the phases of the NPGO mode, an average threshold for the study period (1992–2018) was applied to define the high and low values of each parameter. For statistical comparisons, a statistical concept Z-score (i.e., Zi = (xi−μ)/σ, where xi = measured value, μ = mean, and σ = STD) was calculated (Kreyszig, 2009). The (+) or (−) signs of the Z-scores indicate whether the measured values are above the mean (i.e., positive) or below the mean (i.e., negative), respectively. The sum of Z-scores was calculated by summing the Z-score values during each phase of the NPGO mode. Furthermore, a two-sample Student’s t-test was applied with the null hypothesis that there was no difference in averages between the two groups, using MATLAB’s ttest2 function (MathWorks, 2021).
Results and Discussion
High Primary Production and Contrasting Export Production During the Periods of Positive North Pacific Gyre Oscillation Phases
The role of the NPGO mode in driving the physical features that stimulate phytoplankton growth in the surface waters of the eastern NPSG was first investigated (Figure 1). Previous studies have reported that the positive phase of NPGO, which is associated with an intensified high-pressure system over the eastern NPSG (i.e., decrease in SSH), is characterized by cool T, whereas the negative phase exhibits the opposite (see Supplementary Table 1; Di Lorenzo et al., 2008; Chhak et al., 2009). During the study period (1992–2018), the surface eastern NPSG showed five phases in NPGO mode: N1– (1992–1997), N2+ (1998–2004), N3– (2005–2006), N4+ (2007–2013), and N5– (2014–2018) (Figure 1A) (detailed description of other climate modes is provided in Supplementary Text 1 and Supplementary Figure 1). Moreover, the surface water at Station ALOHA shows anomalous shifts from warm to cool T and from low-to-high S conditions (Figure 1B) while transitioning from the negative to positive NPGO (i.e., N1– to N2+ and N3– to N4+; Figure 1A), which is accompanied by increasing intensity of the trade winds (detailed descriptions of NPGO-related physical variations can be found in Supplementary Text 2) (Di Lorenzo et al., 2008; Chhak et al., 2009). Accordingly, during N2+ and N4+ periods, relatively cold and hypersaline conditions would contribute to an apparently deep MLD (>59.5 m) (Figure 1B), providing more favorable conditions for phytoplankton growth, compared to other NPGO phases (Saba et al., 2010). To further investigate the response of the eastern NPSG physical properties to the NPGO mode during the study period, the sums of the Z-scores of T, S, and MLD during each phase of the NPGO mode were analyzed (Supplementary Figures 2a–c). The signs of the Z-scores showed reverse patterns in physical properties between different phases of the NPGO mode, particularly during positive NPGO phases, indicating (+) signs in S and MLD (i.e., hypersaline and deep MLD), which are considered to be important drivers of increasing PP in the eastern NPSG (Di Lorenzo et al., 2008; Chhak et al., 2009; Dave and Lozier, 2010; Saba et al., 2010; Valencia et al., 2016). Therefore, to examine whether both the positive NPGO phases (N2+ and N4+), under deep MLD and hypersaline conditions, were indeed relevant to the increase in PP and EP in the eastern NPSG, compared to the average over the study period, a comparative analysis on changing relationship between PP and EP was performed by focusing on the positive phases of the NPGO.
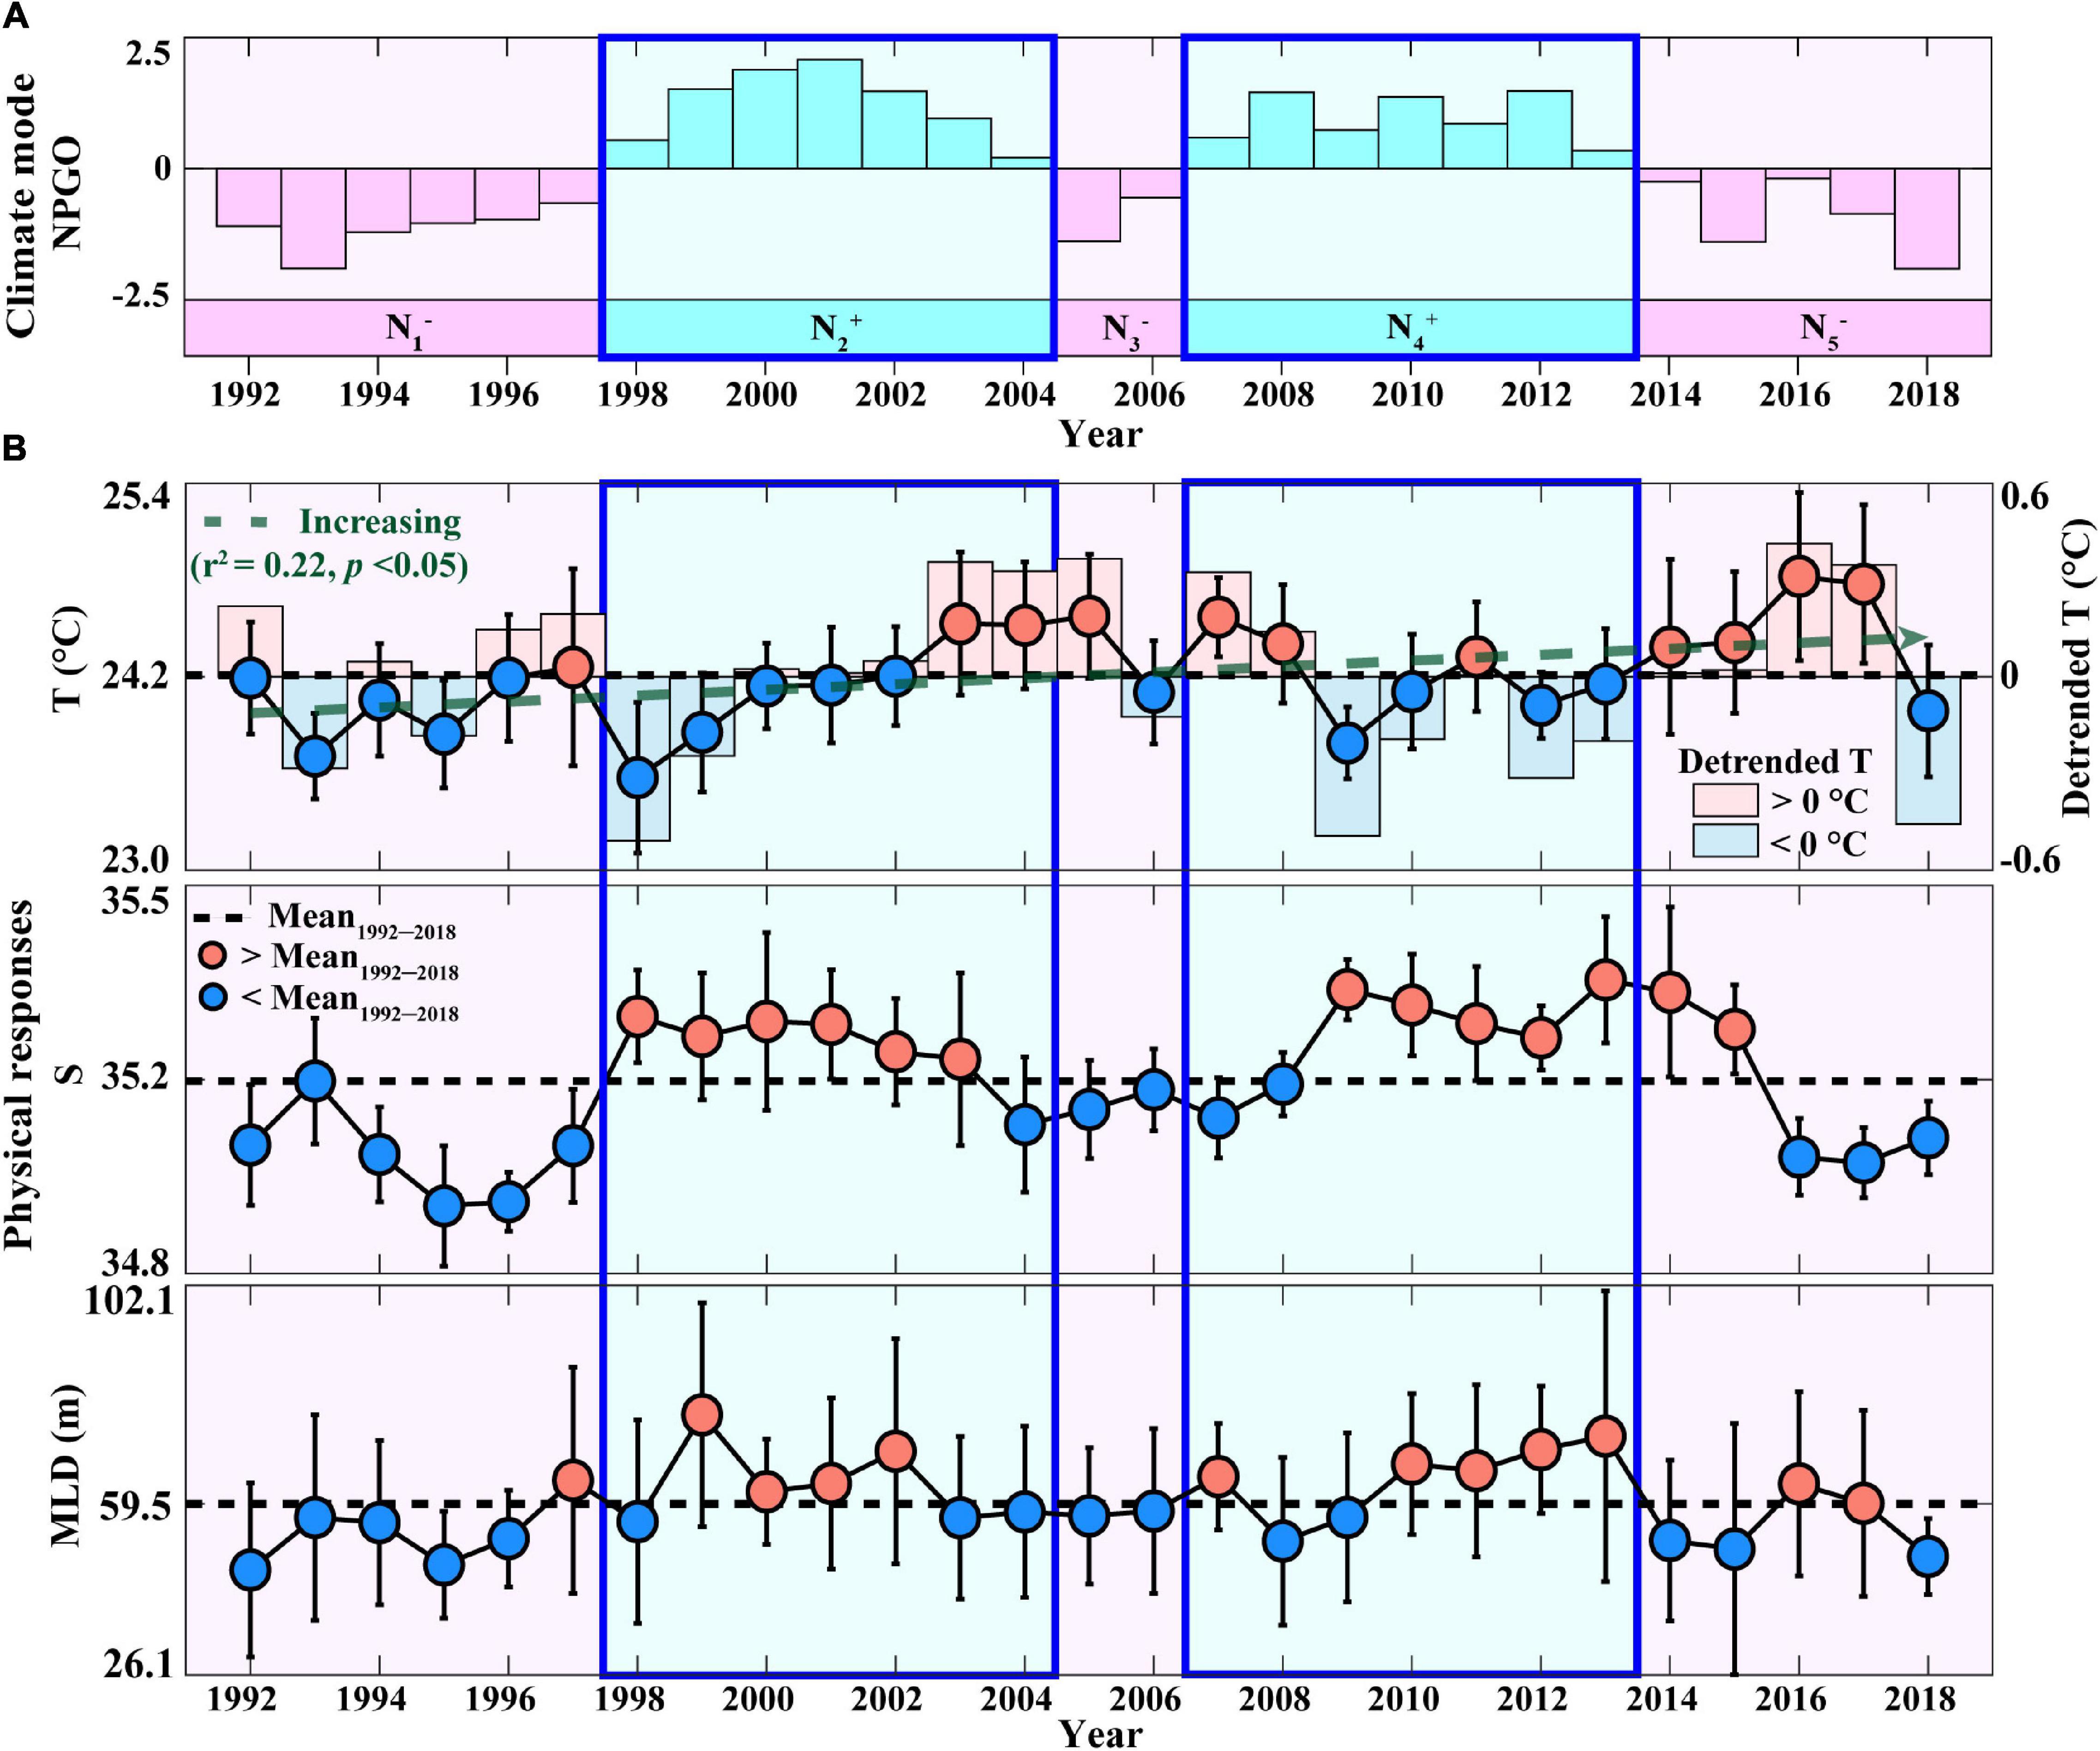
Figure 1. Annual temporal variation in (A) climate mode (NPGO) and (B) physical parameters (T, S, and MLD) measured at Station ALOHA during 1992–2018. In panel A, pink bars indicate negative NPGO phases (N1–, N3–, and N5–), and cyan bars indicate positive NPGO phases (N2+ and N4+). In panel B, the error bars indicate the STDs, the dotted black lines indicate the average during the study period, and the circles indicate annual averages exceeding (red) and lower (blue) than the study period averages. The dotted green line indicates a linear trend in T. The blue and red bars indicate a (–) sign and (+) sign of the detrended T, respectively. NPGO, the North Pacific gyre oscillation; MLD, mixed layer depth.
The periods of N2+ and N4+ phases, exhibiting deep MLDs, coincided with high annual PP relative to the mean annual PP of 497 mg C m–2d–1 (Figure 2A). Although they showed differences in magnitude between the N2+ and N4+ phases, there was no statistically significant difference between the two phases (Supplementary Table 2). The sum of Z-scores of PP during each phase of the NPGO mode also indicated distinct (+) signs (i.e., high PP) during both positive NPGO phases (Supplementary Figure 2d). However, the negative NPGO phases (N1– and N3–), exhibiting shallow MLDs, coincided with (−) signs (i.e., low PP), except for the N5– phase, showing exceptionally high PP values.
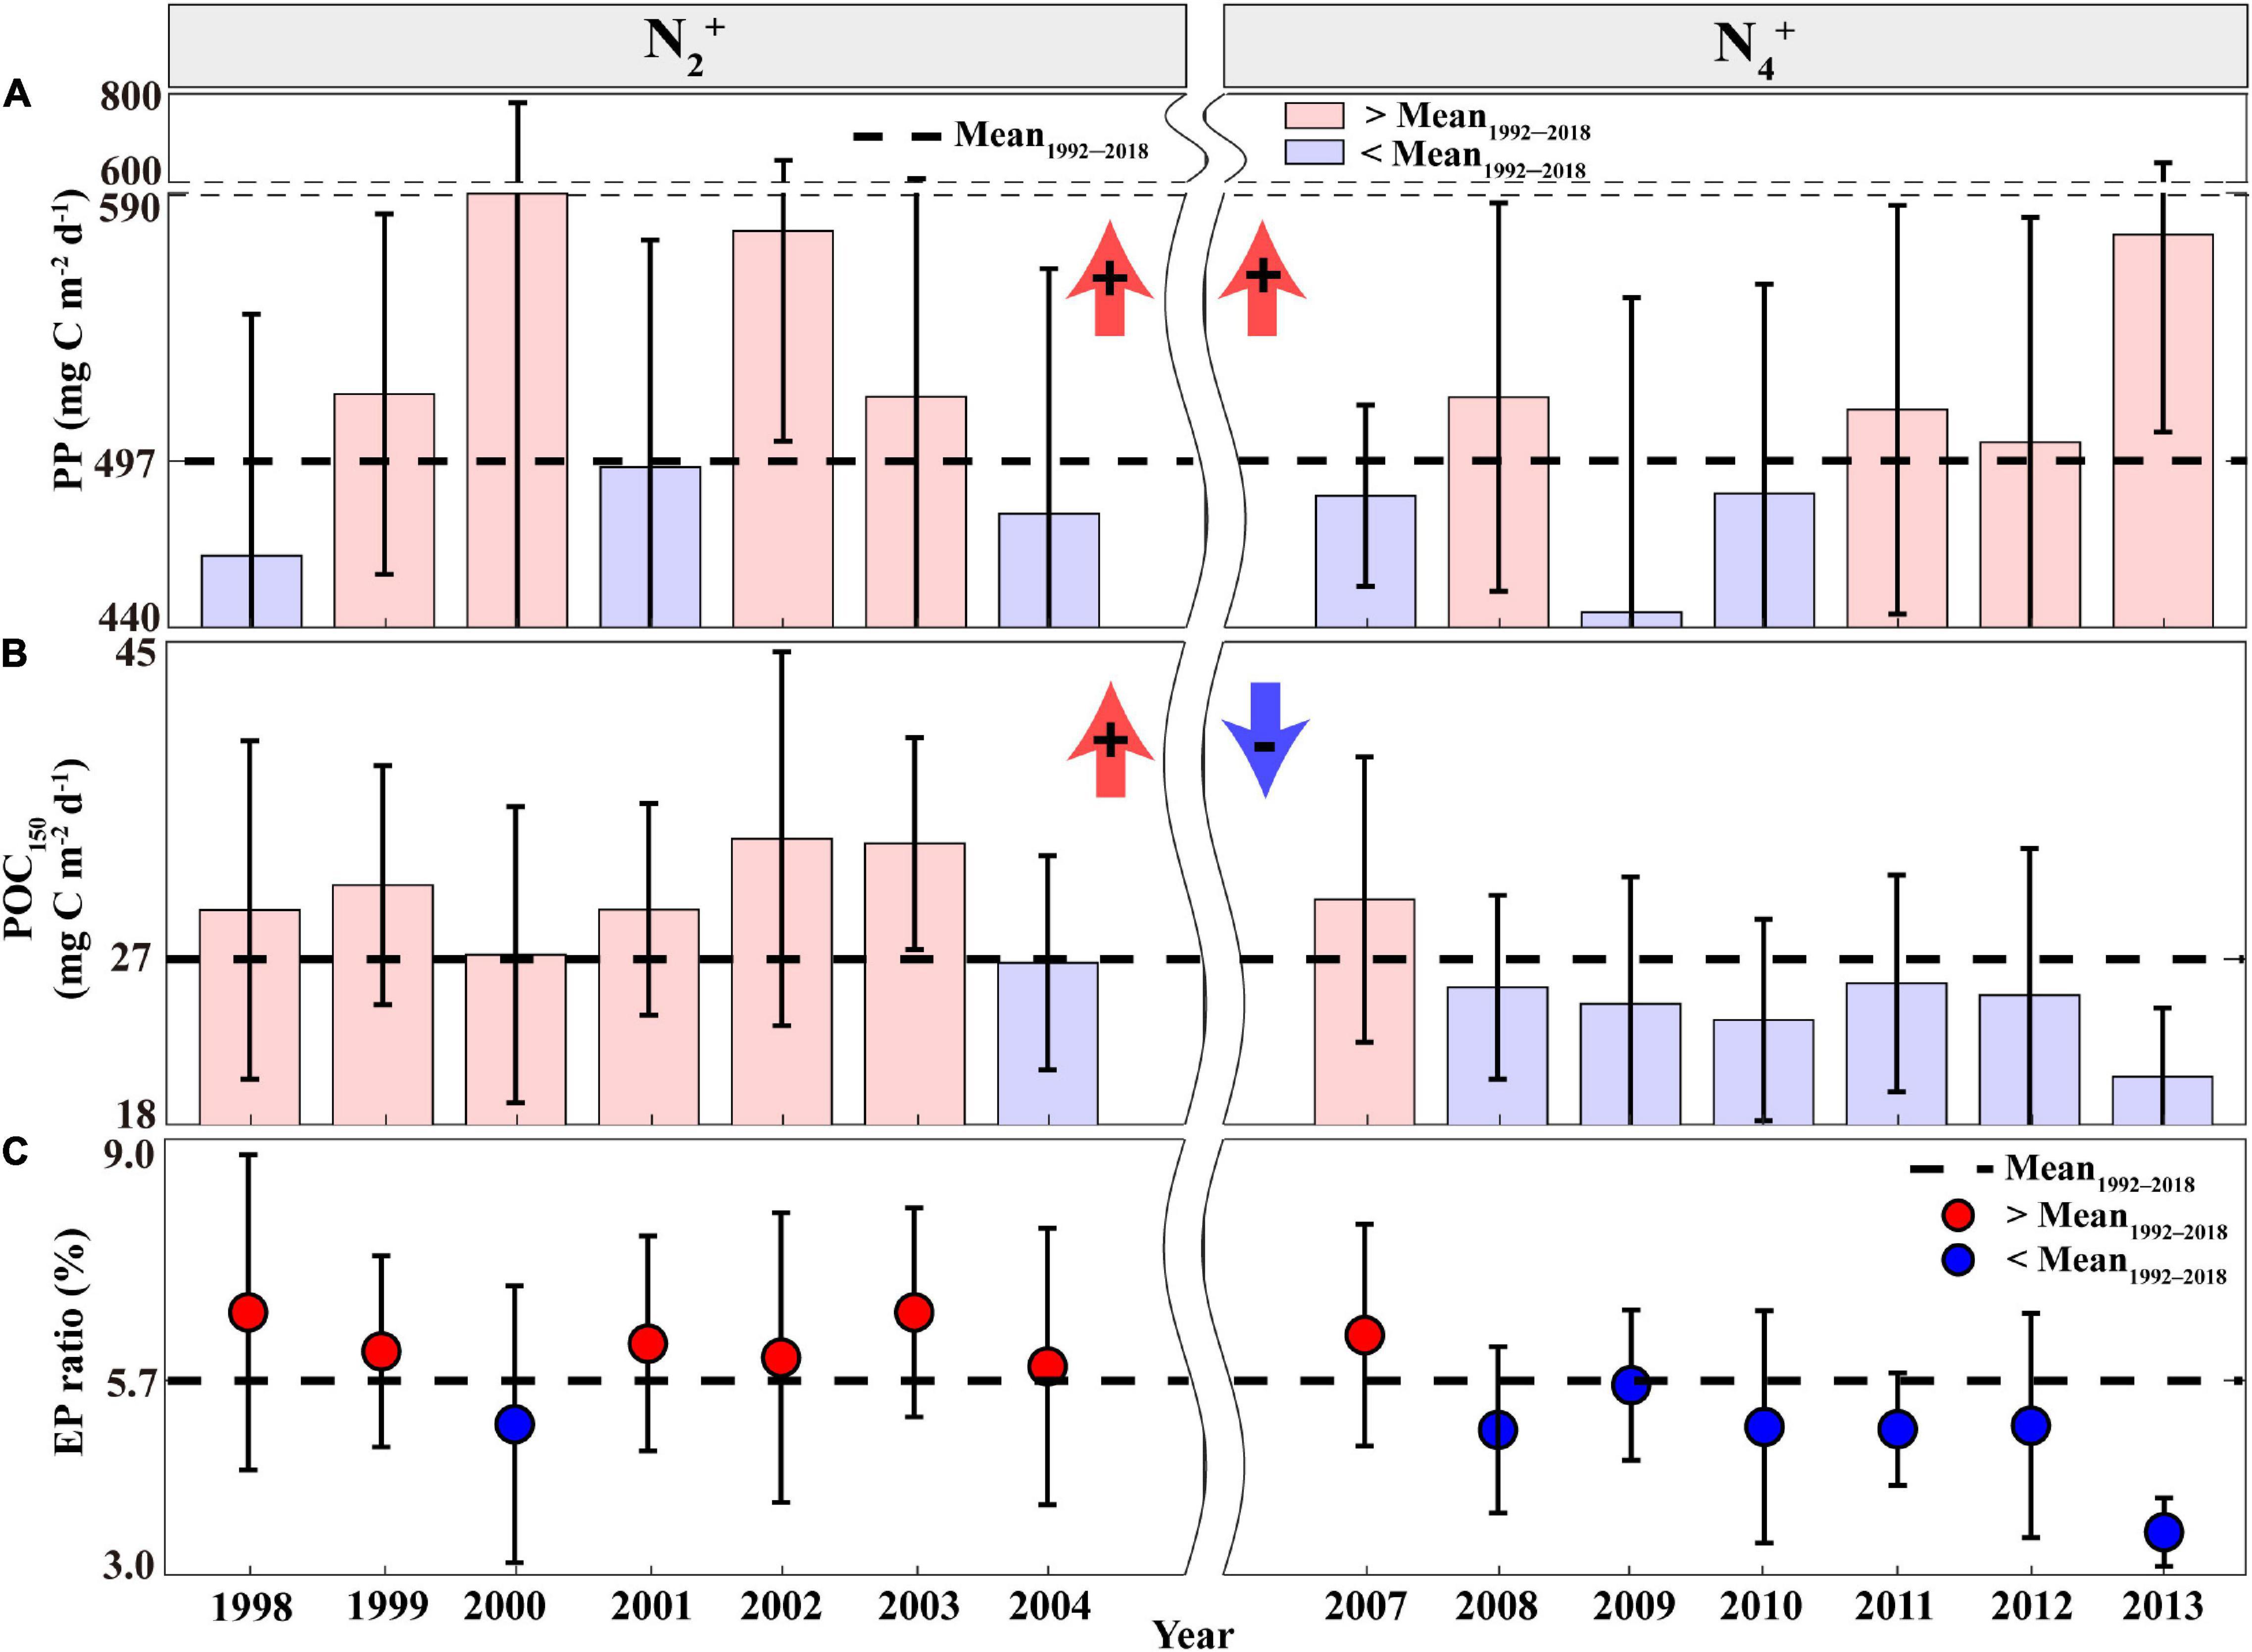
Figure 2. Annual time series of the (A) PP, (B) POC150 flux, and (C) EP ratio measured at Station ALOHA during the N2+ and N4+ phases. Error bars indicate the STDs, the dotted black line indicates the average during the study period, and bars and circles indicate annual averages exceeding (red) and lower (blue) than the study period average, respectively. POC150, particulate organic carbon flux; PP, primary production; EP, export production.
Meanwhile, EP estimates based on POC150 were high (>27 mg C m–2d–1) during the N2+ phase, indicating an enhanced biological pump (Figure 2B). This high POC150 flux period is highly consistent with the period of the deepening MLDs and high PP, suggesting that a large proportion of the POC150 flux was originated in the increased PP (i.e., coupling between PP and EP). However, the N4+ phase exhibited frequent low POC150 flux (<27 mg C m–2d–1) despite the presence of deep MLDs and high PP conditions. There were statistically significant differences in the POC150 flux estimates between the periods of N2+ and N4+ (p < 0.05; Supplementary Table 2 and Supplementary Figure 2e). The EP ratio (represented as POC150 divided by PP) was also used to determine the efficiency of the biological pump in the eastern NPSG (Eppley and Peterson, 1979; Dunne et al., 2007). The average EP ratio for the 1992–2018 period was 5.7%, which is similar to the previous estimates for oligotrophic NPSG (Henson et al., 2011; Herndl and Reinthaler, 2013). As shown in Figure 2C, the frequent high EP ratios (>5.7%) during the N2+ phase indicate an increase in the efficiency of the biological pump. However, the N4+ phase resulted in frequent occurrences of lower values (<5.7%), indicating a significant difference with the N2+ phase (Supplementary Table 2). This result suggests an uncoupling relationship between PP and EP during the N4+ phase.
Factors Causing the Uncoupling Between Primary Production and Export Production During the N4+ Phase
The uncoupling between PP and EP (i.e., high PP and low EP) during the N4+ phase is likely due to rapid remineralization as well as slow sinking of POC in the surface waters (Marsay et al., 2015). Variations in the size of phytoplankton structure have been attributed as a key factor controlling the EP. Large-sized phytoplankton cells (>2 μm) typically have high export efficiency associated with fast sinking particles, whereas small-sized phytoplankton cells (<2 μm) have low export efficiency associated with slow sinking particles (Sathyendranath et al., 2014; Basu and Mackey, 2018; Tréguer et al., 2018). Additionally, EP is regulated via food web processes, such as heterotrophic bacterial activity and zooplankton grazing (Ducklow, 2001; Steinberg et al., 2008; Herndl and Reinthaler, 2013).
The surface waters of the eastern NPSG are constantly characterized by strong stratification and nutrient depletion with an MLD shallower than the nitracline depth (Eppley et al., 1973; Dave and Lozier, 2010). Therefore, the variability of the MLD alone in the eastern NPSG has been considered to have limited influence on the change in the phytoplankton size structure (Karl and Lukas, 1996; Dave and Lozier, 2010). Fluctuations in SSH are also known to be related to the changes in biogeochemical parameters (Uz et al., 2001). However, a recent study reported that PP and EP at Station ALOHA did not correlate with the SSH anomaly, which is associated with the vertical displacement of nutrients (Barone et al., 2019). This highlights that PP and EP variabilities are not related to changes in the position of the pycnocline, but to the injection of nutrients into the euphotic zone associated with the isotherm (or isopycnal) uplift (Sakamoto et al., 2004; Barone et al., 2019). Variations in the thermocline in the North Pacific, which is located near the nitracline, can influence the nutrient flux changes from deep waters to surface waters, resulting in decreased nutrient supply following the deepening of the thermocline and increased nutrient supply following the shallowing of the thermocline (Karl, 1999; Miller et al., 2004; Sakamoto et al., 2004).
Therefore, to investigate the physical and biogeochemical factors that change from high PP and EP (i.e., “coupling”) during the N2+ phase to high PP and low EP (i.e., “uncoupling”) conditions during the N4+ phase, the N2+ vs. N4+ environmental conditions were compared using the variability of the Z20 representing the upper thermocline layer, pigment-based phytoplankton-sized groups, surface DIN:DIP ratios, sediment-trap-based PON150:POP150 ratios, surface heterotrophic bacteria abundance, surface low-level nutrients, and the biomass of the smallest-sized mesozooplankton (i.e., 0.2–0.5 mm).
First, Z20 is significantly deeper (>168.5 m) in the eastern NPSG during the N4+ phase than during the N2+ phase (Figure 3A and Supplementary Table 2). This suggests that a relatively shallow thermocline and deep MLD may have contributed to the high EP ratio during the N2+ phase, likely facilitating the vertical transport of nutrients from within the thermocline to the nutrient-depleted surface waters. However, during the N4+ phase, a low EP ratio may have been caused by the thermocline depression even under a deep MLD of the eastern NPSG, resulting in a decreased upward nutrient flux with the thermocline being relatively far from the MLD (Karl, 1999; Miller et al., 2004; Sakamoto et al., 2004).
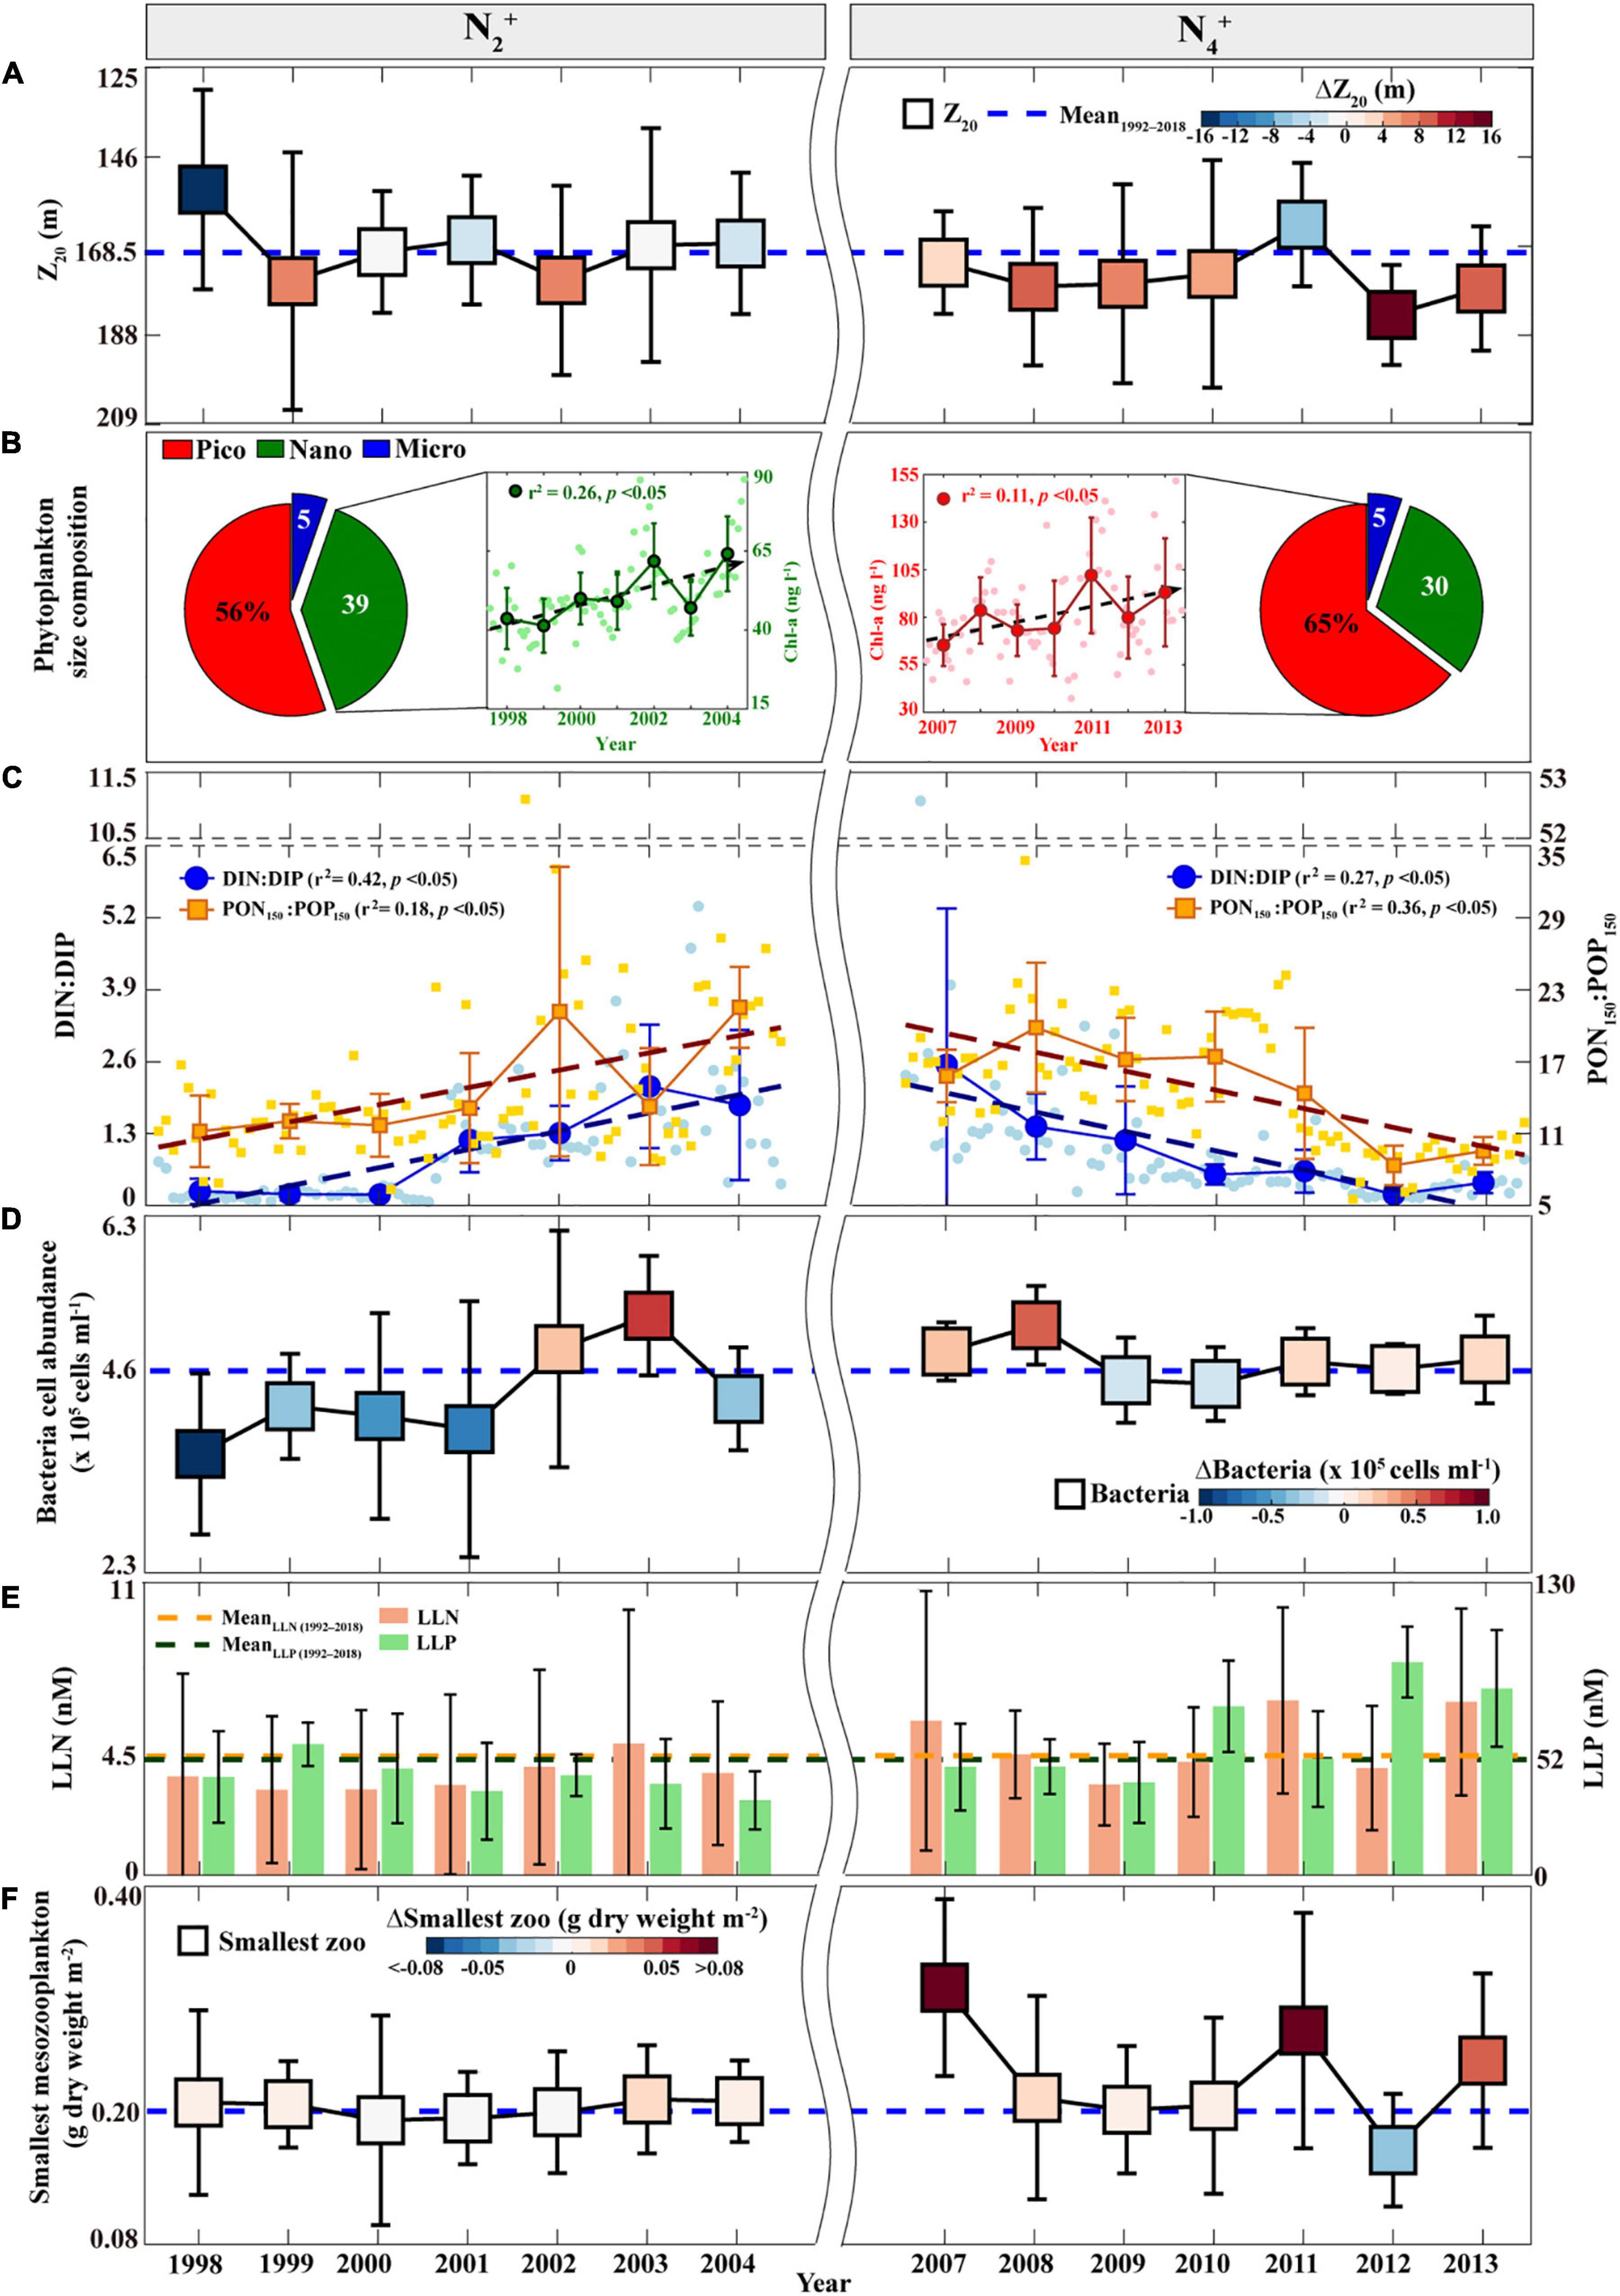
Figure 3. Annual time series of the environmental parameters measured at Station ALOHA during the N2+ and N4+ phases: (A) Z20, in which error bars indicate the STDs, dotted blue line indicates the average during the study period, and color bar indicates ΔZ20 (the annual average minus the average during the study period); (B) Pigment-based phytoplankton-sized fractions averaged during each phase and phytoplankton Chl-a biomass (larger circles; nano-sized phytoplankton during the N2+ phase and pico-sized phytoplankton during the N4+ phase), in which error bars indicate the STDs, dotted lines indicate increasing linear trends, and smaller circles indicate monthly values; (C) DIN:DIP (blue larger circles) and PON150:POP150 (brown larger squares) ratios, in which error bars indicate the STDs, dotted lines indicate linear trends (increasing trends during the N2+ phase and decreasing trends during the N4+ phase), and smaller markers indicate monthly values; (D) Heterotrophic bacteria cell abundances, in which the marker is same as that in panel (A); (E) LLN (orange bars) and LLP (green bars), in which error bars indicate the STDs, the study period average is shown in the corresponding color dotted line; and (F) The smallest-sized mesozooplankton biomass, in which the marker is same as that in panel (A). STD, three standard deviations; PON150, particulate organic nitrogen flux; POP150, particulate organic phosphorus flux; DIN, dissolved inorganic nitrogen; DIP, dissolved inorganic phosphorus; LLN, low-level nitrate + nitrite; LLP, low-level phosphate.
Second, the pigment-based phytoplankton-sized groups (i.e., three different phytoplankton-sized groups; pico-sized group: 0.2–2 μm, nano-sized group: 2–20 μm, and micro-sized group: 20–200 μm) also vary in magnitude between the N2+ and N4+ phases (Figure 3B). The mean fraction of the pico-sized phytoplankton group was increased by ∼10% during the N4+ phase, whereas that of the nano-sized phytoplankton group was decreased by ∼10% relative to the N2+ phase. In addition, the cell abundance of the pico-sized phytoplankton Prochlorococcus (as determined by dual-beam flow cytometry) was significantly higher (>1.8 × 10⁵ cells ml–1) during the N4+ phase than during the N2+ phase (Supplementary Figure 3 and Supplementary Table 2). Low levels of Prochlorococcus during the N2+ phase were comparable with the findings from a previous study that showed a decreased abundance of Prochlorococcus was associated with an increase in vertical gradients of inorganic nutrients during the low SSH anomaly, linked to positive NPGO (Barone et al., 2019). Although pico-sized phytoplankton contributes significantly to POC export through aggregation–disaggregation processes (Close et al., 2013), these results suggest that the enhanced EP ratio during the N2+ phase may have been primarily derived from the increase in the relative biomass of the nano-sized phytoplankton group, resulting in the relatively rapid and deep sinking of POC (Figures 2C, 3B). This relationship between the EP ratio and nano-sized phytoplankton supports the emerging important role of nano-sized phytoplankton groups in biological pump functioning in the Northeast Pacific (Juranek et al., 2020). One particular reason for the low EP ratio during the N4+ phase may be the significantly increased contribution of the pico-sized phytoplankton group to the POC150 flux with a simultaneous decrease in the nano-sized phytoplankton group.
Third, the surface DIN:DIP and PON150:POP150 ratios increased continuously during the N2+ phase (DIN:DIP, r2 = 0.42, p < 0.05; PON150:POP150, r2 = 0.18, p < 0.05; Figure 3C), which coincided with an increasing trend in the nano-sized phytoplankton biomass (r2 = 0.26, p < 0.05; Figure 3B). There was no evident trend in the pico-sized phytoplankton biomass (Supplementary Figure 4). In contrast, decreasing trends in the surface DIN:DIP (r2 = 0.27, p < 0.05) and PON150:POP150 (r2 = 0.36, p < 0.05) ratios were observed during the N4+ phase (Figure 3C), accompanied by an increasing trend in pico-sized phytoplankton biomass (r2 = 0.11, p < 0.05; Figure 3B); however, there was no significant trend in nano-sized phytoplankton biomass (Supplementary Figure 4). These results are consistent with previous findings that the biochemical compositions of phytoplankton cells (i.e., carbohydrates, proteins, and lipids contents) are dependent on the water-column nitrogen-to-phosphorus (N:P) ratio, thereby affecting the changes in the size of phytoplankton (Morris et al., 1974; Takagi et al., 2000; Kim et al., 2020). A large-sized phytoplankton group typically has a high protein content under high N:P conditions, whereas a small-sized phytoplankton group has high carbohydrate and lipid contents under low N:P conditions. Phytoplankton pigment composition may also vary not only with changes in the phytoplankton community structure, but also with light quality-related changes (i.e., photoadaptation) (Karl and Church, 2014; Letelier et al., 2017). Previous studies reported that higher phytoplankton pigments in the winter season and around the subsurface occurred based on light adaption (Winn et al., 1995; Karl and Church, 2014; Letelier et al., 2017; Karl et al., 2021). However, the DIN:DIP ratio and pigment data for both the upper part (0–45 m) and lower part (70–100 m) of the surface layer showed temporal coherence (Supplementary Figure 5), indicating that changes in pigment composition and nutrients during N2+ and N4+ phases were not influenced by photoadaptation. Thus, decreasing trends in N:P ratios during the N4+ phase may have caused an increase in the pico-sized phytoplankton group, leading to low EP.
Fourth, during the N2+ phase, the high EP ratio (Figure 2C) was associated with the overall low abundance of surface heterotrophic bacteria (<4.6 × 10⁵ cells ml–1, as determined by dual-beam flow cytometry) (Figure 3D and Supplementary Table 2), implying the low recycling of POC in the upper waters, thereby accompanied by low concentrations of remineralized nutrients (LLN < 4.5 nM and LLP < 52 nM) (Figure 3E and Supplementary Table 2). In contrast, the low EP ratio in the N4+ phase (Figure 2C) coincides with the relatively high abundance of surface heterotrophic bacteria (>4.6 × 10⁵ cells ml–1) and high levels of LLN (>4.5 nM) and LLP (>52 nM) (Supplementary Table 2 and Figures 3D,E), thereby indicating a high dependence on bacterial remineralization rather than POC export.
Fifth, the biomass of smallest-sized mesozooplankton (Figure 3F) varied considerably with that of pico-sized phytoplankton (Figure 3B and Supplementary Figure 3), indicating the direct and indirect dependence of energy transfer to zooplankton on phytoplankton size (Pomeroy, 1974; Azam et al., 1983; Laws et al., 2000). The relatively high contribution of nano-sized phytoplankton during the N2+ phase was associated with a decrease in the biomass of the smallest-sized mesozooplankton group (<0.20 g dry weight m–2); however, the high contribution of pico-sized phytoplankton during the N4+ phase caused an increase in the biomass of the smallest-sized mesozooplankton group (>0.20 g dry weight m–2). This is consistent with previous studies suggesting that small-sized zooplankton feed efficiently on small-sized phytoplankton and that organic material is immediately recycled in surface waters (Sommer et al., 2002; Finkel et al., 2009).
Overall, the results suggest that multiple physical and biogeochemical factors, such as the depression of the thermocline, shift toward the pico-sized phytoplankton group, and increase in smallest-sized mesozooplankton and heterotrophic bacteria, would have induced rapid recycling of organic matter, the grazing pressure increase in the surface water, and subsequent decrease in EP during the N4+ phases, despite the conditions of deep MLD and increased PP.
A recent study reported that euphotic depth-integrated PP exhibited a long-term increasing trend over the 30-year Station ALOHA observation period, which was most likely caused by increasing atmospheric deposition of pollutant nutrients (Karl et al., 2021). Our results also showed high PP values during N5–, even under negative NPGO phases (Supplementary Figure 2d). However, the sum of Z-scores of EP ratio during each phase of the negative NPGO mode indicated a weak (−) sign (i.e., low EP ratio) during N5– phase (Supplementary Figure 6), even under high PP and POC flux conditions (Supplementary Figures 2d,e), but weak (+) signs (i.e., high EP ratio) during N1– and N3– phases (Supplementary Figure 6). A slight decrease in EP ratio during N5– was related to the relatively deep Z20, a slight decrease in the fraction of nano-sized phytoplankton, and an increase in heterotrophic bacteria, smallest mesozooplankton, LLN, and LLP concentrations, compared to that during N1– phase under a relatively high EP ratio condition (Supplementary Figure 6). To understand whether this pattern was loosely modulated by natural climate variability due to accelerating anthropogenic disturbances (Barnett et al., 2005; Pörtner et al., 2019; Litzow et al., 2020), further observation of biogeochemical parameters at the ALOHA station is needed.
On the other hand, the T100–200 exhibited an increase (r2 = 0.3, p < 0.05) throughout the study period (Supplementary Figure 7), implying a gradual decline in nutrient supply to the surface due to enhanced stratification. Accordingly, the EP ratio displayed a significant decreasing trend over the 30-year observation period, probably leading to higher regenerated PP and lower EP due to intensive remineralization processes, despite the conditions of increasing PP and atmospheric deposition (Karl et al., 2021). Therefore, under prolonged warming, the strengthening trend of the subsurface thermal stratification suggests that, even with the positive NPGO phase, the future surface eastern NPSG may likely experience a permanent shift toward small cells, accompanied by strong remineralization via the microbial loop. These shifts may induce a low EP ratio, which represents the low efficiency of the biological pump in the eastern NPSG, eventually contributing less to the global carbon cycle (Figure 4). Therefore, analyzing the changes in the future environmental and ecological conditions of the surface eastern NPSG to climate modes under accelerating anthropogenic effects is significant.
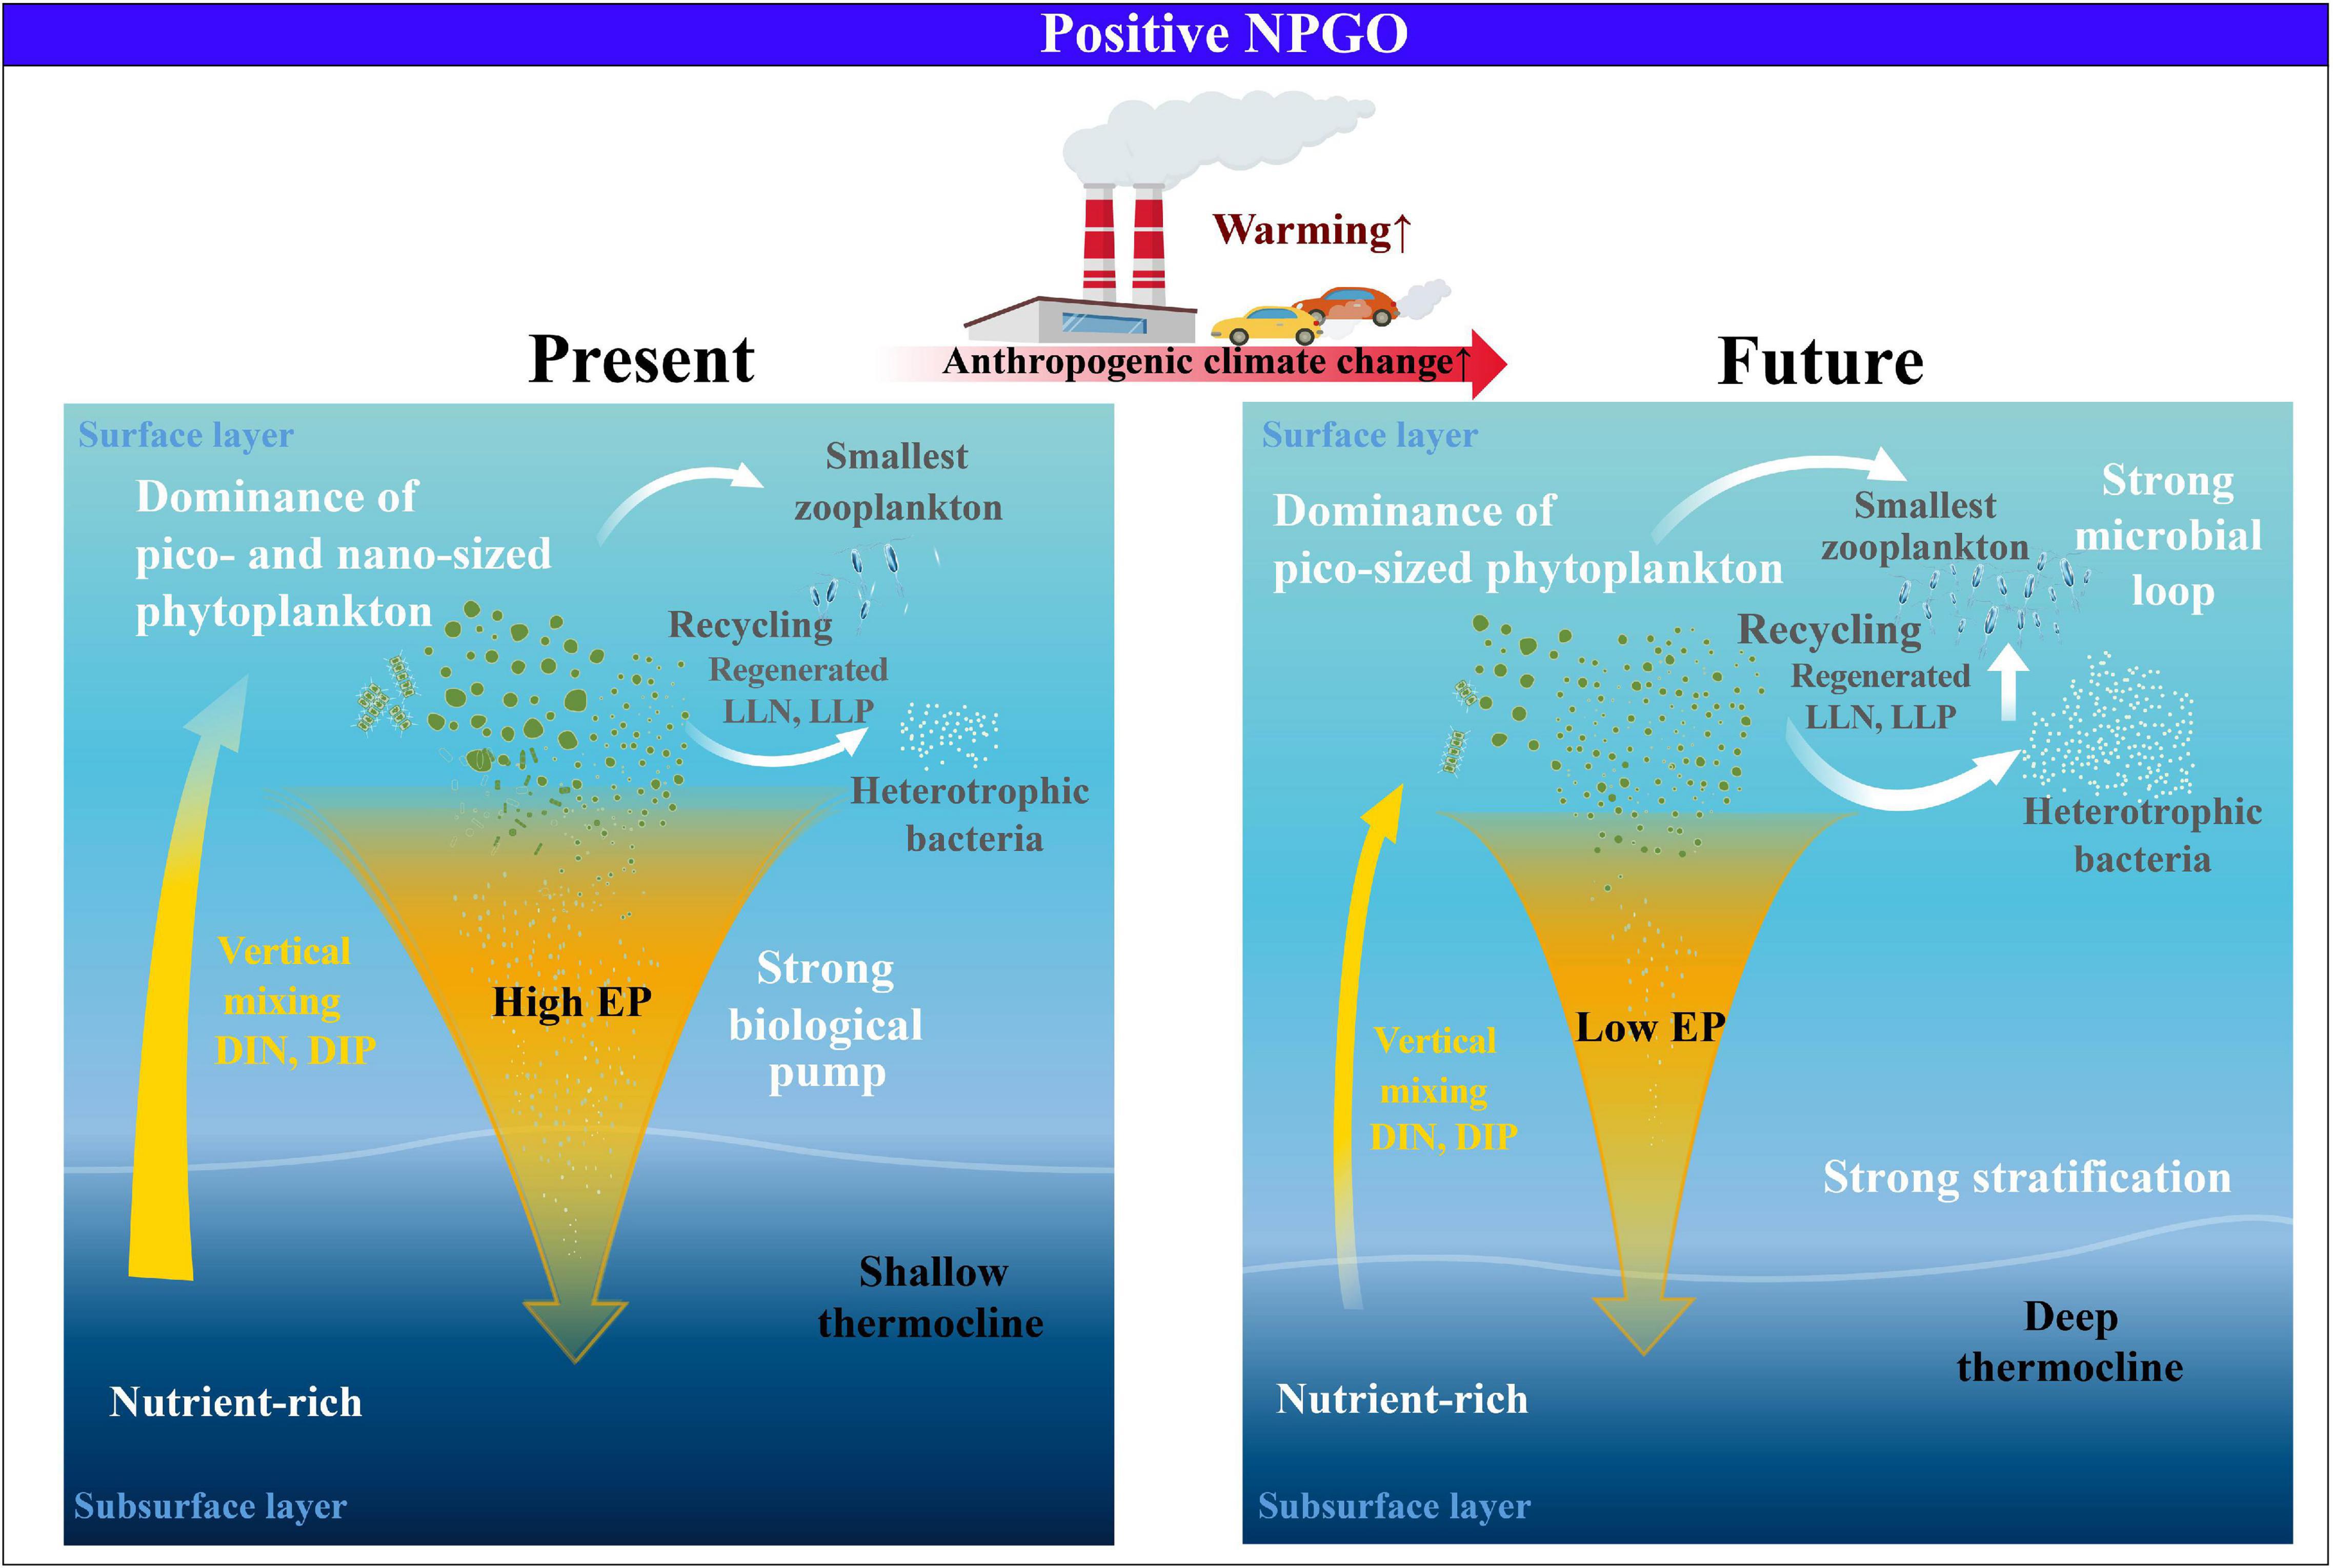
Figure 4. Schematic of the physical–biogeochemical–ecological changes of eastern NPSG in response to future climate change.
Conclusion and Summary
In this study, the impact of positive NPGO phases (N2+: 1998–2004 and N4+: 2007–2013), with deep MLD and increased PP conditions, on the temporal changes in the relationship between PP and EP was investigated using long-term time-series observations of the surface physical and biogeochemical factors in the eastern NPSG. During the N2+ phase, deepened MLD induced high PP and EP, associated with an increase in the nano-sized phytoplankton group and N:P ratios. However, even under deepening MLD and high PP conditions, the N4+ phase was characterized by a low EP. Complex and multiple factors, such as deepening thermocline, increase in the pico-sized phytoplankton group, smallest-sized mesozooplankton, and heterotrophic bacteria abundance, and a decrease in N:P ratios, have induced an uncoupling feature (i.e., high PP and low EP). Thus, under high stratification induced by continuous warming, the results suggest a shift of the surface ecosystem in the eastern NPSG toward small cells, leading to a reduction in the biological pump. Additional observational data are required to improve our understanding and analyses of future changes in the environmental and ecological responses of the eastern NPSG to climate modes under accelerating climate change.
Data Availability Statement
The original contributions presented in the study are included in the article/Supplementary Material, further inquiries can be directed to the corresponding author.
Author Contributions
J-EY and I-NK developed the idea, interpreted the data, and wrote the manuscript. J-EY conducted the literature survey and analysis. All authors discussed and approved the final manuscript.
Funding
This study was supported by a grant from the National Research Foundation of Korea (NRF) funded by the Korean government (MSIT) (NRF-2019R1F1A1051790, NRF-2019R1A4A1026423, and 2020R1A6A3A01099761) and Ministry of Oceans and Fisheries of Korea (20210427).
Conflict of Interest
The authors declare that the research was conducted in the absence of any commercial or financial relationships that could be construed as a potential conflict of interest.
Publisher’s Note
All claims expressed in this article are solely those of the authors and do not necessarily represent those of their affiliated organizations, or those of the publisher, the editors and the reviewers. Any product that may be evaluated in this article, or claim that may be made by its manufacturer, is not guaranteed or endorsed by the publisher.
Acknowledgments
We are sincerely grateful to the editor and the two reviewers. We thank all those who have contributed to the HOT program since 1988.
Supplementary Material
The Supplementary Material for this article can be found online at: https://www.frontiersin.org/articles/10.3389/fmars.2021.710540/full#supplementary-material
Footnotes
- ^ http://hahana.soest.hawaii.edu/hot/hot-dogs/interface.html; last accessed: July 17, 2020
- ^ http://hahana.soest.hawaii.edu/hot/
- ^ http://research.jisao.washington.edu/data_sets/pdo/
- ^ http://www.o3d.org/npgo/npgo.php
References
Andersen, R. A., Bidigare, R. R., Keller, M. D., and Latasa, M. (1996). A comparison of HPLC pigment signatures and electron microscopic observations for oligotrophic waters of the North Atlantic and Pacific Oceans. Deep-Sea Res. Part II Top. Stud. Oceanogr. 43, 517–537. doi: 10.1016/0967-0645(95)00095-X
Azam, F., Fenchel, T., Field, J., Gray, J. S., Meyer, L., and Thingstad, T. F. (1983). The Ecological Role of Water-Column Microbes in the Sea. Mar. Ecol. Prog. Ser. 10, 257–263. doi: 10.3354/meps010257
Barnett, T. P., Pierce, D. W., Achutarao, K. M., Gleckler, P. J., Santer, B. D., Gregory, J. M., et al. (2005). Penetration of Human-Induced Warming into the World’s Oceans. Science 309, 284–287. doi: 10.1126/science.1112418
Barone, B., Coenen, A., Beckett, S. J., McGillicuddy, D. J. Jr., Weitz, J., and Karl, D. (2019). The ecological and biogeochemical state of the North Pacific Subtropical Gyre is linked to sea surface height. J. Mar. Res. 77, 215–245. doi: 10.1357/002224019828474241
Basu, S., and Mackey, K. R. M. (2018). Phytoplankton as Key Mediators of the Biological Carbon Pump: their Responses to a Changing Climate. Sustainability 10:869. doi: 10.3390/su10030869
Bond, N., Overland, J., Spillane, M., and Stabeno, P. J. (2003). Recent shift in the state of the North Pacific. Geophys. Res. Lett. 30:2183. doi: 10.1029/2003GL018597
Campbell, L., Nolla, H. A., and Vaulot, D. (1994). The importance of Prochlorococcus to community structure in the central North Pacific Ocean. Limnol. Oceanogr. 39, 954–961. doi: 10.4319/lo.1994.39.4.0954
Chhak, K. C., Di Lorenzo, E., Schneider, N., and Cummins, P. F. (2009). Forcing of Low-Frequency Ocean Variability in the Northeast Pacific*. J. Clim. 22, 1255–1276. doi: 10.1175/2008JCLI2639.1
Close, H. G., Shah, S. R., Ingalls, A. E., Diefendorf, A. F., Brodie, E. L., Hansman, R. L., et al. (2013). Export of submicron particulate organic matter to mesopelagic depth in an oligotrophic gyre. Proc. Natl. Acad. Sci. U. S. A. 110, 12565–12570. doi: 10.1073/pnas.1217514110
Cox, R. D. (1980). Determination of nitrate and nitrite at the parts per billion level by chemiluminescence. Anal. Chem. 52, 332–335. doi: 10.1021/ac50052a028
Dave, A. C., and Lozier, M. S. (2010). Local stratification control of marine productivity in the subtropical North Pacific. J. Geophys. Res. 115:C12032. doi: 10.1029/2010JC006507
Di Lorenzo, E., Schneider, N., Cobb, K. M., Franks, P. J. S., Chhak, K., Miller, A. J., et al. (2008). North Pacific Gyre Oscillation links ocean climate and ecosystem change. Geophys. Res. Lett. 35:L08607. doi: 10.1029/2007GL032838
Dore, J. E., Houlihan, T., Hebel, D. V., Tien, G., Tupas, L., and Karl, D. M. (1996). Freezing as a method of sample preservation for the analysis of dissolved inorganic nutrients in seawater. Mar. Chem. 53, 173–185. doi: 10.1016/0304-4203(96)00004-7
Ducklow, H. (2001). Upper Ocean Carbon Export and the Biological Pump. Oceanography 14, 50–54. doi: 10.5670/oceanog.2001.06
Dunne, J. P., Sarmiento, J. L., and Gnanadesikan, A. (2007). A synthesis of global particle export from the surface ocean and cycling through the ocean interior and on the seafloor. Glob. Biogeochem. Cycles 21:GB4006. doi: 10.1029/2006GB002907
Emerson, S., Quay, P., Karl, D., Winn, C., Tupas, L., and Landry, M. (1997). Experimental determination of the organic carbon flux from open-ocean surface waters. Nature 389, 951–954. doi: 10.1038/40111
Eppley, R. W., and Peterson, B. J. (1979). Particulate organic matter flux and planktonic new production in the deep ocean. Nature 282, 677–680. doi: 10.1038/282677a0
Eppley, R. W., Renger, E. H., Venrick, E. L., and Mullin, M. M. (1973). A study of plankton dynamics and nutrient cycling in the central gyre of the North Pacific Ocean1. Limnol. Oceanogr. 18, 534–551. doi: 10.4319/lo.1973.18.4.0534
Falkowski, P., Laws, E., Barber, R., and Murray, J. (2003). “Phytoplankton and Their Role in Primary, New, and Export Production,” in Ocean Biogeochemistry, eds M. J. R. Fasham (New York, NY: Springer), 99–121 doi: 10.1007/978-3-642-55844-3_5
Findley, D. F., Monsell, B. C., Bell, W. R., Otto, M. C., and Chen, B.-C. (1998). New Capabilities and Methods of the X-12-ARIMA Seasonal-Adjustment Program. J. Bus. Econ. Stat. 16, 127–152. doi: 10.1080/07350015.1998.10524743
Finkel, Z. V., Beardall, J., Flynn, K. J., Quigg, A., Rees, T. A. V., and Raven, J. A. (2009). Phytoplankton in a changing world: cell size and elemental stoichiometry. J. Plankton Res. 32, 119–137. doi: 10.1093/plankt/fbp098
Fofonoff, N., and Millard, R. (1983). Algorithms for Computation of Fundamental Properties of Seawater. Endorsed by Unesco/SCOR/ICES/IAPSO Joint Panel on Oceanographic Tables and Standards and SCOR Working Group 51. Unesco Technical Papers in Marine Science, No. 44. Paris, France: United Nations Educational, Scientific, and Cultural Organization.
Garcia, H. E., Locarnini, R. A., Boyer, T. P., Antonov, J. I., Baranova, O. K., Zweng, M. M., et al. (2013). “World ocean atlas 2013,” in Volume 4, Dissolved inorganic nutrients (phosphate, nitrate, silicate), ed S. Levitus and A. Mishonov (Silver Spring, Md: NOAA Atlas NESDIS)
Henson, S. A., Sanders, R., Madsen, E., Morris, P. J., Le Moigne, F., and Quartly, G. D. (2011). A reduced estimate of the strength of the ocean’s biological carbon pump. Geophys. Res. Lett. 38:L04606. doi: 10.1029/2011GL046735
Herndl, G., and Reinthaler, T. (2013). Microbial control of the dark end of the biological pump. Nat. Geosci. 6, 718–724. doi: 10.1038/ngeo1921
Huang, R. X., and Russell, S. (1994). Ventilation of the Subtropical North Pacific. J. Phys. Oceanogr. 24, 2589–2605. doi: 10.1175/1520-0485(1994)024<2589:VOTSNP>2.0.CO;2
Johnstone, J. A., and Mantua, N. J. (2014). Atmospheric controls on northeast Pacific temperature variability and change, 1900–2012. Proc. Natl. Acad. Sci. U. S. A. 111, 14360–14365. doi: 10.1073/pnas.1318371111
Juranek, L. W., White, A. E., Dugenne, M., Henderikx Freitas, F., Dutkiewicz, S., Ribalet, F., et al. (2020). The Importance of the Phytoplankton “Middle Class” to Ocean Net Community Production. Glob. Biogeochem. Cycles 34:e2020GB006702. doi: 10.1029/2020GB006702
Karl, D. M. (1999). A Sea of Change: biogeochemical Variability in the North Pacific Subtropical Gyre. Ecosystems 2, 181–214. doi: 10.1007/s100219900068
Karl, D. M., Christian, J. R., Dore, J. E., Hebel, D. V., Letelier, R. M., Tupas, L. M., et al. (1996). Seasonal and interannual variability in primary production and particle flux at Station ALOHA. Deep-Sea Res. Part II Top. Stud. Oceanogr. 43, 539–568. doi: 10.1016/0967-0645(96)00002-1
Karl, D. M., and Church, M. J. (2014). Microbial oceanography and the Hawaii Ocean Time-series programme. Nat. Rev. Microbiol. 12, 699–713. doi: 10.1038/nrmicro3333
Karl, D. M., Church, M. J., Dore, J. E., Letelier, R. M., and Mahaffey, C. (2012). Predictable and efficient carbon sequestration in the North Pacific Ocean supported by symbiotic nitrogen fixation. Proc. Natl. Acad. Sci. U. S. A. 109, 1842–1849. doi: 10.1073/pnas.1120312109
Karl, D. M., Letelier, R. M., Bidigare, R. R., Björkman, K. M., Church, M. J., Dore, J. E., et al. (2021). Seasonal-to-decadal scale variability in primary production and particulate matter export at Station ALOHA. Prog. Oceanogr. 195:102563. doi: 10.1016/j.pocean.2021.102563
Karl, D. M., and Lukas, R. (1996). The Hawaii Ocean Time-series (HOT) program: background, rationale and field implementation. Deep-Sea Res. Part II Top. Stud. Oceanogr. 43, 129–156. doi: 10.1016/0967-0645(96)00005-7
Karl, D. M., and Tien, G. (1992). MAGIC: a sensitive and precise method for measuring dissolved phosphorus in aquatic environments. Limnol. Oceanogr. 37, 105–116. doi: 10.4319/lo.1992.37.1.0105
Kim, B. K., Jung, J., Lee, Y., Cho, K.-H., Gal, J.-K., Kang, S.-H., et al. (2020). Characteristics of the Biochemical Composition and Bioavailability of Phytoplankton-Derived Particulate Organic Matter in the Chukchi Sea. Arctic. Water 12:2355. doi: 10.3390/w12092355
Lampitt, R. S., Achterberg, E. P., Anderson, T. R., Hughes, J. A., Iglesias-Rodriguez, M. D., Kelly-Gerreyn, B. A., et al. (2008). Ocean fertilization: a potential means of geoengineering? Philos. Trans. R. Soc. A 366, 3919–3945. doi: 10.1098/rsta.2008.0139
Landry, M. R. (2002). Integrating classical and microbial food web concepts: evolving views from the open-ocean tropical Pacific. Hydrobiologia 480, 29–39. doi: 10.1023/A:1021272731737
Landry, M. R., Al-Mutairi, H., Selph, K. E., Christensen, S., and Nunnery, S. (2001). Seasonal patterns of mesozooplankton abundance and biomass at Station ALOHA. Deep-Sea Res. Part II Top. Stud. Oceanogr. 48, 2037–2061. doi: 10.1016/S0967-0645(00)00172-7
Laws, E. A., Falkowski, P. G., Smith, W. O. Jr., Ducklow, H., and Mccarthy, J. J. (2000). Temperature effects on export production in the open ocean. Glob. Biogeochem. Cycles 14, 1231–1246. doi: 10.1029/1999GB001229
Letelier, R. M., Björkman, K. M., Church, M. J., Hamilton, D. S., Mahowald, N. M., Scanza, R. A., et al. (2019). Climate-driven oscillation of phosphorus and iron limitation in the North Pacific Subtropical Gyre. Proc. Natl. Acad. Sci. U. S. A. 116, 12720–12728. doi: 10.1073/pnas.1900789116
Letelier, R. M., White, A. E., Bidigare, R. R., Barone, B., Church, M. J., and Karl, D. M. (2017). Light absorption by phytoplankton in the North Pacific Subtropical Gyre. Limnol. Oceanogr. 62, 1526–1540. doi: 10.1002/lno.10515
Litzow, M. A., Hunsicker, M. E., Bond, N. A., Burke, B. J., Cunningham, C. J., Gosselin, J. L., et al. (2020). The changing physical and ecological meanings of North Pacific Ocean climate indices. Proc. Natl. Acad. Sci. U. S. A. 117, 7665–7671. doi: 10.1073/pnas.1921266117
Lukas, R., and Santiago-Mandujano, F. (2008). Interannual to Interdecadal Salinity Variations Observed Near Hawaii Local and Remote Forcing by Surface Freshwater Fluxes. Oceanography 21, 46–55. doi: 10.5670/oceanog.2008.66
Mantua, N. J., Hare, S. R., Zhang, Y., Wallace, J. M., and Francis, R. C. (1997). A Pacific Interdecadal Climate Oscillation with Impacts on Salmon Production**. Bull. Am. Meteorol. Soc. 78, 1069–1080. doi: 10.1175/1520-0477(1997)078<1069:APICOW>2.0.CO;2
Marsay, C. M., Sanders, R. J., Henson, S. A., Pabortsava, K., Achterberg, E. P., and Lampitt, R. S. (2015). Attenuation of sinking particulate organic carbon flux through the mesopelagic ocean. Proc. Natl. Acad. Sci. U. S. A. 112, 1089–1094. doi: 10.1073/pnas.1415311112
McDougall, T., Jackett, D. R., Millero, F., Pawlowicz, R., and Barker, P. (2012). A global algorithm for estimating Absolute Salinity. Ocean Sci. 8, 1123–1134. doi: 10.5194/os-8-1123-2012
Messié, M., and Chavez, F. (2011). Global Modes of Sea Surface Temperature Variability in Relation to Regional Climate Indices. J. Clim. 24, 4314–4331. doi: 10.1175/2011JCLI3941.1
Miller, A., Cayan, D., Barnett, T., Graham, N., and Oberhuber, J. (1994). The 1976-77 Climate Shift of the Pacific Ocean. Oceanography 7, 21–26. doi: 10.5670/oceanog.1994.11
Miller, A. J., Chai, F., Chiba, S., Moisan, J. R., and Neilson, D. J. (2004). Decadal-Scale Climate and Ecosystem Interactions in the North Pacific Ocean. J. Oceanogr. 60, 163–188. doi: 10.1023/B:JOCE.0000038325.36306.95
Millero, F. J., and Poisson, A. (1981). International one-atmosphere equation of state of seawater. Deep Sea Res. Part A Oceanogr. Res. Pap. 28, 625–629. doi: 10.1016/0198-0149(81)90122-9
Monger, B. C., and Landry, M. R. (1993). Flow cytometric analysis of marine bacteria with hoechst 33342. Appl. Environ. Microbiol. 59, 905–911. doi: 10.1128/aem.59.3.905-911.1993
Morris, I., Glover, H. E., and Yentsch, C. S. (1974). Products of photosynthesis by marine phytoplankton: the effect of environmental factors on the relative rates of protein synthesis. Mar. Biol. 27, 1–9. doi: 10.1007/BF00394754
Mouw, C. B., Barnett, A., Mckinley, G. A., Gloege, L., and Pilcher, D. (2016). Phytoplankton size impact on export flux in the global ocean. Glob. Biogeochem. Cycles 30, 1542–1562. doi: 10.1002/2015GB005355
Nielsen, E. S. (1952). The Use of Radio-active Carbon (C14) for Measuring Organic Production in the Sea. ICES J. Mar. Sci. 18, 117–140. doi: 10.1093/icesjms/18.2.117
Pomeroy, L. R. (1974). The Ocean’s Food Web. A Changing Paradigm. BioScience 24, 499–504. doi: 10.2307/1296885
Pörtner, H., Roberts, D., Masson-Delmotte, V., Zhai, P., Tignor, M., Poloczanska, E., et al. (2019). IPCC, 2019: Summary for Policymakers, IPCC Special Report on the Ocean and Cryosphere in a Changing Climate. Geneva: IPCC
Saba, V. S., Friedrichs, M. A. M., Carr, M.-E., Antoine, D., Armstrong, R. A., Asanuma, I., et al. (2010). Challenges of modeling depth-integrated marine primary productivity over multiple decades: a case study at BATS and HOT. Glob. Biogeochem. Cycles 24:GB3020. doi: 10.1029/2009GB003655
Sakamoto, C., Karl, D., Jannasch, H., Bidigare, R., Letelier, R., Walz, P., et al. (2004). Influence of Rossby waves on nutrient dynamics and the plankton community structure in the North Pacific subtropical gyre. J. Geophys. Res. 109:C05032. doi: 10.1029/2003JC001976
Sathyendranath, S., Aiken, J., Alvain, S., Barlow, R., Bouman, H., Bracher, A., et al. (2014). Phytoplankton Functional Types From Space, Reports of the International Ocean-Colour Coordinating Group (IOCCG); 15. Dartmouth, NS, Canada: International Ocean-Colour Coordinating Group, 1–156.
Scharek, R., Tupas, L. M., and Karl, D. M. (1999). Diatom fluxes to the deep sea in the oligotrophic North Pacific gyre at Station ALOHA. Mar. Ecol. Prog. Ser. 182, 55–67. doi: 10.3354/meps182055
Sommer, U., Stibor, H., Katechakis, A., Sommer, F., and Hansen, T. (2002). Pelagic food web configurations at different levels of nutrient richness and their implications for the ratio fish production:primary production. Hydrobiologia 484, 11–20. doi: 10.1023/A:1021340601986
Steinberg, D. K., Van Mooy, B. A. S., Buesseler, K. O., Boyd, P. W., Kobari, T., and Karl, D. M. (2008). Bacterial vs. zooplankton control of sinking particle flux in the ocean’s twilight zone. Limnol. Oceanogr 53, 1327–1338. doi: 10.4319/lo.2008.53.4.1327
Takagi, M., Watanabe, K., Yamaberi, K., and Yoshida, T. (2000). Limited feeding of potassium nitrate for intracellular lipid and triglyceride accumulation of Nannochloris sp. UTEX LB1999. Appl. Microbiol. Biotechnol. 54, 112–117. doi: 10.1007/s002530000333
Tofallis, C. (2009). Least squares percentage regression. J. Mod. Appl. Stat. Meth. 7, 526–534. doi: 10.22237/jmasm/1225513020
Tréguer, P., Bowler, C., Moriceau, B., Dutkiewicz, S., Gehlen, M., Aumont, O., et al. (2018). Influence of diatom diversity on the ocean biological carbon pump. Nat. Geosci. 11, 27–37. doi: 10.1038/s41561-017-0028-x
Uz, B. M., Yoder, J. A., and Osychny, V. (2001). Pumping of nutrients to ocean surface waters by the action of propagating planetary waves. Nature 409, 597–600. doi: 10.1038/35054527
Valencia, B., Landry, M. R., Décima, M., and Hannides, C. C. S. (2016). Environmental drivers of mesozooplankton biomass variability in the North Pacific Subtropical Gyre. J. Geophys. Res. 121, 3131–3143. doi: 10.1002/2016JG003544
White, A. E., Spitz, Y. H., and Letelier, R. M. (2007). What factors are driving summer phytoplankton blooms in the North Pacific Subtropical Gyre? J. Geophys. Res. 112:C12006. doi: 10.1029/2007JC004129
Winn, C. D., Campbell, L., Christian, J. R., Letelier, R. M., Hebel, D. V., Dore, J. E., et al. (1995). Seasonal variability in the phytoplankton community of the North Pacific Subtropical Gyre. Glob. Biogeochem. Cycles 9, 605–620. doi: 10.1029/95GB02149
Wright, S., Jeffrey, S., and Mantoura, R. (2005). Phytoplankton Pigments in Oceanography: Guidelines to Modern Methods. France: UNESCO Pub.
Yoon, J. E., Yoo, K. C., Macdonald, A. M., Yoon, H. I., Park, K. T., Yang, E. J., et al. (2018). Reviews and syntheses: ocean iron fertilization experiments – past, present, and future looking to a future Korean Iron Fertilization Experiment in the Southern Ocean (KIFES) project. Biogeosciences 15, 5847–5889. doi: 10.5194/bg-15-5847-2018
Keywords: North Pacific subtropical gyre, climate variability, North Pacific gyre oscillation, primary production, export production
Citation: Yoon J-E, Kim J-H and Kim I-N (2022) Climate-Driven High Primary Production and Contrasting Export Production in the Eastern North Pacific Subtropical Gyre. Front. Mar. Sci. 8:710540. doi: 10.3389/fmars.2021.710540
Received: 16 May 2021; Accepted: 01 December 2021;
Published: 20 January 2022.
Edited by:
Gordon T. Taylor, Stony Brook University, United StatesReviewed by:
Ricardo Maria Letelier, Oregon State University, United StatesDonn A. Viviani, Leeward Community College, United States
Copyright © 2022 Yoon, Kim and Kim. This is an open-access article distributed under the terms of the Creative Commons Attribution License (CC BY). The use, distribution or reproduction in other forums is permitted, provided the original author(s) and the copyright owner(s) are credited and that the original publication in this journal is cited, in accordance with accepted academic practice. No use, distribution or reproduction is permitted which does not comply with these terms.
*Correspondence: Il-Nam Kim, ilnamkim@inu.ac.kr
†Present address: Joo-Eun Yoon, Centre for Climate Repair at Cambridge, Downing College, University of Cambridge, Cambridge, United Kingdom