


“Food waste” is a hot topic these days in the media and among policymakers and academics. It has been the subject of many documentaries, TV programs, books, and magazine features.Footnote 1 The U.S. Agriculture Improvement Act of 2018 calls for the creation of a Food Loss and Waste Reduction Liaison to coordinate programs and efforts to reduce the incidence of food loss and waste. United Nations Sustainable Development Goal 12.3 sets a goal of halving global food waste at the retail and consumer levels and reducing losses further upstream (United Nations 2015). A Google Scholar search returns 5,130 results for papers with “food waste” in their titles since 2012—more than “food prices,” “food marketing,” “food demand,” “food stamps,” and “food aid” put together.Footnote 2 By all accounts, food waste is a major contemporary issue with implications for food security, the welfare of market participants, and the environment.
Although food waste has become a more prominent focus of public attention in recent years, it has been the subject of scholarly discussion for more than a century, since Barry (Reference Barry1871) described it as an example of the failure of supply to meet demand.Footnote 3 The first attempt to quantify food waste seems to have been a report by a committee of the American Public Health Association (1891), which found that Chicago collected and burned the equivalent of 19.9 pounds of garbage per capita in 1890, and that the District of Columbia collected the equivalent of 207 pounds of garbage per capita that year.Footnote 4 The discrepancy in the report for the two cities suggests possible inconsistencies in definitions and methods. Unfortunately, inconsistencies like these have pervaded most attempts to measure food waste in the intervening decades.
The main goal of this article is to examine estimates of food waste, over the long run, at the United States and global levels. We first critically appraise the methods for measuring food waste so that we can evaluate the quality of the data. Two main types of approaches to estimating food waste exist: top-down balance-sheet–based approaches, and bottom-up sampling- or survey-based approaches. Our appraisal reveals variations in definitions and inconsistent assumptions across and even within studies. Moreover, from our review it is clear that top-down approaches could be supplemented with consistently designed and executed bottom-up studies at different stages of food production and consumption so that top-down estimates can be improved and systematically updated.
Though with limitations, existing data generally show that for many regions of the world, including the United States, pre-consumer food loss and waste as a share of total supply has been stable since the 1960s. However, the aggregate share wasted masks important changes over time. We provide evidence that food waste has shifted downstream, i.e., from producers and processors to retailers and consumers, over the better part of the 20th and 21st centuries. Through a reflection on the trends in major socioeconomic factors, we hypothesize that this downstream shift has been driven by increases in household incomes, improvements in technology, and changes in culture and institutions.
Economics of Food Waste
The food-waste problem has been identified as such for over a century, but it is not necessarily self-evident why food waste demands government interventions that have recently been proposed or introduced. In this section, we discuss briefly the economics of food waste to provide clarity on what aspects of food waste are problematic in the welfare economics sense and hence warrant government interventions.
Definitions of Food Waste
As discussed extensively by de Gorter (Reference de Gorter2014), Bellemare et al. (Reference Bellemare, Çakir, Peterson, Novak and Rudi2017), Ellison, Muth, and Golan (Reference Ellison, Muth and Golan2019), and others, the characterization of food waste is nuanced, and definitions of “food waste” and “food loss” vary greatly across studies. Many consider food to be wasted only if it is both safe and edible. It is debatable whether food that goes uneaten because of food-safety concerns should be considered food waste. Under the Food Safety Modernization Act and many private contracts, certain produce that has fallen to the ground cannot be harvested because of concerns about food safety. Another subtle aspect of the definition is that certain edible food—including orange peels, kale stems, chicken feet, and pork skin—is not considered by some consumers to be desirable. The EU food waste quantification manual suggests that inedible parts of commodities removed during the harvesting process should not be considered food (or food waste), but that the inedible parts of food that enter the food chain (e.g., olive pits) can be considered food waste (Tostivint et al. Reference Tostivint, Östergren, Quested, Soethoudt, Stenmarck, Svanes and O'Connor2016, p. 53). It is also unclear how to account for food that is neither eaten nor disposed into a landfill but recovered for some other nonfood use; this should be regarded as more wasteful than redistribution to the hungry (see EPA 2017). Definitional issues like these have important implications for estimating the aggregate quantity and value of food wasted (see Buzby, Wells, and Hyman Reference Buzby, Wells and Hyman2014; Bellemare et al. Reference Bellemare, Çakir, Peterson, Novak and Rudi2017).
By no means should there be only one definition of food waste. Societies with different food cultures or priorities—eliminating starvation or reducing obesity—should consider different definitions of food waste. However, to ensure comparisons across time and places, clear delineation and documentation of food waste is an indispensable first step. For our purposes in this article, we use the terms “food loss” and “food waste” interchangeably to refer to all food produced for human consumption but uneaten.
Food Waste and Food Insecurity
The most visible and salient problem of food waste is its (possible) contribution to food insecurity, which affects some 40 million people in the United States (Coleman-Jensen et al. Reference Coleman-Jensen, Rabbitt, Gregory and Singh2017) and nearly 800 million around the world (FAO, IFAD, and WFP 2015). Though an individual's food waste seems to be trivial in modern developed countries, the aggregate effects of decisions to discard food, at various stages of the supply chain, may affect food prices and have important welfare implications for consumers and producers. But the effect of food-waste reduction on food security is ambiguous.
Reduction of food waste at the consumer level could lower the equilibrium price of food and ultimately improve food security.Footnote 5 For example, consider a scenario in which, consequent to a successful consumer-facing food-waste reduction campaign, consumers wasted less food while maintaining the same level of consumption. Then, demand for food at the retail level would shift inward, and less food would need to be produced (i.e., a leftward movement along the supply curve would result), reducing the equilibrium price of food.
The effect of a reduction in producer-level food waste on food prices is more nuanced and depends on the mechanism. If a reduction in producer-level food waste were the outcome of improvements in technology that allowed more food to be produced and marketed without spoilage or blemishes, then the supply curve would shift outward, reflecting the lower cost of production per unit of output. Similarly, if a reduction in producer-level food waste were the outcome of changes in quality standards that allowed more food to be marketed despite defects or blemishes, then the supply curve would shift outward. With supply curves shifted outward, the equilibrium price of food would decrease and food security would improve. However, as Barrett (Reference Barrett2015) and Sheahan and Barrett (Reference Sheahan and Barrett2017) have noted, such policy changes cannot serve as efficient mechanisms for alleviating food insecurity. On the other hand, if government were to mandate that sellers wasted less food, or tax or fine producers for the generation of food waste, the price of food could increase and the problem of food insecurity would not be addressed.
Food Waste and Environmental Externalities
The main economic rationale to regulate food waste is the existence of environmental costs to produce, market, and even purchase food that eventually goes uneaten. If food waste were reduced, then less land, water, fuels, and chemicals would be needed for agricultural production, and the negative environmental impact of the agricultural system would be reduced.Footnote 6 Kummu et al. (Reference Kummu, de Moel, Porkka, Siebert, Varis and Ward2012) estimate that about a quarter of the global inputs to crop production—water, land, and fertilizer—are used to produce food that will later be lost or wasted. Venkat (Reference Venkat2011) estimates that 2 percent of U.S. greenhouse-gas (GHG) emissions are due to wasted food, most of which arises in the production and processing stages, and Heller and Keoleian (Reference Heller and Keoleian2015) suggest that food losses contribute 28 percent of the carbon footprint of the U.S. diet. Vanham et al. (Reference Vanham, Bouraoui, Leip, Grizzetti and Bidoglio2015) estimate that avoidable food waste accounts for 8–9 percent of the EU water footprint and 11 percent of the EU nitrogen footprint of consumption of agricultural products. In contrast, Song et al. (Reference Song, Li, Semakula and Zhang2015) find that in China, food waste accounts for only 3–4 percent of the carbon, water, and land-use footprints of food.
Since these environmental costs are generally associated with food production, not just wasted food, assigning blame for these external costs to “food waste” risks highlighting one resource-use inefficiency at the expense of several others. For example, if less food were produced because people were demanding fewer calories, but the total amount of food wasted and the composition of this waste remained the same, there would also be a reduced demand for inputs to agricultural production and a reduction in environmental damages associated with agriculture. However, the environmental costs of obesity are rarely discussed.Footnote 7 Moreover, overemphasizing the environmental costs of food waste may divert societal attention from the overall environmental impact of agricultural production and other, more important contributors to GHG emissions and pollution (cf. Hagmann, Ho, and Loewenstein Reference Hagmann, Ho and Loewenstein2019).
Methods for Measuring Food Waste
The main goal of this article is to examine estimates of food waste, over the long run, at the United States and global levels. Comprehensive or representative estimates of food waste are few, owing partly to lack of definitional consistency.Footnote 8 The limited availability of information on food loss and waste also relates to the incentive system: since there has been no market for food waste until very recently, there have never been economic incentives to measure or document food waste. Before delving into various food waste estimates, we examine the methods that generate these estimates so that we can evaluate their reliability. Two main types of approaches to estimating food waste exist: top-down balance-sheet–based approaches, and bottom-up sampling- or survey-based approaches (see, e.g., Becker and Gillin Reference Becker and Gillin2001; EPA 2016; Bentley and Kantor Reference Bentley and Kantor2018; Johnson et al. Reference Johnson, Dunning, Bloom, Gunter, Boyette and Creamer2018a). Our review makes clear that it would be beneficial to supplement top-down estimates with bottom-up studies at different stages of food production and consumption so that top-down estimates can be systematically updated.
Top-Down Approach: FAO Food Balance Sheet Series
The major global reference on food waste—i.e., the data source with the longest and widest country–commodity panel—is the Food and Agriculture Organization of the United Nations (FAO) Food Balance Sheet data set, which covers 1961–2013. FAO's definition of losses comprises amounts of commodities “lost at all stages between the level at which production is recorded and the household” (Becker and Gillin Reference Becker and Gillin2001, p. 13), excluding losses during pre-harvest and harvesting and also excluding household-level losses. In some cases, the FAO measure of food loss is constructed as a residual, as shown in equation (1).
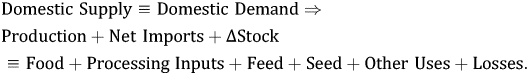
In other cases, the quantity of food loss “is often estimated as a fixed percentage of availability” (FAO undated, p. 251).Footnote 9 It is not well documented how these fixed percentages are estimated. In addition, because both losses and domestic supply are reported in integer units of 1,000 tonnes, the “fixed percentage” may appear to fluctuate slightly from year to year.Footnote 10
Table 1 presents a set of food loss estimates from the FAO Food Balance Sheet data series for 2013. We summarize loss estimates for the 21 commodities with the greatest number of country-year observations. Losses for these 21 commodities are represented for the countries (with data available) that have the largest populations within each of the UN subregions of the world. Note that 75 of the 441 commodity-country cells (i, j) are blank, meaning that FAO does not have loss data on commodity i for country j in its data set.Footnote 11 Furthermore, 68 of the 366 non-blank loss measures are either based on fixed percentages or fixed in quantities over all years for which data are available. The missing and fixed loss estimates are more likely to be associated with smaller countries and lower-volume commodities. For the entire data set, for 2013, the loss observations based on fixed percentages are associated with 7.7 percent of global supply; the loss observations that are fixed in quantities are associated with less than 0.1 percent of global supply. Ninety-six percent of the fixed-in-quantities loss observations are 0. Moreover, it is possible that losses appear to be fixed percentages or fixed quantities simply because they do not vary much, either proportionally or in levels, across years. To the extent that some loss estimates are fixed, variation in the FAO data series is dampened. On the other hand, any variation that exists across time provides valuable information on the historical trends of food waste.
Table 1. A Sample of Food Loss Measures From the FAO Food Balance Sheet Data Series for 2013

Notes: Countries selected are those with the largest populations within each UN subregion, with the exceptions of D.R. Congo and the entire region of Micronesia, for which there are no data. In the table, the numbers represent loss measured as a percentage of domestic supply quantity in 2013. Italics indicate that percentages are fixed (conditional on integer values of losses and domestic supply quantity) in all years for which data are available. Bold numbers indicate that levels of losses are fixed (in units of 1,000 tonnes) in all years.
Source: FAO (2017).
We highlight a few major takeaways from the sample FAO Food Balance Sheet estimates presented in Table 1. First, there is substantial variation in loss as a share of supply across commodities within each country. For example, in South Africa, loss estimates range from 8.5 percent in oranges and mandarins to 39.4 percent for lemons and limes. In India, losses range from 5.0 percent in sweet potatoes (a fixed proportion) to 25.1 percent in potatoes. Second, there is also substantial variation across countries for the same commodity, even within the same region. See Germany's estimated losses of potatoes (15.0 percent) relative to other European countries and the wide range of losses of sweet potatoes across African countries. Third, between the farm and consumer levels, i.e., for the stages of the supply chain represented by the FAO Food Balance Sheet data, food waste is generally higher for countries in the developing world. Poorer countries have worse infrastructure and therefore tend to have more pre-consumer food loss. The FAO data support this in part: commodity-by-commodity, losses are higher on average for the African countries represented here than for the European countries. But there are exceptions, too: for five out of 14 commodities, an African country has lower losses than the United States.
Top-Down Approach: USDA Loss-Adjusted Food Availability Series
Another balance-sheet approach to estimating food loss is used by the USDA Economic Research Service (ERS) in its Loss-Adjusted Food Availability (LAFA) Data Series. The documentation for the data series describes food loss as “the edible amount of food, postharvest, that is available for human consumption but is not consumed for any reason” (Bentley and Kantor Reference Bentley and Kantor2018). ERS LAFA estimates are obtained through three separate estimation processes along the supply chain: primary-to-retail, retail, and consumer. First, losses between the primary level (often the farm) and retail are estimated using “conversion factors.”Footnote 12 Primary-to-retail losses are defined inconsistently across products. For example, many processed products (e.g., canned pears, dry beans, flours, cane and beet sugar) are shown as having zero loss from primary to retail. Yet another processed product, orange juice, is estimated to have primary-to-retail losses ranging from 35.1 to 55.9 percent across the time series of the data set.
Second, for certain commodity groups, retail-level losses are estimated using supplier shipment data and point-of-sale data collected by Nielsen for a sample of six grocery retail chains within Nielsen's database (Buzby et al. Reference Buzby, Bentley, Padera, Campuzano and Ammon2016). One concern is that the sample may not be nationally representative of all grocery retailers.Footnote 13 For other commodity groups, retail-level losses are assumed rather than estimated: in fact, a retail-loss estimate of 6.0 percent is applied to nearly half of all products—mostly processed products, such as juice, cheese, and canned, dried, and frozen foods.
Third, consumer-level loss estimates are based on comparison between Nielsen Homescan and the National Health and Nutrition Examination Survey (NHANES) data. In particular, ERS and its contractor RTI International estimated national purchase quantities from Nielsen Homescan data and then compared these purchase quantities with NHANES consumption estimates (i.e., estimates of food actually eaten). Both data sets were weighted to achieve nationally representative estimates. One shortcoming of this comparison method is that both NHANES and Homescan data are plagued by underreporting (Briefel et al. Reference Briefel, Sempos, McDowell, Chien and Alaimo1997; Kant Reference Kant2002; Zhen et al. Reference Zhen, Taylor, Muth and Leibtag2009; Murakami and Livingstone Reference Murakami and Livingstone2015, Reference Murakami and Livingstone2016), but the rates and biases of underreporting surely differ across the two surveys.Footnote 14
Note that most of the year-to-year variation in ERS LAFA food waste estimates is driven by changes in the supply quantity of products rather than changes in estimated food-loss shares, because ERS's current estimates apply the same primary-to-retail and consumer-level loss shares, across all years, for essentially all products.Footnote 15 Food commodities are processed and used in different ways than they were decades ago, so by fixing the loss shares for almost all non-meat commodities, the ERS LAFA data series fails to capture how the quantity and composition of food waste has evolved in the United States. For example, to take the ERS LAFA estimates at face value would suggest that baby carrots and waffle-cut fries were equally popular 40 years ago as they are today.
Top-down Approach: A Comparison
We would like to emphasize that the primary purpose of both FAO's Food Balance Sheets and the ERS LAFA series is to provide information on food supply, i.e., availability. Food loss estimation is not the focus of either approach. Nonetheless, food loss estimates are a necessary component for the estimation of food availability and are consequently reported.
The two balance-sheet–based approaches are not easily comparable. First, they cover different commodities, with the FAO focusing on raw commodities and the ERS focusing on final consumer products. On one hand, ERS LAFA measures include weight lost in processing raw agricultural commodities to consumer products. FAO, on the other hand, does not record data for products like dried apples or ice cream and so ignores all weight lost during processing. For a few commodities like rice and groundnuts, FAO uses the processed-product equivalent as the unit of analysis for all components of the balance sheet. Second, FAO does not estimate consumer-level food loss, while ERS does.
Table 2 compares the FAO and ERS LAFA data on food loss for the United States in 2013 by level of the supply chain for commodities that appear in both data series.Footnote 16 Column (2) lists the FAO estimate for 2013 as a share of domestic supply. Columns (4), (5), (6), and (7) report loss shares and nonedible shares for each commodity at each stage of the supply chain, obtained directly from the ERS LAFA tables.Footnote 17 For example, Column (5) in the first row indicates that 6 percent of apple juice that reaches the retail level, not that 6 percent of domestic supply of apple juice, is wasted. We calculate pre-consumer loss for the ERS LAFA series, using information in Columns (4) and (5), in order to provide a comparison between the ERS LAFA and FAO data on pre-consumer losses.
Table 2. Comparison of FAO and ERS LAFA Food-Loss Data by Commodity, United States, 2013
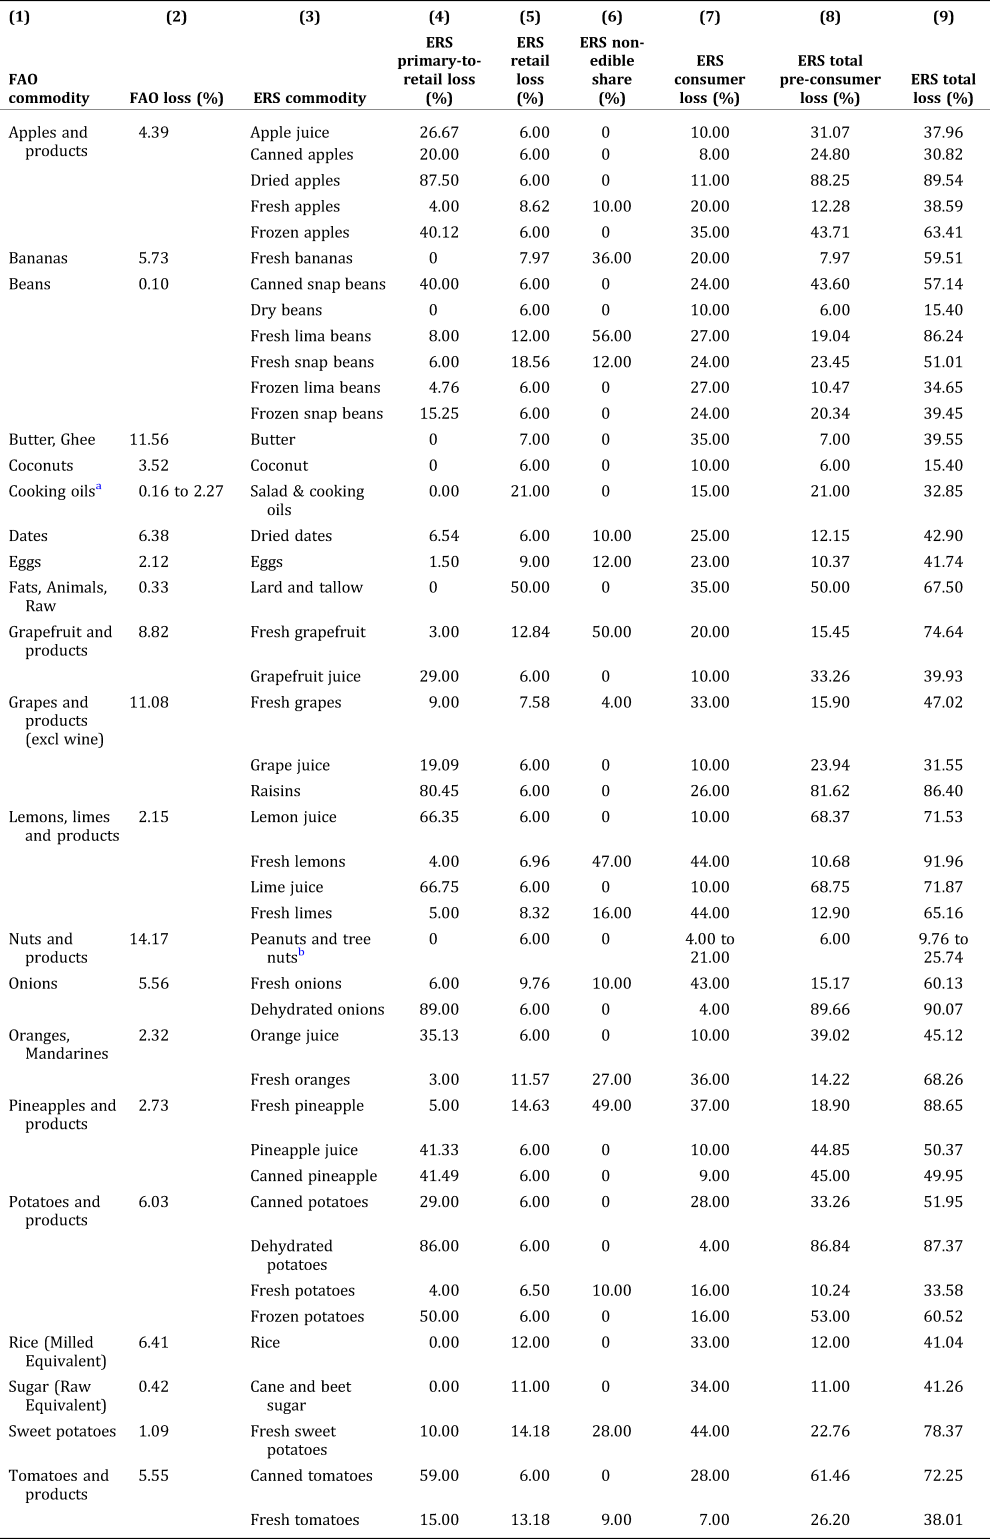
a This line in our table summarizes FAO data for 10 products: coconut oil, cottonseed oil, groundnut oil, maize germ oil, “oilcrops oil, other”, palm oil, palmkernel oil, rape and mustard oil, soyabean oil, and sunflowerseed oil.
b This line in our table summarizes ERS LAFA data for peanuts and seven types of tree nuts: almonds, hazelnuts, pecans, walnuts, macadamia, pistachios, and “other tree nuts”.
Notes: In this table, we only list commodities that are roughly comparable across the two data sets. The FAO data set includes 38 commodities for the United States, and the ERS LAFA data set includes 210 commodities or products. The ERS LAFA total pre-consumer loss share is most comparable to the FAO loss share because the FAO loss share explicitly excludes consumer-level loss. Column (8) is calculated as 1 − (1 − Column (4)) × (1 − Column (5)). Column (9), total food loss, adds consumer-level and nonedible loss shares to the pre-consumer loss given in Column (8).
From Table 2 we can see that the ERS LAFA estimates of pre-consumer food waste are generally higher than the corresponding FAO estimates. We also see that a large portion of the pre-consumer loss in the ERS LAFA data set is loss of weight during processing, especially in the cases of dried fruits and vegetables. When measuring food waste, how much of the weight lost during processing should be considered food waste is debatable. Even if there were a consensus that weight loss should be considered food waste, no clear policy implications of measuring this loss exist. Given the importance of processed products in our food system, more effort is needed to devise a protocol for consistently measuring food loss during processing.
Bottom-Up Approach: Survey-Based Estimates
In addition to top-down balance sheet approaches, food waste has also been measured using surveys at different stages of food production and consumption. Some researchers have surveyed and analyzed household waste disposed for curbside collection (Brown Reference Brown1918; Quested, Easteal, and Ingle Reference Quested, Easteal and Ingle2013; Parizeau, von Massow, and Martin Reference Parizeau, von Massow and Martin2015; EPA 2016; Hoover Reference Hoover2017; Quested and Parry Reference Quested and Parry2017), while others have collected data through household food diaries or apps on mobile devices (Woods Reference Woods1892; Quested and Johnson Reference Quested and Johnson2009; Hoover Reference Hoover2017; Roe et al. Reference Roe, Apolzan, Qi, Allen and Martin2018), or surveyed the food left in farm fields after harvest (Hartikainen et al. Reference Hartikainen, Svanes, Franke, Mogensen, Andersson, Bond, Burman, Einarsson, Joensuu, Olsson, Räikkönen, Sinkko, Stubhaug, Rosell and Sundin2017; Sheane, McCosker, and Lillywhite Reference Sheane, McCosker and Lillywhite2017; Johnson et al. Reference Johnson, Dunning, Gunter, Bloom, Boyette and Creamer2018b).Footnote 18 Unfortunately, due to their limited external validity, results from these survey studies have not been used to improve top-down estimates.
Analysis of curbside waste disposal to estimate the value of household food waste was pioneered by Brown (Reference Brown1918). As noted by Parizeau, von Massow, and Martin (Reference Parizeau, von Massow and Martin2015), one major drawback of this approach is that it does not allow researchers to account for food composted, fed to animals, or disposed of via the kitchen sink, and it may not allow researchers to properly account for food waste disposed along with recyclable goods. Furthermore, determining whether food is fit for consumption, which matters under some definitions of food waste (e.g., Buzby Reference Buzby2013), may be problematic when analyzing food in garbage cans. Advantages of this method include that researchers can reasonably well assess volume of food waste by food group, as well as the value of edible food wasted; in addition, it is relatively unintrusive and requires virtually no effort on the part of households whose waste streams are being sampled.
The EPA provides the most important survey-based time series data set for the United States in a series of reports on the contents of municipal waste streams. This measurement is based on sampling of waste from grocery stores, restaurants, and institutions, residential curbside waste, and information on food-waste recovery through composting programs (EPA 2014, 2016). These samples were made in varying numbers of states over various years, many by local agencies, and aggregated by EPA. These data do not distinguish between types of food wasted and do not provide information about the quantities of food wasted at various stages of the supply chain. They also do not account for total quantity of food available and may not reflect changes in the way Americans dispose of food.
The nonprofit group WRAP (Waste and Resources Action Programme) has published a series of reports that estimate levels of food waste in the UK. WRAP's estimates of food waste draw on audits of the composition of waste streams from 330 local authorities during the years 2006–12 (Bridgwater and Quested Reference Bridgwater and Quested2013).Footnote 19 WRAP has also interviewed household members about their food purchase, consumption, and waste activities and subsequently studied the contents of their curbside waste. As noted by Quested, Easteal, and Ingle (Reference Quested, Easteal and Ingle2013), this method improves understanding of why food is wasted, but because households are interviewed before consenting to have the contents of their curbside trash analyzed, the interview may affect behavior and thereby bias estimates of waste downward.
In some cases, households are asked to maintain food diaries and equipped with tools to weigh and measure food wasted (Quested and Johnson Reference Quested and Johnson2009; Hoover Reference Hoover2017). Roe et al. (Reference Roe, Apolzan, Qi, Allen and Martin2018) asked participants to take photos of their plates before and after consuming meals; experts then analyzed the photos for content and waste. Koivupuro et al. (Reference Koivupuro, Hartikainen, Silvennoinen, Katajajuuri, Heikintalo, Reinikainen and Jalkanen2012) note that one essential drawback of diary and similar methods is that respondents may not record all food items wasted (whether intentionally or not). As reported by Quested and Johnson (Reference Quested and Johnson2009), estimates of waste based on the diary method are about 40 percent lower than estimates based on analysis of household curbside waste. Supporting this, Roe et al. (Reference Roe, Apolzan, Qi, Allen and Martin2018) reported that plate waste occurred rarely in their study: only 5.83 percent of food items had non-zero waste, and only 3.3 percent of all food selected by participants was wasted. Furthermore, keeping household food-waste diaries are burdensome for study participants.
One bottom-up approach to estimating post-harvest on-farm food loss has been developed by Johnson et al. (Reference Johnson, Dunning, Bloom, Gunter, Boyette and Creamer2018a). This method involves sampling vegetables in field to determine the amount of produce left in fields after harvest. The field sampling method is labor-intensive because it requires hand-harvesting produce that farmers found to be too costly to harvest. In addition, given the time-sensitive nature of vegetable harvest and that typical practice for many vegetables involves making multiple passes through fields, sampling must take place soon after harvest is complete. The intense requirements of data collection are reflected in the small sample size for Johnson et al. (Reference Johnson, Dunning, Gunter, Bloom, Boyette and Creamer2018b): each of eight crops studied was sampled on only two to four farms.
Historical Food-Waste Trends
In this section, we analyze the existing data series on food waste and synthesize findings from the literature to assess the evolution of food waste globally and in the United States. Our main finding is that the share of food wasted has remained at approximately the same level since the 1960s. However, this aggregate share wasted masks important changes over time. We provide evidence on a downstream shift in food waste, in which consumers are wasting more food but upstream actors are reducing food loss.
Trends in Global Food Loss
To assess trends in global food loss, we aggregate food-loss estimates from all countries and commodities, based on FAO data. Figures 1 and 2 show food loss as a share of food supply for the world and for its major regions during the years 1961–2013.Footnote 20 FAO's aggregate estimate of food loss has remained fairly flat over the entire data series, at around 6 percent of the food supply by weight.Footnote 21 Global food loss spiked in 2011—when aggregate food loss rose from 6.0 percent to 7.0 percent—because losses of Brazilian sugar cane, which on its own made up 6.4 percent of the global food supply quantity (according to the balance sheets), rose from 7.1 percent to 18.1 percent.
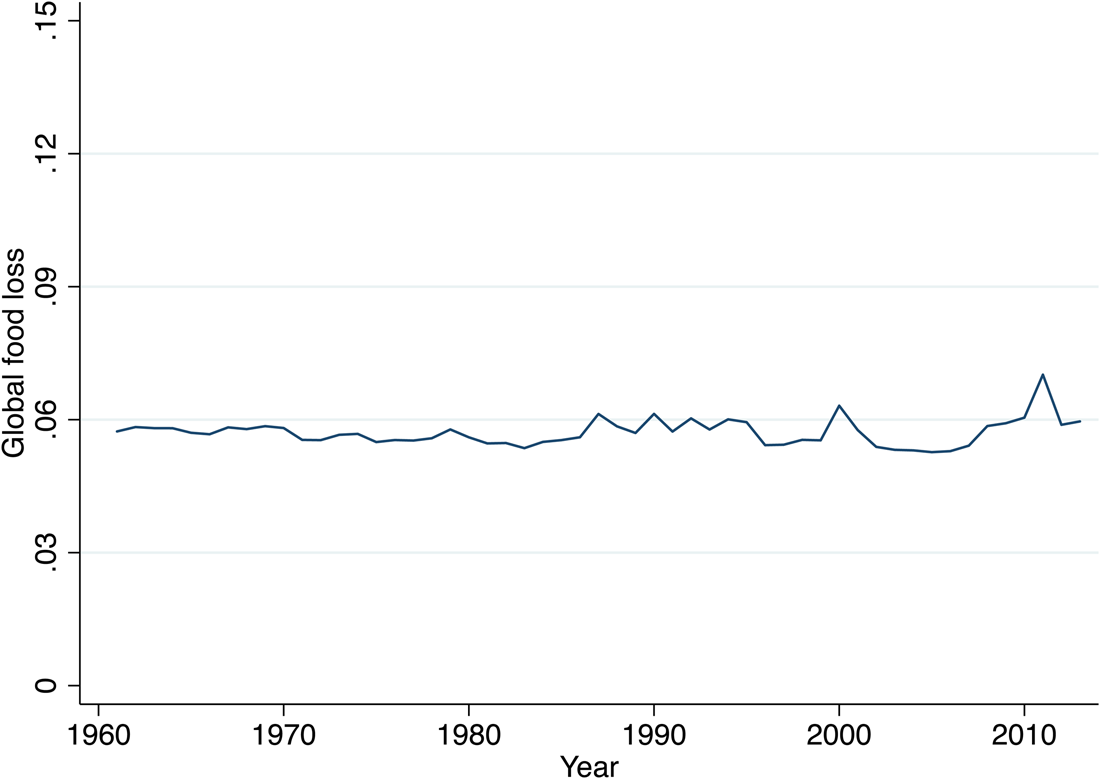
Figure 1. FAO Estimate of Food Loss as a Share of Total Supply, Weight Basis
Notes: We created this figure by summing global losses (in tonnes) and dividing by the global sum of domestic supply quantity (in tonnes) for all commodities in each year.
Source: FAO (2017).
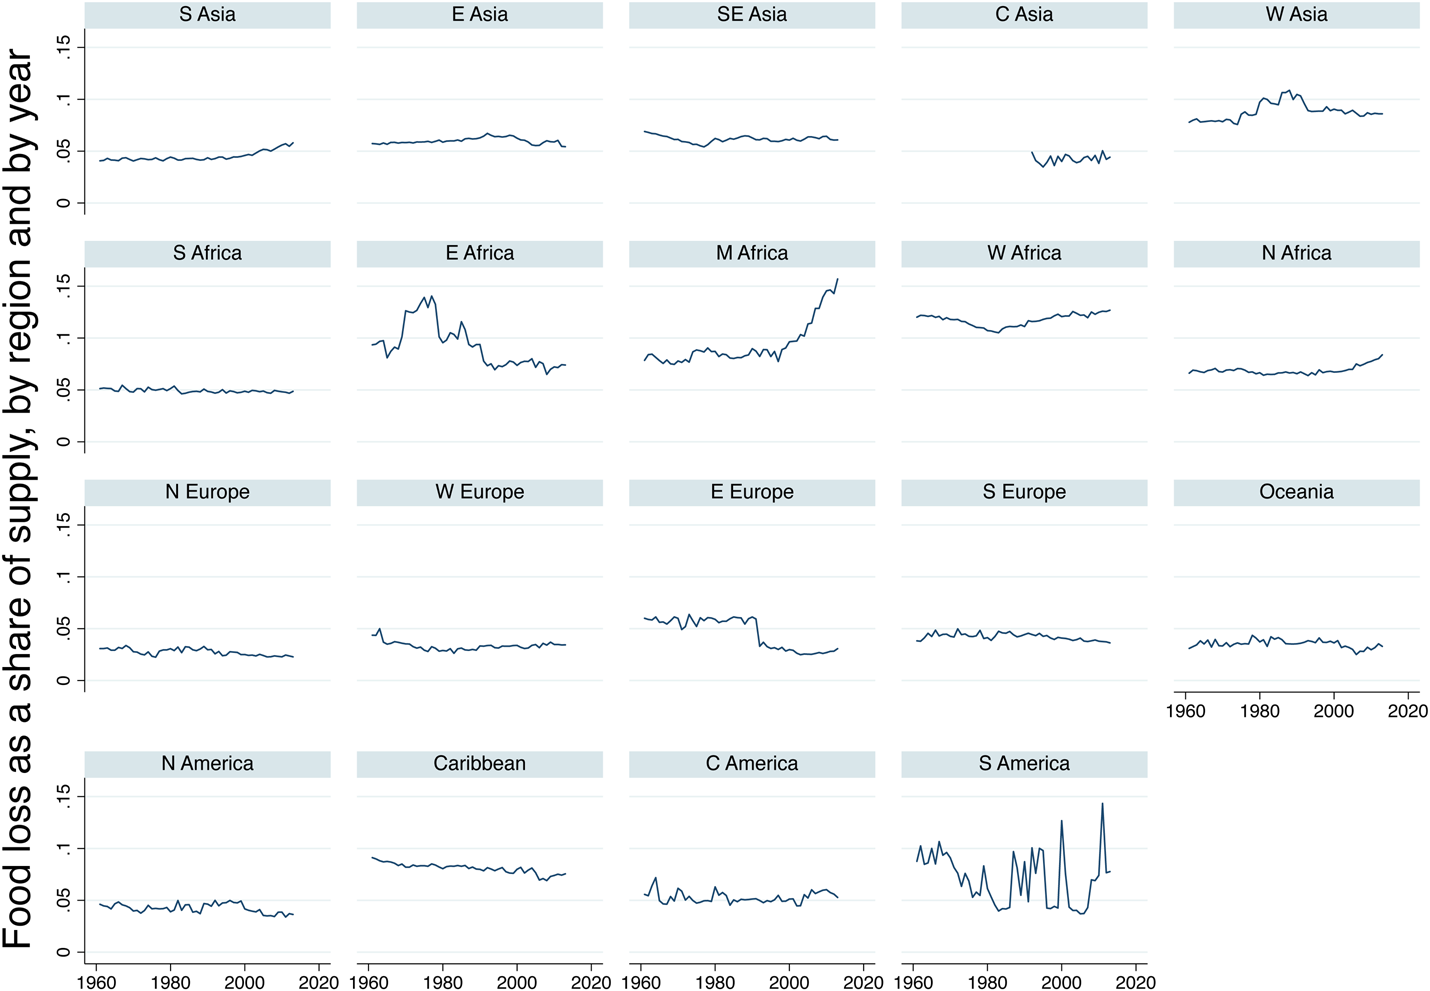
Figure 2. FAO Estimates of Food Loss as a Share of Domestic Supply, Weight Basis, by Region and by Year
Notes: We created this figure by aggregating FAO estimates of country-level loss and supply quantities (in tonnes for all commodities) to UN world subregions for each continent (https://unstats.un.org/unsd/methodology/m49/) and aggregating to the entire region of Oceania.
Source: FAO (2017).
Most regions of the world saw relatively little change in aggregate food loss over 1961–2013, as can be seen in Figure 2. The exceptions are as follows. East Africa saw sharp reductions in food loss from around 1980 to 1990, driven by improvements in Uganda. Eastern Europe saw a huge reduction in measured food loss in 1991–92, when the USSR dissolved and the food loss share dropped from 5.9 percent to 3.3 percent. This improvement appears to be driven by reduced losses of several staple crops and milk in the former Soviet countries.Footnote 22 South America had highly variable levels of food loss, largely driven by variations in Brazil's sugar cane production and losses. Middle Africa saw a dramatic rise in the share of the food supply lost in the 2000s. The rise was driven by the largest two countries in the region,Footnote 23 Angola and Cameroon. Angola experienced a 127 percent increase in GDP per capita (PPP, based on data from The World Bank 2019) and Cameroon's GDP per capita grew by 56 percent. A rise in food loss in the two countries might have been driven by increased affluence in recent years.
Most of the FAO estimates of food-loss shares by commodity groups shown in Figure 3 also exhibit relatively flat trends. Slight rises in losses of pulses, alcohol, meat, and eggs are apparent; as are slight decreases in losses of nuts, vegetables, stimulants (mostly caffeine), and fats and oils. Losses of sugars and sweeteners (mostly sugar cane) are highly variable.
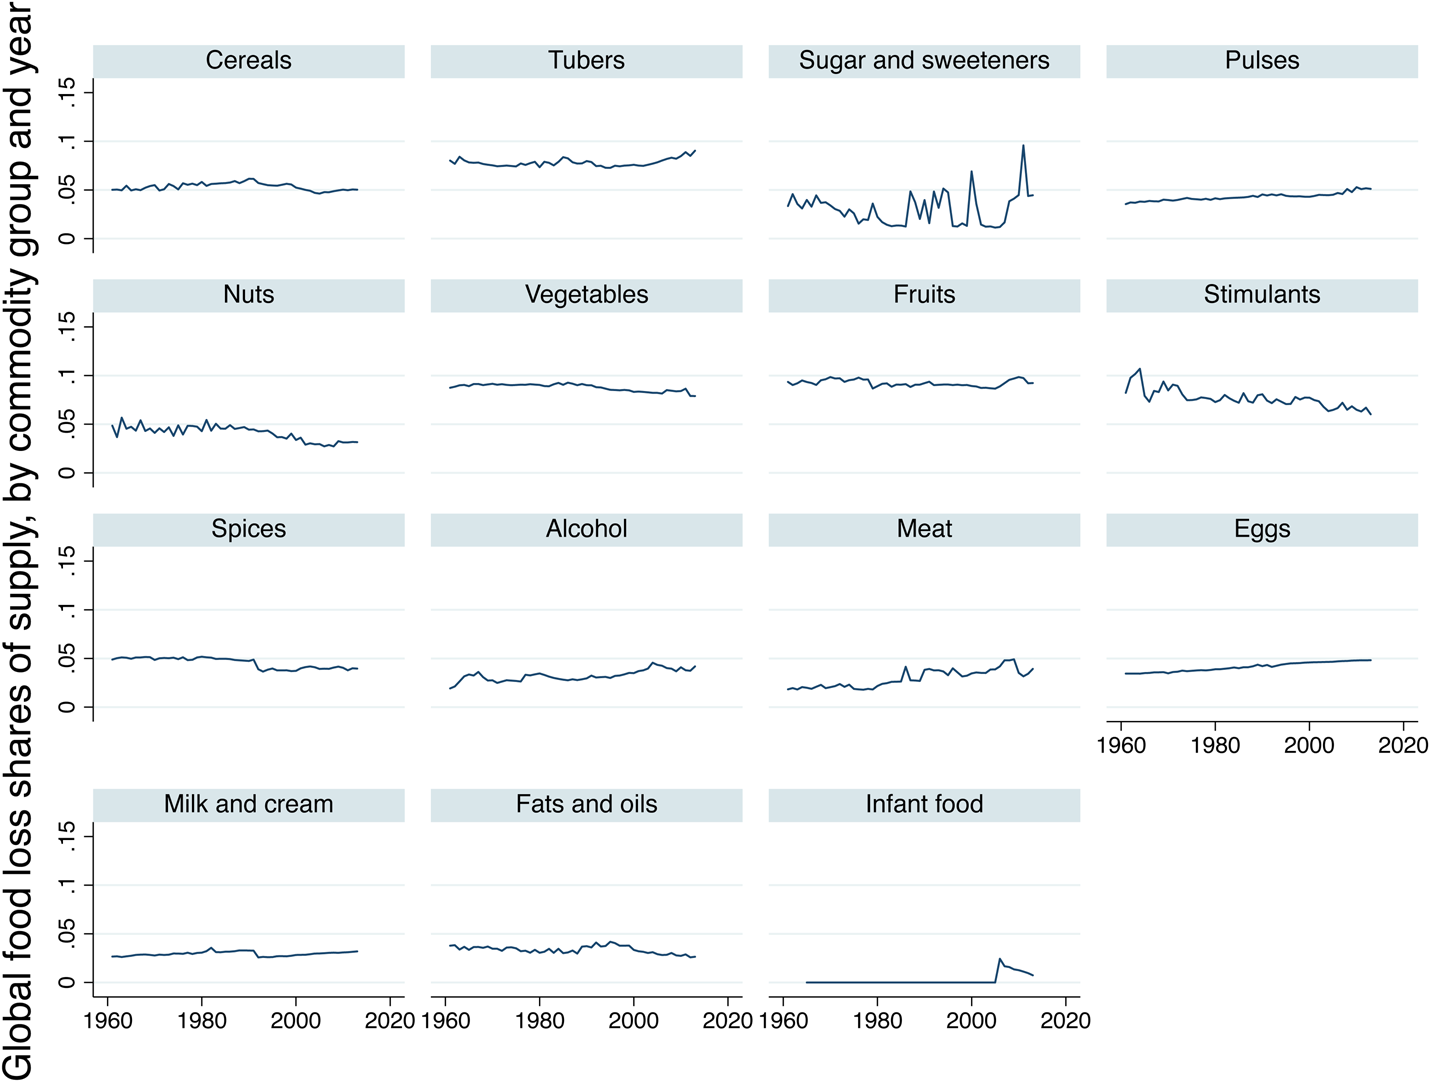
Figure 3. FAO Estimates of Food Loss as a Share of Supply, Weight Basis, by Commodity Group and by Year
Notes: We created this figure by summing global losses (in tonnes) and dividing by the global sum of domestic supply quantity (in tonnes) for all commodities within each commodity group in each year.
Source: FAO (2017).
Trends in U.S. Food Loss
Figure 4 presents time-series data on food loss, as a share of supply, in the United States based on data from Hall (Reference Hall2017), EPA (2016), ERS (2017), and FAO (2017). Two series were constructed based on weight: the series for FAO (2017) simply reflects the total weight loss across commodities as a share of total supply for the United States; the EPA series was constructed using EPA (2016) data on weight of food in the garbage stream and FAO data on the total weight of the U.S. food supply. Another two series were constructed based on calories: Hall (Reference Hall2017), an update of Hall et al. (Reference Hall, Guo, Dore and Chow2009), measures food waste in calories as the difference between the estimated energy content of the U.S. food supply based on FAO balance sheets and the estimated energy required to sustain U.S. adults' body weights as measured by the NHANES. The ERS calorie-basis loss is calculated as the ERS (2017) calorie data divided by total calorie availability. The ERS (2017) time series is artificially stable because for most commodities the share wasted is a constant applied to all years of data.
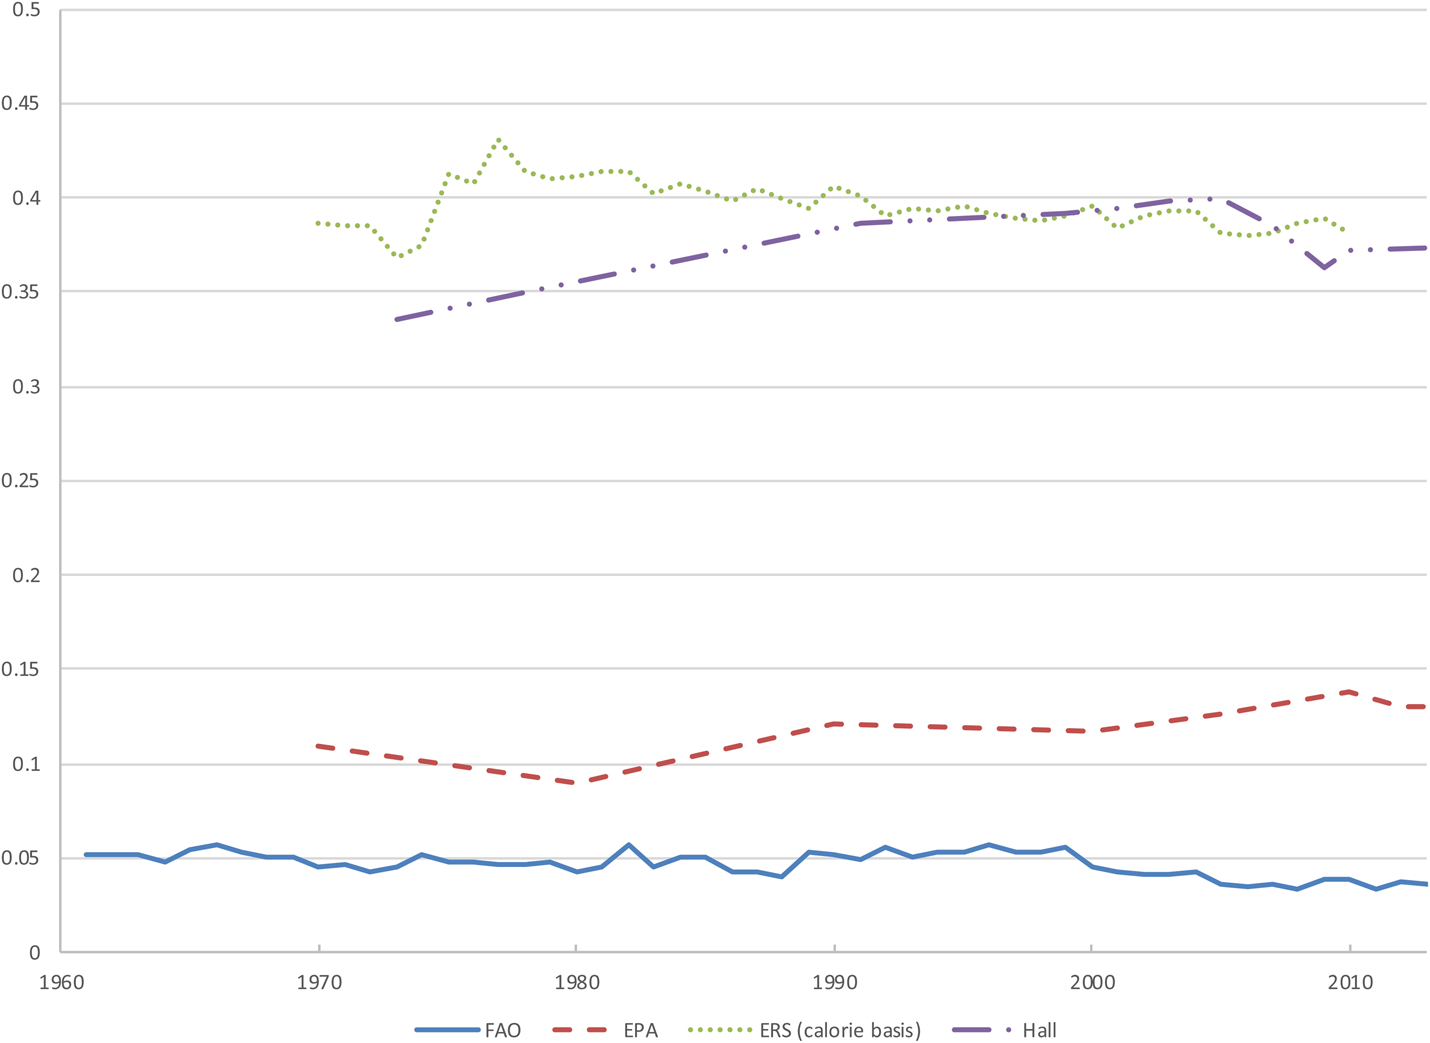
Figure 4. Comparison of Food Loss Share Estimates From Various Data Sources, United States, 1961–2013
Notes: Loss share estimates given explicitly by Hall (Reference Hall2017). See text for details on construction of the other three series.
Sources: FAO (2017), EPA (2016), USDA–ERS (2017), Hall (Reference Hall2017).
In addition to differences in methodologies summarized in the previous section, the difference between the series based on FAO (2017) and on ERS (2017) reflects that the FAO estimates do not include consumer-level food waste; the difference between the series based on EPA (2016) and on ERS (2017) reflects that the EPA estimates do not count processing losses between the primary level and the retail. The main insight drawn from Figure 4 is that each of the four time series for the United States suggest that food waste has been relatively constant as a share of total supply quantity since the 1970s. For the period 1973–2010, the interval common to all four data series, the share of food wasted based on weight may have decreased by as much as 0.4 percentage points per year (based on FAO 2017) or increased by as much as 0.7 percentage points per year (based on EPA 2016); the share of food wasted based on calories may have increased by between 0.1 percentage points per year (based on ERS 2017) and 0.3 percentage points per year (based on Hall Reference Hall2017).
Though food loss, as a share of the total food supply, has remained relatively constant for decades, these aggregate trends do not reveal the entire picture. To gain insights on how food waste has evolved along the supply chain and across commodities, Table 3 presents detailed estimates of food loss and waste from two (snapshot) studies for the United States that span several decades (Kling Reference Kling1943, ERS 2017).Footnote 24 Although the estimates presented in Table 3 were developed using different methodologies, comparing these estimates provides some suggestive evidence that producer-level (pre-retail) food waste has been reduced for some commodities while retail- and consumer-level food waste has risen over the last seven decades. Dairy products, eggs, fruits, green vegetables, and grains have all seen decreases in producer-level waste since the time of Kling (Reference Kling1943).Footnote 25 Conversely, meat and potatoes experienced increases at the producer level. These changes may reflect changes in taste: animals are now more highly processed upstream, and potatoes are more frequently consumed in a processed form. For each commodity group, there has been a moderate rise in retail-level waste and a larger rise in consumer-level waste. We hypothesize that these shifts are driven by income growth and a fall in the real price of food as well as cultural changes, all of which we will discuss at length in the next section.
Table 3. Historical Estimates of Food Loss and Waste by Stage of Supply Chain, United States
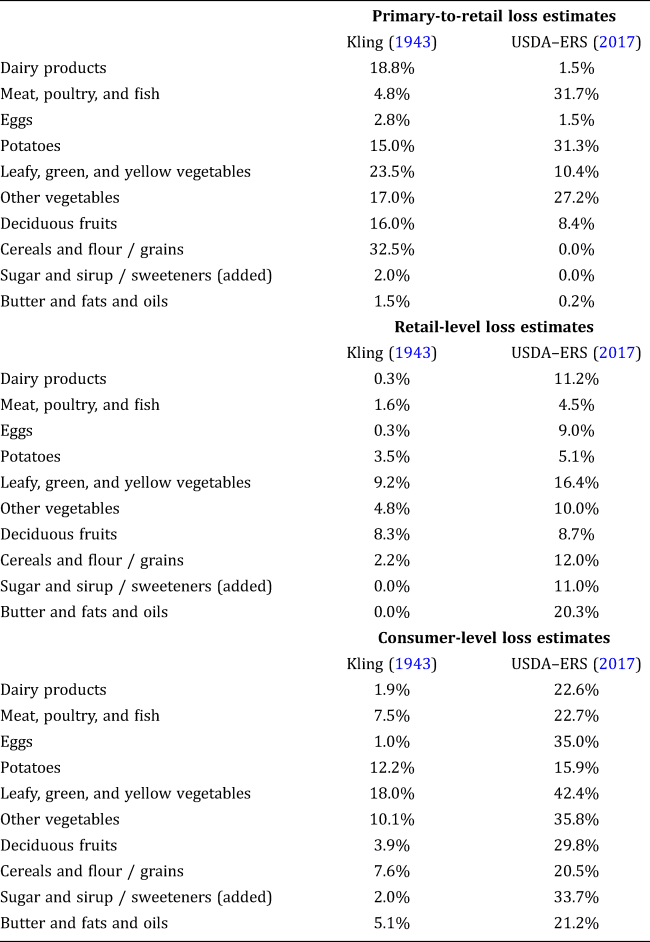
Notes: Shares represent food loss as a share of food reaching each stage of the supply chain.
Sources: Kling (Reference Kling1943) and USDA–ERS (2017; data for 2015). Note that Kling included the categories “Cereals and flour,” “Sugar and sirup” [original spelling] and “Butter and fats”; ERS LAFA uses the categories “Grains,” “Sugar and sweeteners (added)” and “Fats and oils (added)”. Vegetable and fruit products included in our tabulation of the ERS LAFA data do not include dried or dehydrated foods or potato chips. “Leafy, green, and yellow” vegetables include broccoli, Brussels sprouts, cabbage, carrots, cauliflower, collard greens, escarole and endive, kale, mustard greens, pumpkin, spinach, sweet potatoes, and turnip greens. “Deciduous fruits” include apples, apricots, cherries, grapes, kiwi, peaches, pears, plums, and prunes.
Hypotheses About the Evolution of Food Waste
The analysis presented in the preceding section suggests that the share of food wasted has remained at approximately the same level in both the United States and the world as a whole since the early 1960s. While the various aggregate estimates show little change, other evidence on waste by stage of the supply chain implies that less food is being wasted upstream and more food is being wasted downstream. In this section, we provide some hypotheses about the evolution of food waste over time based on the historical trends of major socioeconomic variables in developed countries, mainly the United States. Table 4 summarizes our hypotheses about how different socioeconomic factors might have driven trends in food waste.
Table 4. Hypotheses About Food-Waste Trends
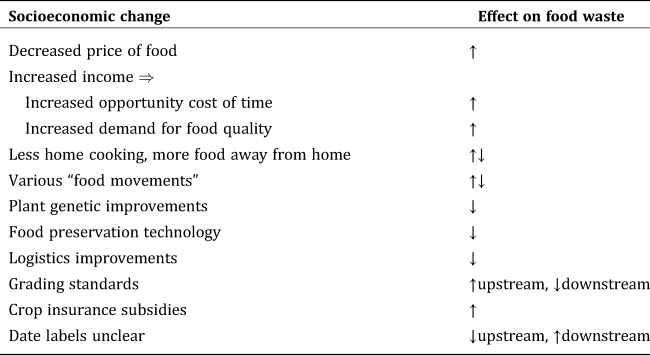
Notes: ↑ indicates more waste; ↓ indicates less waste; ↑↓ indicates that effects are ambiguous.
Price and Income
Over the past century, food has become relatively cheap. According to Jacks (Reference Jacks2013, Reference Jacks2017), the (world) real price indexes for most food commodities has decreased drastically since 1900: for 11 of 14 food commodities considered, the 2017 real price was 67–87 percent lower than the 1900 real price.Footnote 26 As the price of food decreases, the opportunity cost of wasting it, relative to transforming it to a meal, decreases. Under ordinary conditions, therefore, decreases in food prices have led to increases in food waste.
In addition, income has also risen and food makes up a smaller share of household expenditures. As income rises, there is also an increase in demand for food quality. This has been recognized as an implication of Engel's law at least since the work of Houthakker (Reference Houthakker1957) and was addressed more recently by Clements and Si (Reference Clements and Si2018). Demand for food quality includes demand for food free of blemishes and mold, lower-fat cuts of meat, and fresher food—meaning both unprocessed and more recently harvested. All of these quality attributes are associated with increases in food waste.
Another implication of increasing income is that the cost of transforming ingredients into meals rises, as individuals' opportunity cost of time rises. Landry and Smith (Reference Landry and Smith2019) analyze data from a comprehensive survey administered in the 1970s and find that the income elasticity of food waste was 1.1 to 1.4. In other words, food waste can be characterized as a luxury good. Setti et al. (Reference Setti, Falasconi, Segrè, Cusano and Vittuari2016) also find evidence that household food waste is higher among the affluent in Italy.
Preferences and Culture
Not to be overlooked in explaining food waste is the role of preferences, often tied to cultural changes. For various reasons, including but not limited to the increasing share of women in the labor force outside the home, Americans are cooking less and eating more food away from home (Smith, Ng, and Popkin Reference Smith, Ng and Popkin2013). Millennials (the youngest generation of adults) are also making fewer trips to grocery stores than older generations (Kuhns and Saksena Reference Kuhns and Saksena2017). What are the effects of a cultural shift away from home cooking and toward the use of prepared foods (e.g., pre-cut squash or broccoli florets) on overall food waste? When preparing meals, restaurants and especially industrial food manufacturers may use ingredients more efficiently and with less waste than consumers. Beretta et al. (Reference Beretta, Stoessel, Baier and Hellweg2013) find that in Switzerland, households waste 20.5 percent of food purchased or received (as “avoidable or possibly avoidable” food losses); the equivalent shares for processing and food service are 13.5 percent and 9.5 percent, respectively. However, other factors may increase food waste in commercial kitchens relative to home kitchens, namely, uncertainties about demand and the low marginal cost of food waste. These changes have also led to a shift of food waste from households to retailers and restaurants.
Changes in preferences related to health or environmental movements can also affect food waste. Much heterogeneity exists among consumers, and while some consumers may be cooking less and eating more commercially prepared foods, other consumers are exhibiting a growing interest in eating locally grown, minimally processed foods. Healthy food trends may reduce waste in some ways and increase waste in other ways. For example, Google Trends data reveal that internet searches for “broccoli stems” rose by 1.9 percent per year from 2004 to 2018. But trimming more fat from meat before consuming it increases waste. At the same time, growers who attempt to limit their sales to local markets also expose themselves to the possibility of generating more food waste.
Technology
Throughout the course of human history, food and agricultural technologies have been essential to sustaining civilization (Wrangham Reference Wrangham2009). The 20th century saw large gains in agricultural productivity driven largely by increased mechanization (Schmitz and Seckler Reference Schmitz and Seckler1970; Olmstead and Rhode Reference Olmstead and Rhode2001). Modern tractors, combines, and other harvesting equipment save labor costs, and improved technology over the years has also changed on-farm food waste.
Plant genetics have also played a role in reducing the spoilage of food before it reaches consumers. For example, certain cultivars of onions have been selected for improved storability, or shelf life (Petropoulos, Ntatsi, and Ferreira Reference Petropoulos, Ntatsi and Ferreira2017). The first genetically engineered (GE) crop deregulated for commercial use in the United States, the Flavr Savr tomato, was developed to improve shelf life of fresh tomatoes by reducing the formation of an enzyme that dissolves pectin in cell walls (Bruening and Lyons Reference Bruening and Lyons2000). Since the commercial failure of Flavr Savr, the vast majority of GE crops that have been deregulated have traits that improve yield rather than shelf life. However, some of the newest generation of GE crops address food waste: potatoes with reduced black spots and apples with resistance to enzymatic browning (USDA Animal and Plant Health Inspection Service 2017). Research also suggests the potential for enzyme suppression to improve shelf life of papaya, banana, and mango (Meli et al. Reference Meli, Ghosh, Prabha, Chakraborty, Chakraborty and Datta2010).
Over the years, various means of food preservation developed throughout the world. Canning food, the process for which was invented in 1809–10, enables its long-term preservation. Refrigeration, despite its ubiquity in rich countries at all levels of the supply chain from packinghouses and shipping containers to grocery stores and households, is a relatively new technology. Only 5,000 mechanical refrigerators were manufactured in the United States in 1921 (Boorstin Reference Boorstin1974). The use of freezing and refrigeration in the food supply chain (the “cold chain”) has not been as well established in all parts of the world, which leads to food waste and also potential food-safety issues in low-income countries (see, e.g., U.S. International Trade Administration 2016; Sheahan and Barrett Reference Sheahan and Barrett2017). The Institution of Mechanical Engineers (2014) lists more than a dozen “widely used cold chain technologies” to prolong the usable life of perishable goods.Footnote 27
Many technological changes brought improvements to quality of life in the 20th century, and surely among the most important of these were improvements in transportation networks and computing power. Together, these systematic transformations have greatly improved the efficiency with which food products reach market and have reduced the rate of spoilage. Rosegrant et al. (Reference Rosegrant, Magalhaes, Valmonte-Santos and D'Croz2015) demonstrates empirically the correlation between improved transportation networks and food-waste reductions. Improved logistics of transportation, not merely physical or visible infrastructure improvements, have also accounted for reductions in food waste over time and in developed as compared with developing countries.
Institutions and Regulations
As incomes have risen and technological progress has allowed production efficiency to rise, demand for fruits and vegetables without cosmetic defects has soared. Buyer and government grading standards have evolved, too. The result is that some food products must attain higher cosmetic quality or safety standards to be considered marketable.Footnote 28 Standards are used mainly voluntarily to facilitate transactions and improve the efficiency of produce markets.Footnote 29 They likely reduce downstream food waste by ensuring that buyers and sellers agree on the characteristics of products and therefore reduce the amount of undesired or unsellable product received by buyers. Yet at the same time, quality standards have come under public scrutiny, and have been blamed for incentivizing food waste—or, in some cases, compelling it.Footnote 30 Produce that is harvested but does not meet the grade requirements of buyers may not be sold. Some farms will donate off-grade yet edible produce to local charities, but transportation expenses do not always qualify for tax deductions, and donations may therefore still be cost-prohibitive (Broad Leib et al. Reference Broad Leib, Rice, Berkenkamp and Gunders2016). Other farms sell to secondary markets, including roadside vendors and farmers' markets, and also to start-up companies such as Full HarvestFootnote 31 and Imperfect Produce,Footnote 32 which specialize in marketing off-grade produce, explicitly using messages about food-waste reduction. Still some off-grade produce is put to lower-value use such as being plowed back into the soil as fertilizer or sold as animal feed.
Crop insurance has expanded significantly in the last two decades. Acres enrolled beyond the most basic coverage increased by 77 percent from 2000 to 2013 (Weber, Key, and O'Donoghue Reference Weber, Key and O'Donoghue2016). Though designed to reduce farm income variability, researchers have found evidence of unintended consequences of crop insurance. For example, O'Donoghue, Roberts, and Key (Reference O'Donoghue, Roberts and Key2009) demonstrate that with greater insurance coverage, a risk-averse producer could shift to riskier crops or specialize in one or two crops. Cornaggia (Reference Cornaggia2013) finds that county-level yields increased after expansions in insurance policy availability. Yu, Smith, and Sumner (Reference Yu, Smith and Sumner2018) find that a 10 percent increase in premium subsidy for a crop leads to a 0.43 percent increase in planted acreage of that crop at the county level. Crop specialization and increases in yields and planted acreage can all contribute to more on-farm food waste.
Date labels on food have attracted scrutiny as possible culprits in exacerbating food waste. With the sole exception of infant formula, U.S. federal laws do not require the use of date labels or define standards for how dates should be determined. Furthermore, while 41 states require the use of date labels on at least some foods, 33 of these states require labels only for dairy products, eggs, and shellfish (or some subset of these) (Broad Leib et al. Reference Broad Leib, Gunders, Ferro, Nielsen, Nosek and Qu2013).Footnote 33 Furthermore, standards for the labels (related to language and how the date is determined) vary across products and locations. The failure to coordinate date-label requirements across states adds to the consumer confusion presented by the use of varying language on labels, some of which (like “use by”) connote food-safety concerns and others (like “sell by”) which are merely advice to retailers. Wilson et al. (Reference Wilson, Rickard, Saputo and Ho2017) have documented that when consumers are presented with a “use by” label, their “premeditated” level of waste rises and their demand for the product falls. Also, given flexibility in the use and interpretation of date labels, retailers and manufacturers have multiple incentives to err on the early side when labeling food with sell-by or best-by dates.Footnote 34 The existence of date labels has surely led to some reductions in upstream food waste (by allowing for better inventory management) concurrent with increases in downstream waste (by prompting consumers to be more conscious about safety).
A Century of Prosperity and a Largely Hopeful Future
In this article, we provide an in-depth review of the the main approaches to estimating food waste and examine historical trends in food waste using existing data. Though with limitations, the FAO data generally show that for many regions of the world, pre-consumer food loss and waste as a share of total supply has been stable since the 1960s. For the United States, multiple data series on food waste, as a share of total supply based on either weight or calories, also indicate only small changes over 1970–2010.
Our review demonstrates that additional data are needed to better evaluate the long-run trends in food waste. Besides addressing the issues already mentioned in the literature, such as establishing consistent definitions of food waste and transparent documentation of estimation methods, we suggest that top-down estimates could be improved using results from systematic bottom-up studies. Both the FAO and ERS LAFA series employ estimated waste shares at different stages of the supply chain. Some of these shares were chosen using ad hoc case studies, while others are based on expert opinions. FAO is taking steps to improve the consistency of the estimates in its data series, having released two sets of guidelines on data collection and scaling up of small-sample estimates to the national level (Food Loss and Waste Protocol 2016; GSARS 2018). These guidelines recommend that loss and waste surveys be carried out approximately every two to four years. Similarly, ERS could work with other federal departments and local governments to develop protocols for bottom-up case studies on food losses on farms, at retailers, and in households. Such protocols can then be used to guide case studies that are carried out regularly to update estimates of waste shares. In this fashion, time series data consistently measuring food waste at different stages of the supply chain can be established. These data will be invaluable for understanding the long-run evolution of food waste, in terms of its quantity, composition, and distribution along the supply chain, and hence for setting food-waste reduction priorities and serving as the baselines for cost-benefit analysis of food-waste reduction policies and programs.
We also assess losses of various commodities by stage of the supply chain by comparing the ERS LAFA estimates for 2015 with an earlier snapshot study (Kling Reference Kling1943). This comparison suggests (albeit in a limited way) downstream shifts in food waste over the better part of the 20th and 21st centuries. Our synthesis of changes in food prices, household incomes, improvements in technology, and shifts in culture and institutions provides similar hypotheses about the evolution of food waste over the last century. With higher-quality data, future econometric studies can test some of these hypotheses.
If consumer-level food waste has risen while farm and retail food waste has decreased, both trends may represent progress—i.e., welfare gains. This suggests that the socially optimal level of food waste may have risen over the last century. Consumers who waste food were willing to purchase it although they knew that discarding it later was a possibility. Producers who waste food are able to pass through costs to their buyers. So even if a century has yielded no change in aggregate shares of food wasted throughout the supply chain, and even if the aggregate monetary value of food wasted has increased as a result of this downstream shift in waste (see Bellemare et al. Reference Bellemare, Çakir, Peterson, Novak and Rudi2017), it is far from clear that economic inefficiency associated with food waste has worsened.
What does the future hold for food waste? Growing awareness of the food-waste problem will likely lead to more policies to address food waste, but of course these policies will not necessarily be efficiently designed to solve the problem. Looking to the private sector for solutions suggests a bright future for reductions in food loss. Upstream, solutions such as temperature and humidity sensors can help reduce storage and processing losses and improve yield of marketable farm products. And in developing countries, cheaper and less capital-intensive solutions like hermetic bags hold great promise for reducing waste and improving the food security of the world's poor. Streamlined, real-time inventory management systems may reduce food waste for grocery retailers, who are now able to benefit from machine learning and improved logistics science. Consumers, especially in urban areas, could foreseeably begin taking advantage of technology solutions such as online grocery vendors and other food-delivery services to cut down on waste and the need for storing food in their home kitchens. Smartphone apps such as “Too Good To Go,” which helps restaurants and cafés sell their surplus food at a low price, “Olio,” which helps individuals find takers for unwanted food, and USDA's “FoodKeeper,” which gives consumers instructions on storing food, storage timelines, and reminders about using food, all have great potential to reduce downstream food waste. However, darker possibilities are looming too. Climate change and extreme weather events may increase storage losses and ruin planned harvests. Crop diseases may spread, and molds like aflatoxins may render food unsellable. These outcomes would increase upstream food waste and decrease social welfare.
Acknowledgments
We appreciate the helpful comments of the editor Max Melstrom, anonymous referees, and participants at the 2017 AAEA meeting and 2018 New York Produce Show and Conference. Conversations with Marc Bellemare, Jean Buzby, Bill Foster, Elise Golan, Fred Kuchler, and attendees at the 2018 U.S. Food Waste Summit helped shape parts of this paper. Yixing Tian provided excellent research assistance.
Data Availability Statement
The primary data used in this article are available at the following web addresses: https://www.ers.usda.gov/data-products/food-availability-per-capita-data-system/ and http://www.fao.org/faostat/en/#data/FBS/report. Additional data sources are listed in the References section of the article. Kevin Hall (NIH) provided one data series. He may be contacted at kevinh@niddk.nih.gov.


 Open access