 RSS Feed
 by Calculated Risk on 8/27/2022 08:11:00 AM
Saturday, August 27, 2022
Schedule for Week of August 28, 2022
The key report this week is the August employment report on Friday.
Other key indicators include the August ISM manufacturing index, August auto sales, and Case-Shiller house prices for June.
10:30 AM: Dallas Fed Survey of Manufacturing Activity for August. This is the last of the regional Fed manufacturing surveys for August.
 9:00 AM: S&P/Case-Shiller House Price Index for June.
This graph shows the year-over-year change in the seasonally adjusted National Index, Composite 10 and Composite 20 indexes through the most recent report (the Composite 20 was started in January 2000).
The consensus is for a 20.6% year-over-year increase in the Comp 20 index for June.
9:00 AM: FHFA House Price Index for June. This was originally a GSE only repeat sales, however there is also an expanded index.
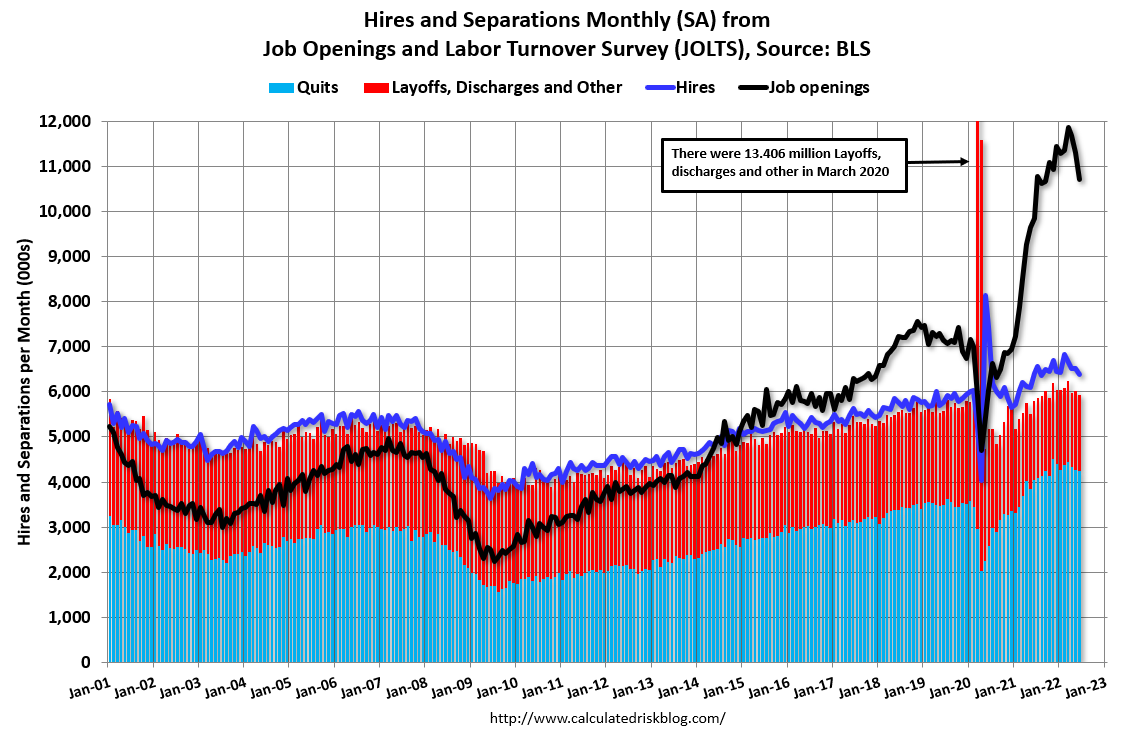 10:00 AM ET: Job Openings and Labor Turnover Survey for July from the BLS.
 This graph shows job openings (yellow line), hires (purple), Layoff, Discharges and other (red column), and Quits (light blue column) from the JOLTS.
Jobs openings decreased in June to 10.698 million from 11.303 million in May.
The number of job openings (black) were up 9% year-over-year and Quits were up 5% year-over-year.
7:00 AM ET: The Mortgage Bankers Association (MBA) will release the results for the mortgage purchase applications index.
8:15 AM: The ADP Employment Report for August. This report is for private payrolls only (no government). This is the first release of a new methodology.
9:45 AM: Chicago Purchasing Managers Index for August.
8:30 AM: The initial weekly unemployment claims report will be released. The consensus is for an increase to 250 thousand from 243 thousand last week.
 All Day: Light vehicle sales for August. The consensus is for light vehicle sales to be 13.6 million SAAR in August, up from 13.34 million in July (Seasonally Adjusted Annual Rate).
This graph shows light vehicle sales since the BEA started keeping data in 1967. The dashed line is the current sales rate.
10:00 AM: ISM Manufacturing Index for August. The consensus is for the ISM to be at 52,1, down from 52.8 in July.
10:00 AM: Construction Spending for July. The consensus is for a 0.1% decrease in construction spending.
 8:30 AM: Employment Report for August. The consensus is for 280,000 jobs added, and for the unemployment rate to be unchanged at 3.5%.
There were 528,000 jobs added in July, and the unemployment rate was at 3.5%.
This graph shows the job losses from the start of the employment recession, in percentage terms.
The current employment recession was by far the worst recession since WWII in percentage terms. However, 29 months after the onset of the current employment recession, all of the jobs have returned.


