


The price paid for most health care services is negotiated between the patient’s insurance plan and the medical provider, and the patient’s cost-sharing is based on this negotiated price. Thus, in most cases, the provider’s list price or “charge” is irrelevant to what the patient and the insurer pay. However, there are exceptions to this general rule. First, uninsured patients are often liable for the provider’s full charge, unless the provider agrees to a discounted amount or a state law limits the amount uninsured patients can be charged. Second, a patient who is treated by an out-of-network provider may be billed at the provider’s full charge. While insurance companies typically pay a portion of the bill in these cases, patients are responsible for covering the remainder—a practice known as balance billing.
As a result of the No Surprises Act (NSA), which went into effect at the beginning of 2022, balance billing is now prohibited for certain services where patients typically are unable to select their provider. These include services delivered during medical emergencies or delivered by certain hospital-based providers like anesthesiologists, radiologists, or pathologists.
This analysis builds on our previous work and examines how provider charges compare to Medicare rates for years 2013-2021, with a particular focus on the specialties where surprise billing was common before the NSA went into effect. Because the data examined in this analysis go through 2021, they help illustrate the magnitude of charges that patients were potentially exposed to before the law took effect and, thus, give some sense of the size of balance bills that patients are now protected against.
We utilize published aggregated claims data from the Centers for Medicare and Medicaid Services (CMS) that report charges for providers treating Medicare patients from 2013 to 2021. Similar to previous analyses, we calculate mean charges relative to Medicare prices as well as the 20th, 50th, and 80th percentiles of this ratio for each physician specialty category. See the methodological appendix in Adler, Lee, Hannick, and Duffy (2019) for full details.
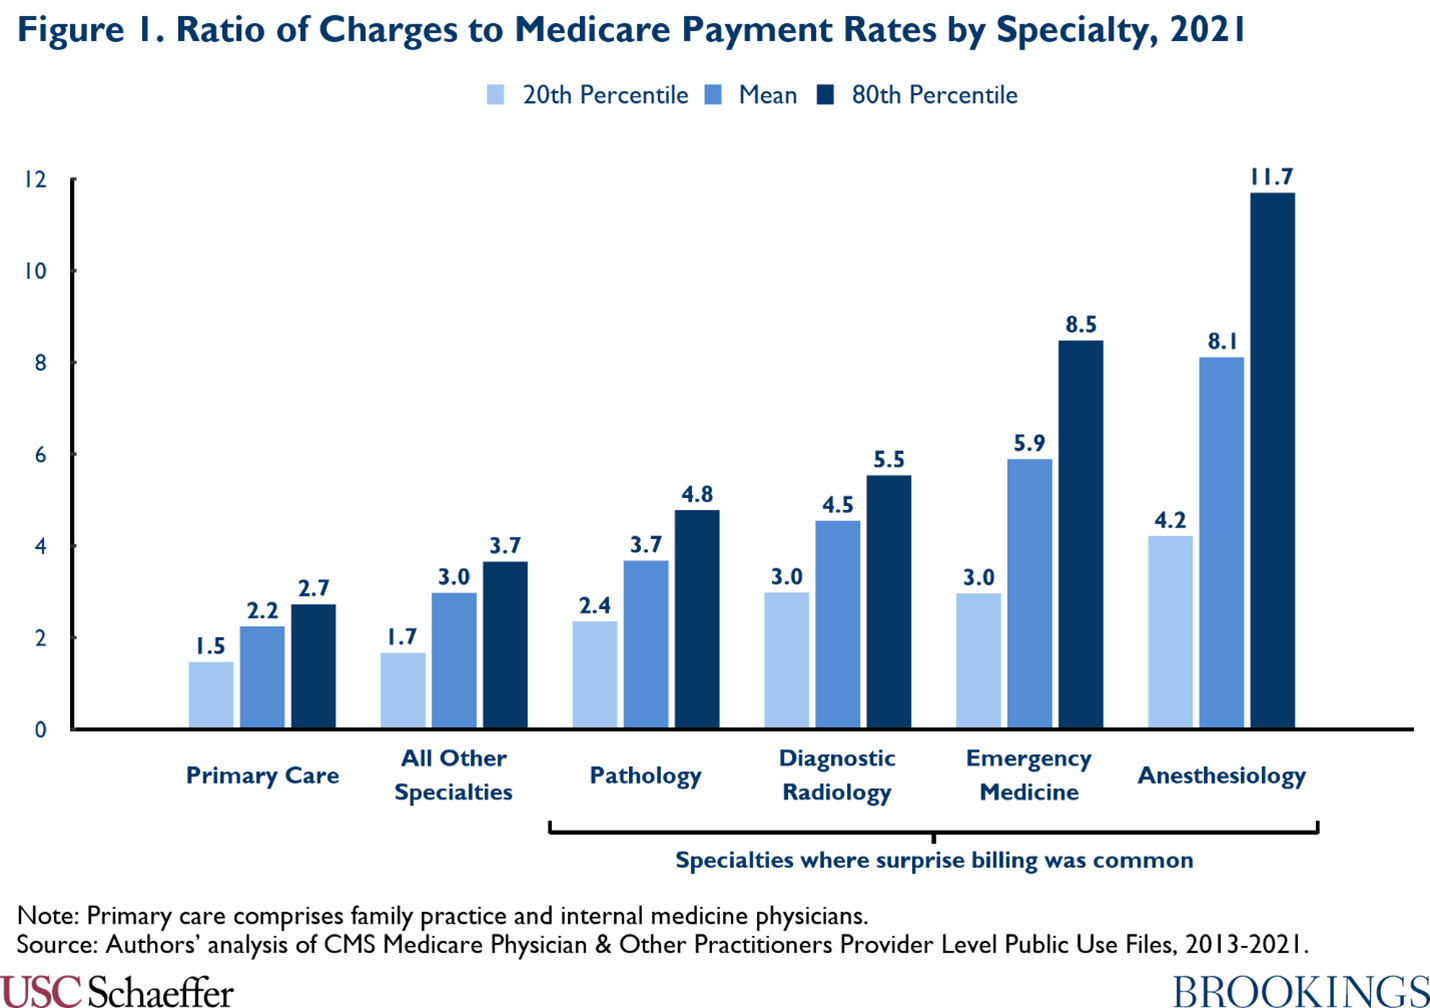
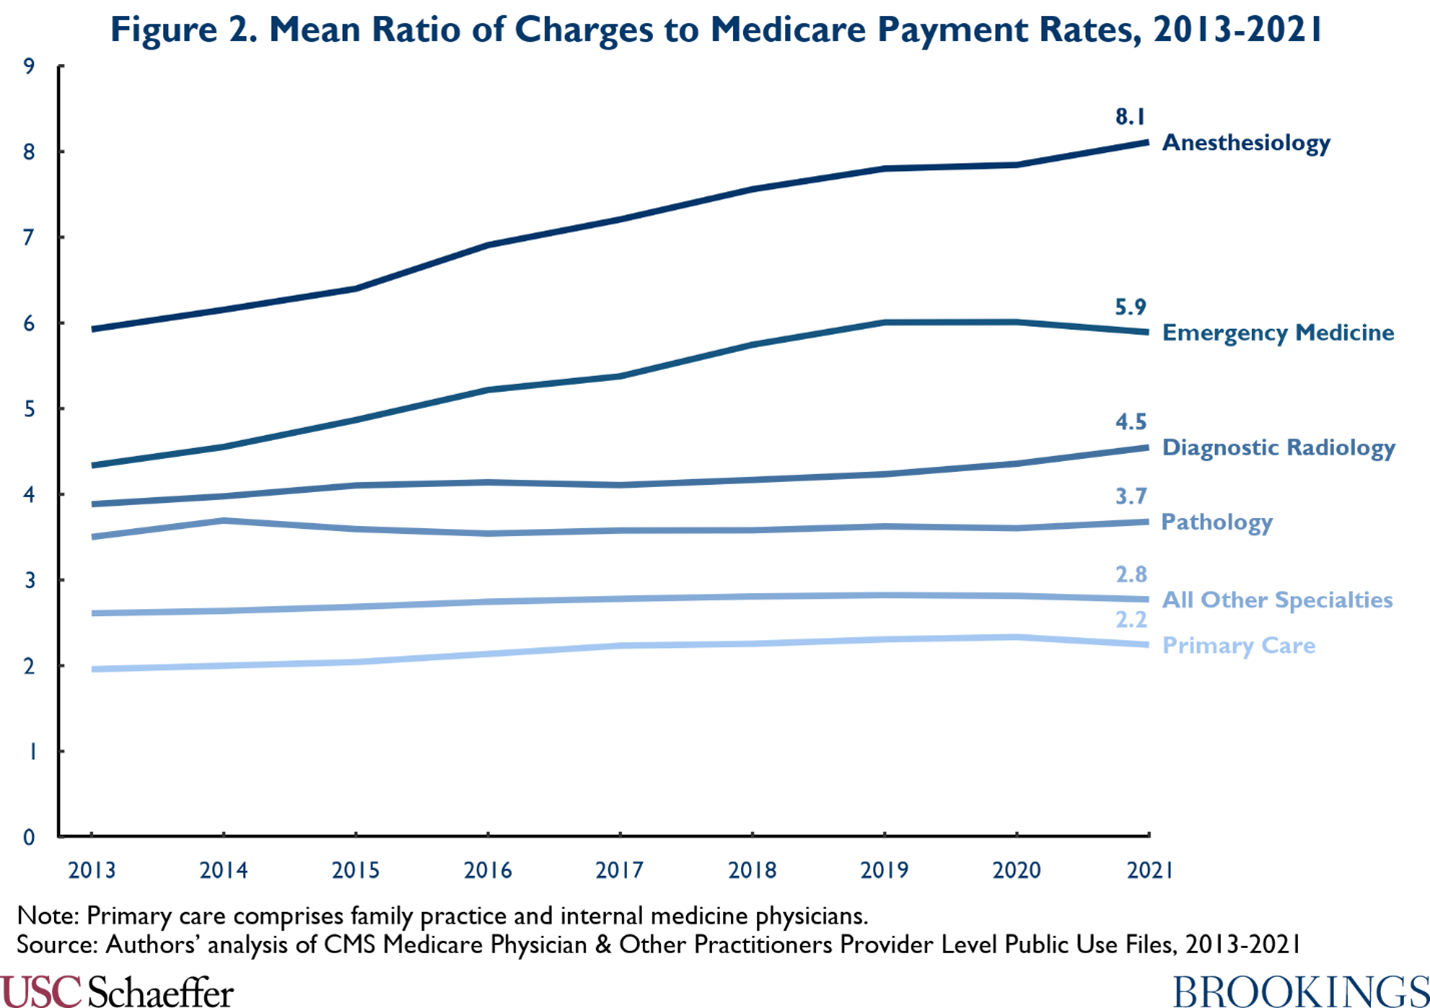
Consistent with previous analyses, we find much higher ratios of charges to Medicare rates in specialties where surprise billing is most common — such as emergency medicine, pathology, diagnostic radiology, and anesthesiology — than in primary care or other specialties. [1]
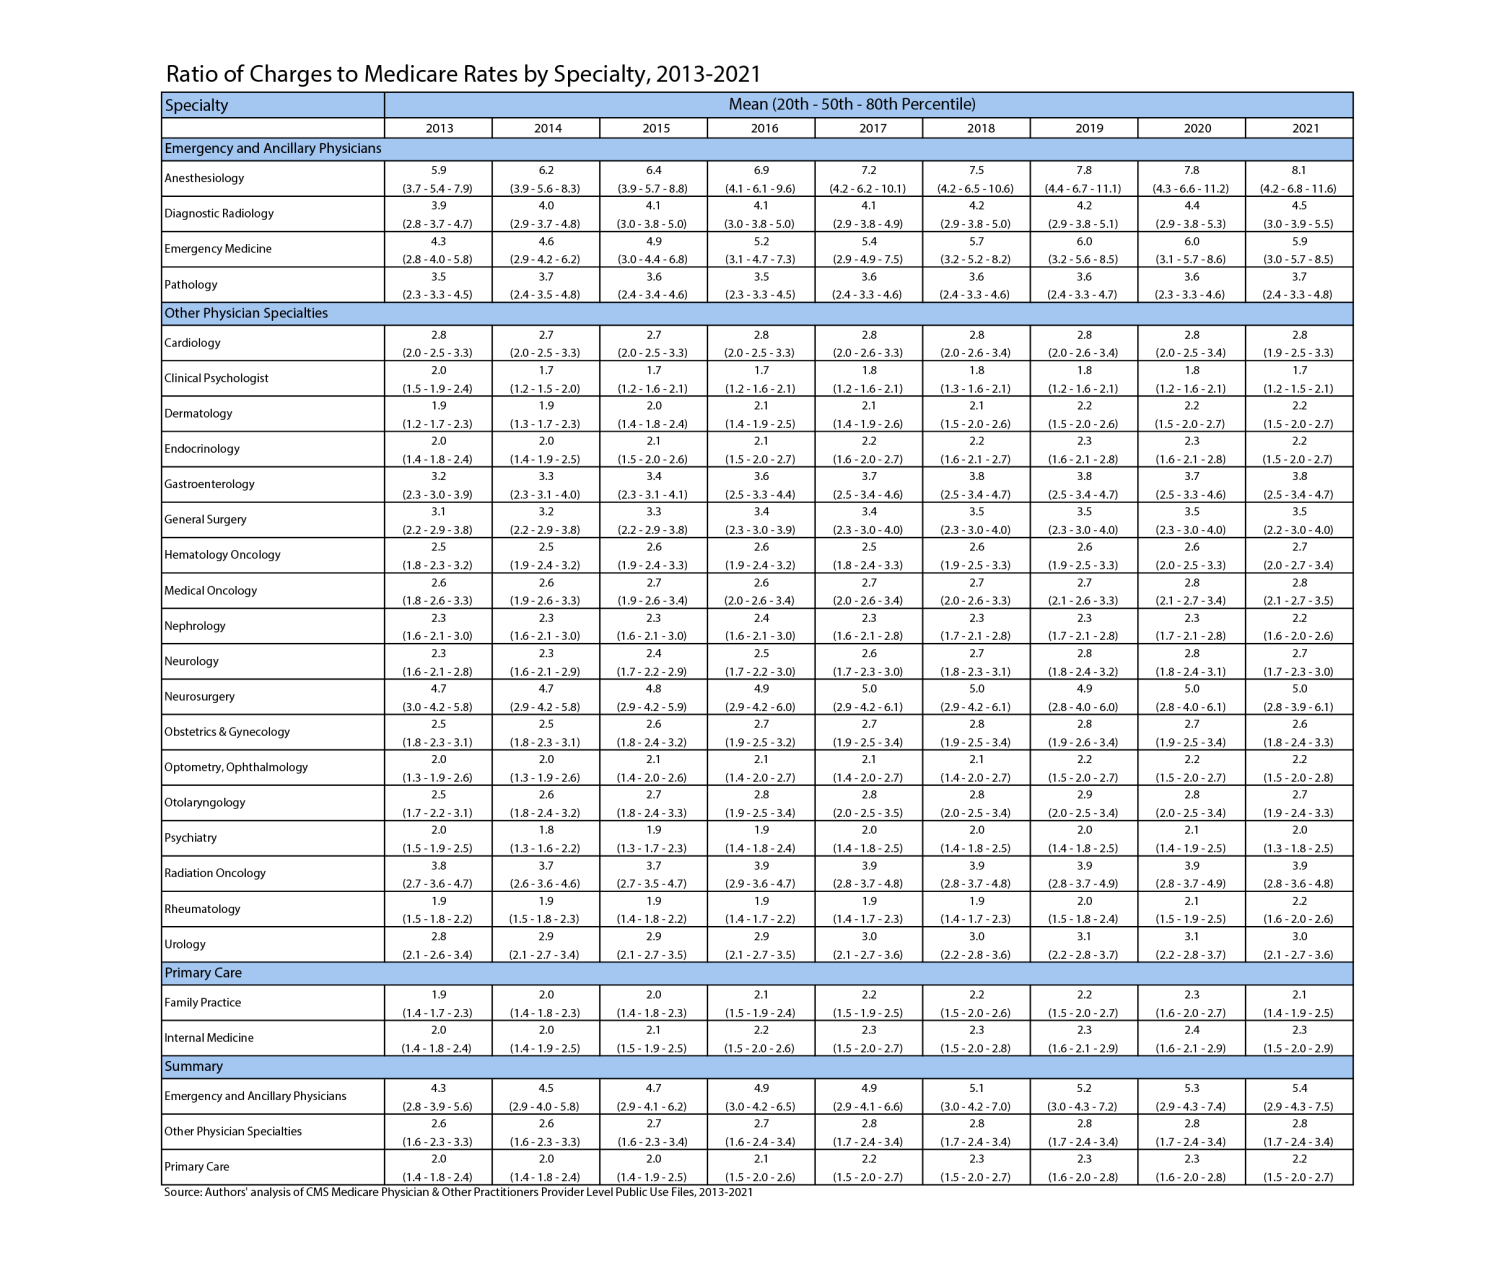
Anesthesiology and emergency medicine already had higher charges in 2013 than other specialties, and the growth in charges among these two specialties was also considerably greater relative to others. Between 2013 and 2019, the mean charge ratio for the two specialties grew by an annual average of 4.7% and 5.6% respectively, compared to 2.8% for primary care and 1.3% in all other specialties. However, charge growth has slowed across the board in the past couple years. From 2019 to 2021, mean charges stayed the same or declined relative to Medicare rates in most specialties (see the table below for more detail).
[1] Some of our estimates for early years in the sample differ modestly from our prior analyses. These differences are the result of switching from the Medicare Physician & Other Practitioners “Provider and Service” level file to the “Provider” level file. This change reduces issues with suppression in the public use files and increases the size of our sample. The main substantive difference in our results is compression in the range between the 20th and 80th percentile of charges across a variety of specialties. Some of the means and medians are also somewhat higher, particularly in the surprise billing specialties.
The Brookings Institution is financed through the support of a diverse array of foundations, corporations, governments, individuals, as well as an endowment. A list of donors can be found in our annual reports published online here. The findings, interpretations, and conclusions in this report are solely those of its author(s) and are not influenced by any donation.
Appendix
Related Content

Authors