What are Baltimore’s most pressing issues?
Everybody who’s anybody has an answer for this question, particularly during an election year.
Last fall, city residents themselves got the chance to weigh in. More than 5,000 filled out a survey designed to capture their top priorities ahead of the 2020 mayoral and City Council races. The majority of responses came from in-person outreach efforts targeting historically under-counted populations. The rest came from people who took the 35-question survey online.
The survey is part of a project co-funded by Open Society Institute-Baltimore and the T. Rowe Price Foundation called Blueprint for Baltimore. Organizers plan to ask hopefuls for city office to respond to survey-takers’ priorities at a series of nonpartisan public forums, then monitor whether those who are elected honor their commitments. Most of those seeking the Democratic nomination for mayor, which in deep-blue Baltimore usually predicts the outcome of the general election, are expected at the first forum on Feb. 5.
In addition to the report released today, the results are to later be accessible through an online data website, said Seema Iyer, associate director of the University of Baltimore’s Jacob France Institute, which is helping to develop the site.
So, what did thousands of Baltimoreans say about the city? Here are five key findings, and a couple of things to keep in mind when interpreting the results.
1. Most respondents had a positive view of their neighborhood, though white respondents were far more likely to say their neighborhood was a “great” place to live.
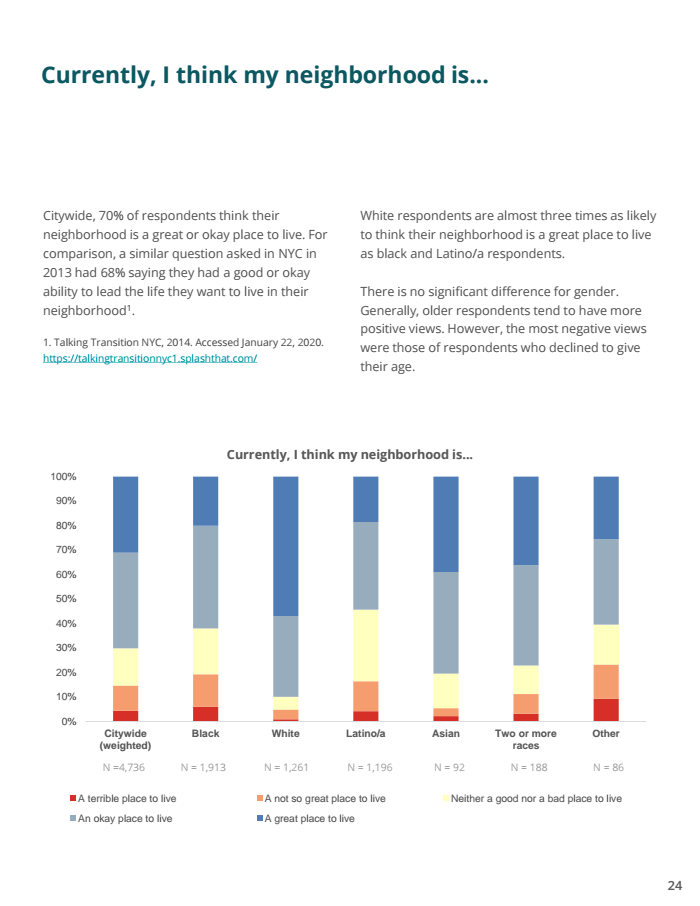
Seventy percent of those surveyed said they think their neighborhood is a “great” or “okay” place to live.
//assets.documentcloud.org/embed/loader/enhance.js
White respondents were almost three times as likely to say their neighborhood is a “great” place to live, compared with black and Latino respondents, who more often said their neighborhood was “okay” or “neither a good nor bad place to live.”
When asked what they thought their neighborhood would be like in four years, a little over half said it would stay the same. A third said it would get better, and 15% said it would get worse.
2. Those surveyed were three times more likely to recommend expanding the Safe Streets program than increasing the number of Baltimore Police officers as an anti-violence solution.
When asked to pick a single thing that would make the most difference in their neighborhoods, those surveyed chose “safer streets” as the top response among eight options. With the exception of Latino respondents, whose first choice was “less trash on the streets” (with “safer streets” a distant second), this answer was consistent across race, gender and age.
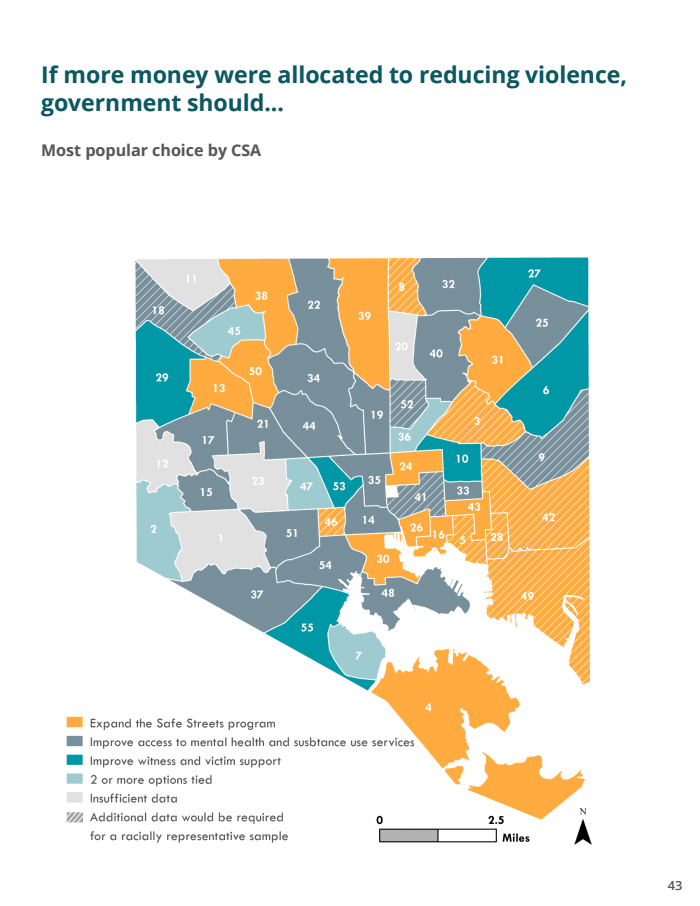
A separate question asked how the city government should allocate money toward reducing violence. Citywide, more than 30% of respondents selected “expanding the Safe Streets program,” which refers to an initiative that uses street-wise mediators to interrupt and prevent violence in dangerous Baltimore neighborhoods without involving police. Just over 10% chose “increase the number of officers in my neighborhood.”
//assets.documentcloud.org/embed/loader/enhance.js
3. Investing in youth programs was the number-one priority for city spending.
Citywide, this choice was more than twice as popular as the next three, and it was the No. 1 choice regardless of gender, age and turnout in the 2016 election.
When asked how the city should allocate money to support young people, supporting job access for youth was the most popular response citywide, followed by providing money to low-income families and expanding neighborhood recreation centers.
The survey included responses from nearly 300 people under the age of 18; this age group was the least likely to select expanding rec centers.
4. Respondents across the board prioritized finding solutions for vacant homes, particularly when it comes to the Affordable Housing Trust Fund.
Fewer vacant homes was the third-most impactful change that respondents said could be made in the city’s neighborhoods, and cleanup of abandoned streets was the most popular suggestion for how the government could create jobs for Baltimoreans.
Reuse of vacant buildings for affordable housing was deemed the No. 1 priority across the board for using resources from the Affordable Housing Trust Fund, a $20 million a year fund established two years ago.
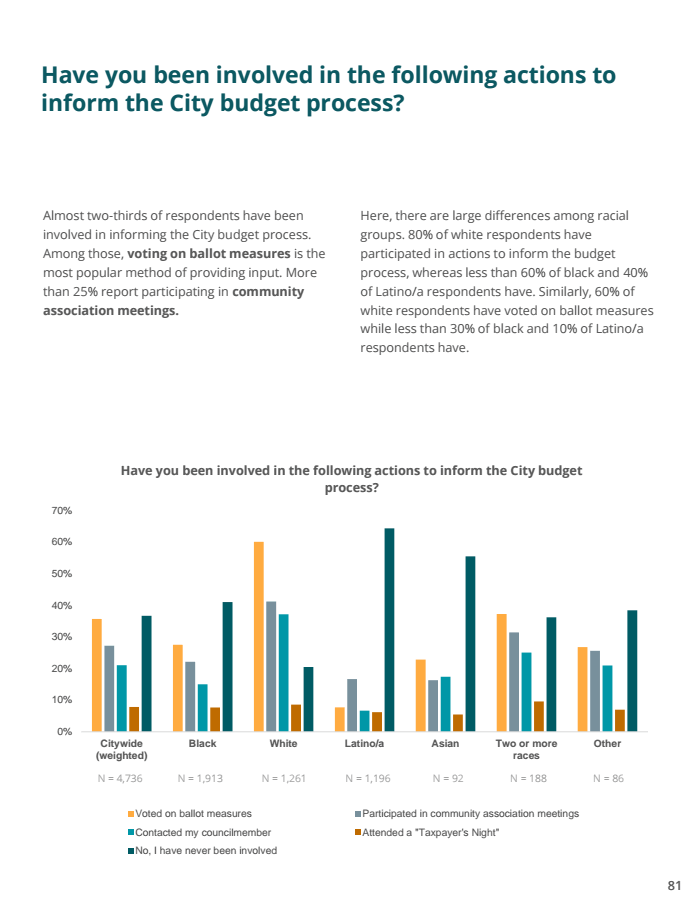
5. Three quarters of respondents said they wanted to be more involved in city decisions about how to spend public funds, but actual civic participation differs starkly along racial lines.
Eighty percent of white respondents said they have participated in actions to inform the budget process, compared with less than 60% and 40% of black and Latino respondents, respectively. This racial disparity also holds true when it comes to voting on ballot measures; 60% of white respondents said they did so, compared with less than 30% of black and 10% of Latino respondents.
//assets.documentcloud.org/embed/loader/enhance.js
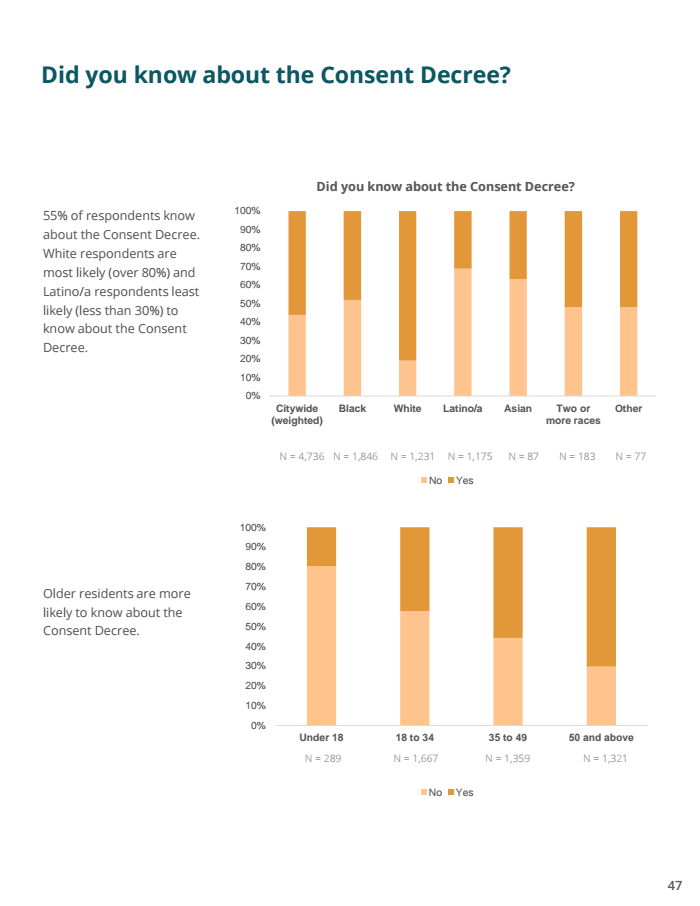
Black and Latino respondents were also significantly less likely to know about the city’s consent decree with the U.S. Department of Justice, which mandated sweeping police reforms following a Justice Department investigation of the Baltimore Police Department after the 2015 death of Freddie Gray. The vast majority — more than 80% — of white respondents said they were aware of the consent decree, while about half of black respondents and about a third of Latino respondents did.
//assets.documentcloud.org/embed/loader/enhance.js
The report notes that initiatives like the Baltimore Police Monitoring team, the independent group overseeing the implementation of consent decree reforms, could work to connect with a more diverse group of residents and remove barriers to participation.
Keep in mind: The survey is not a random sample of Baltimore residents.
The Blueprint team collected 4,863 valid responses, less than half of their initial target of around 10,000.
“Frankly, we really emphasized reaching folks that were hard to reach,” Evan Serpick, director of strategic communications at Open Society Institute-Baltimore, said. “We probably could have gotten higher numbers if we had done a bigger online push.”
About 70% of responses came from in-person outreach efforts by community groups including Baltimore Votes, Black Girls Vote, Black Leaders Organizing for Change, CASA and the No Boundaries Coalition.
Whether responses came in from in-person or online, because they were not from a random sample of residents, the survey cannot be generalized to Baltimore as a whole.
“Representation is always hard,” said Eri Furusawa, an analyst at HR&A Advisors, which consulted on the survey methodology. But she said, “I think we got the population we’ve always struggled to reach.”
Keep in mind: In some neighborhoods, the respondent pool is not racially representative of the population.
Certain groups were over- or under-sampled in the survey. For example, 25% of responses came from Latinos, who make up only 5% of the city’s population. For this reason, citywide responses were adjusted to match Baltimore’s racial makeup, said Furusawa.
However, as the report notes, responses were not adjusted at the neighborhood level. For example, in the Greater Rosemont area, black respondents comprise only 50% of the respondent pool, while they are 86% of the population. When looking at maps of responses by neighborhood, keep in mind that results may be different had the respondent pool been more racially representative of the population in these areas, which are marked in the legend of each map.


