ATTOM Data Solutions’ new Q1 2021 U.S. Home Affordability Report shows that median home prices of single-family homes and condos in Q1 2021 were more affordable than historical averages in 52 percent of the counties analyzed. That figure was down from 63 percent in Q1 2020 and 95 percent in Q1 2016.
The latest home affordability analysis conducted by ATTOM, reported that with workplace pay rising and home mortgage rates continuing to hit historic lows, major expenses on a median-priced home nationwide still consumed just 23.7 percent of the average wage across the country in Q1 2021. That figure was up from 22 percent in Q1 2020 and 19.7 percent in Q1 2016. However, the report noted that figure remained well within the 28 percent standard lenders prefer for how much homeowners should spend on those major expenses.
ATTOM’s home affordability report determines affordability for average wage earners by calculating the amount of income needed to meet monthly home ownership expenses — including mortgage, property taxes and insurance — on a median-priced home, assuming a 20 percent down payment and a 28 percent maximum “front-end” debt-to-income ratio. That required income is then compared to annualized average weekly wage data from the Bureau of Labor Statistics. The Q1 2021 report noted the 80-percent down payment criterion marks an update to ATTOM’s affordability analysis, which now shows smaller portions of income needed to afford home ownership than recent reports.
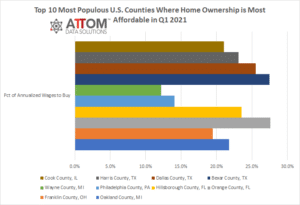
According to ATTOM’s Q1 2021 home affordability analysis, among the 552 counties analyzed for the report, 59 percent had major home-ownership expenses on typical homes in Q1 2021 that were affordable for average local wage earners, based on the 28-percent guideline. The largest of those counties included Cook County (Chicago), IL; Harris County (Houston), TX; Dallas County, TX; Bexar County (San Antonio), TX, and Wayne County (Detroit), MI.
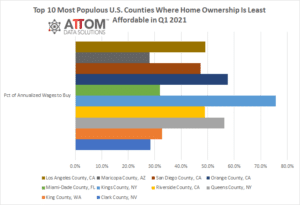
The report noted that among the most populous 225 counties included in the analysis, 41 percent had major expenses on median-priced homes that were unaffordable for average local earners in Q1 2021. Those countries included Los Angeles County, CA; Maricopa County (Phoenix), AZ; San Diego County, CA; Orange County, (outside Los Angeles), CA and Miami-Dade County, FL.
In this post, we take a deeper dive into the data behind the Q1 2021 home affordability report to uncover the complete list of the top 10 most populous counties where major home-ownership expenses are considered affordable for local average-wage earners. Those counties include: Cook County, IL (21.0 percent of annualized wages needed to buy); Harris County, TX (23.1 percent needed to buy); Dallas County, TX (25.5 percent needed to buy); Bexar County, TX (27.5 percent needed to buy); Wayne County, MI (12.2 percent needed to buy); Philadelphia County, PA (14.1 percent need to buy); Hillsborough County, FL (23.5 percent needed to buy); Orange County, FL (27.6 percent needed to buy); Franklin County, OH (19.5 percent needed to buy); and Oakland County, MI (21.8 percent needed to buy).
Also, in this post we dive deeper into the data behind the Q1 2021 home affordability report to uncover the complete list of the top 10 most populous counties where major home-ownership expenses are considered unaffordable for local average-wage earners. Those counties include: Los Angeles County, CA (49.1 percent of annualized wages needed to buy); Maricopa County, AZ (28.1 percent needed to buy); San Diego County, CA (47.3 percent needed to buy); Orange County, CA (57.7 percent needed to buy); Miami-Dade County, FL (31.9 percent needed to buy); Kings County, NY (75.7 percent needed to buy); Riverside County, CA (48.9 percent needed to buy); Queens County, NY (56.3 percent needed to buy); King County, WA (32.8 percent needed to buy); and Clark County, NV (28.4 percent needed to buy).
ATTOM’s latest home affordability report also noted the counties requiring the smallest percent of average local wages needed to buy a median-priced home in Q1 2021, were Schuylkill County, PA (outside Allentown) (6.3 percent of annualized weekly wages needed to buy a home); Bibb County (Macon), GA (8.3 percent); Fayette County, PA (outside Pittsburgh) (8.4 percent); Macon County (Decatur), IL (9.9 percent) and Robeson County, NC (outside Fayetteville) (10.6 percent).
The Q1 2021 analysis reported that among the counties that required the greatest percentage of wages needed to buy were Kings County (Brooklyn), NY (75.7 percent of annualized weekly wages needed to buy a home); Marin County, CA (outside San Francisco) (75.5 percent); Santa Cruz County, CA (69.9 percent); Monterey County, CA, (outside San Francisco) (68.1 percent) and Maui County, HI (65.9 percent).
Want to learn more about home affordability in your area? Contact us to find out how!


