Women play a critical role in American democracy. Across the country, their participation has determined the outcomes of federal, state, and local elections. Women of color are becoming a larger force among these voters. They now represent almost one-third of citizen voting-age (CVA) women, an increase of 10 percentage points from 2000 to 2017. In other words, there are 13.6 million more CVA women of color than there were in 2000, compared with 6 million additional CVA non-Hispanic white women.
Much of this increase in women of color is due to the rapid rise in the number of Latina, Asian American, Native Hawaiian, Pacific Islander, and multiracial women voters combined with the steady growth of Black and American Indian or Alaska Native women voters. Women of color, increasingly, are shaping the composition of the female electorate and their overall priorities. But as the share of women voters has grown and taken on added importance, so have efforts to dilute and suppress their impact. Voter suppression tactics—from strict voter ID laws to discriminatory voter purges, limitations on voting hours, reductions in voting locations, and language barriers—are increasingly used to discourage and undermine women of color voters’ participation and potential influence on election outcomes. Thus, as these voters’ share of the electorate continues to rise, it is critical to accelerate efforts to protect their ability to participate in the political process.
Examining recent trends in voting eligibility and participation among women of color voters provides valuable insights. While it is clear that these voters are well on their way to becoming a significant powerhouse in determining overall election outcomes, it is also clear that activating and turning out these voters will require targeted efforts that energize them and address their interests.
Black women’s voter eligibility and participation rates
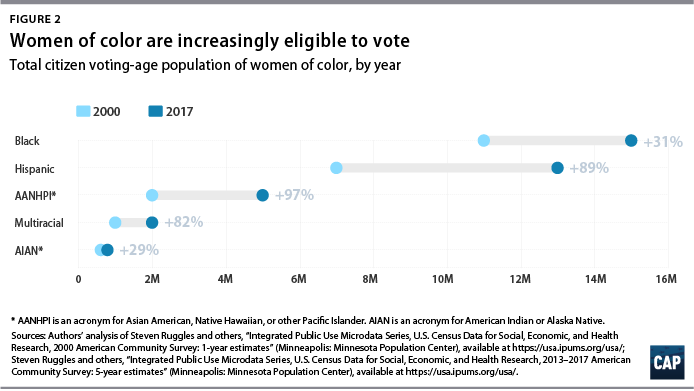
Between 2000 and 2017, the CVAP of Black women increased by 31 percent.5 Today, at least 15 million Black women are voting-age U.S. citizens—approximately 3.5 million more than in 2000. (see Methodology Figure A3)
Since 2000, Black women’s share of the female CVAP has grown the most in Georgia, Mississippi, Maryland, Connecticut, and Alabama. Today, Black women constitute:
- 33 percent of the female CVAP in Georgia
- 38 percent of the female CVAP in Mississippi
- 31 percent of the female CVAP in Maryland
- 9 percent of the female CVAP in Connecticut
- 27 percent of the female CVAP in Alabama
Black women are one of the most active voting blocs in the U.S. electorate. (see Methodology Figure A1) But in 2016, just 66 percent of eligible Black women cast their ballots on Election Day—down from 74 percent in 2012 and 75 percent in 2008.6 However, this recent decline may be short-lived. Black women’s turnout in 2018 surged 16 percentage points from that of previous midterm elections, from 41 percent to 57 percent. A recent analysis from Groundswell and the AAPI Civic Engagement Fund found that women of color fueled the massive increase in turnout nationwide by mobilizing friends and family and engaging voters beyond the ballot box.7 If 2008 or 2012 turnout levels were replicated in 2020, Black women would cast at least 1 million more ballots than they did in 2016, reaching a total of roughly 11 million votes.
Latinas’ voter eligibility and participation rates
Latinas are the second-largest and second-fastest-growing population of women of color voters in the United States. Since 2000, the CVAP of Latinas increased by at least 89 percent—from 7.1 million voters to 13.6 million voters.8 Today, Latinas’ largest share of the female CVAP is in New Mexico and Texas, where they constitute 42 percent and 29 percent, respectively. If present trends continue, they may soon constitute the largest group of CVA women of color in the country.9 (see Methodology Figure A4)
The following states saw the largest expansion of Latinas’ CVAP share nationwide. Since 2000, Latinas’ share of the female CVAP increased by:
- 9 percentage points in California
- 8 percentage points in Florida, Nevada, and Arizona
- 5 percentage points in Texas
Despite Latinas’ surge in eligibility, they—like many other women of color—face large and persistent barriers to participation. While all voters of color endure rampant suppression, these tactics frequently target Latina and other Latinx voters.10 These factors, combined with insufficient outreach efforts, limit eligible Latinas’ full electoral participation. For three decades, a nearly 20-percentage-point turnout gap has existed between Latinx and white Americans.11
The 2018 midterms may have marked a turning point for Latinas’ political participation. Thanks, in part, to the long-standing leadership of important groups such as Voto Latino, NALEO Educational Fund, and Mi Familia Vota Education Fund, Latina voter turnout surged by 17 points compared with that of the 2014 midterms.12 (see Methodology Figure A1) If these and other organizations succeed in eliminating racial disparities in participation, Latinas could comprise one of the most powerful voting blocs in the country. For example, had Latinas turned out at the same rates as their non-Hispanic white counterparts in 2016, it would have resulted in an estimated 2.7 million additional ballots being cast for president for the United States.13
Asian American, Native Hawaiian, and Pacific Islander women’s voter eligibility and participation rates
Asian American, Native Hawaiian, and Pacific Islander (AANHPI) women are the fastest-growing and perhaps the most diverse racial demographic of women voters in the United States. These voters have roots in dozens of different countries and possess multitudes of cultural and socioeconomic backgrounds.14
Between 2000 and 2017, the CVAP of AANHPI women grew at a faster rate than any other racial group. During this period, the CVAP of AANHPI women increased by 97 percent, from approximately 2.6 million to more than 5 million people.15 The surge is particularly evident in certain states. AANHPI women’s share of the female CVAP increased the most in Nevada (4 percentage points) and California (4 percentage points). (see Methodology Figure A5) Today, AANHPI women hold their largest share of the female CVAP in Nevada (9 percent), California (14 percent), and Hawaii (48 percent).
Since the turn of the century, California, Nevada, New Jersey, New York, and Washington experienced the largest increase in AANHPI women’s share of the female CVAP. Almost 1.3 million more CVA AANHPI women reside in these five states today than did in 2000.
Structural barriers to participation have long depressed turnout among AANHPI women voters. In 2016, just 2.4 million AANHPI women cast their ballots for president of the United States. Had they turned out at the same rates as their non-Hispanic white counterparts, approximately 3.4 million AANHPI women would have voted.16 In other words, voter suppression and insufficient engagement may have prevented more than 1 million AANHPI women from making their voices heard on Election Day. However, similar to other groups, AANHPI women voted at far higher rates in 2018 than in previous midterm elections. (see Methodology Figure A1) The recent surge in eligibility and turnout should remind lawmakers that AANHPI women are a growing power in the U.S. electorate whose views and priorities deserve attention and respect.
American Indian and Alaska Native women’s voter eligibility and participation rates
American Indian and Alaska Native (AI/AN) women voters are perhaps the most politically neglected electoral demographic in the country. Between 2000 and 2017, the CVAP of AI/AN women grew by 29 percent.17 Today, approximately 800,000 AI/AN women are eligible to vote in U.S. elections. These voters constitute a considerable portion of the female CVAP in certain states. For instance, approximately 9 percent and 14 percent, respectively, of CVA women in New Mexico and Alaska are AI/AN women. Yet these voters are often neglected in political campaigns and targeted for voter suppression. Perhaps as a result, turnout among these voters continues to lag behind their counterparts of other racial and ethnic backgrounds. (see Methodology Figure A1) Like other groups, AI/AN women turned out to vote at higher rates in 2018 than in 2014. Yet this group experienced a smaller surge than other groups. American democracy suffers when its citizens are unable to fully participate in the electoral process. These data demonstrate the necessity of prioritizing AI/AN women in political outreach and engagement.
The emerging electoral power of multiracial women voters
Fifty years ago, multiracial marriages were uncommon and, in some places, illegal. In 1960, these marriages represented just 0.4 percent of all American marriages.18 But by 2010, 8.4 percent of all American marriages were multiracial, and 15 percent of all new marriages were multiracial.19 This shift has contributed to a substantial increase in the number of Americans who identify as multiracial, meaning they identify as having two or more races.
Multiracial women are one of the fastest-growing segments of the female CVAP. Between 2000 and 2017, the CVAP of multiracial women increased by 82 percent—from 1.1 million to 2 million.20 In other words, there are at least 900,000 additional voting-age multiracial American women than there were in 2000. These changes are not equally distributed across all 50 states. Since 2000, non-Hispanic multiracial women voters have increased their share of the female CVAP by 5 percentage points in Hawaii and at least 2 percentage points in states such as Oregon and Alaska. But they hold their largest share of the female CVAP in Alaska (5 percent), Oklahoma (6 percent), and Hawaii (19 percent).
In recent elections, multiracial women turned out to vote at lower rates than their white and Black counterparts but at higher rates than Latina and AANHPI women voters. (see Methodology Figure A1) Yet there is insufficient research on the barriers to participation they endure or the issues that drive their political engagement. The dearth of robust, disaggregated data on multiracial women prevents any rigorous analysis of these voters’ unique political views and policy concerns. Far more research is necessary to understand and appreciate this emerging force in the U.S. electorate.21
Women of color hold a variety of views on important policy questions relating to the economy and jobs, health care, immigration, public safety, and discrimination. The following section attempts to shed light on these perspectives by elevating research from organizations that seek to empower women of color and presenting findings from a new CAP analysis. This section is not restricted to a specific subset of voters with a particular political ideology. Instead, it incorporates the views of women of color as a whole, including those who identify as conservative, moderate, or liberal, and explores how views may vary by education, income, geography, and other factors.
Black women’s electoral power and policy perspectives
Black women are a key and dominant force driving the increasing electoral power of women of color. They are among the largest and most consistently engaged demographic groups in American politics. Between 2000 and 2017, the CVAP of Black women increased by 31 percent.22 Today, at least 15 million Black women can cast their ballots in United States elections. Despite targeted voter suppression and systematic disenfranchisement, Black women continue to register and vote at some of the highest rates in the country. Yet few analyses of voter preferences have focused specifically on Black women. While there are exceptions, such as the annual Power of the Sister Vote Survey and landmark Intersections of Our Lives survey, far more research is necessary to fully appreciate these voters’ diverse perspectives. The following analysis attempts to shed new light on Black women voters’ electoral power, political behavior, and unique policy views.
Black women voters: Key takeaways
- Black women constitute the largest and most politically active demographic of women of color voters. At least 15 million Black women are eligible to vote, and they participated at some of the highest rates of all women voters.
- Black women voters are more likely than any other racial or ethnic group of women to support a pathway to legal status for undocumented immigrants. Approximately 85 percent of these voters want undocumented immigrants to have a pathway to legal status.
- Black women voters are among the strongest supporters of gun violence prevention measures. For example, Black women gun owners are more likely to favor stricter gun laws than white women who do not own guns.
Black women voters are dissatisfied with the status quo of governance in Washington. Ahead of the 2018 midterms, 79 percent disapproved of the way Congress was handling its job.23 Moreover, 74 percent of these voters, and 89 percent of those with college degrees, want government to do more to solve problems.24 But Black women also want elected officials to understand that political and policy differences exist within the Black community.25 A new CAP analysis of data from the Associated Press-NORC Center for Public Affairs Research, which surveyed 8,500 Black women of all political leanings, along with existing research helps to illustrate some of these concerns.
Health care and related issues
While Black women are far from single-issue voters, health care stands out as a key priority for this powerful voting bloc.26 According to CAP analysis, ahead of the 2018 midterms, more than 1 in 4 of these voters (29 percent)—and 47 percent of those over the age of 65—considered health care more important than any other issue facing the country.27 (see Methodology Figure A2)
Black women see government as playing a critical role in expanding access to affordable health care. An overwhelming 80 percent of these voters believe the federal government should be responsible for ensuring all Americans have coverage.28 Furthermore, 62 percent of Black women consider it extremely important for the 116th Congress to guarantee that people with preexisting conditions can still access health insurance.29
Black women are also strong supporters of the landmark Affordable Care Act (ACA), with approximately three-quarters saying that they want to preserve or expand it.30 With such strong views on this issue, it is unsurprising that Black women are highly critical of the Trump administration’s record on health care. A survey taken ahead of the 2018 midterms revealed that more than 4 out of every 5 of Black women voters (84 percent) disapproved of the way President Trump was handling health care.31
Black women are also strong supporters of women’s reproductive health and rights. Two-thirds of these voters believe that abortion should be legal in all or most cases. Black women who consider health care the top national issue, have college degrees, or have an annual household income of more than $100,000 are especially likely to support a woman’s right to choose. More than three-quarters of these voters (76 percent, 77 percent, and 80 percent, respectively) believe abortion should be legal in all or most cases.
Furthermore, Black women are deeply concerned with the public health crisis of opioid addiction. More than three-quarters of these voters (78 percent) are somewhat or very concerned about the use of opioids such as prescription pain medications and drugs such as heroin and fentanyl in their community. Older Black women are especially worried about the opioid epidemic. In fact, 87 percent of those over the age of 50 are concerned about opioid use in their communities, compared with less than three-quarters of Black women under the age of 30.
The economy and jobs
Black women consider the economy and jobs increasingly important, with surveys demonstrating that 65 percent of Black women consider congressional action to create well-paying jobs a national priority.32 A large majority of Black women also recognize the dangers of an economy that overwhelmingly favors the wealthy over middle-class or low-income Americans. More than 4 in 5 Black women, including 90 percent of those with college degrees, believe the economic system favors the wealthy too much.33 At the same time, two-thirds of Black women believe that the economic system does not favor the middle class enough, and 88 percent hold this belief with regards to low-income Americans. Interestingly, Black women’s sincere concern for how the economic system disadvantages low-income people does not vary significantly by educational level, income, or geography.
A majority of Black women recognize that the economy is not working for everyone. Black women without college degrees and those with an annual household income of less than $50,000 are especially likely to have this perspective. Almost three-quarters of these women (73 percent and 74 percent, respectively) believe that the national economy is in a “not so good” or “poor” condition.
Black women also largely believe that the Trump administration’s policies contribute to the unsatisfactory state of the U.S. economy. Ahead of the 2018 midterms, 77 percent of Black women disapproved of the 2017 Tax Cuts and Jobs Act, which provided a $1.5 trillion tax cut to big corporations and the wealthy. Furthermore, 64 percent of these voters predicted that the Trump administration’s trade policies would hurt the economy in their area, and almost three-quarters believed those policies would hurt the national economy. Approximately 83 percent of Black women voters disapproved of President Trump’s handling of international trade, and 80 percent disapproved of his handling of the economy in general.
Immigration and related issues
In the past year, multiple surveys have revealed that Black women are strong defenders of the civil and human rights of immigrants. Almost three-quarters of Black women voters (74 percent)—and 84 percent of those with college degrees or an annual household income of more than $100,000—believe immigrants make the United States a better place.34 Furthermore, CAP analysis of data collected ahead of the 2018 midterms reveals that 85 percent of Black women voters want undocumented immigrants to have a pathway to legal status.35 A 2019 survey asked women of color whether they considered it extremely, very, somewhat, or not at all important for Congress to provide a pathway to citizenship and visas to reunite immigrant families. More than 1 in 3 Black respondents considered these policies extremely important.36 Given these views, it is perhaps unsurprising that more than 4 in 5 Black women disapprove of President Trump’s handling of border security and immigration policy (87 percent and 82 percent, respectively).37
Public safety
The epidemic of gun violence in the United States remains one of the top national issues for Black women. Today, more than one-third of Black women consider gun violence among the top three issues threatening their families and the broader Black community today.38
Black women are among the biggest champions of strong gun violence prevention measures. More than 4 in 5 Black women, or 82 percent, think gun laws should be made stricter.39 More than 9 in 10 Black women who are senior citizens or who have a household income of more than $100,000 hold this belief.40 Even Black women who own guns are strong believers in gun violence prevention measures. In fact, they are more likely than white women who do not own guns to support stricter gun laws.
Most Black women also believe the Trump administration has undermined public safety in the United States. For instance, 60 percent of Black women voters think the administration has made the country less safe from terrorism, and 62 percent think it has made the country less safe from crime.
Racial and gender discrimination
Across the country, millions of Black women endure discrimination due to the rampant and compounding effects of misogyny and racism. One survey found that 40 percent of Black women have experienced gender discrimination when applying for jobs, and half have experienced this form of discrimination when seeking a promotion or equal pay.41 When it comes to interacting with the police, 44 percent have endured racial discrimination.42 Overall, 79 percent of Black women believe white people have more advantages than Black people in U.S. society today.43
Perhaps as a result, two landmark 2019 surveys reveal that Black women consider combating discrimination a key priority. The fifth annual Power of the Sister Vote poll found that Black women believe the rise in hate crimes and racism, as well as the need for equal rights and equal pay, are among the most important issues facing the Black community today.44 Similarly, the Understanding the Priorities of Women of Color Voters survey reported that 75 percent of Black women consider it extremely important for the current Congress to make progress on ending racial, ethnic, and cultural discrimination in America.45
Latinas’ electoral power and policy perspectives
Latinas are the second-largest and second-fastest-growing population of women of color voters in the United States. As stated above, between 2000 and 2017, the CVAP of Latinas increased by 89 percent—from 7.1 million voters to 13.6 million.46 Yet pollsters have consistently neglected Latinas in national surveys of American voters, so less is known about their unique concerns and perspectives. Subsequent subsections highlight the growing electoral power of Latina voters as well as some of the political and policy issues they care about most.
Latina voters: Key takeaways
- If present trends continue, Latina voters may soon constitute the largest group of eligible women of color voters in the country. Since 2000, the CVAP of Latinas increased by 89 percent—or 6.4 million people.
- Approximately 72 percent of Latina voters, and more than 4 in 5 of those between the ages of 18 and 25 or with annual incomes of less than $25,000, believe the federal government should ensure all Americans have health care coverage.
- More than 7 in 10 Latina voters—and 83 percent of those between the ages of 18 and 25—oppose the construction of a wall along the U.S.-Mexico border.
Ahead of the 2018 midterms, three-quarters of Latina voters (76 percent) were either dissatisfied with or angry at the way the federal government was working.47 But two-thirds of these voters still believed government had an important role to play in solving America’s problems.48 The following subsections highlight previously published research and present findings from a new CAP analysis in an effort to reveal Latina voters’ unique views on a variety of policy issues, including health care, the economy and jobs, immigration, public safety, and discrimination. Where possible, these subsections also reveal significant differences of opinion among Latina voters by income level, education, age, geography, and other demographic factors.
Health care and related issues
Expanding access to affordable health care is a key policy concern for many Latina voters. A 2019 Intersections of Our Lives survey asked women of color whether they considered it extremely, very, somewhat, or not at all important for Congress to ensure people with preexisting conditions can still get health insurance and that everyone is provided access to affordable health care. Most Latina voters considered both efforts extremely important, at 62 percent and 57 percent, respectively.49
Latina voters, especially younger women and those with low incomes, are also strong believers in the role of government in the American health care system. Approximately 72 percent of Latina voters, and more than 4 in 5 of those between the ages of 18 and 25 or with annual incomes of less than $25,000, believe the federal government should ensure all Americans have health care coverage.50
Latina voters are also concerned with the current state of women’s reproductive health and rights. In 2019, 82 percent of these voters reported that it is extremely important for candidates to support women’s right to make their own decisions about their reproductive health.51 Most of these voters (61 percent) also believe abortion should be legal in all or most cases.52
Unfortunately, Latina voters have not found an ally in the Trump administration when it comes to health care policy. Approximately 71 percent of these voters—and 80 percent of those who consider health care the top issue facing the country—disapprove of the way President Trump has handled health care.
The economy and jobs
Latina voters are keenly aware of the fact that recent economic gains have not benefited all Americans equally. More than 3 in 4 Latina voters (78 percent) believe that the current system overly favors the wealthy, and 76 percent believe that it doesn’t favor low-income Americans enough.53 For many, this unfair system hits close to home. Despite the current administration’s rhetoric, 1 in 4 Latina voters report that their families are falling behind financially. Overall, 59 percent are dissatisfied with the current health of the economy.
Latina voters’ dissatisfaction with the current economy is also seen in their highly critical views of the Trump administration’s record on economic policy. More than two-thirds (69 percent) disapprove of the $1.5 trillion tax break for big corporations and the wealthy, and 58 percent believe the administration’s trade policies will hurt the national economy. Overall, 65 percent of Latina voters disapprove of President Trump’s handling of the economy, and 70 percent disapprove of his handling of international trade.
Immigration and related issues
Latina voters recognize the contributions and humanity of those who immigrate to the United States. Almost three-quarters of Latina voters (74 percent) believe immigrants make the country a better place.54 Further, 81 percent think government should offer undocumented immigrants a chance to apply for legal status. When one survey asked women of color whether they considered a pathway to citizenship for immigrants extremely, very, somewhat, or not at all important, 40 percent of Latina respondents reported that they consider it extremely important.55
Data demonstrate that the Trump administration’s overall approach to immigration policy is at odds with Latina voters’ views and priorities. Approximately 71 percent of Latina voters—and 83 percent of those between the ages of 18 and 25—oppose the construction of a wall along the U.S.-Mexico border.56 Ahead of the 2018 midterms, three-quarters of these voters—and 83 percent of Latinas under the age of 30 or residing in urban areas—disapproved of the way President Trump was handling immigration policy overall.57
Immigrants and immigrants’ rights are a key policy concern for many Latina voters. In fact, they are more likely to select this issue as the top national priority than any other topic. But these voters also consider issues such as health care, the economy and jobs, and public safety major national priorities. (see Methodology Figure A2) Latinas are not a monolith. These voters possess significant cultural, socioeconomic, and experiential diversity. Understanding and appreciating the variety of perspectives Latinas hold is critical for responsible policy development.
Public safety
According to CAP analysis, almost 1 in 5 Latina voters (19 percent) considered gun policy or terrorism the most important national issues ahead of the 2018 midterms.58 Data suggest that these voters, especially those who are senior citizens, recognize gun violence as endemic and believe stricter gun laws are an important part of the solution. Nearly three-quarters of Latina voters (73 percent) and 88 percent of those over the age of 65 believe American gun laws should be made stricter.59
The Trump administration’s record on public safety has disappointed many Latina voters. Only 1 in 5 Latina voters believe the current administration has made the United States safer from terrorism.60 Perhaps as a result, a 2019 Intersections of Our Lives poll found that 60 percent of these voters felt it was extremely important for Congress to address and make progress on combating terrorism in the next two years.61 Similarly, when it comes to crime, almost half of Latina voters think the administration has actually made the country less safe, and more than 1 in 3 believe it has not made any difference.62 These findings reveal widespread dissatisfaction and disagreement with the current administration’s approach to gun violence, crime, and terrorism in the United States.
Racial and gender discrimination
Discrimination is a harmful and persistent problem for many Latina voters. More than 1 in 5 Latinas report experiencing racial discrimination when interacting with police or going to the doctor or a health clinic.63 More than 1 in 4 have also endured gender discrimination when applying for jobs. Employers have discriminated against 37 percent of Latinas during promotion or wage considerations.64 Many Latina voters also recognize the systematic way in which discrimination affects other racial and ethnic groups. A majority of Latina voters (57 percent) believe white Americans have more advantages in society than Black Americans.65 More than two-thirds (69 percent) of those living in urban areas or who have college degrees also share these views.66
An Intersection of Our Lives poll revealed that 56 percent of Latina voters nationwide believe that ending racial, ethnic, and cultural discrimination is an extremely important issue for Congress to address in the next two years.67
Asian American, Native Hawaiian, and other Pacific Islander women voters’ electoral power and policy perspectives
Since 2000, the CVAP of Asian American, Native Hawaiian, and Pacific Islander (AANHPI) women68 has grown faster than that of any other racial group. Yet their concerns and perspectives are insufficiently prioritized or disaggregated in political analyses and agenda setting. Policymakers have also erected considerable obstacles that undermine the full electoral participation of AANHPI women. The following subsections attempt to address this form of entrenched structural racism by elevating AANHPI women voters’ growing electoral power and highlighting their distinct and varied policy perspectives.
AANHPI women voters: Key takeaways
- Between 2000 and 2017, the CVAP of AANHPI women grew at a faster rate than any other racial group. During this period, the population increased by 97 percent, from approximately 2.6 million voters to 5.1 million.
- Almost all AANHPI women voters report discomfort with economic inequality and a desire for better wages and working conditions. Approximately 77 percent believe the current economic system unfairly benefits the wealthy, and 71 percent believe it does not favor those with the least wealth enough. As many as 96 percent of Asian American voters also believe it is important for workers to be paid wages that allow them to support their families.
- Many AANHPI women voters believe the Trump administration has undermined public safety in the United States. In fact, 48 percent think the administration has made Americans less safe from terrorism, and 57 percent think it has made Americans less safe from crime.
With few exceptions, political pollsters rarely collect data with a large enough sample of AANHPI women to conduct any serious examination of their perspectives on key policy issues. Using recently published data from the Associated Press-NORC Center for Public Affairs Research, supplemented with findings from the landmark 2018 Asian American Voter Survey (AAVS) and 2019 Intersections of Our Lives survey, this subsection of the report explores AANHPI women’s views on five leading policy issues and how these perspectives may vary by ethnicity, age, education, income, and geography. While the following subsection focuses on AANHPI women as a whole, particular subsets of the community are highlighted throughout to remain consistent with underlying data sources and underscore any intraracial differences that may exist.
Health care and related issues
AANHPI women voters strongly support the idea of expanding access to affordable health care. According to the AAVS, 62 percent of Asian American women often worry about the high cost of prescription drugs and being able to afford the health care they need.69 A substantial 90 percent also think it is very or extremely important that workers have access to affordable and quality health care.70 Furthermore, CAP analysis reveals that more than 1 in 4 AANHPI voters overall (26 percent) consider health care the most important issue facing the country.71 (see Methodology Figure A2)
AANHPI women see a critical role for government to play in expanding access to care. More than three-quarters of these voters (77 percent) believe it is the government’s responsibility to provide health care.72 By and large, AANHPI women also support the ACA. A 2018 survey of registered voters, including those who identify as conservative, moderate, and liberal, found that almost two-thirds (63 percent) of AANHPI women believe the ACA should be preserved or expanded. Given the Trump administration’s efforts to repeal the landmark health care law, it is perhaps unsurprising that more than two-thirds of these voters (68 percent) disapprove of the way President Trump is handling health care.
When it comes to reproductive health, AANHPI women also recognize the right to have an abortion as fundamental. Approximately 71 percent of these voters believe abortion should be legal in all or most cases. Among those who consider health care the most important issue facing the country, 4 out of 5 AANHPI women believe abortion should be legal.
The opioid crisis is also a significant concern for AANHPI women. More than four-fifths of these voters (84 percent) are concerned about the use of opioids such as prescription pain medications and drugs such as heroin and fentanyl in their community.
Immigration and related issues
Many AANHPI women consider immigration a key national priority. On this issue, these voters overwhelmingly recognize immigrants’ contributions to the United States. According to CAP analysis, 71 percent of AANHPI women voters believe immigrants do more to help the country, and 79 percent support a pathway to legal status. Younger AANHPI women are especially likely to express support for immigrants, with 89 percent of those between the ages of 18 and 25 supporting a pathway to legal status.73
Approximately 62 percent of Asian American women support an eventual pathway to citizenship for undocumented immigrants. But this is one of many issues that underscore the importance of robust, disaggregated AANHPI data. While these data are not broken down by gender, the 2018 AAVS demonstrates that support for a pathway to citizenship varies by ethnic background. According to this survey, just more than half (54 percent) of Vietnamese American respondents believe undocumented immigrants should have the opportunity to eventually become citizens.74 By contrast, 76 percent of Asian Indian respondents hold this view.75 Despite potential differences of opinion by ethnic background, it is clear that the vast majority of AANHPI women voters value immigrants, regardless of their citizenship or immigration status.
AANHPI women also largely oppose the Trump administration’s approach to American immigration policy. Three-quarters of these voters oppose the Trump administration’s plan to build a wall along the U.S.-Mexico border, and 73 percent disapprove of the way President Trump is handling immigration in general.76
The economy and jobs
Survey data demonstrate that AANHPI women voters are deeply uncomfortable with the pervasive inequality and worker exploitation that characterize the United States economy. More than three-quarters (77 percent) believe that the current economic system unfairly benefits the wealthy, and 71 percent believe that it does not favor those with the least wealth enough. A majority of AANHPI women also oppose the Trump administration’s 2017 tax cuts for large corporations and the wealthy; believe the administration’s trade policy will hurt the national economy; and disapprove of President Trump’s handling of the economy in general.77
Asian American women strongly believe workers should have the wages and benefits they need to securely transition into retirement. In fact, 88 percent think it is very or extremely important for workers to be able to retire with dignity and financial security.78 While most Asian American voters—both men and women—hold this particular view, differences exist by ethnic background. For instance, 94 percent of all Japanese Americans respondents to one survey considered dignity and financial security in retirement very or extremely important, compared with 76 percent of all Korean American respondents.79 Potential differences in opinion regarding financial security and economic well-being again underscore the need for robust, disaggregated data in political polling.
Wages and working conditions were on the minds of many Asian American women voters ahead of the 2018 midterm elections. More than 4 out of 5 of these voters considered the phenomenon of wages not keeping up with the cost of living a very or extremely important issue in the election.80 Furthermore, 96 percent of Asian American women voters believe it is important for workers to be paid wages that allow them to support their families.81 The vast majority of these voters also think it is critically important for workers to have safe working conditions. Two-thirds of Asian American women voters also reported that they would support an increase in their state’s minimum wage.82
Public safety
Most AANHPI women voters are dissatisfied with the current state of public safety in the United States. More than 1 in 4 of these voters (27 percent) consider gun violence or terrorism the most important issue facing the country. Further, 57 percent of AANHPI women voters actually think the Trump administration has made Americans less safe from crime.83 Perhaps as a result, 4 in 5 AANHPI women want gun laws to be made stricter, and 54 percent of AAPI women consider it extremely important for the current Congress to advance commonsense gun legislation.84
Similar to their views on crime, almost 1 in 3 AANHPI women (30 percent) believe the Trump administration has not made the United States any safer from terrorism, and 48 percent think the administration has made the country less safe.85 A majority of all Asian American women also often worry about the threat of terrorism, and 53 percent of AAPI women think it’s extremely important for the current Congress to make progress in protecting the United States from terrorists.86
Racial and gender discrimination
In 2018, a national survey of Asian American women voters found that 80 percent considered harassment and discrimination to be very or extremely important issues for the upcoming midterm elections.87 The following spring, a separate survey found that 55 percent of AAPI women considered ending racial, ethnic, and cultural discrimination an extremely important priority for the 116th Congress.88 These findings may reflect the fact that countless AANHPI women endure racial and gender discrimination every year. Approximately 1 in 5 Asian American women have been personally discriminated against when seeking medical care or a college education.89 More than 1 in 4 Asian American women (26 percent) have also endured discrimination when applying for jobs, and 34 percent have been discriminated against during equal pay and promotion considerations.90 It therefore comes as little surprise that 94 percent of Asian American women believe it is important for workers to be free from harassment and discrimination.91
American Indian and Alaska Native women’s electoral power and policy perspectives
AI/AN women constitute an increasing share of the CVAP, yet there is very little publicly available polling that focuses specifically on their political engagement or policy views. Existing data reveal substantial barriers to participation and dissatisfaction with the status quo in governance. The following subsection of this report attempts to shed light on these issues by presenting a limited view—due to insufficient data availability—of the electoral power and policy perspectives of AI/AN women voters.
AI/AN women voters: Key takeaways
- While AI/AN women may constitute a small percentage of the CVAP nationwide, they comprise 9 percent and 14 percent of the female CVAP in New Mexico and Alaska, respectively.
- Approximately 40 percent of AI/AN women voters consider the economy, jobs, and immigration the most important issues facing the country.
- While AI/AN women are far from homogenous, they possess common views across certain issues. For instance, 83 percent are concerned about the use of opioids in their community; 85 percent are concerned about the effects of climate change; and 87 percent disapprove of President Trump’s handling of U.S. Supreme Court nominations.
AI/AN women are frequently excluded from political polls and other research that disaggregates voters by race and gender. When they are surveyed, sample sizes are often too small for rigorous analysis of differences that exist within the AI/AN community. A new CAP analysis of recently released data from the Associated Press-NORC Center for Public Affairs Research seeks to present a limited view of AI/AN women voters’ perspectives on key issues.92 However, AI/AN people possess a variety of backgrounds, experiences, and outlooks—and the relatively small sample size contained in this analysis (400 AI/AN women voters) makes disaggregation unfeasible. Therefore, only findings that apply to at least two-thirds of AI/AN women are reported, and results must be interpreted with care.
Economy and jobs
Ahead of the 2018 midterm elections, 1 in 5 AI/AN women voters considered the economy and jobs to be the most important issue facing the country.93 Many of these voters were displeased by the way the economic system unfairly benefits certain groups as well as with the Trump administration’s approach to economic policy. For example, 75 percent of AI/AN women voters believe the economy overly favors the wealthy, and 73 percent believe it does not favor those with the least wealth enough. Furthermore, more than 7 in 10 AI/AN women voters disapprove of the way President Trump has handled the economy and international trade. The 2017 tax cuts for large corporations and the wealthy are among the administration’s most cited achievements, yet two-thirds of these AI/AN women voters disapprove of the policy. Overall, the data are clear: When it comes to the economy and jobs, AI/AN women are dissatisfied with the status quo.
Immigration and related issues
Immigration stands out as another top issue for AI/AN women voters. Despite the tremendous diversity that exists among AI/AN women, the vast majority shares the view that the current administration has taken the wrong approach to immigration policy. Ahead of the 2018 midterms, more than three-quarters of AI/AN women (78 percent) disapproved of President Trump’s handling of this issue. This may have been driven by these voters’ substantial support for undocumented immigrants; 73 percent of AI/AN women voters support a pathway to legal status for undocumented immigrants and their families.94
Other key issues
Insufficient data availability restricts CAP’s ability to measure AI/AN women voters’ views on broad issues such as health care, public safety, and racial and gender discrimination. But existing data reveal AI/AN women’s shared views across several other important issues. For example, 83 percent of AI/AN women voters are concerned about the use of opioids in their community; 85 percent are concerned about the effects of climate change; and 87 percent disapprove of President Trump’s handling of Supreme Court nominations.95 While such findings are useful for the development of responsive policies, existing data do not begin to paint a full picture of the views and priorities of AI/AN women. Pollsters, politicians, and political candidates must devote additional time and resources toward listening to and learning from this critical group of voters and to appreciating the distinct differences that exist within and across communities.
Women of color are a powerhouse in the U.S. electorate. In the past decade, the voter-eligible population of women of color increased six times faster than that of white women.96 Yet lawmaker apathy and insufficient data collection and disaggregation severely limit the development of policy proposals that center these voters. These factors, combined with voter suppression, undermine the health and well-being in our electoral process while also perpetuating racial and gender disparities. The following recommendations identify important areas for future progress.
Collect robust, disaggregated data on women of color
The lack of comprehensive, disaggregated data on women of color voters is an enormous barrier to analyzing their voting preferences, life experiences, and expectations from policymakers. There is much to do to better reflect their views in polls and surveys as well as to ensure that their perspectives are reflected in policy decisions. Lawmakers, pollsters, and political organizations must begin prioritizing outreach to women of color voters, their communities, and institutions with expertise on their unique concerns and perspectives. These efforts must include focus groups and robust, in-language polling that disaggregates women of color voters by ethnicity and other demographic factors.
Combat voter suppression and reform election administration
Voter suppression tactics are a growing threat to the electoral participation of women of color. Eliminating these policies and practices is essential for a healthy democracy. Lawmakers should leverage existing research to advance policies that dismantle structural barriers to voter participation and address specific challenges women of color encounter in the American health care, economic, immigration, housing, and criminal justice systems. While these policies may aim to meet universal or societal goals, lawmakers must design them to target the barriers facing distinct demographic groups.97
Pursue comprehensive and responsive policy reforms
It is essential for lawmakers to advance solutions that address the needs and policy priorities of women of color voters.
Expand access to and improve the quality and affordability of health care
Too many women of color face barriers to accessing affordable, quality health care. The prevalence of systemic barriers—including racism and discrimination—that undermine women of color’s health care options combined with the continued attacks on access to comprehensive reproductive health care have eroded women of color’s health and well-being and increasingly put their lives at risk. The ACA was a crucial step forward, and preserving its progress is vital, yet communities of color continue to endure higher uninsured rates than their white counterparts.98 Universal coverage proposals such as CAP’s Medicare Extra plan would eliminate the coverage gap through an improved Medicare plan that is open to all Americans and still allows employers to offer coverage.99 But it is also critical to pursue other policies specifically addressing women of color, such as the high rates of maternal and infant mortality among Black women, and broader reforms to disrupt bias, promote cultural competency, and ensure all Americans are free from discrimination when pursuing the care they need.100
Promote equal pay and economic security for women of color
The United States is home to stark and persistent racial disparities in income and wealth. Women of color in particular are consistently paid far less than their white colleagues and are overrepresented in minimum-wage jobs.101 In fact, Asian American, Black, Latina, and AI/AN women earn just 90 cents, 62 cents, 54 cents, and 57 cents, respectively, for every dollar earned by their white male counterparts.102 They also experience high rates of discrimination when seeking promotions or higher wages.103 Comprehensive equal pay reforms—such as greater pay transparency, anti-retaliation protections, disaggregated pay data collection and disclosure, limited use of salary history in hiring decisions, and increased enforcement—along with raising the federal minimum wage and eliminating the tipped minimum wage would be important steps forward.104 While this policy would help increase the standard of living for all Americans, it would disproportionately help women of color.
Furthermore, it is critical to pursue measures to help women of color—and all women—respond to their work and family obligations such as paid family and medical leave, flexible scheduling, paid sick days, and affordable, high-quality child care. Approximately 44 percent of Latinas, 40 percent of Asian American women, and 37 percent of Black women do not have access to any form of paid leave.105 At an average cost of $10,000 per year, many working families cannot afford to utilize the typical licensed child care center or home.106 The United States needs a comprehensive solution with adequate funding that limits what families must pay, improves quality, and increases wages for early educators.
Strengthen unions and collective bargaining rights
Unions are instrumental in improving employment conditions for all workers, and especially workers of color. Union members are able to bargain collectively for better wages, benefits, and other conditions of employment. For example, women in unions earn 9 percent more than their nonunion counterparts.107 Yet many states have passed “right-to-work” laws that undermine union protections for workers of color.108 Lawmakers should combat these anti-worker policies and expand union eligibility to those who have been shut out of collective bargaining for decades.
Enact a fair, humane, and workable immigration system
An estimated 10.5 million undocumented immigrants, many of whom are people of color, currently live in the United States.109 These men, women, and children contribute to America’s social, cultural, and economic well-being. For instance, removing undocumented workers from the workforce would reduce cumulative gross domestic product over 10 years by an estimated $4.7 trillion.110 Undocumented immigrants deserve a clear pathway to legal status. To start, Congress should move forward with permanent protections for Dreamers and people with Temporary Protected Status (TPS), whose lives have been disrupted by the Trump administration’s anti-immigrant policy agenda.111 Congress should also enhance evidence-based avenues for legal immigration. Such policies would permit families to stay together; allow workers to fill much-needed positions; and help those in need of humanitarian protection.112 Finally, at a time when enforcement overdrive is tearing apart families and communities, the United States must scale back enforcement and ensure that due process, proportionality, and accountability are present throughout the system. The outdated laws and policies that govern the United States’ immigration system are in dire need of reform to fit our country’s values and changing needs.
Advance commonsense gun violence prevention measures
Gun violence is a public health epidemic. While there is no one single answer to reducing gun violence, there are concrete steps that can be taken to improve the safety of all Americans. These steps should include banning assault weapons and high-capacity ammunition magazines; allowing the Centers for Disease Control and Prevention to research and study gun violence; requiring background checks for all gun sales; disarming domestic abusers; supporting local violence prevention and intervention programs; and ensuring every state has access to extreme risk protective orders.113
Fully enforce laws prohibiting discrimination and harassment
While legislation alone cannot prevent bias, it can help ensure bad actors are held accountable. Federal lawmakers must reverse the chronic underfunding of civil rights enforcement agencies, eliminate exemptions for small employers, and support state efforts to adopt and enforce civil rights statutes.114 Women of color across demographics consistently prioritize the need to address racial and gender discrimination. It is past time for lawmakers to heed their wishes by ensuring that those charged with addressing discrimination have the resources they need to succeed.