
A few words about this year’s market action during this respite in the selling.
Never disregard Occam’s Razor as an explanation for events you find confusing. Born in 1285, William of Ockham stated pluralitas non-est ponenda sine necessitate, which translates to “plurality should not be posited without necessity.” Or to make it even more accessible: “Of competing theories, the simpler explanation is to be preferred.”
That should be front of mind as you read the many competing explanations for why markets have been selling off this year. Complex combinations of inflation, war, rising Fed Fund rates, end of cheap capital, fall-off in liquidity, impending recession, and political unrest are proferred, along with my favorite explainer of all, “This is all passive indexing’s fault.”
Perhaps we can channel William of Ockham’s approach to find solace in a simpler explanation: Mean Reversion.
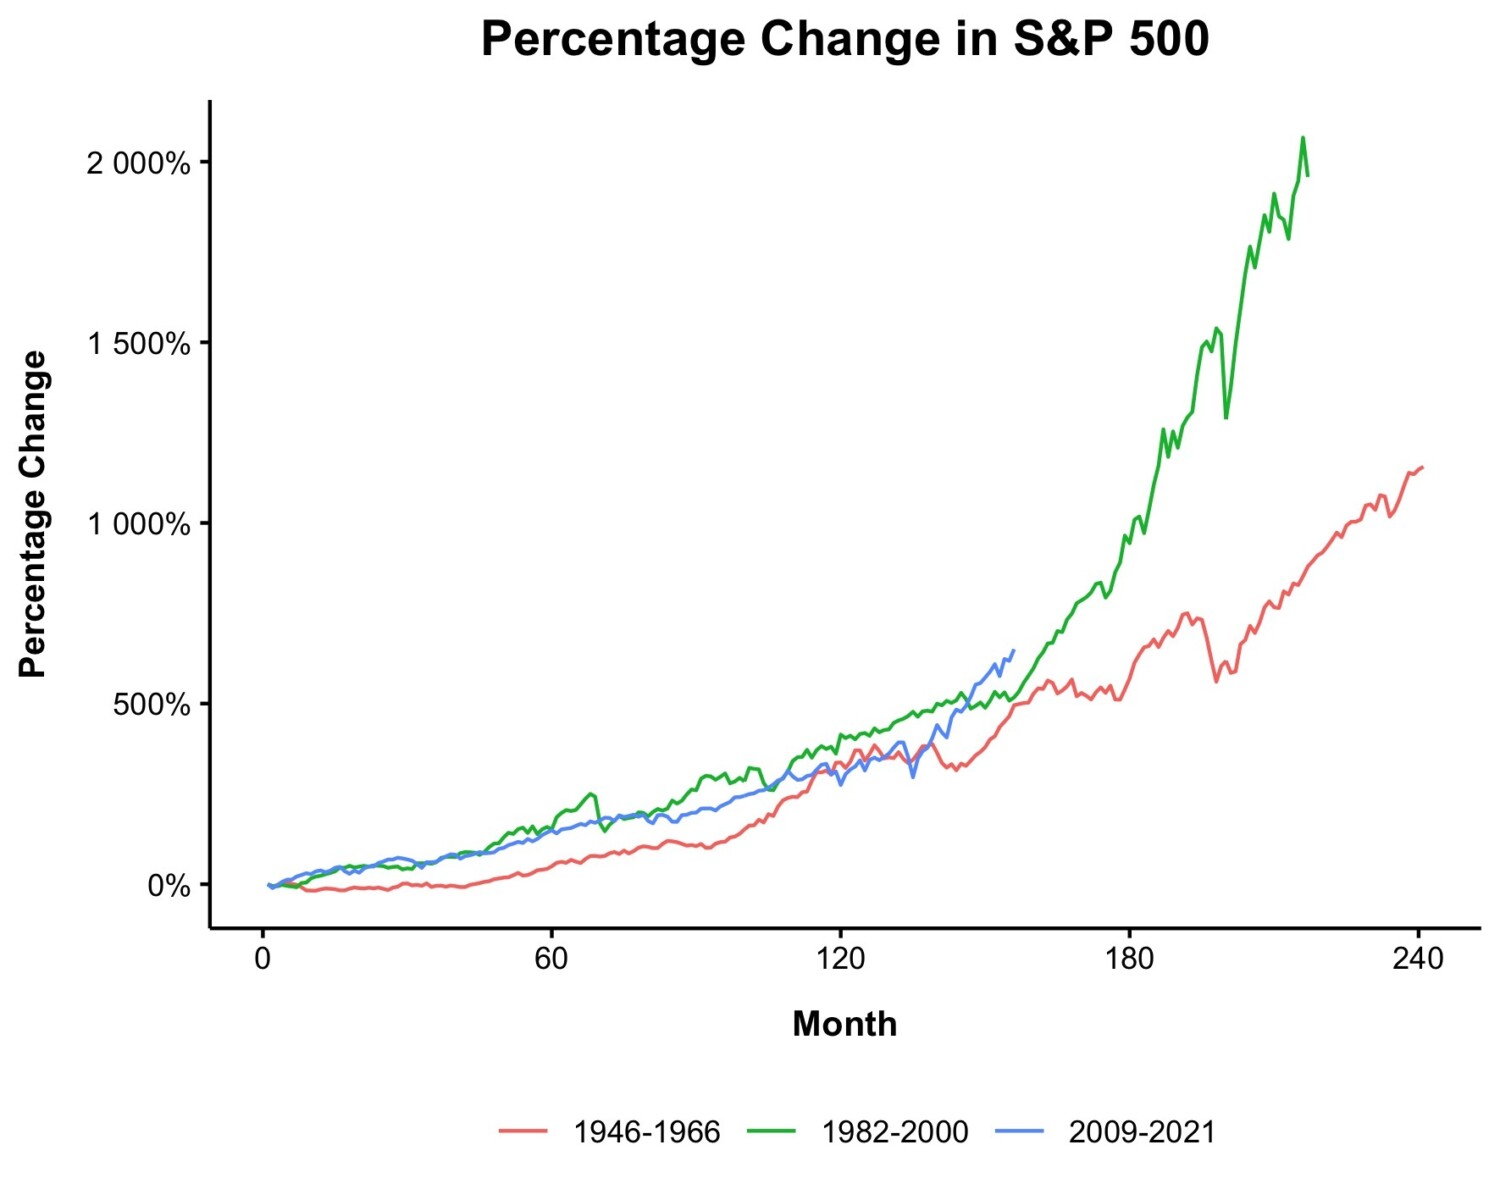
Consider a few details about returns: Over longer periods of time, equity markets generate average returns of 8-9%. Over the past decade, we have enjoyed returns of above 14% per year (18.9% if we go back to 2009 lows); within that decade, the past two years gained 20% and 28%.
What is going on in 2022? Perhaps it’s nothing more complex than mean reversion. If you prefer to contextualize this in terms of adjusting to a new rate regime or a future increase in the cost of capital, well sure, whatever narrative explanation works for you. Just be aware that any of those tales could have just as easily been told during any year over the prior decade.
S&P 500: 2012 – 2021
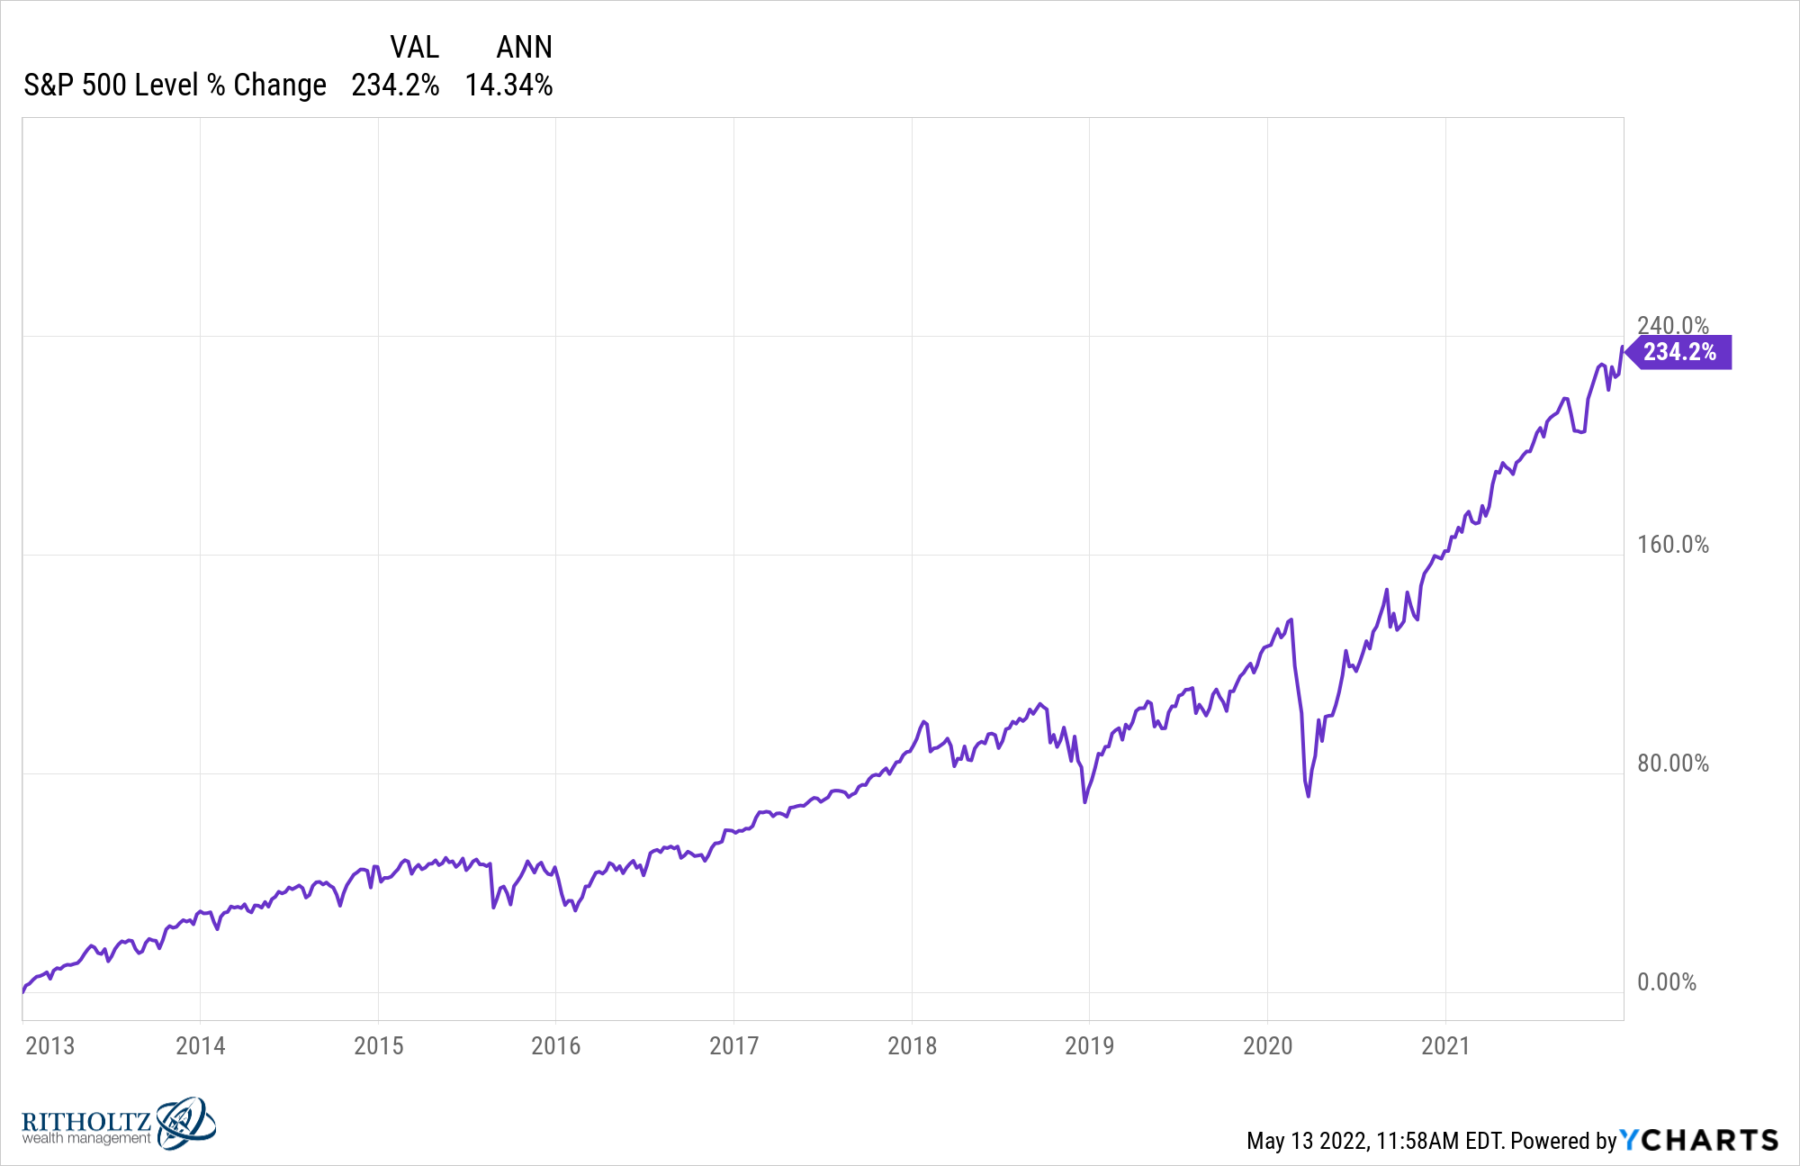
Note these nominal price gains of 234.2% or 14.3% annualized do not include dividends and are not inflation-adjusted. For those fans of market history, consider the bull that preceded the one above:
S&P 500: 1982-2000
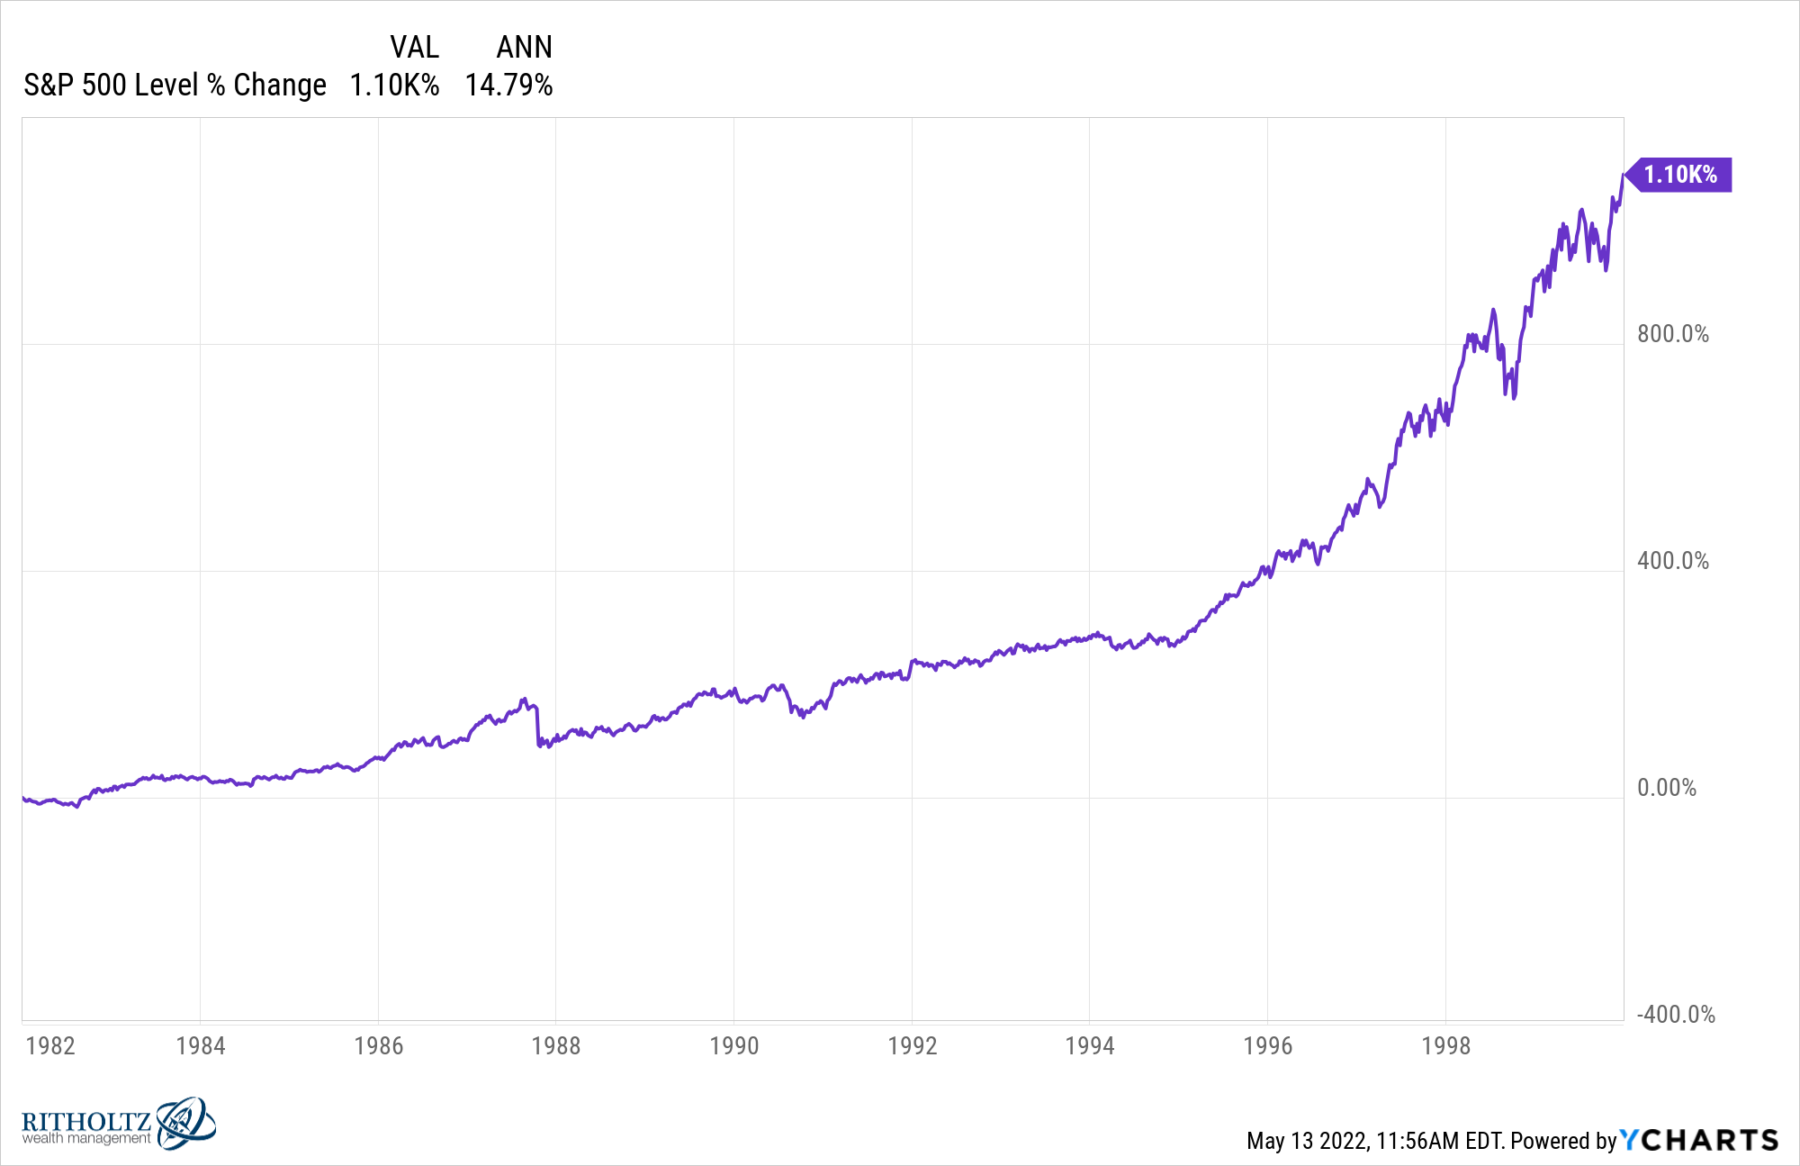
Same story with these nominal price gains of 1100% or 14.8% annualized (no dividends, not inflation-adjusted). That was a hell of a run over 18 years, with nearly half of the gains occurring during the last 4 years.
One more secular bull market to consider is that of the post-war era, from 1946 to 1966:
S&P 500: 1946-1966
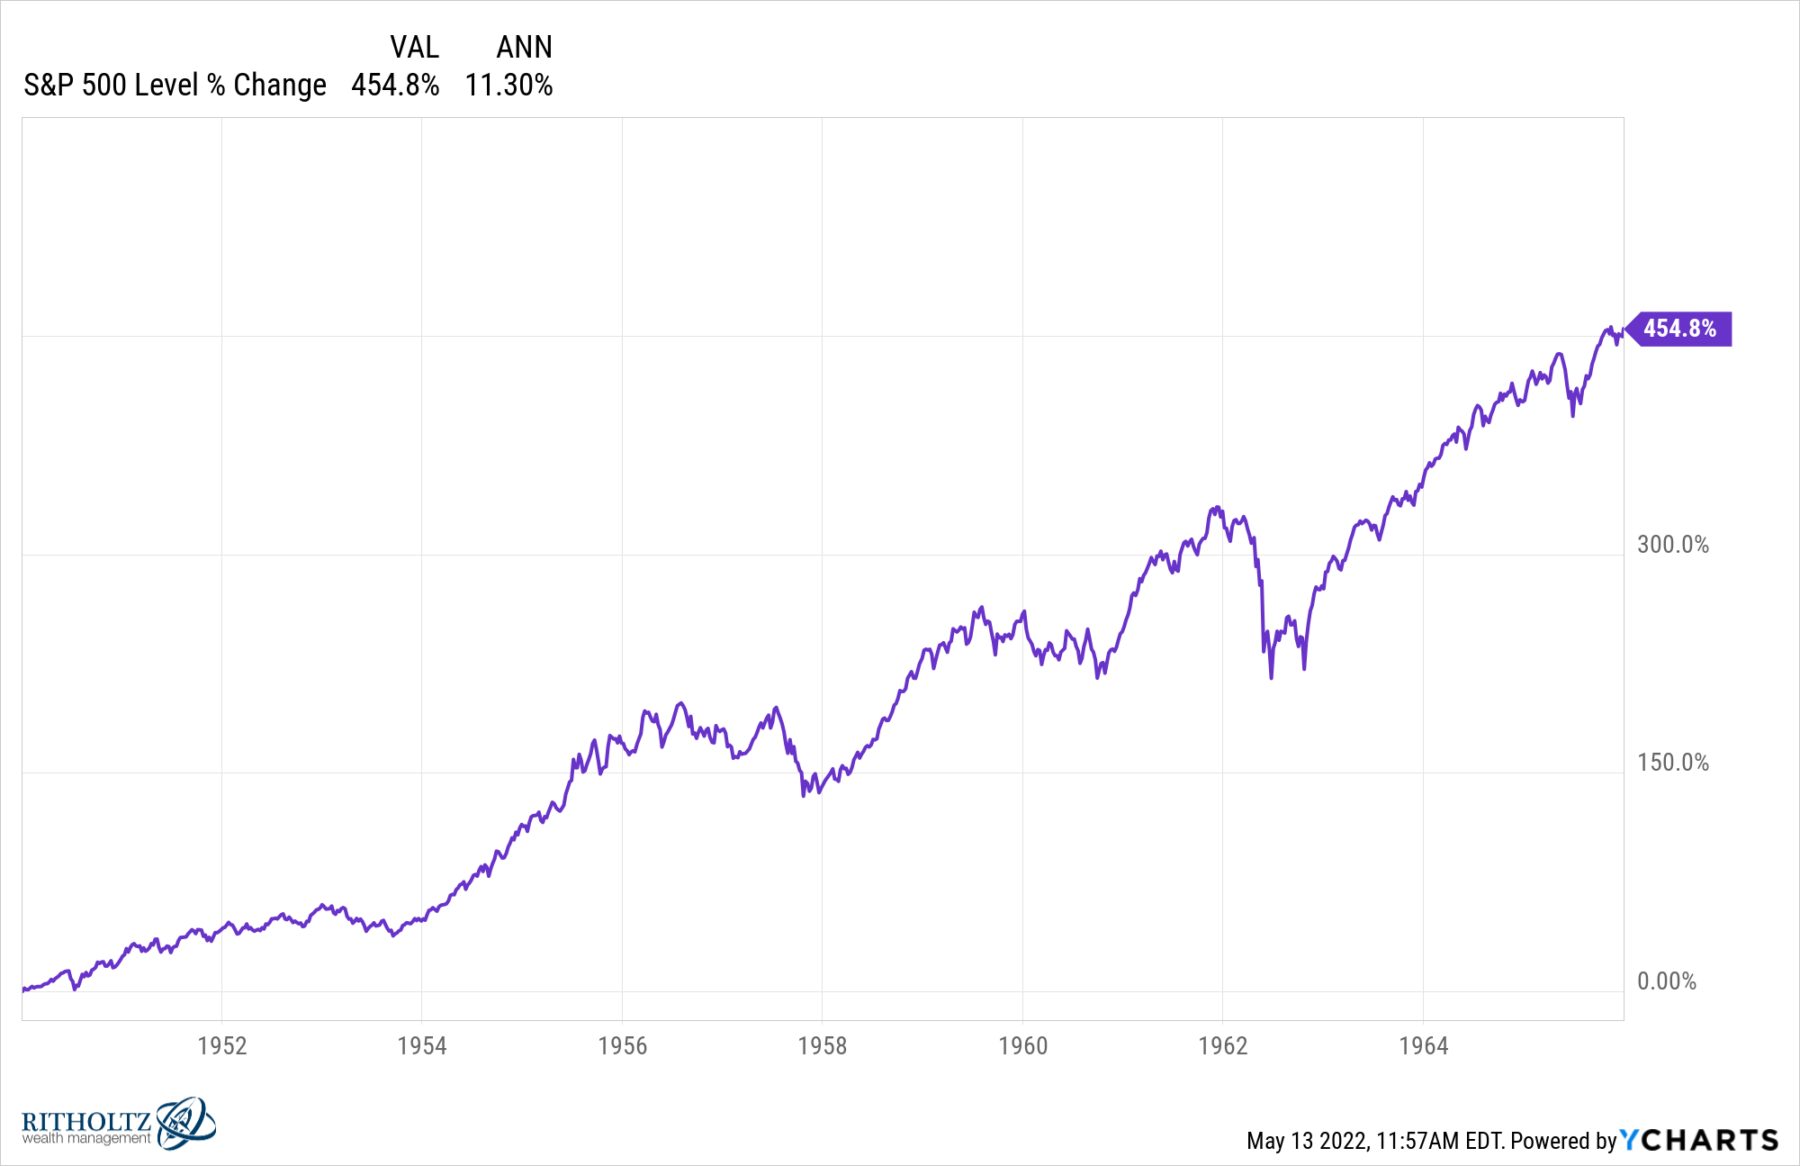
Gains of 455% produced a more modest annual return of just 11.3%.
~~~
Maybe this time is different and history is only rhyming, not repeating. The world is complex, and we should avoid oversimplifying what should not be oversimplified.
That said, three things stand out to me from these charts:
1) The torrid pace of returns over the past decade and especially the past two years versus historical averages were likely to mean revert.
2) Long-term secular bull markets can run for 15 to 20 years (I have been dating this one as of March 2013).
3) This market could/should have another good 5-7 years in it (assuming random events do not mess it up)
That is how I have been seeing this market for a while. It is one part market history, one part secular theory, two parts wishful thinking.
But it’s an honest approach, and better than most of the nonsensical narrative fallacies you have been seeing and hearing the past few months . . .
Previously:
End of the Secular Bull? Not So Fast (April 3, 2020)
Redefining Bull and Bear Markets (August 14, 2017)
Bull Market Durations (January 15th, 2013)
Looking at the Very Very Long Term (November 6, 2003)
