
The Stock Market's Wild Ride
From mid-February to mid-March, global stock markets had one of their worst monthly performances in history. Figure 1 shows that the cyclically adjusted price-earnings (CAPE) ratio dropped about 25 percent, from 30.98 in January to 23.03 on April 1, 2020. The CAPE ratio measures the price of stocks per unit of earnings and adjusted for the state of the economy.
The reason for this performance was, of course, news about the international spread of COVID-19, which was first identified in Wuhan, China, in December 2019. A few cases of this illness had been identified in Europe, North America, and other parts of Asia in mid to late January, and there were reports of the illness in other areas in February. To slow the spread of the illness, China locked down Wuhan on January 23 and on January 31, 2020, the United States banned travel by most foreign nationals who had recently been to China.
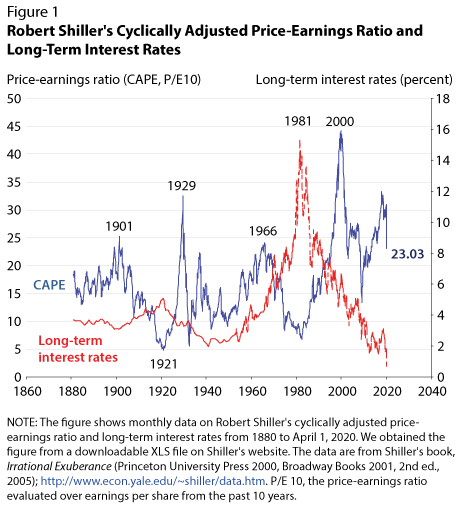
As Figure 1 shows, stock prices were quite high compared with earnings in January 2020, after a 10-year bull market. The spread of COVID-19 caused analysts to fear that disruptions in supply chains or a loss of labor force for medical reasons would disrupt economic activity and perhaps bring on a recession.
The business cycle itself is asymmetric. The economy expands in most periods, about 90 percent of the time, but occasionally suffers contractions, which infrequently are prolonged or severe. The current downturn is unprecedented in its suddenness and severity. Weekly claims for unemployment insurance surged from 282,000 on March 14 to 3.3 million on March 21 to 6.6 million on March 28.
Similarly, stock market returns are also asymmetric, with frequent small gains coupled with less-frequent declines that are sometimes large. Most really large stock market returns are negative and come about during periods of significant uncertainty about near- and medium-term profitability. Therefore, there has been a negative relation between stock returns and volatility. Volatility tends to be high when returns are negative.
When stock markets do decline, the declines can be self-reinforcing to a degree. As stock prices drop, investors either choose to sell their assets to avoid further losses in an uncertain period or—if they have borrowed money to buy stocks—must sell existing assets to meet margin calls.
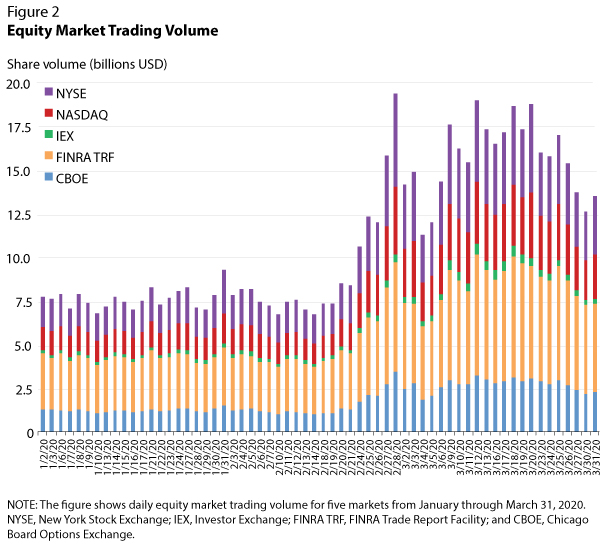
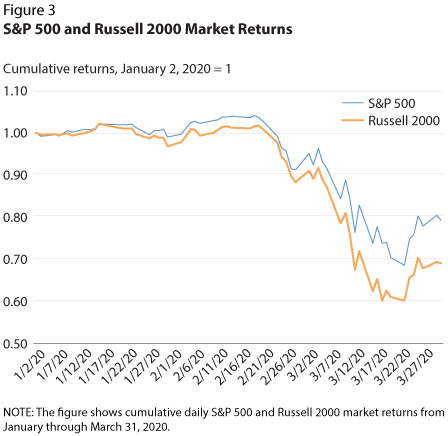
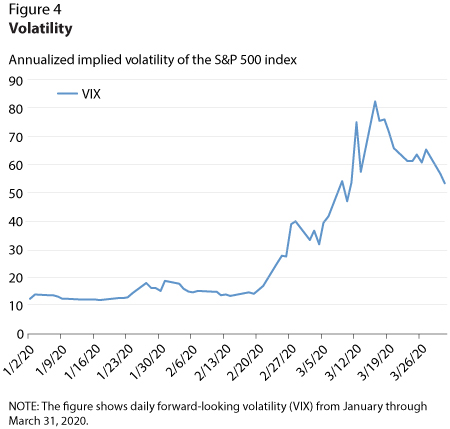

Many details of the recent decline were very similar to those of previous episodes. Figure 2 shows that trading volume in equities began to rise on February 20 and reached a high on February 28 but remained at elevated levels through the end of the sample on March 31, 2020. Figure 3 shows the parallel decline in cumulative returns of the S&P 500 and the Russell 2000 over the same period. Prices began to decline on about February 16 and continued to decline until about March 23. Consistent with the historic relationship between negative returns and high volatility, Figure 4 shows that implied volatility, as measured by the VIX (a forward-looking measure of volatility derived from options prices), started rising sharply on about February 19 and peaked on about March 16 before declining to lower—but still historically high—levels.1 Finally, Figure 5 shows that the bid-ask spreads for Microsoft stock behaved similarly to the VIX but with a delay of several days. The bid-ask spread started to rise in late February and then peaked on about March 20. A bid-ask spread is the difference between the price one would pay for a stock and the price at which one could sell it. Such spreads tend to rise during periods of high uncertainty and volatility as market makers fear losing money—that is, paying too much for a stock or asking too little—when conditions are rapidly changing.
The stock market's wild ride was doubtless one consideration that prompted the government and the Federal Reserve to take actions in March to shore up the economy and facilitate the functioning of financial markets. Congress and President Trump responded with two modest emergency spending packages on March 6 and March 18, suspension of payments on student debt, and finally a $2 trillion stimulus bill, which was passed on March 25 and signed on March 27, 2020.
While the Fed doesn't try to prevent stock prices from falling, it too took action to facilitate the smooth functioning of financial markets in general. The behavior of stock markets was one symptom of more widespread problems in financial markets that threatened the functioning of the broader economy. On March 15, 2020, the Federal Open Market Committee reduced interest rates across the board by lowering the federal funds rate to the range of 0 to 25 basis points, lowering the primary credit rate (the discount rate) to 25 basis points and initiating very substantial purchases of long-term Treasury and mortgage securities. It also took action to allow foreign central banks to obtain dollars to lend abroad using currency swap facilities. And over the next week or so, the Fed restored several credit facilities last used in the Great Financial Crisis of 2007-2009: the Term Asset-Backed Securities Loan Facility (TALF), the Primary Dealer Credit Facility (PDCF), the Commercial Paper Funding Facility (CPFF), and the Money Market Mutual Fund Liquidity Facility (MMLF2). The Fed also created new facilities for purchasing corporate bonds, one of which we will discuss in our next post.
These measures have very likely contributed to arresting the slide of the stock market.
Notes
1The VIX is the Chicago Board Options Exchange's volatility index.
2The MMLF is technically new but is similar to the Asset-Backed Commercial Paper Money Market Fund Liquidity Facility (AMLF), which was established in 2008.
© 2020, Federal Reserve Bank of St. Louis. The views expressed are those of the author(s) and do not necessarily reflect official positions of the Federal Reserve Bank of St. Louis or the Federal Reserve System.