There has been a lot of talk recently about yield curve inversions and whether that means a recession is on the way, and how soon? And if there is a recession, will there also be a bear market? I decided to forget about economic forecast and just look at how the SPX did after a curve inversion. I looked at both the 2yr/10yr and the 3mo/10yr combinations. For the study I used Norgate Data, and looked back as far as my database went, which was 1976 for the 2yr rate and 1981 for the 3mo. Results can be found below.
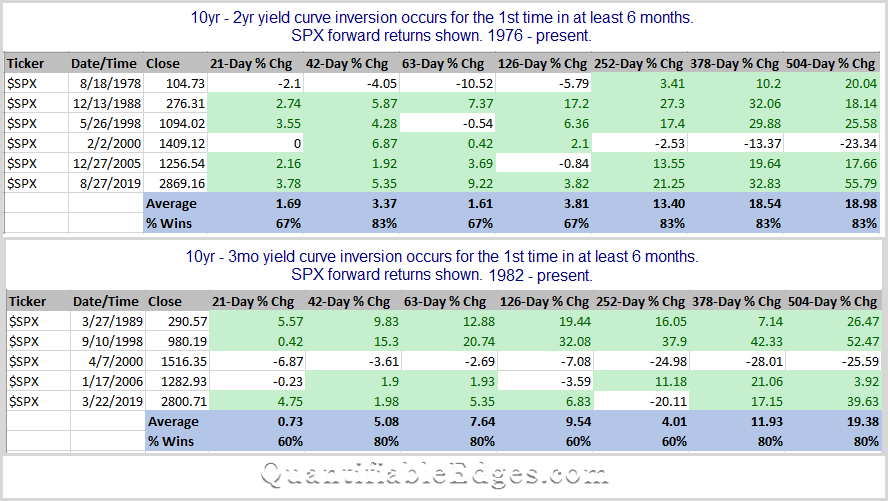
Note that 21 trading days is approximately 1 month. So 42 days is two months, 126 days is 6 months, 252 days is a year…you get it.
Not many instances to build out a case here. Some good and some bad numbers. More bullish than bearish. Overall, the initial inversion does not seem to be a great timing signal. Academics can argue and tv talking heads can blather about potential consequences, but traders should probably look to better timing devices to make their market judgements. I don’t see myself factoring this into any trading decisions.
Want research like this delivered directly to your inbox on a timely basis? Sign up for the Quantifiable Edges Email List.
How about a free trial to the Quantifiable Edges Gold subscription?