MLTC Data Transparency Project
This webpage, for the first time, makes public important data showing how New York State's Medicaid Managed Long-Term Care plans spend billions of Medicaid dollars to provide necessary Medicaid long-term care services that enable New Yorkers with disabilities of all ages to live safely in the community.
Nearly 300,000 New Yorkers depend on Medicaid home care services from Medicaid Managed Long-Term Care (MLTC) plans. While New York State makes some MLTC data public, there is a huge gap that this webpage aims to fill by posting selected data from Managed Medicaid Cost and Operating Reports (MMCOR) Reports, obtained from 2017 and 2018 reports. Selected data is posted in four interactive visualizations and can be downloaded for further analysis. A fifth visualization, which is based on NYS Open Health Data, not MMCOR data, shows changes over time in the number and demographics of people enrolled in the many MLTC plans. For each visualization, you can select data for 2017 or 2018 and choose to view statewide data or by region. Many other viewing choices are explained for each visualization.
NYLAG calls on New York State to:
- Publish MMCOR data annually on its Open Data website, in an interactive format, and include it in its published reports and consumer guides;
- Improve data reporting by MLTC plans and monitoring by the State to better track whether plans are meeting members’ needs for services that enable them to live safely in their communities, including reporting on appeals and grievances, timeliness of care, and staffing capacity.
- Adopt Quality Metrics and Quality Incentive Awards that reward plans that excel in “Rebalancing” indicators, shifting long-term care from nursing homes to the community, and penalize plans that fail to meet these standards.
Read our complete report for more about these and other recommendations.
Additional Resources and References:
- A Sample 2018 MMCOR Report for One MLTC Plan
Each plan must file a statewide report like this, plus a separate report for each of four regions in the state in which the plan serves enrollees. - 2021 MMCOR Instructions (name of report has now changed from MMCOR to Managed Long Term Care Cost Report, MLTCCR)
- Sample Downloaded Data: Combined Home Care Hours 2018
- List of Counties in Each of the Four Regions
- List of all MLTC plans, showing the plan name or abbreviation used in the visualizations, its service area, and changes in ownership
- Glossary and Acronyms
Interactive Visualizations
Glossary and Acronyms
NOTE: This glossary does not contain every term used in the visualizations. See the MMCOR Report instructions for definitions of some of the terms, such as types of revenue and expenditures.
Administrative expenses: Plans report “allowable administrative expenses” in MMCOR Schedule D-3, D-3A and D-3B – not visualized in this project: rent, salaries and fringe (administrative), legal fees, utilization mgt. and quality improvement, travel, advertising, marketing, finance, auditing and actuarial, claims processing, provider relations, recruitment and contracting, member services, MIS systems, telephone, postage, printing and stationery, equipment rental, boards and association fees, insurance except for real estate, payroll taxes, collection and bank service charges, other taxes (excluding federal income tax and real estate), Intake and Enrollment, Employee recruitment, retention and contracting, franchise taxes.
“Nonallowable” administrative costs include contributions and donations, lobbying expenses, entertainment costs, interest, fines and penalties, uncollected spenddown and NAMI, state income taxes.
Capitation: The government pays Managed Long Term Care (MLTC) plans a “capitation payment”—also known as a “premium”—to provide all services in the plan’s service package. This payment is the same amount “Per Member Per Month” (PMPM), calculated by State-contracted actuaries using a complex formula. The capitation model is in contrast to the “Fee For Service” model, where each provider bills Medicaid directly for each service. In capitated plans, the plan contracts with and pays providers in its “provider network.” There are two types of MLTC plans with different capitation payments:
- “Full capitation”: The plan receives two separate capitation payments – one for all Medicare services and one for all Medicaid services. These plans provide all Medicare and Medicaid services, including all Community-Based Long-Term Care services (see definition), nursing home care, hospitalization, outpatient care, physician, supplies, labs, etc. In NYS, these are Medicaid Advantage Plus (MAP) and PACE See more about types of MLTC plans here.
- “Partial capitation”: The plan receives one capitation payment to provide a package of Medicaid services, which include all Medicaid Community-Based Long-Term Care services (see definition), short-term nursing home care, and a few other Medicaid services (dental, vision, podiatry, audiology, hearing aids, eyeglasses, durable medical equipment, physical/occupational/speech therapy, medical supplies, non-emergency medical transportation). MLTC members receive other Medicaid services on a Fee-For-Service basis outside the plan, such as payment of the Medicare hospital deductible or Part B coinsurance for outpatient care. Members receive their Medicare services separately, with their choice of Original Medicare or Medicare Advantage. In NYS, most MLTC plans are of this type and are sometimes referred to as “regular” MLTC plans. See more about types of MLTC plans here.
- NOTE ON TERMS USED IN MEDICAID PLAN ENROLLMENT TABLE VISUALIZATION: To view data for Partial Capitation MLTC plans, select “Partial MLTC,” not “PARTIAL CAP PLAN” or “FFS Partial Cap.” “PACE” and “MAP” are labeled with those acronyms.
- View the MLTC PMPM rates in the Finance table. In the Select Metric selector, select “Medicaid Premium PMPM” for the base MLTC monthly premium and “Total Premium PMPM” that adds add-on’s for Spenddown and NAMI, Recruitment and Retention of home care workers, Quality Incentive Pool Award, Quality Incentive VAPP and Minimum Wage. See MMCOR Instructions for definitions
Community-Based Long-Term Care [CB-LTC] services refers to the package of Medicaid services provided outside of nursing homes for people who need assistance with activities of daily living. This is the core service package for MLTC plans, and includes personal care, Consumer Directed Personal Assistance Program (CDPAP), Private Duty Nursing, and Adult Day Health Care – both medical model and social model. The Medicaid Assisted Living Program (ALP) is not part of the MLTC benefits package as of 2022, and is available on a Fee-for-Service basis with prior approval of the local Medicaid agency.
Consumer Directed Personal Assistant Program (CDPAP): An alternative Medicaid home care model in which the consumer hires, schedules, trains, supervises and can terminate a “personal assistant,” whose hours are authorized by an MLTC or managed care plan or a local Medicaid agency. The personal assistant may be the consumer’s family member (other than a spouse or a parent if the consumer is a minor) and is paid by a Fiscal Intermediary that contracts with the plan or local Medicaid program. In contrast, in the traditional Personal Care Service model, the personal care aide is employed by a licensed home care services agency (LHCSA), under contract to a plan or local Medicaid agency. See more here and here.
Combined Home Care Hours: Where a visualization gives the option to view data by this category, the data includes Personal Care services, CDPAP, and, in some cases, home health care.
Community Health Assessment (CHA): The nurse’s assessment using the Uniform Assessment System NY (UAS-NY) assessment tool, which is used by the plan to develop a plan of care. Under the new “NY Independent Assessor” [“NYIA’] system, since May 16, 2022, the initial CHA for a new enrollee is conducted not by a plan nurse but by a nurse employed by Maximus in its NYIA program. At an unspecified date in the future, CHAs conducted for annual reassessments will also be conducted by NYIA nurses, but in the meantime are conducted by plan nurses. See more about NYIA at https://nyia.com/en and http://www.wnylc.com/health/news/85/ and https://www.health.ny.gov/health_care/medicaid/redesign/nyia /.
Dual Eligibles: People who have both Medicaid and Medicare, which means, by definition, they are either age 65+ or have been determined to be disabled or blind, and are low-income.
Encounter Data: Under 42 C.F.R. 438.2, data transmitted by plans that records the receipt of any item(s) or service(s) by an enrollee under a contract between a State and an MCO that is subject to the requirements of 42 C.F.R. §§ 438.242 (requiring that the data be a complete and accurate representation of the services provided to the enrollees under the contract” and 438.818. This state-validated data is used in federal and state monitoring and in rate setting.
Home Health Care: Refers to a group of services provided by Certified Home Health Agencies (CHHA). Unlike other MLTC CB-LTC services, these services may also be reimbursed by Medicare, though in lower amounts and with different eligibility standards. The MMCOR instructions tell plans to use to report as Home Health Care services “therapeutic and preventive nursing services, private duty nursing, home health aide services and rehabilitation therapies. Includes pharmaceutical costs for IV therapies.” Home Health Aides, like Personal Care Aides, are employed by Licensed Home Care Services Agencies (LHCSA), but their certification and training is at a slightly higher level, including certain health-related tasks. See NYS DOH Home Health Aide Scope of Tasks, http://www.leadingageny.org/linkservid/086226dd-f154-009a-541f4722d38b4641/showmeta/0/ (2009).
NOTE on Home Health Care in MMCOR Reports and Visualizations –The MMCOR instructions tell plans to include home health aide services under the Personal Care category “if the aide is performing only personal care services with no health-related tasks (vital signs, transferring with hoyer lift, stable dressings, ostomy care, prepare meals for complex diets, maintenance exercise programs).” MMCOR Instructions. Also, the Instructions state, “Home Health Care is reported with both an hourly and a per visit unit cost for the service.” See Recommendations in the Report to report private duty nursing separately, not bundled with other services categorized as home health care.
Incurred but Not Reported (IBNR): Payable medical claims that have been incurred because a covered health service has been provided, but the billing process is not yet complete.
Licensed Home Care Services Agencies (LHCSAs): A private home care services agency licensed pursuant to Public Health Law Section 3605 to provide home health aide or personal care services. LHCSAs are generally not Medicaid providers, but serve as subcontractors with a Certified Home Health Agency (CHHA) or an MLTC plan. They may be for-profit or non-profit.
Mainstream Medicaid Managed Care: Insurance plans that are paid a monthly premium (“capitation” or “per member per month” rate) by the New York Medicaid program to approve and provide all Medicaid services, including acute, primary and long-term care, including personal care, CDPAP, private duty nursing services, and nursing home care. Most members are children, families and adults under age 65 because these plans exclude those who have Medicare, other Third-Party Health Insurance, or an income “spend-down,” with some exceptions.
Managed Long Term Care (MLTC): Insurance plans that are paid a monthly premium (“capitation” or “per member per month” rate to provide Medicaid Community-Based Long-Term Care and some other Medicaid services. Most adult Dual Eligibles are required to enroll in an MLTC plan to receive community-based long-term care services. They may choose a fully capitated or partially capitated plan. See Capitation above. For more information see this article and fact sheets here.
Medicaid: The Medical Assistance (Medicaid) program is a public health insurance program operated by New York State in cooperation with the Federal government, with costs shared by the federal and state government, and in some cases, with a local contribution. Eligibility is based in part on financial need, residency and immigration status, with different eligibility rules for people who are age 65 and older or who have been determined to be disabled, compared to younger people who are not disabled.
Medicaid Advantage Plus (MAP): A type of MLTC plan that is “fully capitated” – see Capitation.
Medicaid Managed Care Operational Reports (MMCOR): Reports that all MLTC and other Medicaid managed care plans are required to file with the New York State Department of Health, reporting all expenses, income, and services. Each plan files a statewide report and a separate report for each geographic region in which it operates. The last quarterly report of each year includes data for the entire year, and is the basis of the data visualizations in this application. See 10 NYCRR § 98-1.16(f – g). A sample year-end report for 2018 is posted on this project’s webpage.
Medical Loss Ratio (MLR): The percentage of premium revenue spent on services as opposed to administrative costs. 42 CFR § 438.8. DOH now posts MLR Reports for are available at https://health.ny.gov/health_care/managed_care/reports/–scroll down to Medical Loss Ratio Reports.
Member Months (MM): Plans report much of the MMCOR data by “Member Month,” which “is equivalent to one person for whom the plan has recognized capitation-based premium revenue for one month.” MMCOR Instructions. This figure adjusts for turnover so that plans whose enrollees stay enrolled or receive certain services for shorter or longer periods can be appropriately compared. For example, MMCOR Exhibit A-5 reports the number of “member months” in which the plan provided personal care services in each of seven different groupings of hours/month, ranging from < 80 hours/month to 700+ hours/month. If the plan gave 700+ hours/mo. of personal care to 100 members for 2 months in the year, it would be misleading to say that 100 members received 700+ hours of personal care. Instead, the plan would report it provided 700+ hours for 200 member months. Exhibit A-5 and Exhibit A-7 for CDPAP, is used for the “Home Care Member Years by Hourly Category” visualization.
Member Years (MY): Member Years = Member Months divided by 12. We have divided the number of member months by 12 to approximate the number of members who are enrolled in a plan or who are receiving a particular service. If the plan reports providing 700+ hours of personal care in 200 member months, for example, this would be shown as 16.7 member years (200/12 months). By using this formula uniformly in every instance where the plan reports “member months,” it gives a fair representation of the number of members authorized for a particular service. It standardizes plan enrollment figures to account for different enrollee turnover rates and mid-year changes in service amounts, and is intended to be less technical and more readily understood than Member Months.
Nursing Facility (NF) or Skilled Nursing Home (SNF): Nursing Homes
Nursing Facility Level of Care (NFLOC) score, which is a composite functional scale from 0 – 48, with 48 showing the highest level of need. The figure is calculated using a score that is based on certain findings in the nurse’s Community Health Assessment.
Program of All-Inclusive Care for the Elderly (PACE): A type of “fully capitated” MLTC plan like Medicaid Advantage Plus plans. See Capitation definition. See more about types of MLTC plans here and about PACE plans here.
Personal Care Services (PCS): The primary type of Medicaid home care service provided in New York State. Certified PCS aides are employed by Licensed Home Care Services Agencies (LHCSAs), which in turn contract with MLTC plans or local Medicaid agencies. Most adults who have Medicare must obtain PCS from MLTC plans. Those without Medicare who are in Mainstream Medicaid Managed Care plans obtain the service from those plans. Some Medicaid recipients who are excluded or exempt from enrolling in MLTC obtain PCS from local Medicaid agencies. For information on the applicable law, regulations, and policies for authorizing these services in NYS see this article.
- NOTE on PCS in Visualizations –The MMCOR instructions tell plans to include home health aide services in reporting PCS services “if the aide is performing only personal care services with no health-related tasks (vital signs, transferring with hoyer lift, stable dressings, ostomy care, prepare meals for complex diets, maintenance exercise programs).” This definition is partly incorrect in that PCS aides may also assist with transferring with a hoyer lift. See NYS DOH, Personal Care Scope of Tasks (1994), available at http://www.wnylc.com/health/download/46/.
Premium: See Capitation definition.
Rebalancing: Federal goal of achieving a more equitable balance between the share of Medicaid spending and use of long term services and supports (LTSS) delivered in home and community-based settings relative to institutional care. CMS issues annual reports on progress on rebalancing LTSS, with the most recent report issued in 2021 with 2019 data, available at https://www.medicaid.gov/medicaid/long-term-services- supports/downloads/ltssexpenditures2019.pdf, posted on https://www.medicaid.gov/medicaid/long-term-services-supports/reports-evaluations/index.html. For FY 2019, NYS ranked 13th in the percentage of all LTSS expenditures spent on HCBS (63%)(2021 Report at pp. 16.
Region: MLTC plans must file a separate MMCOR report for each of four regions in the state in which the plan operates. See list of counties in each region in App. A. In each visualization, the user may choose to view “STATEWIDE” data or data solely for one of four geographic regions. If a plan operates in more than one region, only the data for the selected region will appear if one region is selected.
Spenddown/ NAMI: The total amount of monthly income that the local Medicaid agency determines the enrollee must pay toward the cost of their care. The “NAMI” is the term used in nursing home budgeting. Note that this is not the amount the plan actually collects–the amount should not be reduced by what is not collections. Plans should report uncollected amounts as bad debt on Schedule D-3, which is not visualized in this project.
Interactive Visualizations
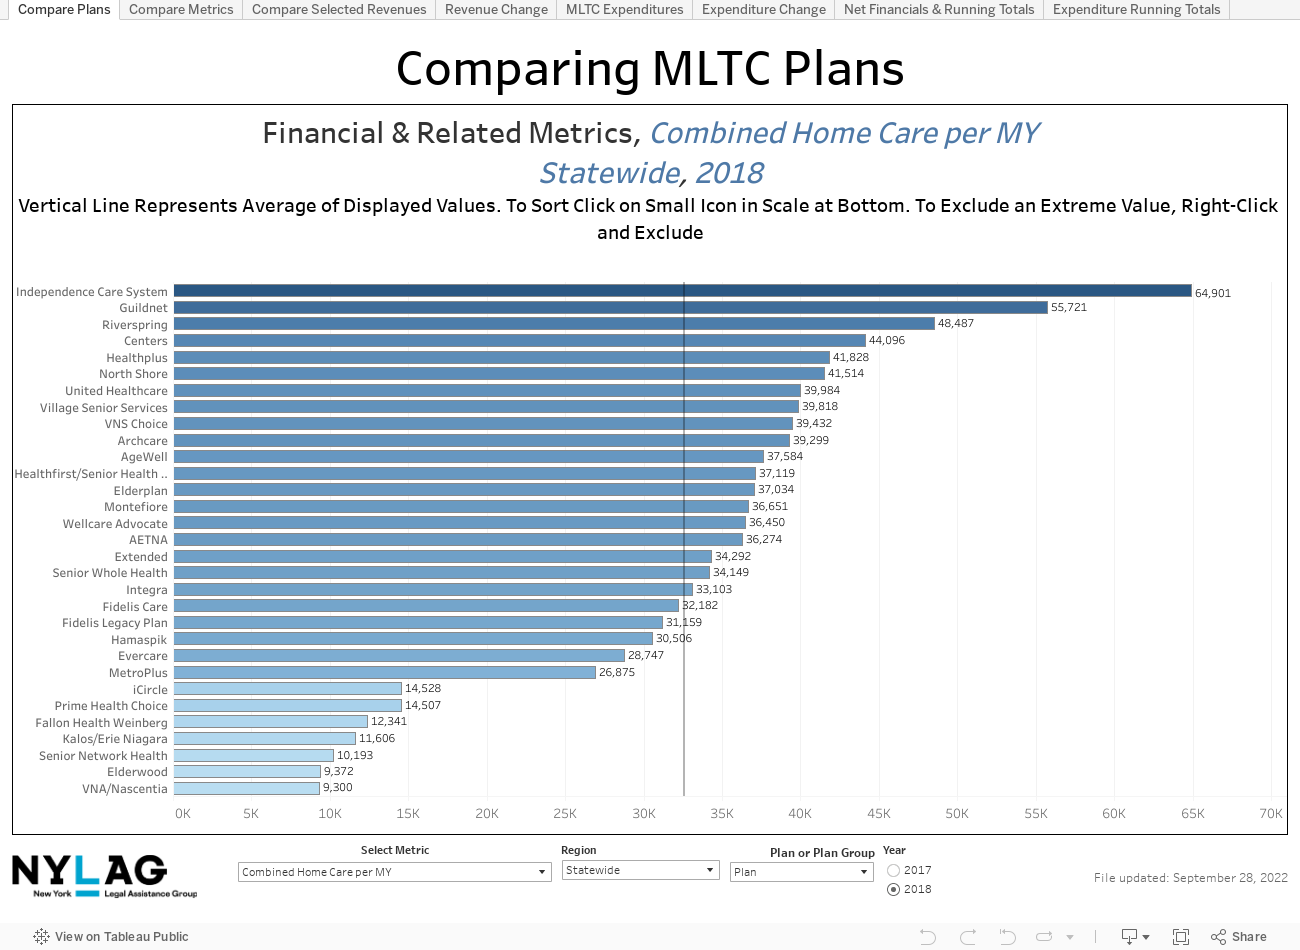
MMCOR Consolidated Finance Table
https://public.tableau.com/views/MMCORSelectedFinancials/ComparePlans?:language=en-US&:display_count=n&:origin=viz_share_link
Data source: MMCOR Schedule B – Revenue and Expense statement
There are four different tabs. For each, you may select a region of the state or statewide data and a year (2017 or 2018).
At each tab, you can:
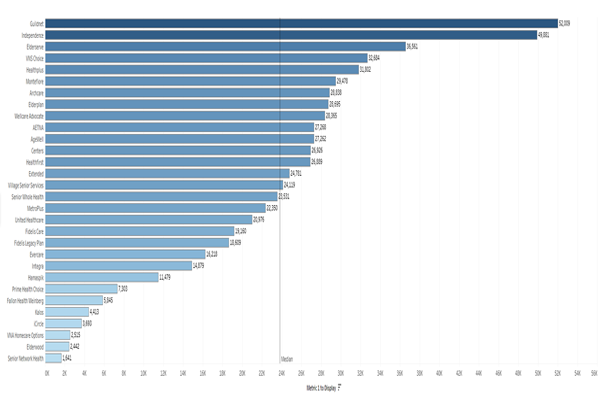
- Compare Plans: You may choose to visualize the amount each plan spent on each of 17 different services and various administrative expenses, and also the amount of different types of revenue. The expenses and revenue are shown in an amount spent or received by each plan per Member Year (MY), which is a proxy for amount spent per member. See glossary below for guidance on terminology.
- Compare Two Financial Metrics: You may select two of over 20 different metrics and display one on the horizontal axis and one on the vertical axis. The metrics include amount spent on various services. The relationship between the two metrics can then be visualized.
- For example, using “Combined Home Care per MY” on the horizontal axis, and “NF Expenditure per MY” on the vertical axis shows a correlation between these expenses, with a higher amount spent on home care correlated with a lower amount spent on nursing facility care. The size of the dots is based on the number of members enrolled in the plan.
- Comparing Years in Financial Indicators: You may visualize increases or decreases for each expense per Member Year or revenue source from 2017 to 2018, by plan. You may select regional or statewide data.
- Selected Financials: You may view and download key expense and revenue lines for each plan, by region, or statewide, for 2017 and 2018.
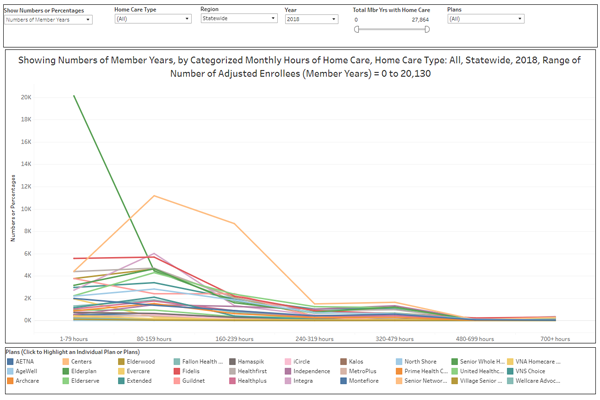
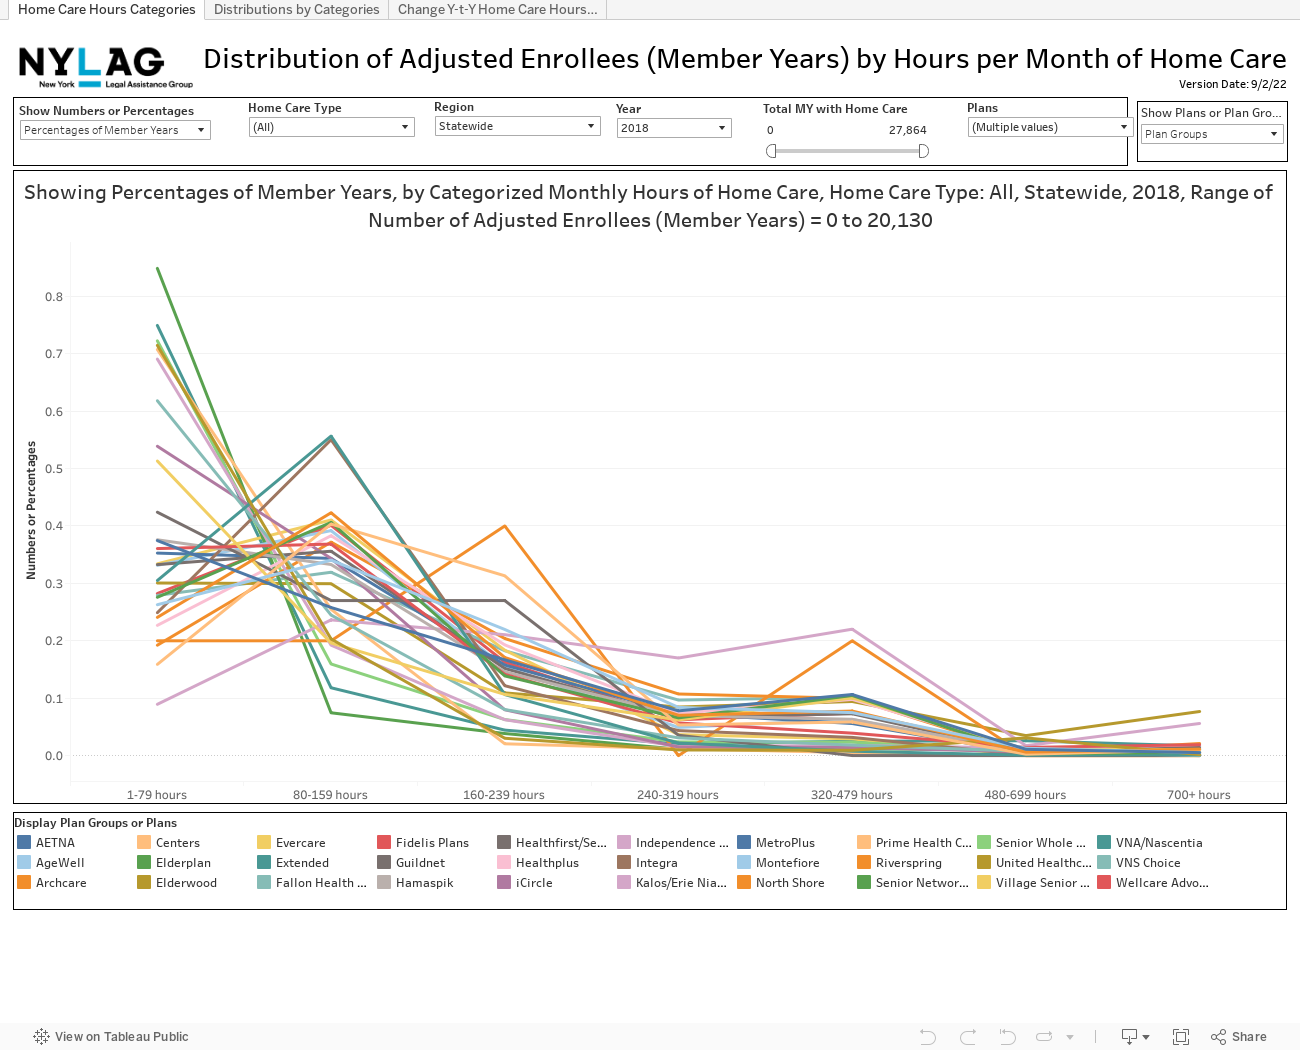
Home Care Member Years by Hourly Category
Data source: MMCOR Exhibits A5 (Personal Care Hours year to date), A6 (Home Health Care and PCA Hours Year to Date) and A7(CDPAP Hours Year to Date). (link to sample?)
- The plans report the number of member months in which they provided three different types of home care in seven different ranges of hours, from one to 79 hours per month to over 700 hours per month. The hours are not grouped in a way that may seem logical, as they describe the hours per month, and most care plans are described in hours per week. Using 4.3 weeks in an average month, here are examples of care plans for each grouping:
Hour grouping | Max. hours/week | Typical Care Plans |
1-79 | 18 | 4 hrs x 4 days |
80-159 | 37 | 7 hrs x 5 days; 5 hrs x 7 days |
160-239 | 55 | 8 hrs x 5 days + 7 x 2 days; or 7 x 7 |
240-319 | 74 | 8-10 hrs x 7 days; or 12 hrs x 5 + 7 x 2 |
320-479 | 111 | 24-hour live-in x 7 = 91 hours/week; 12 x 7 days |
480-699 | 162 | 16 x 7; 2×12 x 5 days = 12 x 2 |
700+ | 168 | 2 12-hour/shifts x 7 days |
The data can be visualized in two ways:
- Home Care Hours Categories graph results in a bell curve for each plan.
- Distributions results in a bar graph for each plan, with color coded sections for each range of hours from highest to lowest.
For both visualizations, you may select:
- Home Care Type (either Personal Care or CDPAP (“CD”), or “all” to combine both)
- Region
- Year (2017 or 2018)
Use the slider labeled Total Member Year (MY) with Home Care (see glossary for definition of MY) to view only plans with larger or smaller enrollments in order to compare comparable size plans. You may select individual plans for comparison.
- On the Show Number or Percentage tab, you may opt to show numbers of Member Years receiving each level of hours or the percentage of the plan’s member years receiving each level of hours. The percentage option shows the percentage of each plan’s members authorized for the seven groupings of hours from high to low. Clicking on any of the plan’s graph lines highlights that plan’s distributions or bell curve.
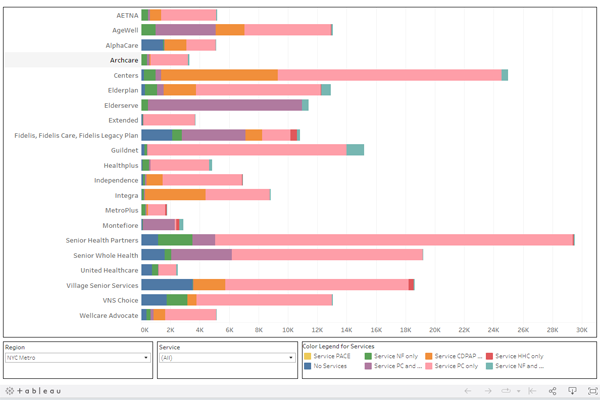
MMCOR Long Term Care Service Mix
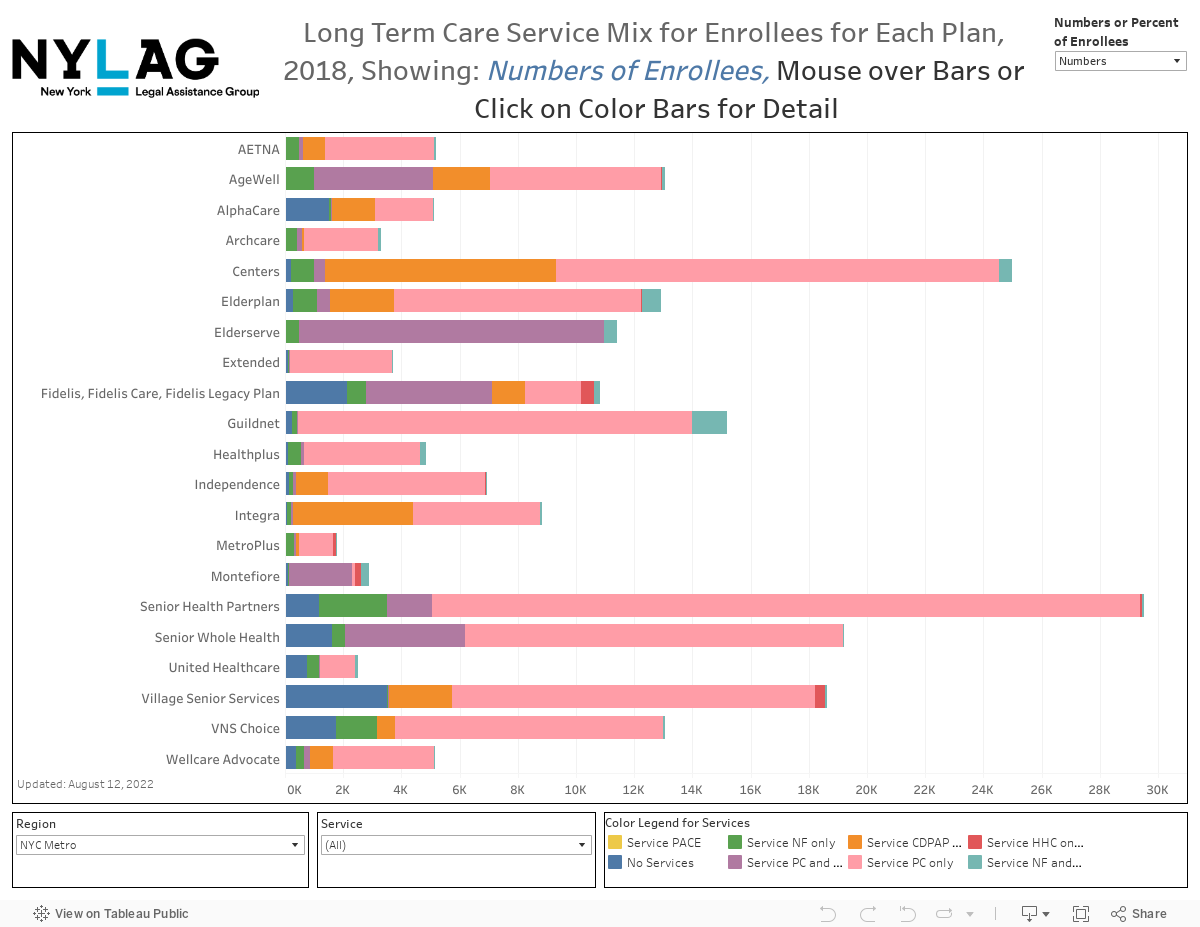
DATA Source: MMCOR Exh. C – Number of Enrollees Receiving Services
- You may view the number or percentage of enrollees who used different long-term care services during 2018, such as the number who were in a Nursing Facility (NF) for the entire year, or who used only one of the home care services–PCS, CDPAP, or Home Health Care–or a specified combination of two of these services.
- Note that “Home Health Care” is broadly defined to include not only home health aide and private duty nursing services, which are comparable to PCS and CDPAP, but also nursing and therapies, which are not. Also reported is the number that received NF services along with one or more of the home care services during the year.
- “No Services” on this graph is a figure that was calculated by this Project, subtracting the total number of enrollees the plan reported as receiving any of the listed long-term care services from the total number of enrollees the plan reported in the same exhibit.
- On the top right, you may select the percent or number of enrollees receiving different services, combinations of services, or no services.
- At the bottom, you may select region and in the Service dropdown, may select certain services or all services.
- In the Color Legend at the bottom, you may highlight certain services.
- If you select only one service, and view number instead of percent of enrollees, then you can re-order the bars for each plan from highest to lowest or vice versa.
- To do this, hover over the horizontal axis at the bottom, and icons will appear like . Click to re-order.
- Remember that larger plans will show larger numbers of enrollees, so one should also look at percent to see the percentage of a plan’s enrollees receiving a particular service. For example, highlighting the green (Nursing Facility only) for number of enrollees statewide shows that VNS Choice had the third highest number of enrollees solely receiving nursing facility care in 2018.
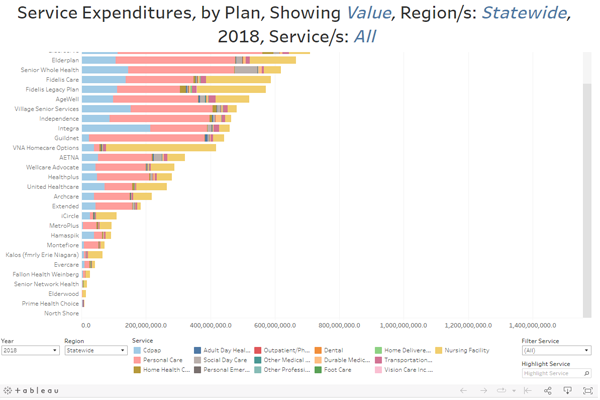
MMCOR Service Expenditures

Data source: MMCOR Schedule B and other? (link to sample)
- This data uses the same financial data as in the MMCOR Consolidated Finance Table, except it shows solely expenditures on services, not administrative expenses and revenue.
- At the top, you can select to show value or percent. To the right of that selector is a button to show aggregated data by region, or plan-specific data by plan.
- If choosing plan, the user may use the filter at the bottom to select a region or statewide data.
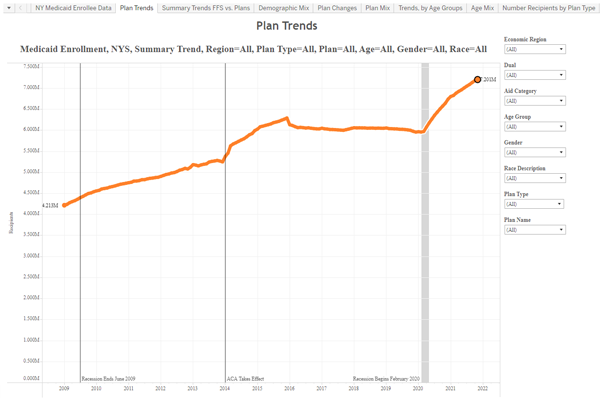
Medicaid Plan Enrollment
Data source: NYS DOH Open Health Data – Medicaid Program Enrollment by Month Beginning 2009
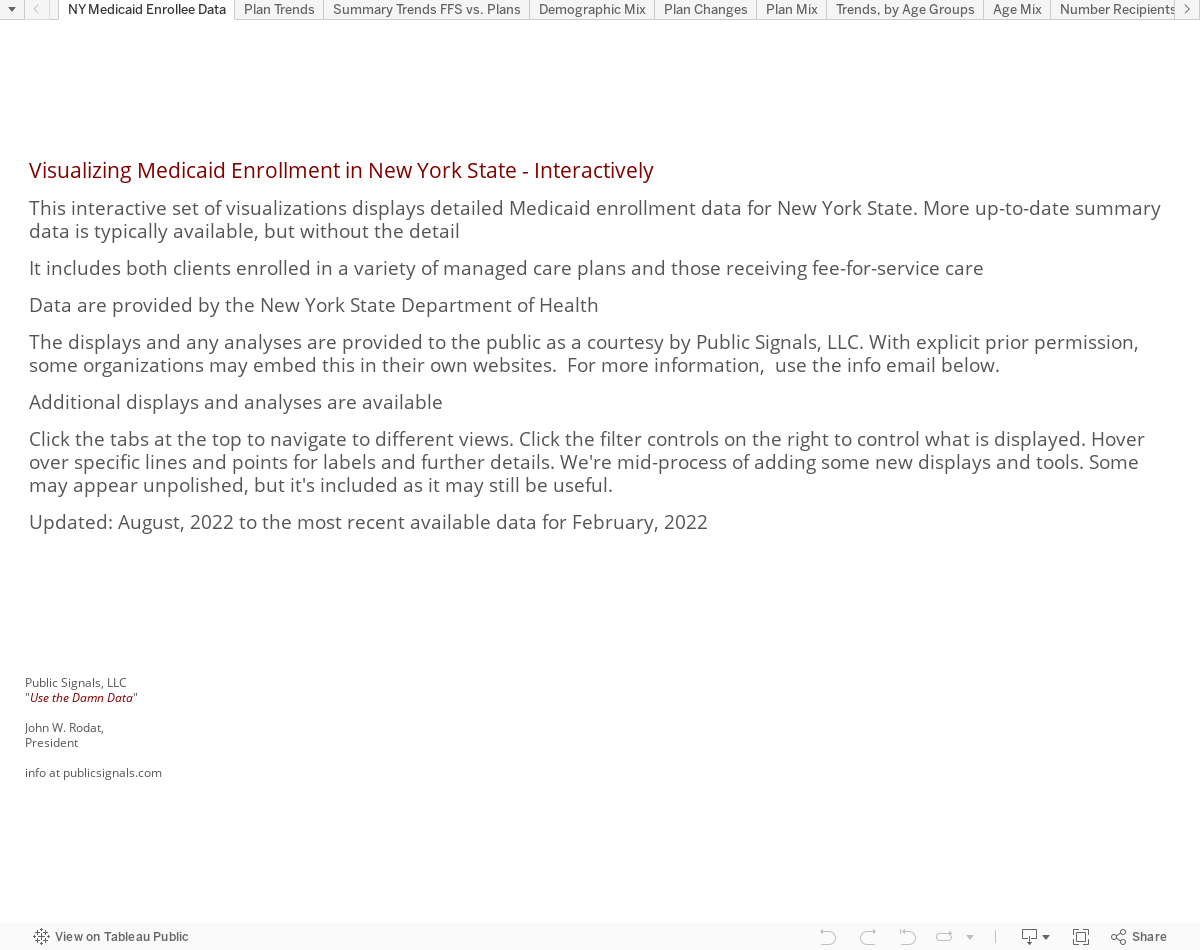
- Public Signals LLC used this source data to create an interactive visualization that was not part of this project. This visualization shows month to month changes in enrollment in individual Medicaid managed care plans, including MLTC plans, as well as demographic mix by age and race. This visualization is posted on this webpage with permission of Public Signals LLC.
This project was made possible by generous grants from:
The Elder Law & Special Need Section of the New York State Bar Association
-and-
The Fan Fox & Leslie R. Samuels Foundation
The design and implementation of this project was performed by John W. Rodat, whose company, Public Signals, Inc., specializes in transforming raw public data into useful information. The Project was led by Valerie Bogart, Director of the Evelyn Frank Legal Resources Program at NYLAG.
Special thanks are due to Eric C. Smith, who, beginning in 2019, spent hundreds of hours on this project as a volunteer law intern working with the New York Legal Assistance Group (NYLAG). He received his J.D. from George Washington School of Law in 2022.
Many thanks to members of the Advisory Committee that consulted on this project: Moriah Adamo, Janet Cohen Sorrentino, Suzanne de Beaumont, Belkys Garcia, Lindsay Heckler, Sara Keating, Jeanne Kramer, Naomi Levin, Eric Smith, and Peter Travitsky.