Obese youth are at greater risk for health problems, including type 2 diabetes, high blood pressure, asthma, early maturation, and joint problems.1
Obese youth are likely to be obese in adulthood. Recently, several chronic diseases which had originally been considered “adult onset” are now appearing at younger ages, including type 2 diabetes and elevated blood pressure.2 This indicator measures the proportion of public school students scoring "Needs Improvement" (Overweight) or "Needs Improvement - High Risk" (Obese) on the Body Composition composite measure of the required California school FITNESSGRAM® test.
Children Overweight or Obese (5th Graders)
In 2013 (baseline year), 40.5% of fifth grade students were overweight or obese for their age . The most recent data available show 40.1% (2017). The target is to be determined (TBD) for this indicator.
Baseline
40.5%
Target
TBD
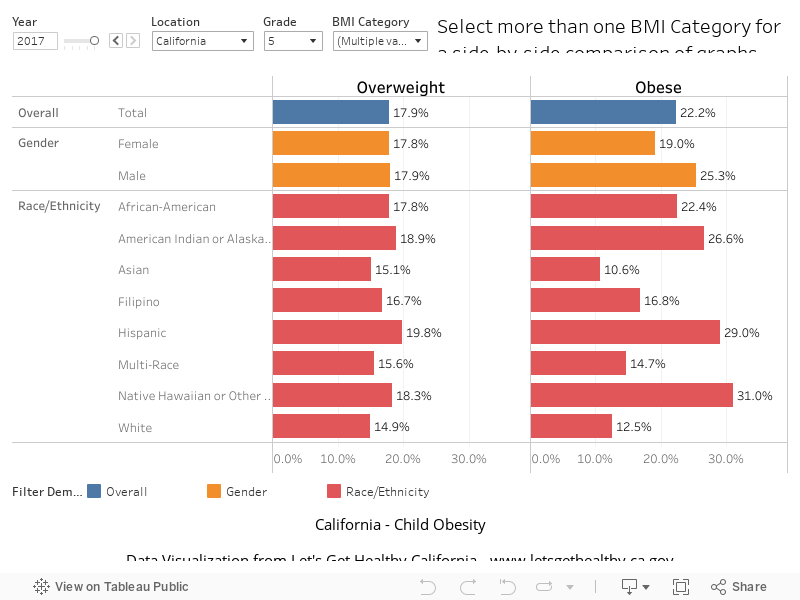
Children Overweight or Obese (7th Graders)
In 2013 (baseline year), 37.2% of seventh grade students were overweight or obese for their age The most recent data available show 38.2% (2017). The target is to be determined (TBD) for this indicator.
Baseline
37.2%
Target
TBD
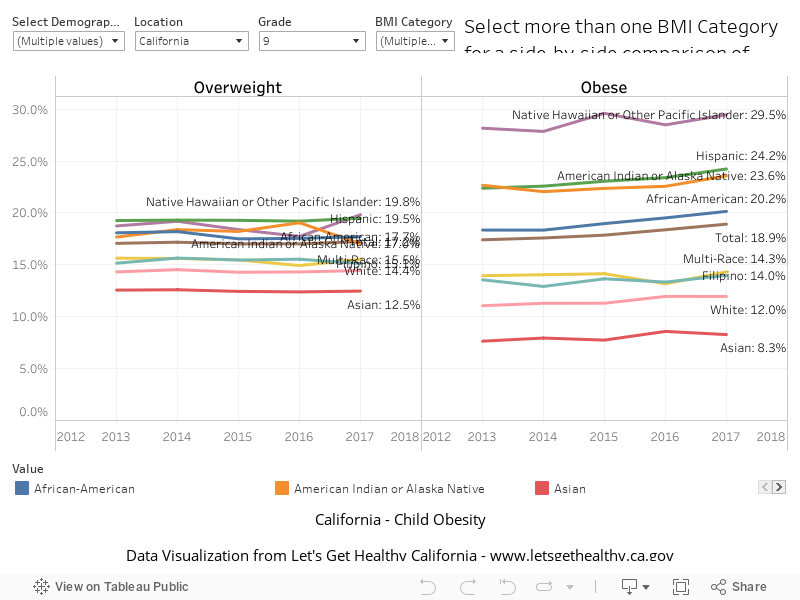
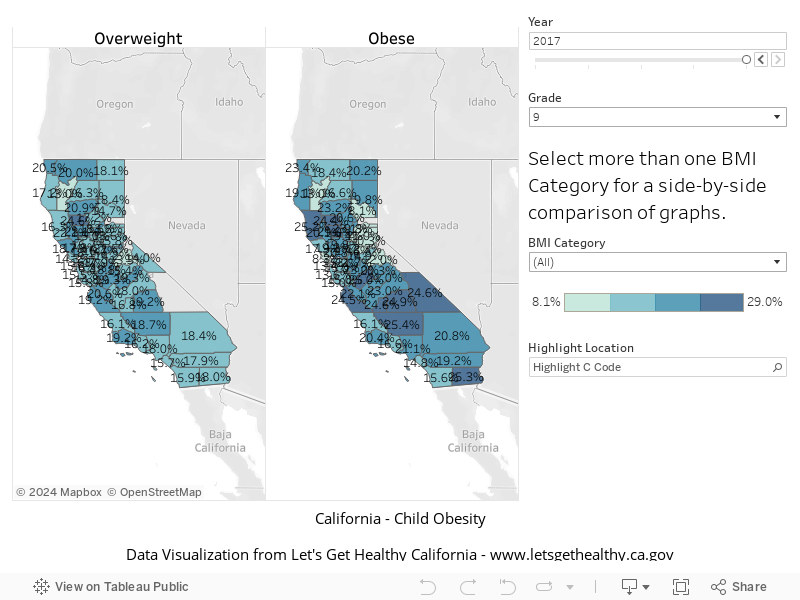
Children Overweight or Obese (9th Graders)
In 2013 (baseline year), 34.5% of ninth grade students were overweight or obese for their age. The most recent data available show 36.1% (2017). The target is to be determined (TBD) for this indicator.
Baseline
34.5%
Target
TBD
Indicator Highlights

Collaborative Partnerships and Environments for Early Childhood Health
HAB45 strives to prevent early childhood obesity among low-income children ages 0-5. Through collaboration with multiple organizations, HAB45 promotes quality parks, healthy eating, physical activity, breastfeeding, and reduction of screen time. Learn more »
Proportion of Obese or Overweight Students, Over Time
Proportion of Obese or Overweight Students, by Demographic Category
Percentage of Obese or Overweight Students, by County
|
Stories & Solutions
Increasing Breastfeeding Duration
If 90% of US families could comply with current medical guidelines to breastfeed exclusively for 6 months, the US could avoid about $18.5 billion per year in increased health care costs (2014 dollars). 1 [...]
Collaborative Partnerships and Environments for Early Childhood Health
HAB45 strives to prevent early childhood obesity among low-income children ages 0-5.
Building Broccoli Smiles through Food Literacy
The Food Literacy Center teaches low-income elementary school students skills to reduce obesity risk.


Rethink Your Drink
This public health initiative aims to educate low-income Californians about healthy drink options, help identify drinks with added sugar, and make the link between consumption of sugar-sweetened drinks and health risks.
Share Your Story
Want to engage in moving the dial on Healthy Beginnings? Share your impact story!


