
Discovery of Chlorophyll d: Isolation and Characterization of a Far-Red Cyanobacterium from the Original Site of Manning and Strain (1943) at Moss Beach, California

 , , , , ,
Abstract
:1. Introduction
2. Materials and Methods
2.1. Establishment of Cultures
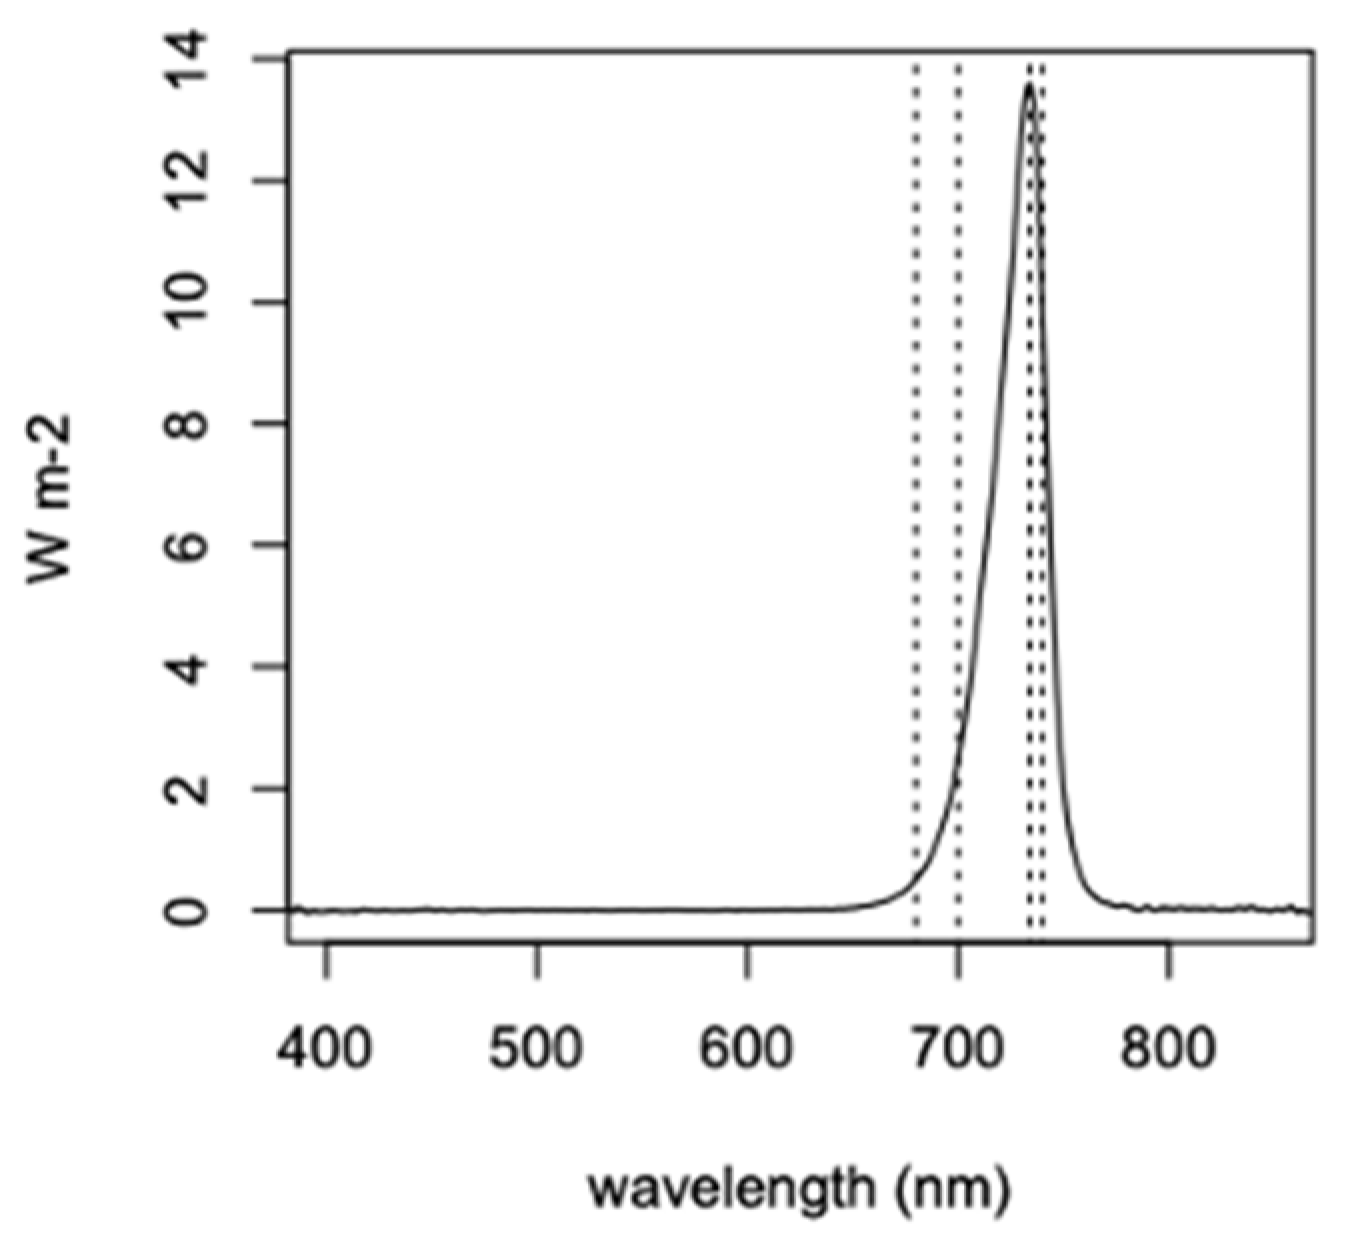
2.2. In Vivo Spectral Absorbance
2.3. Pigment Characterization
2.4. Transmission Electron Microscopy (TEM)
2.5. DNA Extraction
2.6. DNA Sequencing
2.7. Genome Sequence Assembly and Analysis
3. Results
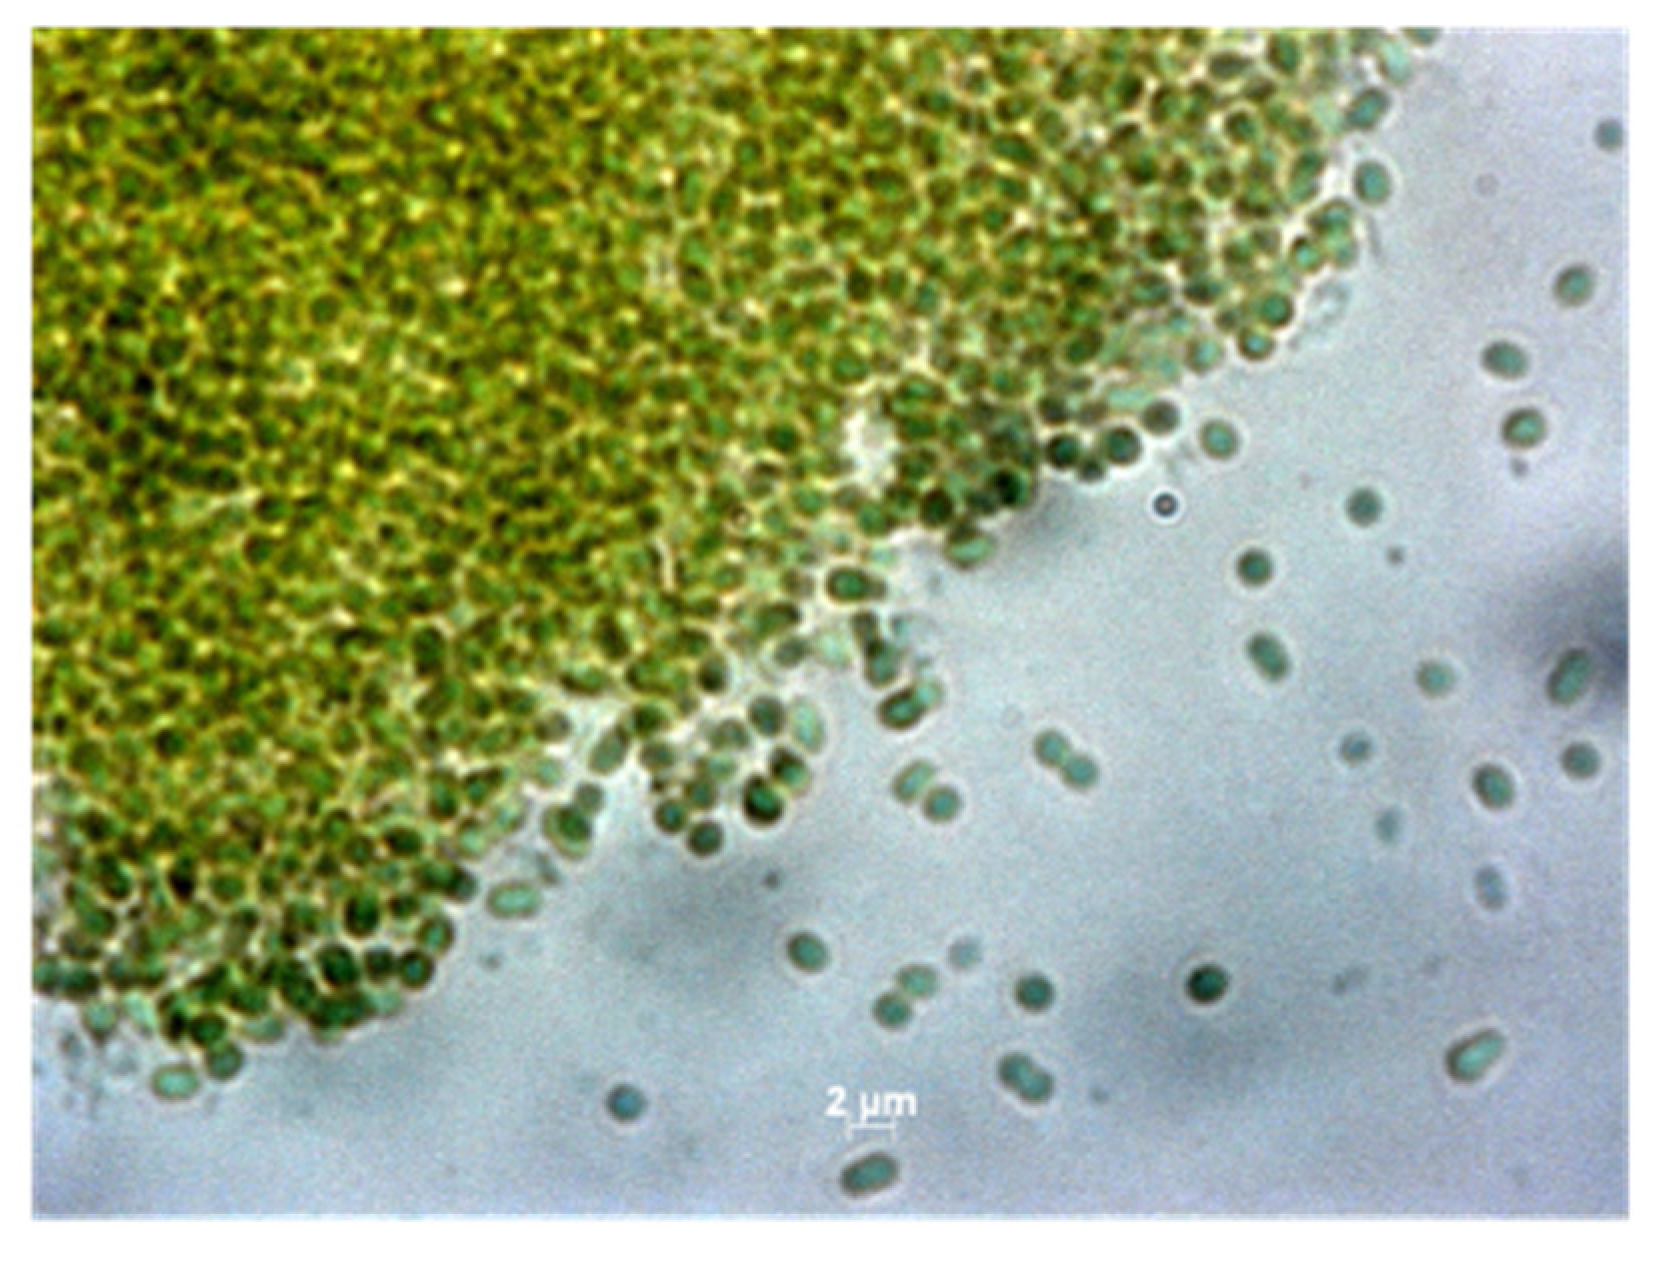
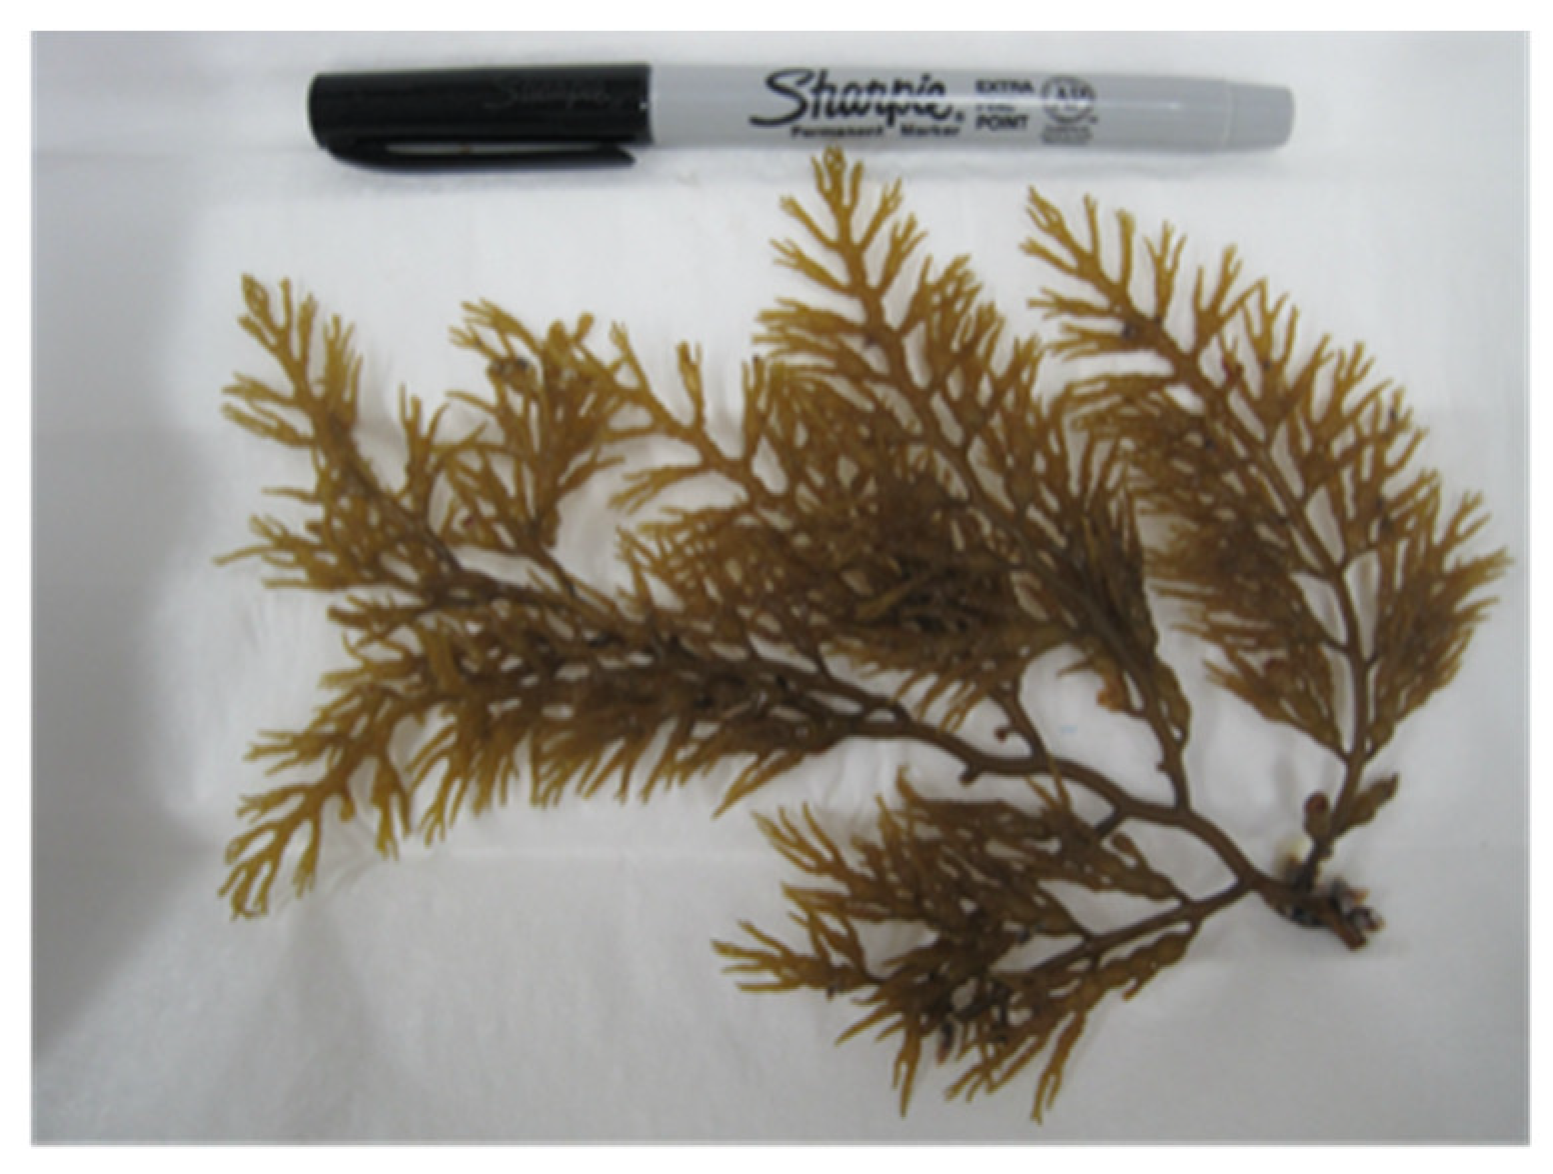
3.1. Cultures
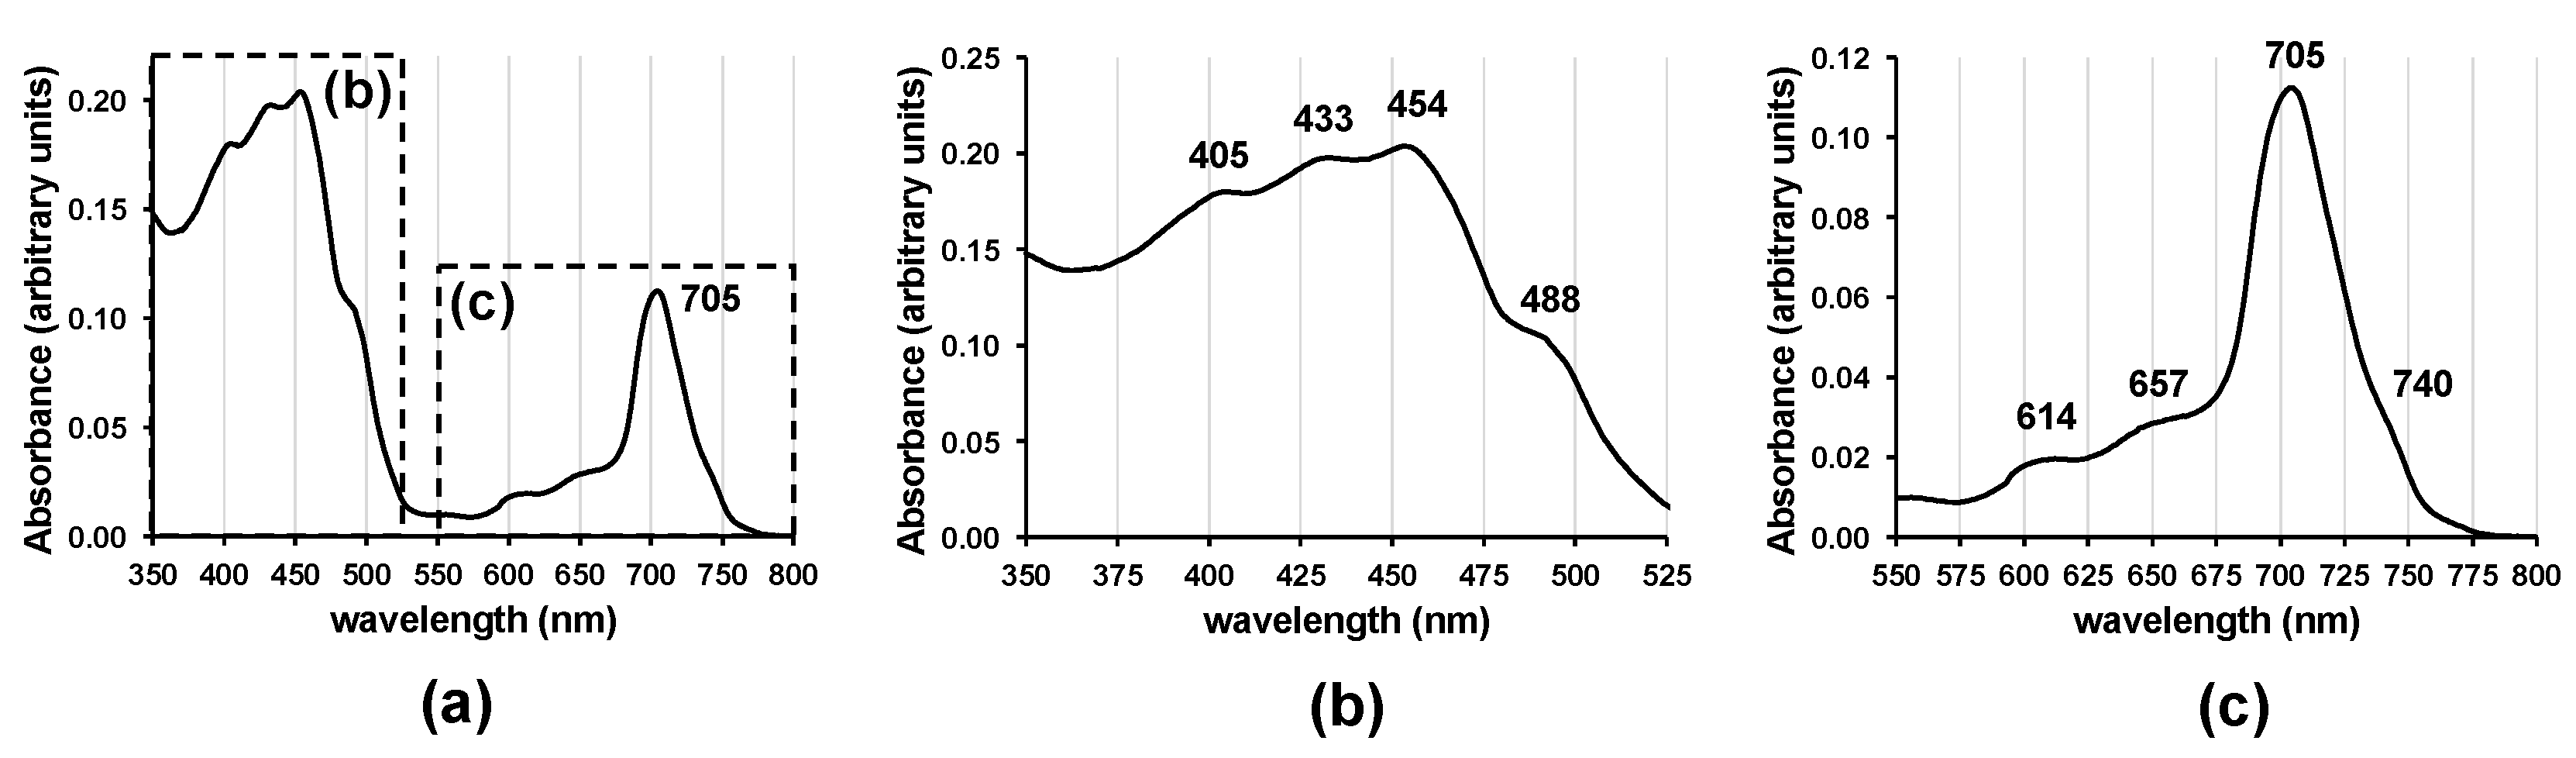
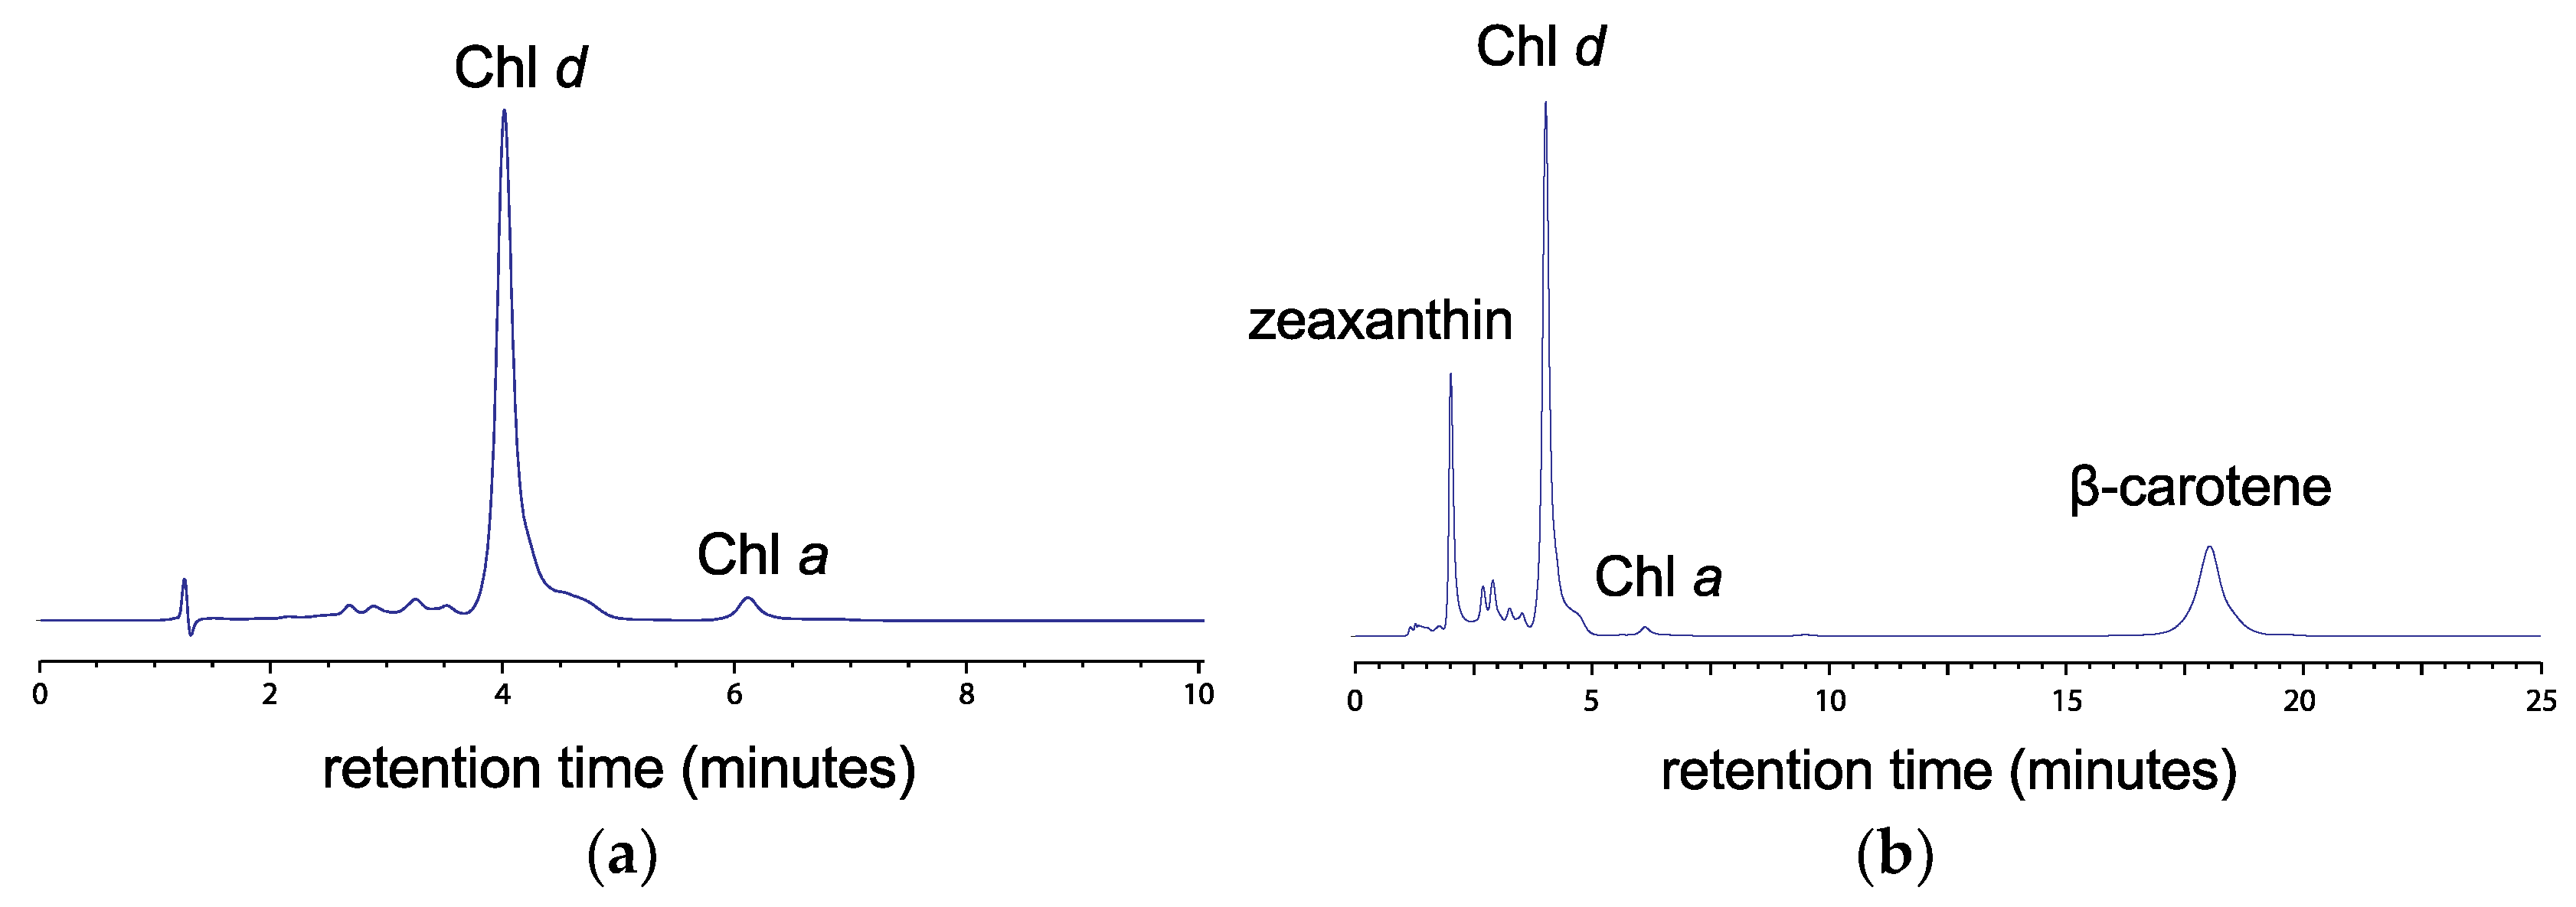
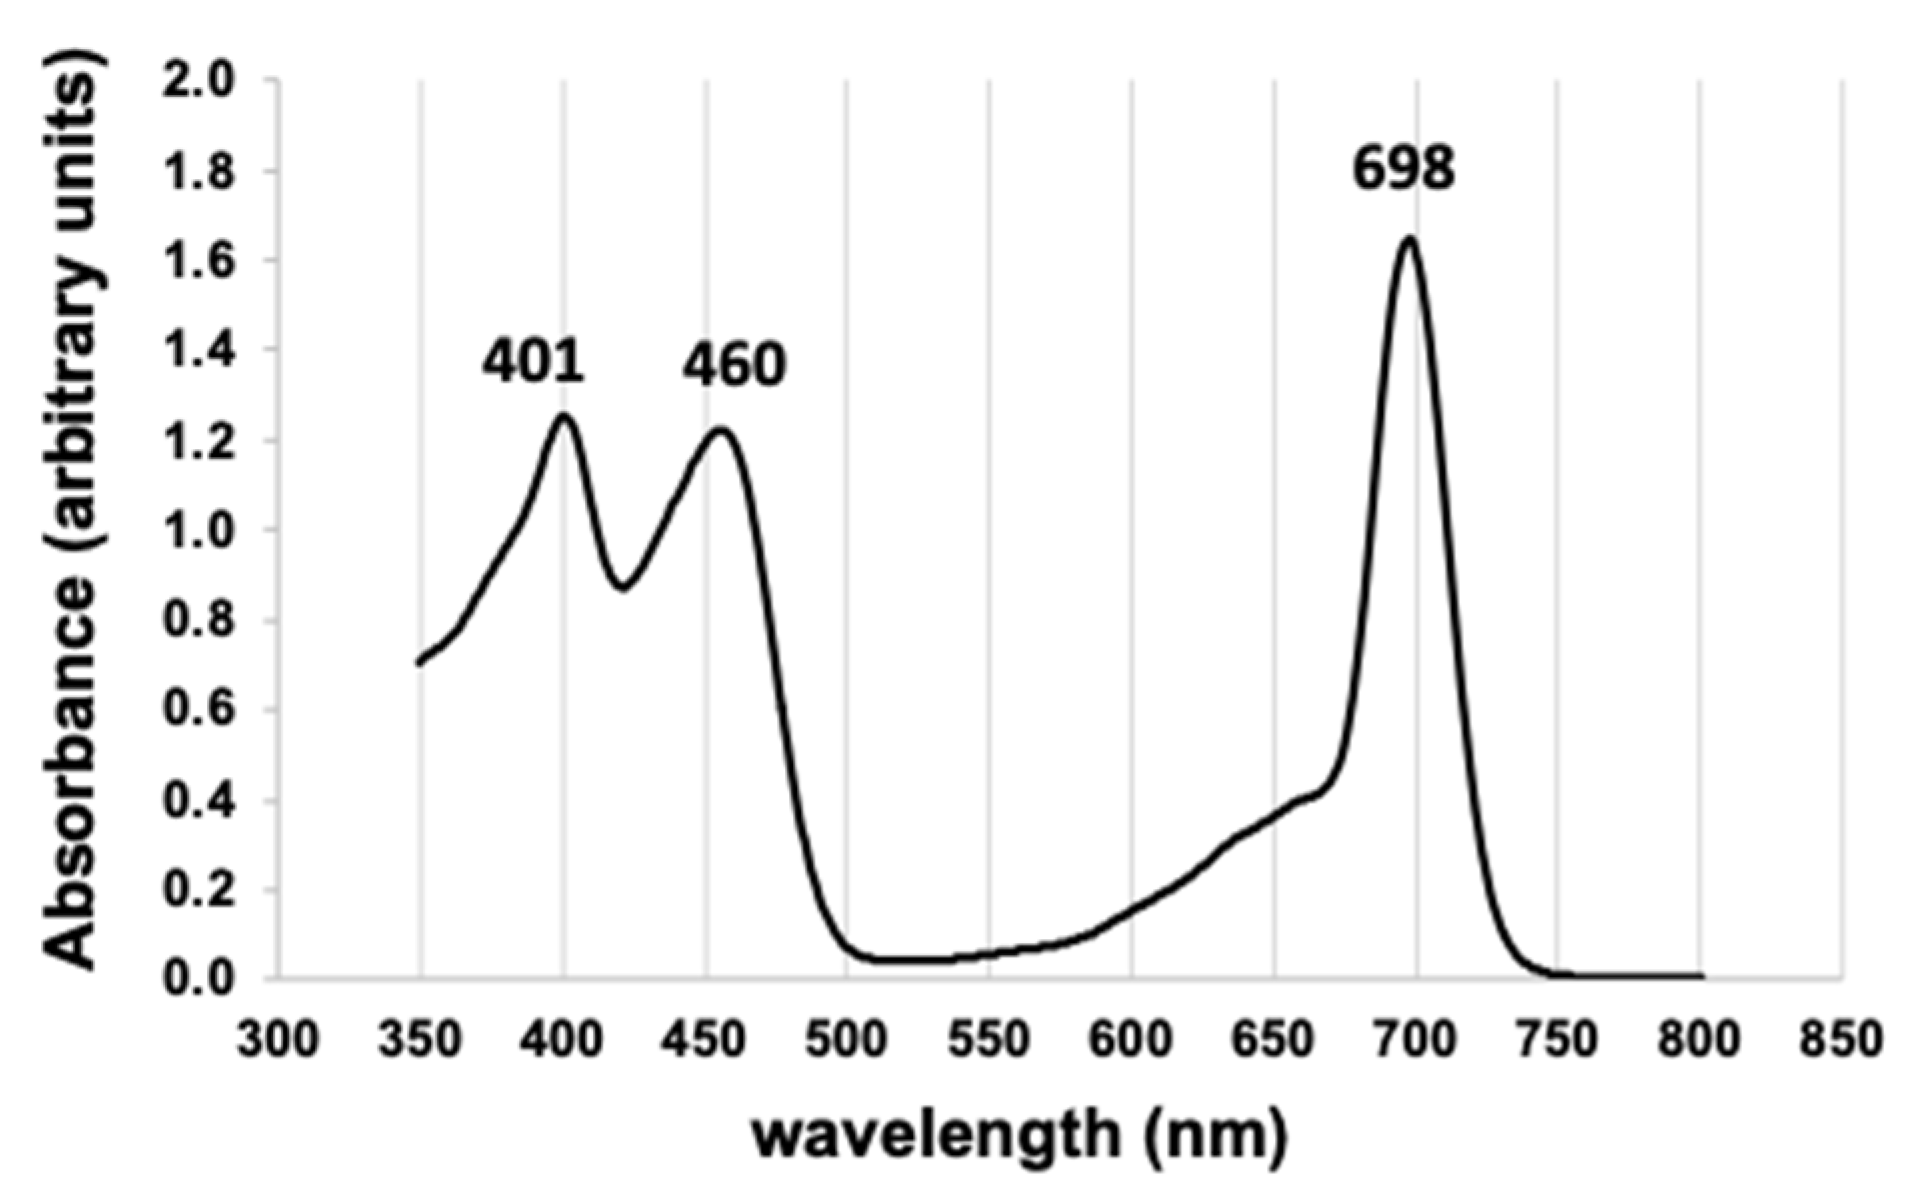
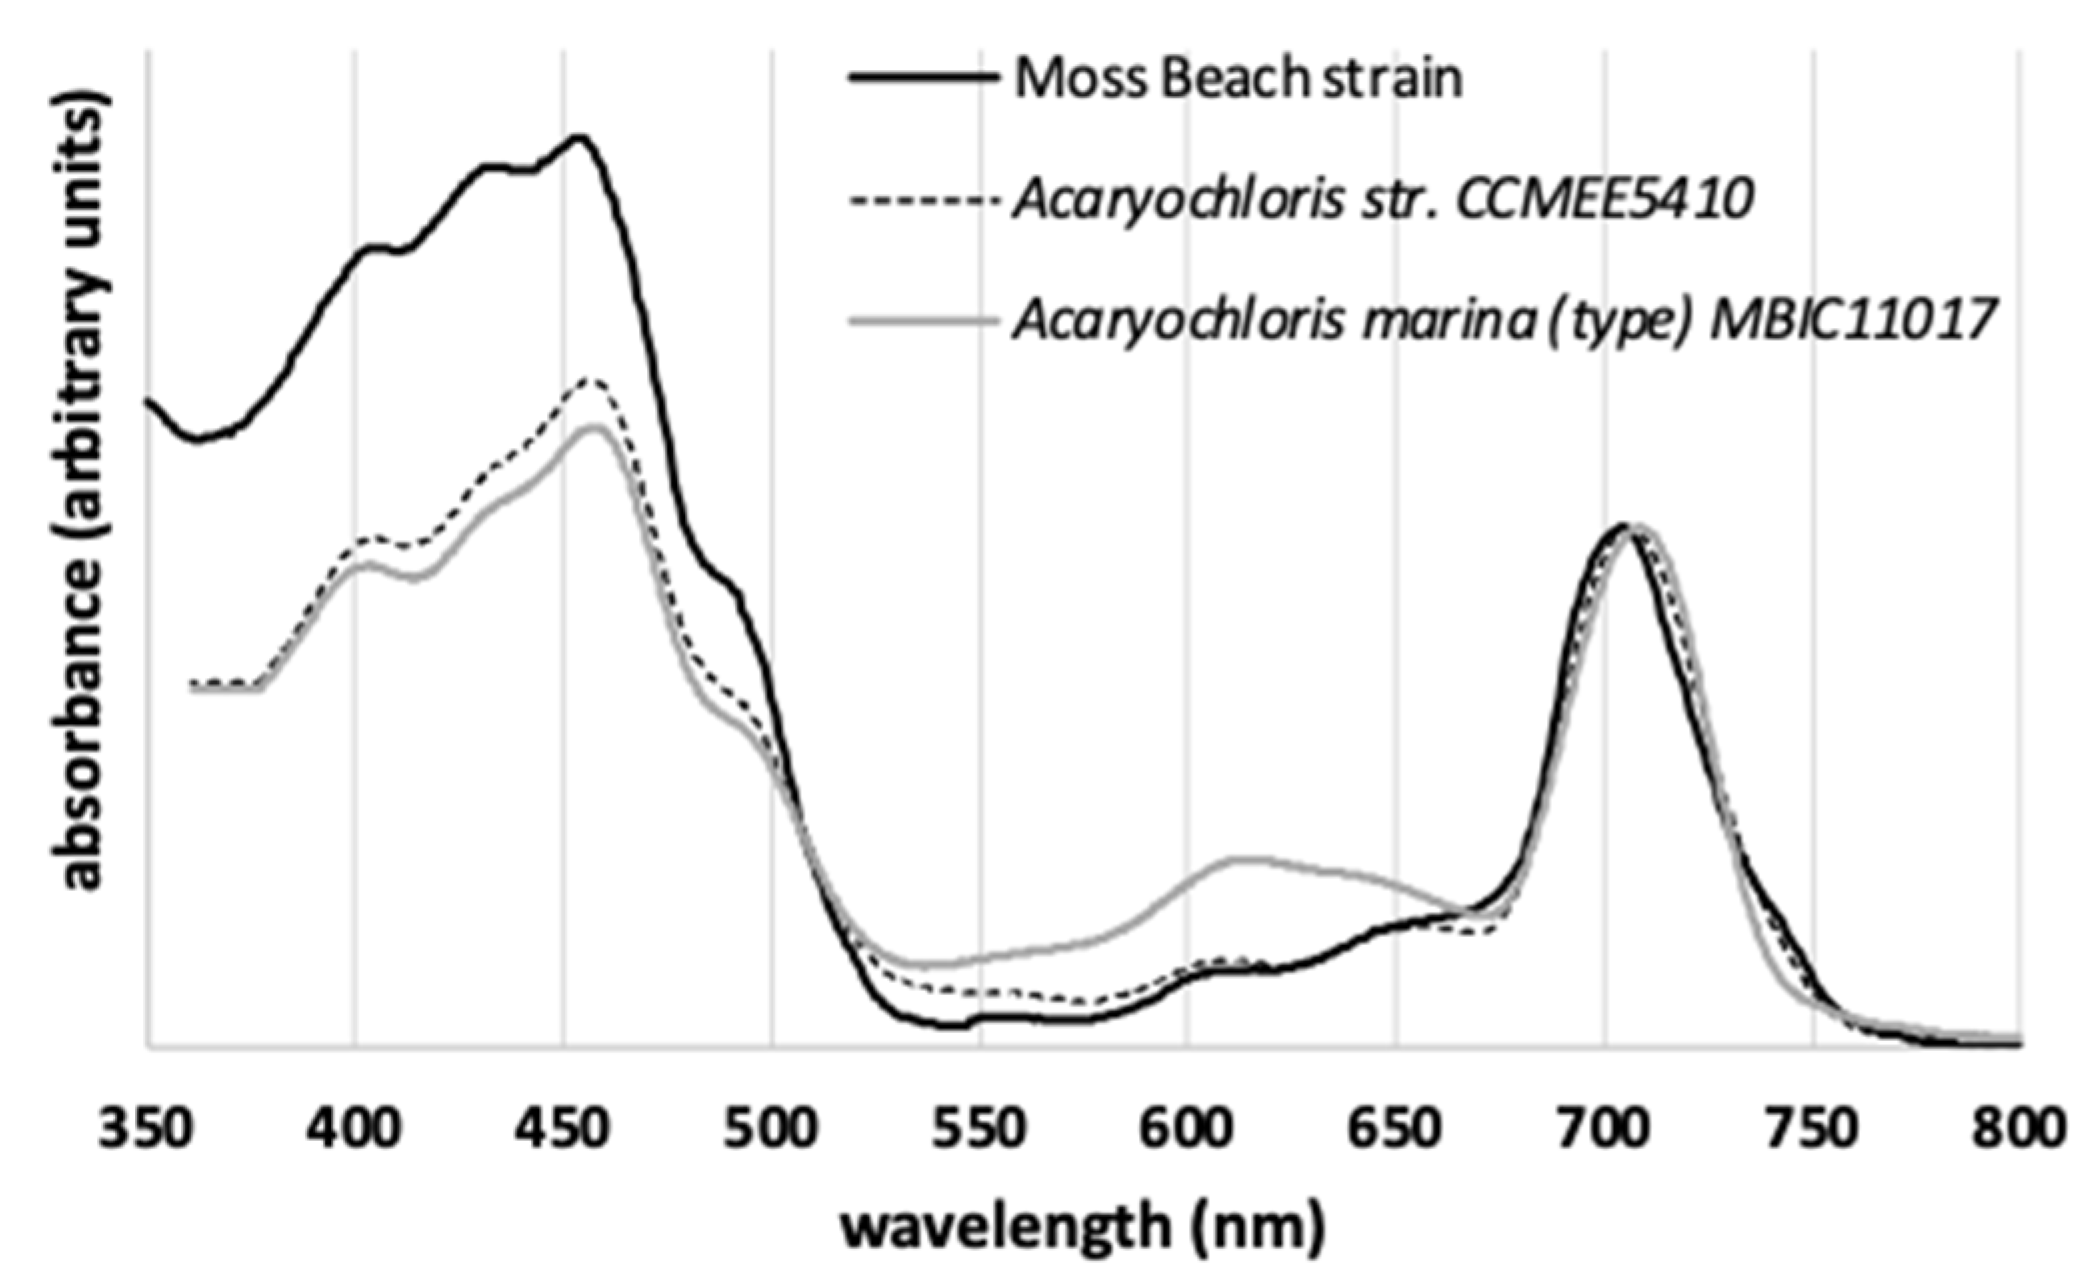
3.2. Pigment Characterization
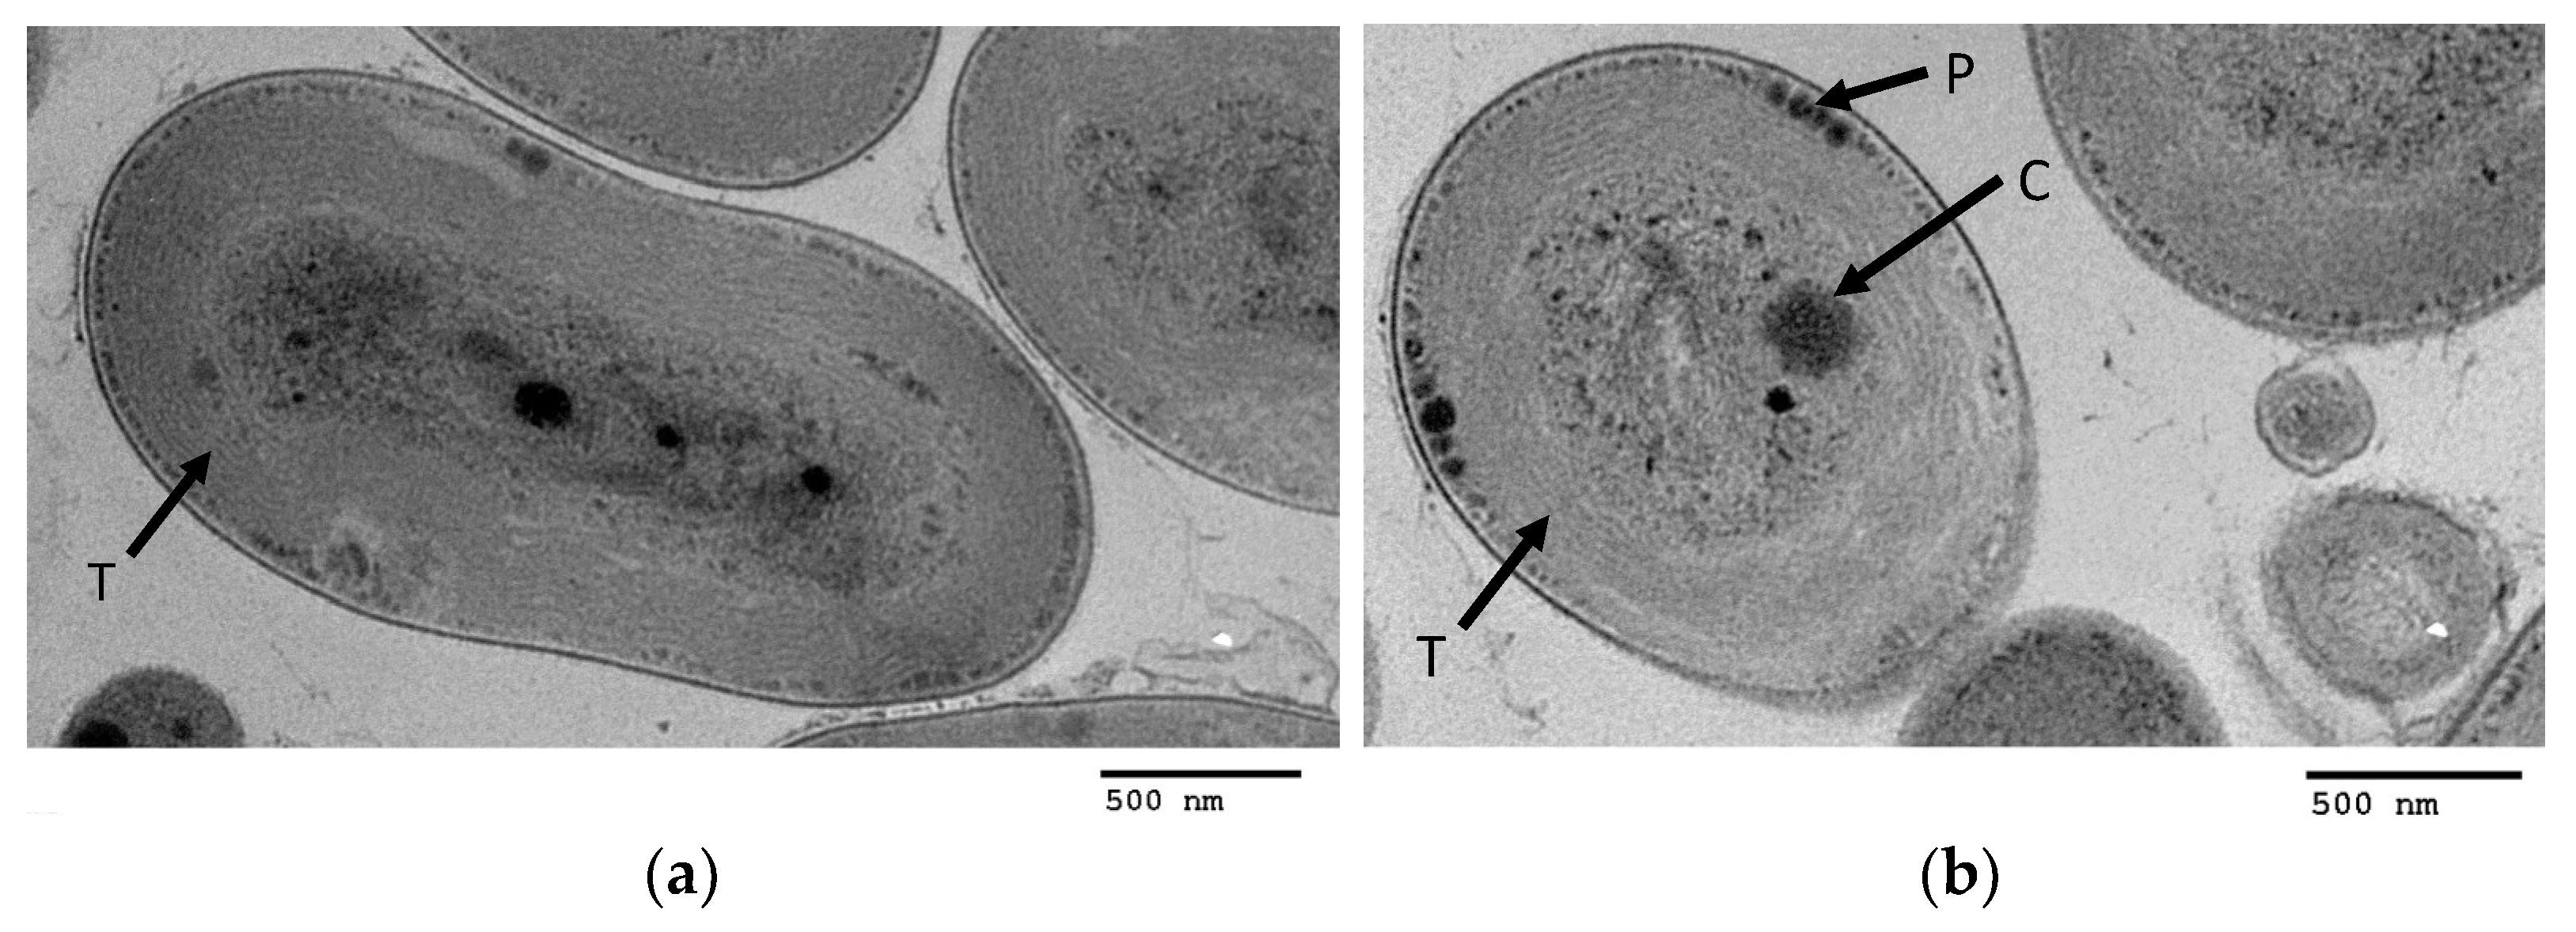
3.3. TEM Images
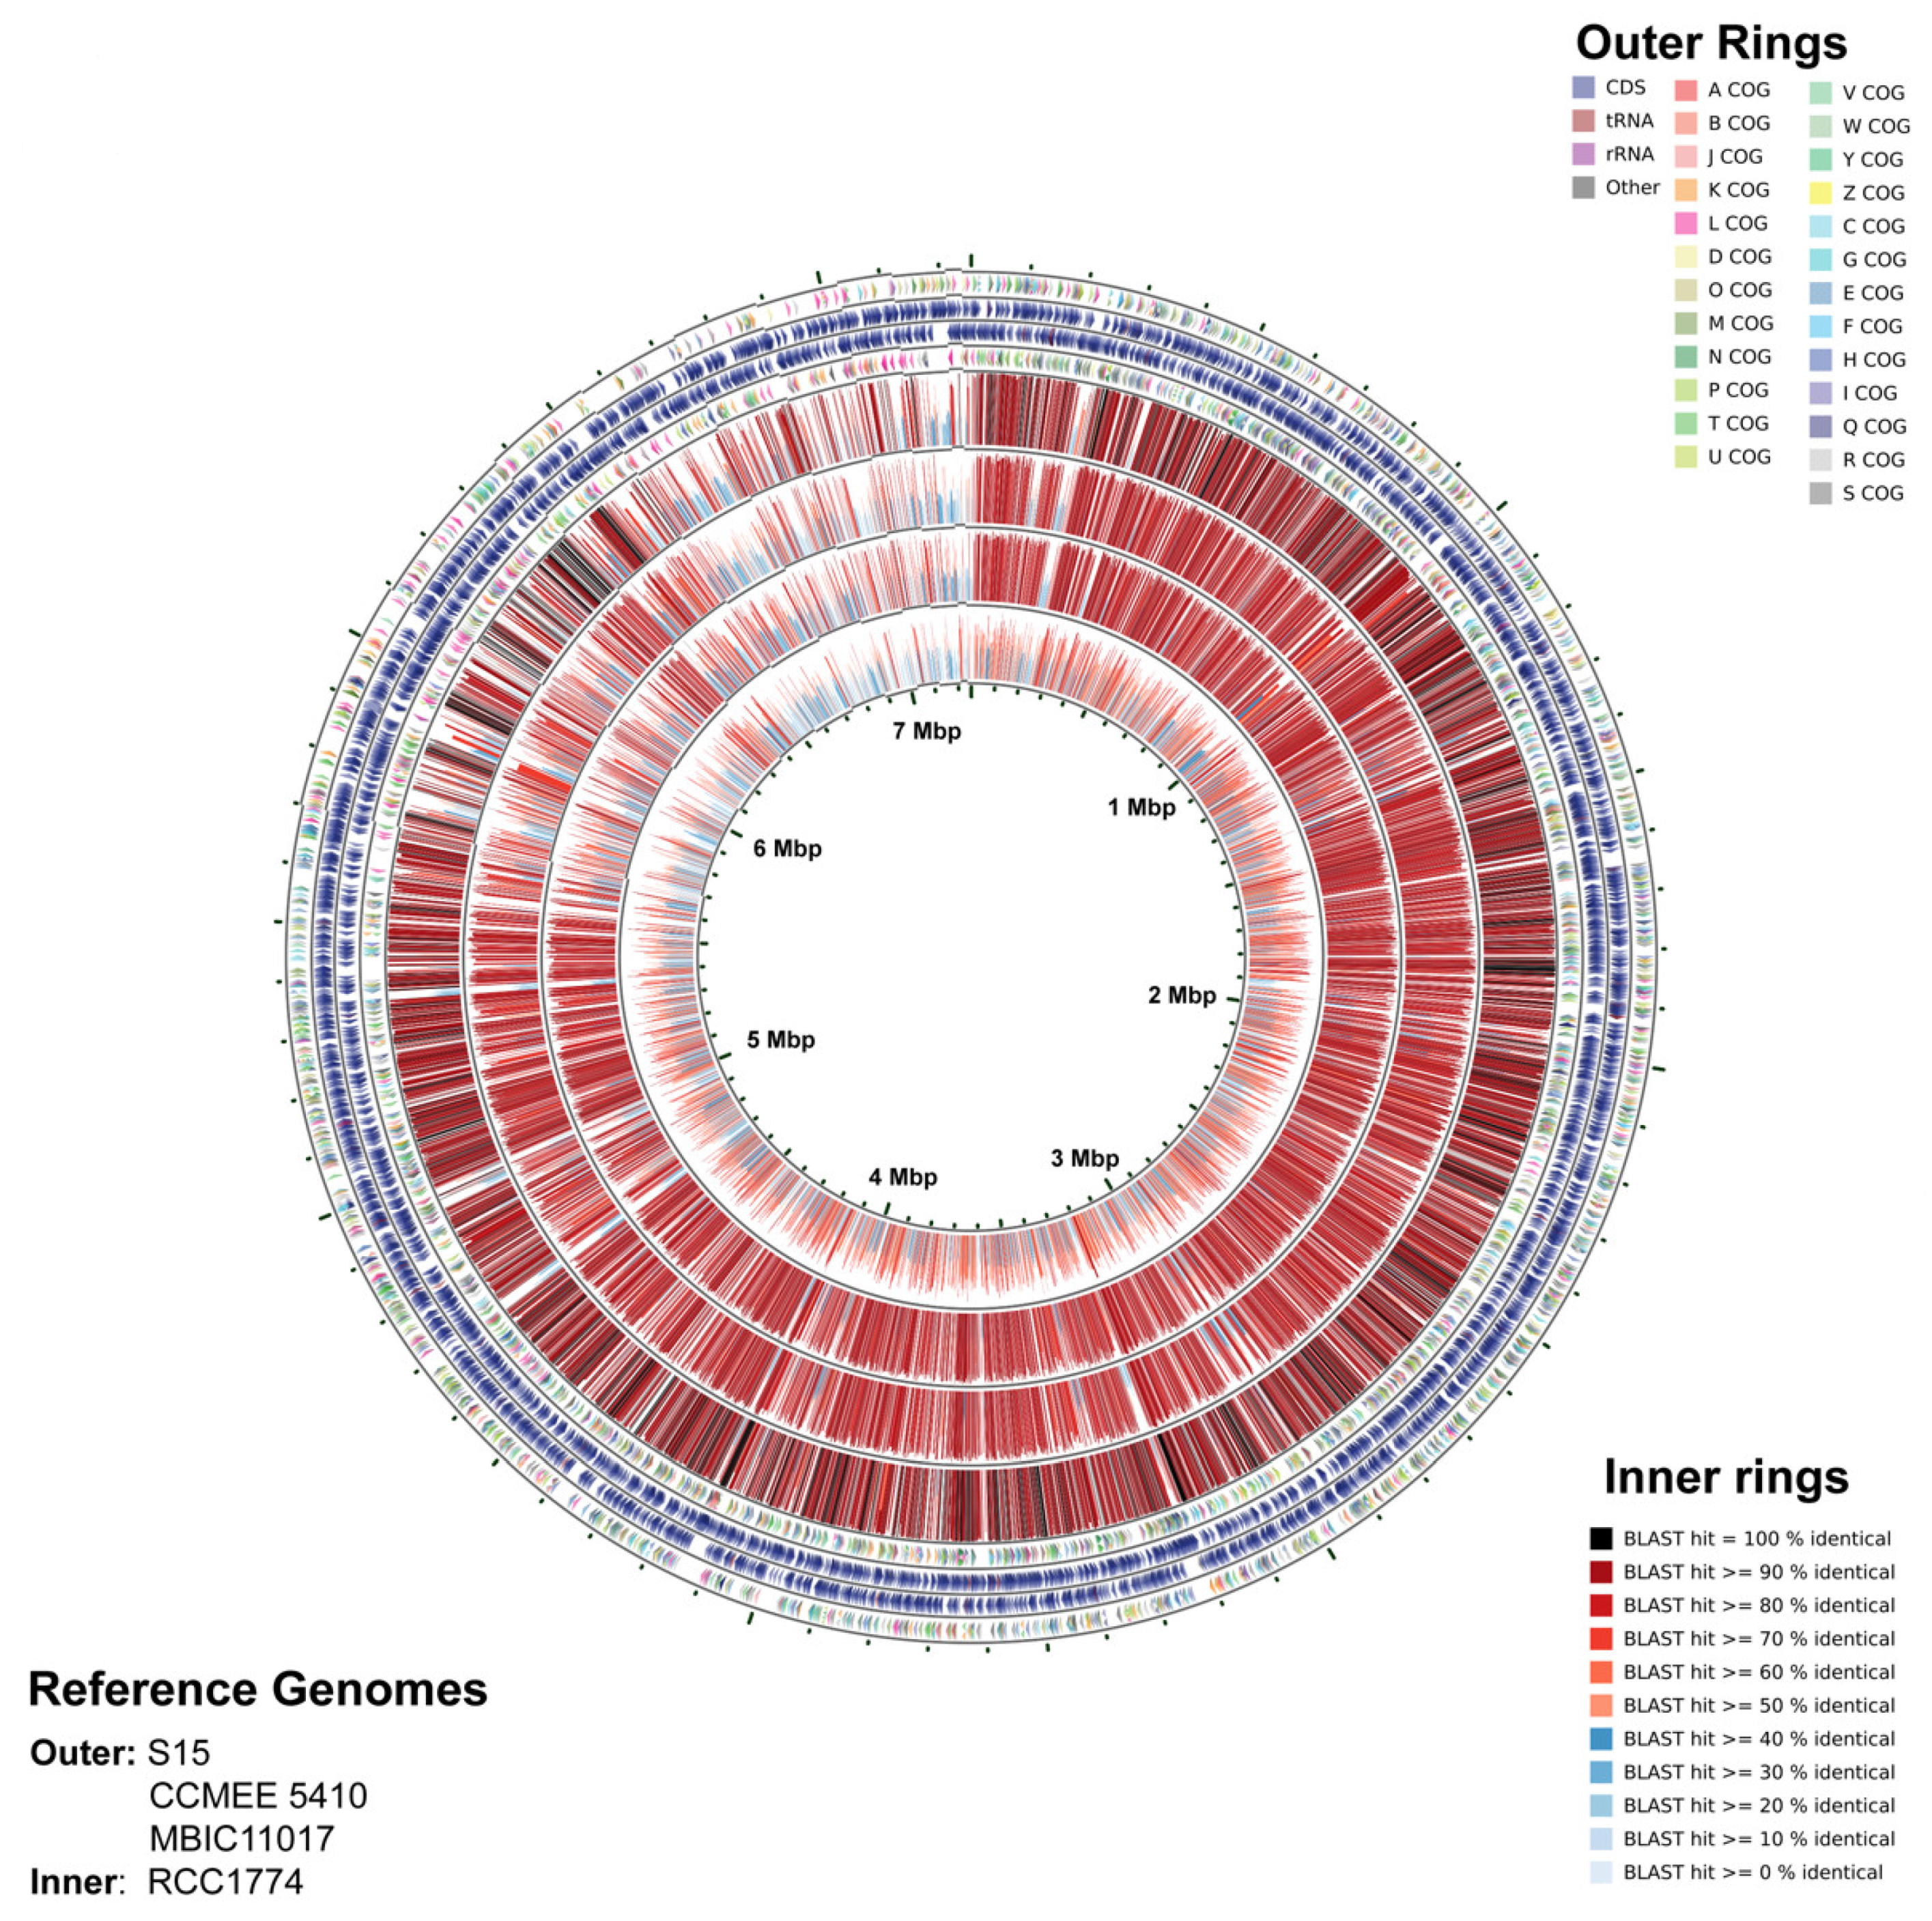
3.4. Genome Statistics
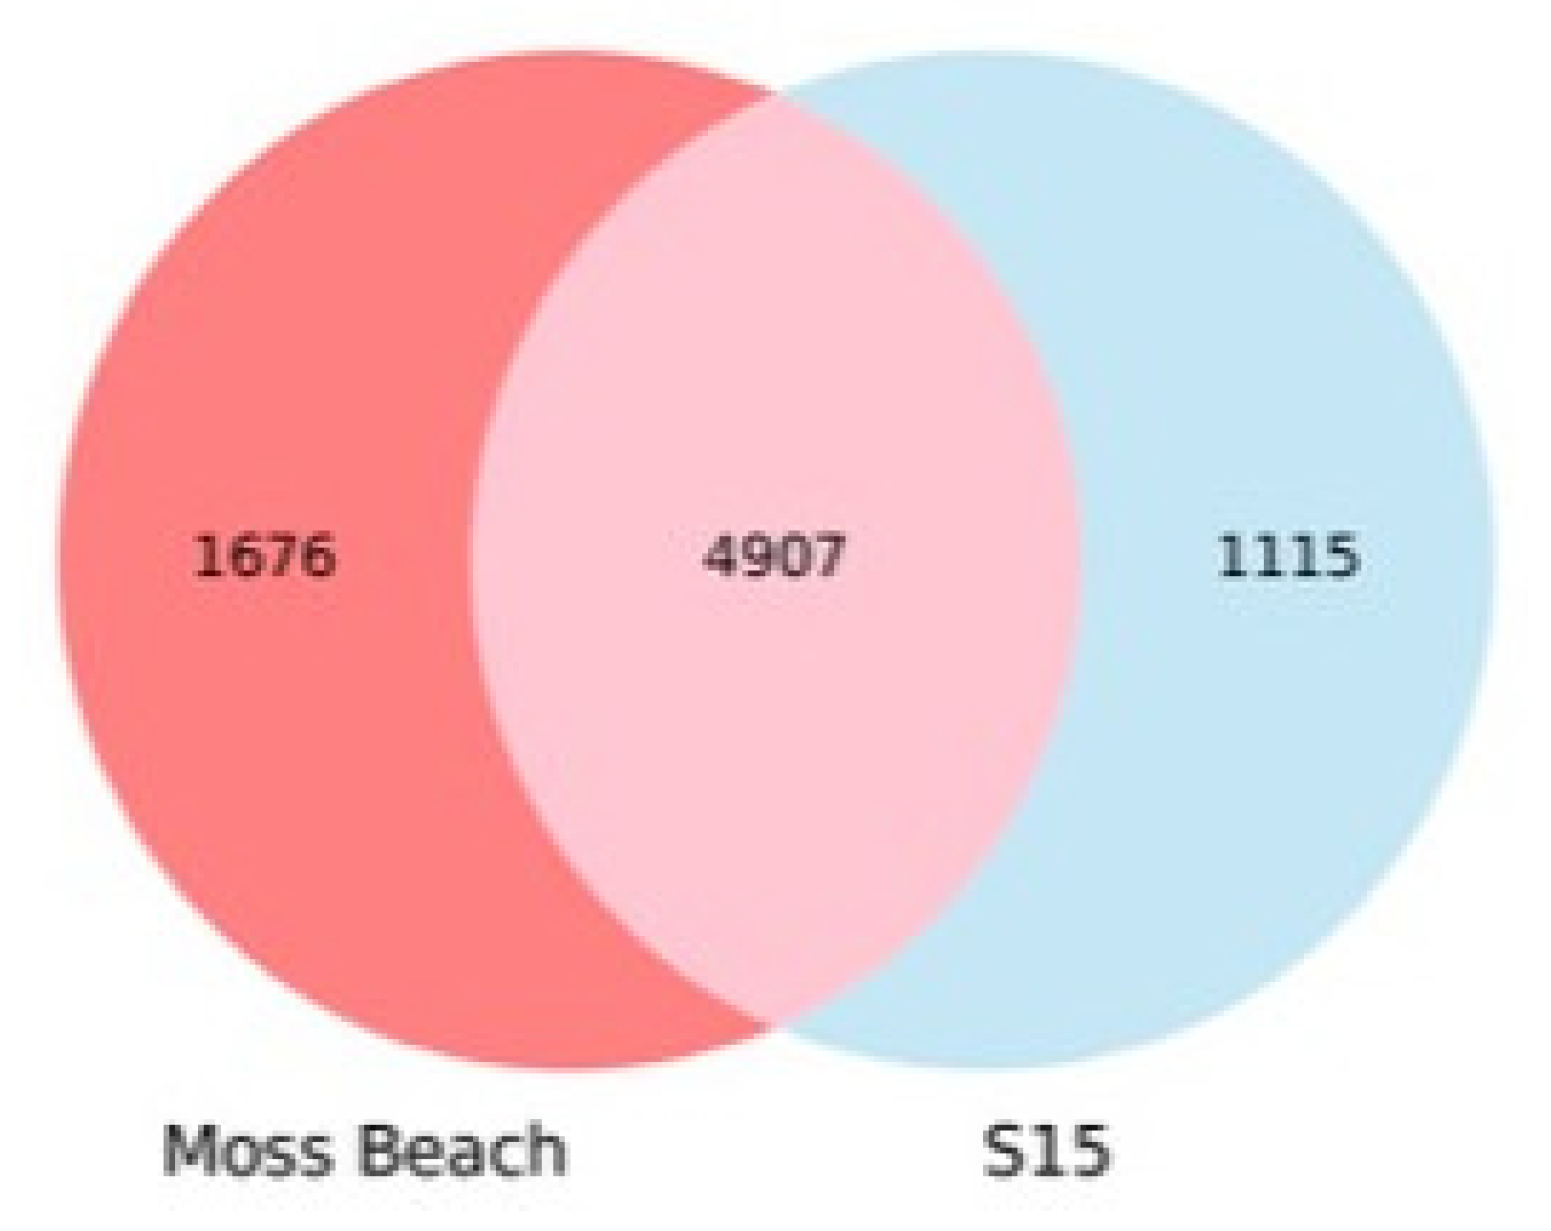
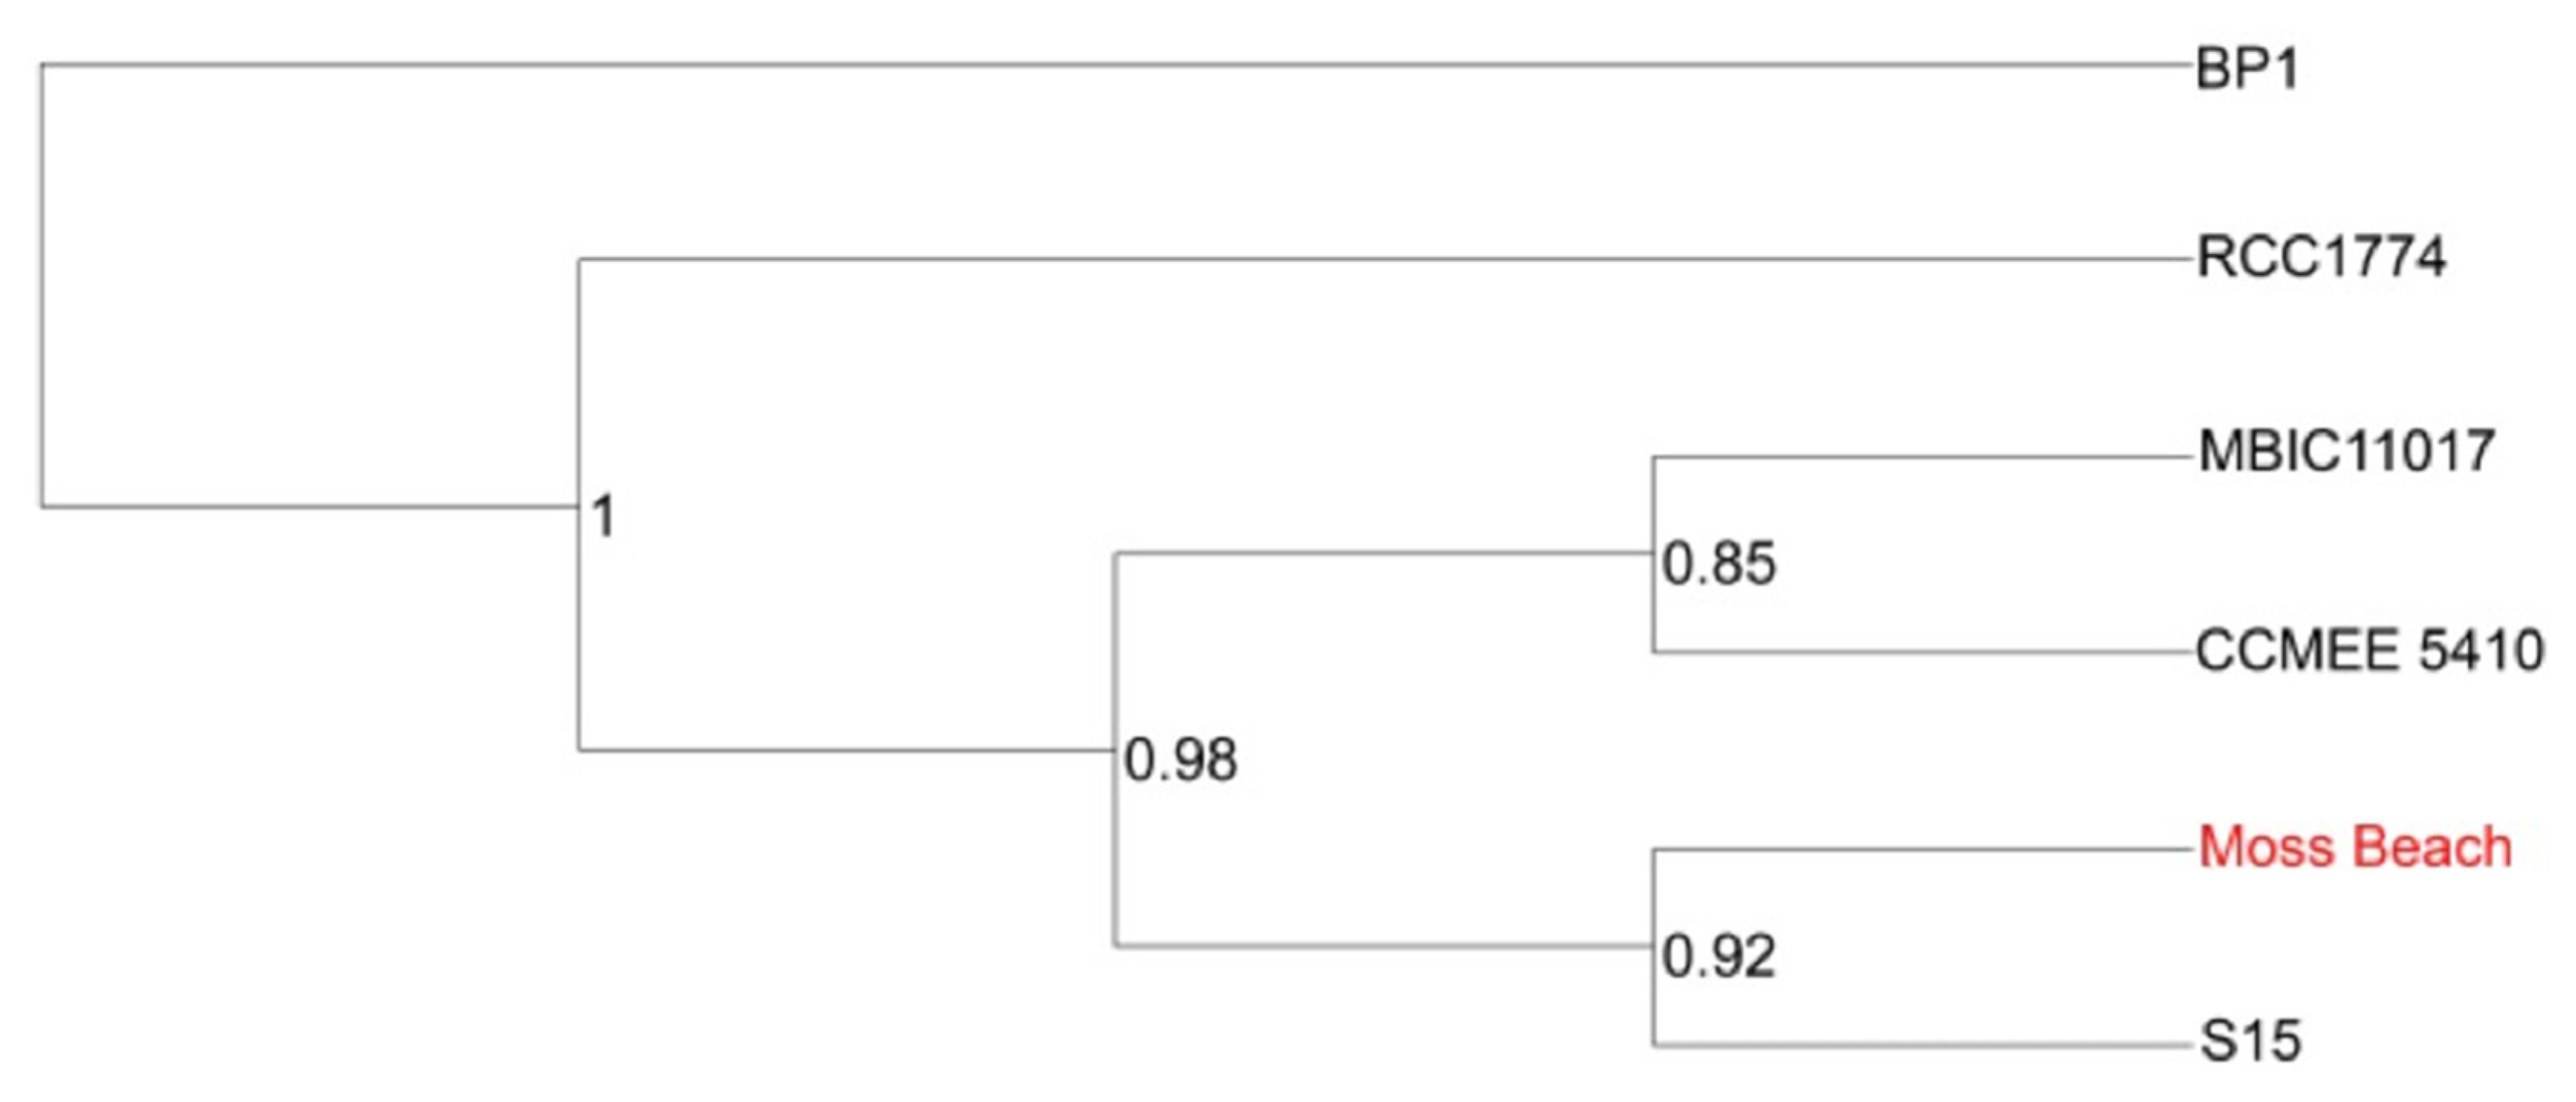
3.5. Relationship of Strain Moss Beach with Other Acaryochloris Strains
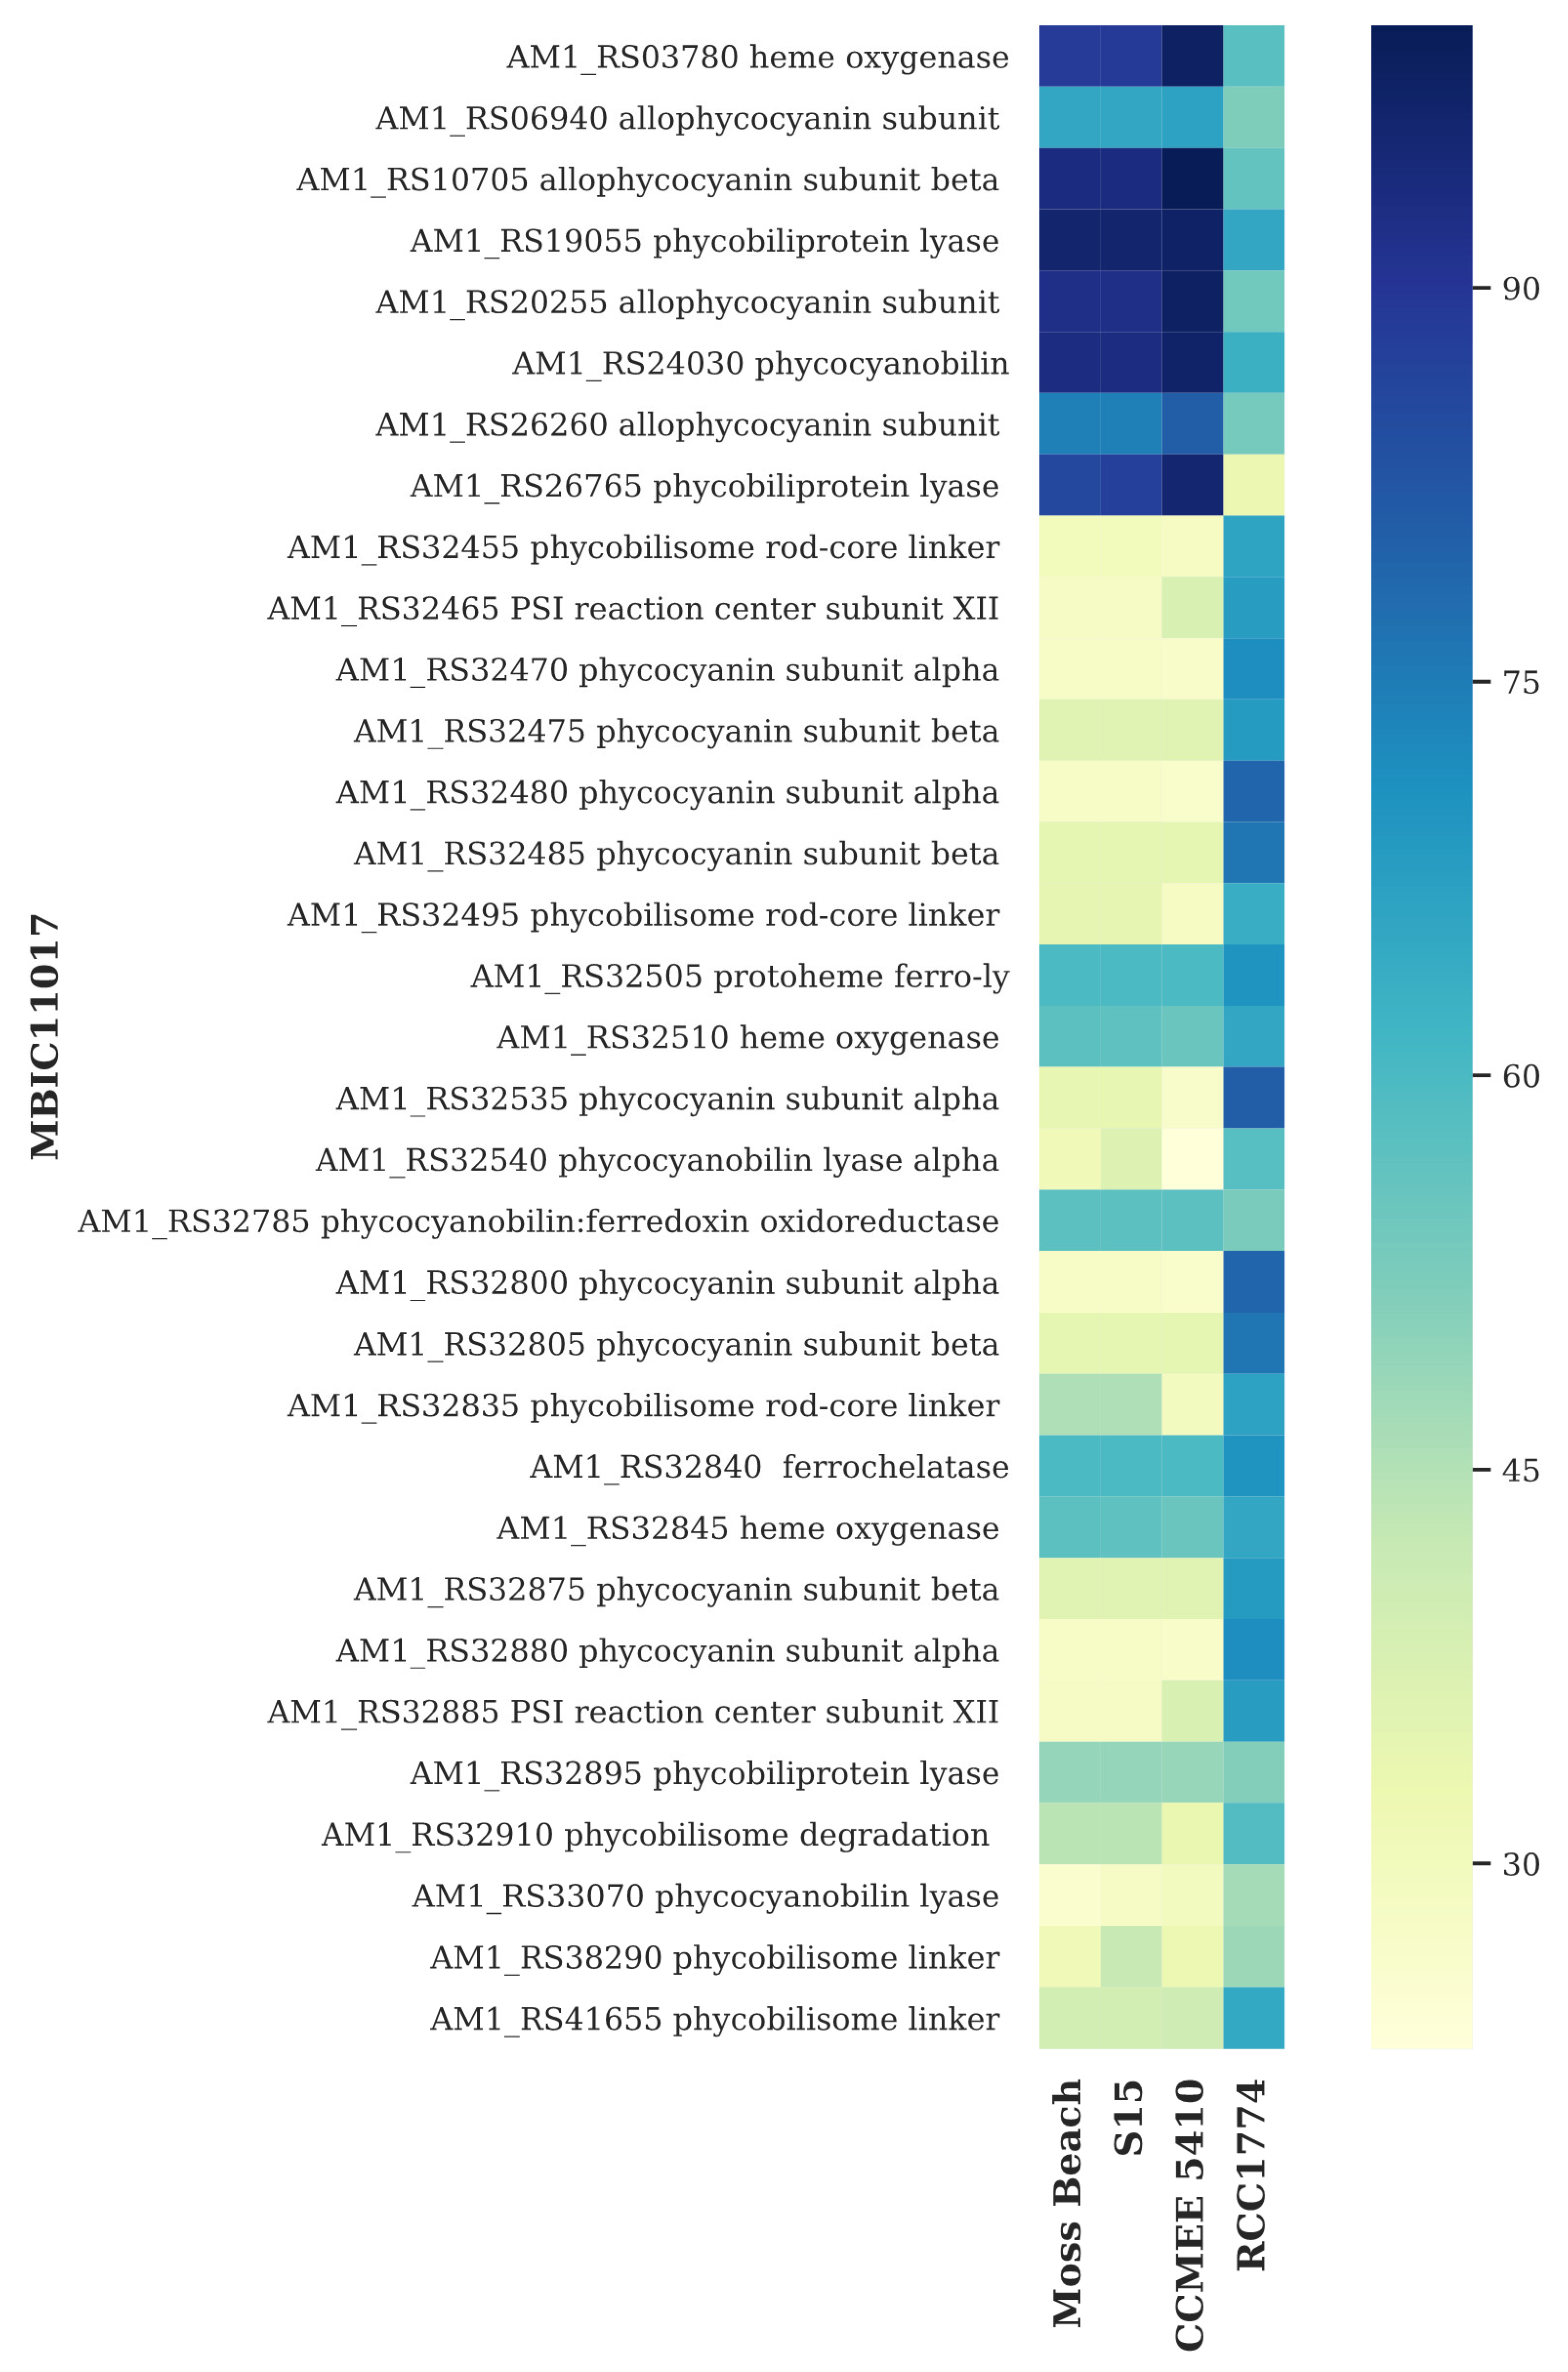
3.6. Light-Harvesting Genes
4. Discussion
5. Conclusions
Supplementary Materials
Author Contributions
Funding
Institutional Review Board Statement
Informed Consent Statement
Data Availability Statement
Acknowledgments
Conflicts of Interest
References
- Manning, W.M.; Strain, H.H. Chlorophyll d: A green pigment in red algae. J. Biol. Chem. 1943, 151, 1–19. [Google Scholar] [CrossRef]
- Miyashita, H.; Ikemoto, H.; Kurano, N.; Adachi, K.; Chihara, M.; Miyachi, S. Chlorophyll d as a major pigment. Nature 1996, 383, 402. [Google Scholar] [CrossRef]
- Miyashita, H.; Adachi, K.; Kurano, N.; Ikemoto, H.; Chihara, M.; Miyachi, S. Pigment composition of a novel oxygenic photosynthetic prokaryote containing chlorophyll d as the major chlorophyll. Plant Cell Physiol. 1997, 38, 274–281. [Google Scholar] [CrossRef] [Green Version]
- Li, Y.Q.; Chen, M. Novel chlorophylls and new directions in photosynthesis research. Funct. Plant Biol. 2015, 42, 493–501. [Google Scholar] [CrossRef] [PubMed] [Green Version]
- Allakhverdiev, S.I.; Kreslavski, V.D.; Zharmukhamedov, S.K.; Voloshin, R.A.; Korol’kova, D.V.; Tomo, T.; Shen, J.R. Chlorophylls d and f and their role in primary photosynthetic processes of cyanobacteria. Biochem.-Mosc. 2016, 81, 201–212. [Google Scholar] [CrossRef] [PubMed]
- Hamaguchi, T.; Kawakami, K.; Shinzawa-Itoh, K.; Inoue-Kashino, N.; Itoh, S.; Ifuku, K.; Yamashita, E.; Maeda, K.; Yonekura, K.; Kashino, Y. Structure of the far-red light utilizing photosystem I of Acaryochloris marina. Nat. Commun. 2021, 12, 2333. [Google Scholar] [CrossRef]
- Kobayashi, M.; Ohashi, S.; Iwamoto, K.; Shiraiwa, Y.; Kato, Y.; Watanabe, T. Redox potential of chlorophyll d in vitro. Biochim. Biophys. Acta-Bioenerg. 2007, 1767, 596–602. [Google Scholar] [CrossRef] [Green Version]
- Tomo, T.; Okubo, T.; Akimoto, S.; Yokono, M.; Miyashita, H.; Tsuchiya, T.; Noguchi, T.; Mimuro, M. Identification of the special pair of photosystem II in a chlorophyll d-dominated cyanobacterium. Proc. Natl. Acad. Sci. USA 2007, 104, 7283–7288. [Google Scholar] [CrossRef] [Green Version]
- Mielke, S.P.; Kiang, N.Y.; Blankenship, R.E.; Gunner, M.R.; Mauzerall, D. Efficiency of photosynthesis in a Chl d-utilizing cyanobacterium is comparable to or higher than that in Chl a-utilizing oxygenic species. Biochim. Biophys. Acta-Bioenerg. 2011, 1807, 1231–1236. [Google Scholar] [CrossRef] [Green Version]
- Cha, Y.; Mauzerall, D.C. Energy-storage of linear and cyclic electron flows in photosynthesis. Plant Physiol. 1992, 100, 1869–1877. [Google Scholar] [CrossRef] [Green Version]
- Mielke, S.P.; Kiang, N.Y.; Blankenship, R.E.; Mauzerall, D. Photosystem trap energies and spectrally-dependent energy-storage efficiencies in the Chl d-utilizing cyanobacterium, Acaryochloris marina. Biochim. Biophys. Acta-Bioenerg. 2013, 1827, 255–265. [Google Scholar] [CrossRef] [PubMed] [Green Version]
- Hu, Q.; Miyashita, H.; Iwasaki, I.; Kurano, N.; Miyachi, S.; Iwaki, M.; Itoh, S. A photosystem I reaction center driven by chlorophyll d in oxygenic photosynthesis. Proc. Natl. Acad. Sci. USA 1998, 95, 13319–13323. [Google Scholar] [CrossRef] [PubMed] [Green Version]
- Larkum, A.W.D.; Chen, M.; Li, Y.; Schliep, M.; Trampe, E.; West, J.; Salih, A.; Kühl, M. A novel epiphytic Chlorophyll d-containing cyanobacterium isolated from a mangrove-associated red alga. J. Phycol. 2012, 48, 1320–1327. [Google Scholar] [CrossRef]
- Mohr, R.; Voss, B.; Schliep, M.; Kurz, T.; Maldener, I.; Adams, D.G.; Larkum, A.D.W.; Chen, M.; Hess, W.R. A new chlorophyll d-containing cyanobacterium: Evidence for niche adaptation in the genus Acaryochloris. ISME J. 2010, 4, 1456–1469. [Google Scholar] [CrossRef] [PubMed] [Green Version]
- Murakami, A.; Miyashita, H.; Iseki, M.; Adachi, K.; Mimuro, M. Chlorophyll d in an epiphytic cyanobacterium of red algae. Science 2004, 303, 1633. [Google Scholar] [CrossRef]
- Miller, S.R.; Augustine, S.; Le Olson, T.; Blankenship, R.E.; Selker, J.; Wood, A.M. Discovery of a free-living chlorophyll d-producing cyanobacterium with a hybrid proteobacterial/cyanobacterial small-subunit rRNA gene. Proc. Natl. Acad. Sci. USA 2005, 102, 850–855. [Google Scholar] [CrossRef] [Green Version]
- Chen, M.; Schliep, M.; Willows, R.D.; Cai, Z.L.; Neilan, B.A.; Scheer, H. A Red-Shifted Chlorophyll. Science 2010, 329, 1318–1319. [Google Scholar] [CrossRef]
- Gan, F.; Zhang, S.; Rockwell, N.C.; Martin, S.S.; Lagarias, J.C.; Bryant, D.A. Extensive remodeling of a cyanobacterial photosynthetic apparatus in far-red light. Science 2014, 345, 1312–1317. [Google Scholar] [CrossRef] [Green Version]
- Ho, M.Y.; Gan, F.; Shen, G.Z.; Bryant, D.A. Far-red light photoacclimation (FaRLiP) in Synechococcus sp PCC 7335. II. Characterization of phycobiliproteins produced during acclimation to far-red light. Photosynth. Res. 2017, 131, 187–202. [Google Scholar] [CrossRef]
- Ho, M.Y.; Gan, F.; Shen, G.Z.; Zhao, C.; Bryant, D.A. Far-red light photoacclimation (FaRLiP) in Synechococcus sp PCC 7335: I. Regulation of FaRLiP gene expression. Photosynth. Res. 2017, 131, 173–186. [Google Scholar] [CrossRef]
- Wolf, B.M.; Niedzwiedzki, D.M.; Magdaong, N.C.M.; Roth, R.; Goodenough, U.; Blankenship, R.E. Characterization of a newly isolated freshwater Eustigmatophyte alga capable of utilizing far-red light as its sole light source. Photosynth. Res. 2018, 135, 177–189. [Google Scholar] [CrossRef] [PubMed]
- Larkum, A.W.D.; Kuhl, M. Chlorophyll d: The puzzle resolved. Trends Plant Sci. 2005, 10, 355–357. [Google Scholar] [CrossRef] [PubMed]
- Mehda, S.; Muñoz-Martín, M.Á.; Oustani, M.; Hamdi-Aïssa, B.; Perona, E.; Mateo, P. Microenvironmental conditions drive the differential cyanobacterial community composition of biocrusts from the sahara desert. Microorganisms 2021, 9, 487. [Google Scholar] [CrossRef] [PubMed]
- Ulrich, N.J.; Uchida, H.; Kanesaki, Y.; Hirose, E.; Murakami, A.; Miller, S.R. Reacquisition of light-harvesting genes in a marine cyanobacterium confers a broader solar niche. Curr. Biol. 2021, 31, 1539–1546.e4. [Google Scholar] [CrossRef] [PubMed]
- Swingley, W.D.; Chen, M.; Cheung, P.C.; Conrad, A.L.; Dejesa, L.C.; Hao, J.; Honchak, B.M.; Karbach, L.E.; Kurdoglu, A.; Lahiri, S.; et al. Niche adaptation and genome expansion in the chlorophyll d-producing cyanobacterium Acaryochloris marina. Proc. Natl. Acad. Sci. USA 2008, 105, 2005–2010. [Google Scholar] [CrossRef] [Green Version]
- Swingley, W.D.; Hohmann-Marriott, M.F.; Le Olson, T.; Blankenship, R.E. Effect of iron on growth and ultrastructure of Acaryochloris marina. Appl. Environ. Microbiol. 2005, 71, 8606–8610. [Google Scholar] [CrossRef] [Green Version]
- Chen, M.; Quinnell, R.G.; Larkum, A.W.D. Chlorophyll d as the major photopigment in Acaryochloris marina. J. Porphyr. Phthalocyanines 2002, 6, 763–773. [Google Scholar] [CrossRef]
- Guillard, R.R.L.; Ryther, J.H. Studies on marine planktonic diatoms I. Cyclotella nana hustedt and detonula confervacea (Cleve) Gran. Can. J. Microbiol. 1962, 8, 229–239. [Google Scholar] [CrossRef]
- Hedges, J.I.; Baldock, J.A.; Gélinas, Y.; Lee, C.; Peterson, M.L.; Wakeham, S.G. The biochemical and elemental compositions of marine plankton: A NMR perspective. Mar. Chem. 2002, 78, 47–63. [Google Scholar] [CrossRef]
- Li, Y.; Scales, N.; Blankenship, R.E.; Willows, R.D.; Chen, M. Extinction coefficient for red-shifted chlorophylls: Chlorophyll d and chlorophyll f. Biochim. Biophys. Acta (BBA)-Bioenerg. 2012, 1817, 1292–1298. [Google Scholar] [CrossRef] [Green Version]
- Jeffrey, S.W.; Humphrey, G.F. New spectrophotometric equations for determining chlorophylls A, B, C1 and C2 in higher-plants, algae and natural phytoplankton. Biochem. Physiol. Pflanz. 1975, 167, 191–194. [Google Scholar] [CrossRef]
- Switzer Blum, J.; Burns Bindi, A.; Buzzelli, J.; Stolz, J.F.; Oremland, R.S. Bacillus arsenicoselenatis, sp. nov., and Bacillus selenitireducens, sp. nov.: Two haloalkaliphiles from Mono Lake, California that respire oxyanions of selenium and arsenic. Arch. Microbiol. 1998, 171, 19–30. [Google Scholar] [CrossRef] [PubMed]
- Kolmogorov, M.; Yuan, J.; Lin, Y.; Pevzner, P.A. Assembly of long, error-prone reads using repeat graphs. Nat. Biotechnol. 2019, 37, 540–546. [Google Scholar] [CrossRef] [PubMed]
- Hyatt, D.; Chen, G.-L.; LoCascio, P.F.; Land, M.L.; Larimer, F.W.; Hauser, L.J. Prodigal: Prokaryotic gene recognition and translation initiation site identification. BMC Bioinform. 2010, 11, 119. [Google Scholar] [CrossRef] [Green Version]
- Altschul, S.F.; Gish, W.; Miller, W.; Myers, E.W.; Lipman, D.J. Basic local alignment search tool. J. Mol. Biol. 1990, 215, 403–410. [Google Scholar] [CrossRef]
- Walker, B.; Abeel, T.; Shea, T.; Priest, M.; Abouelliel, A.; Sakthikumar, S.; Cuomo, C.A.; Zeng, Q.; Wortman, J.; Young, S.K.; et al. Pilon: An integrated tool for comprehensive microbial variant detection and genome assembly improvement. PLoS ONE 2014, 9, e112963. [Google Scholar] [CrossRef]
- Li, H.W. Aligning sequence reads, clone sequences and assembly contigs with BWA-MEM. arXiv 2013, arXiv:1303.3997. [Google Scholar]
- Danecek, P.; Bonfield, J.K.; Liddle, J.; Marshall, J.; Ohan, V.; Pollard, M.O.; Whitwham, A.; Keane, T.; McCarthy, S.A.; Davies, R.M.; et al. Twelve years of SAMtools and BCFtools. GigaScience 2021, 10. [Google Scholar] [CrossRef]
- Xie, Z.; Tang, H. ISEScan: Automated identification of insertion sequence elements in prokaryotic genomes. Bioinformatics 2017, 33, 3340–3347. [Google Scholar] [CrossRef]
- Russel, J.; Pinilla-Redondo, R.; Mayo-Muñoz, D.; Shah, S.A.; Sørensen, S.J. CRISPRCasTyper: Automated identification, annotation, and classification of CRISPR-Cas loci. CRISPR J. 2020, 3, 462–469. [Google Scholar] [CrossRef]
- Grant, J.R.; Arantes, A.S.; Stothard, P. Comparing thousands of circular genomes using the CGView comparison tool. BMC Genom. 2012, 13, 202. [Google Scholar] [CrossRef] [Green Version]
- Carver, T.J.; Rutherford, K.M.; Berriman, M.; Rajandream, M.-A.; Barrell, B.G.; Parkhill, J. ACT: The Artemis comparison tool. Bioinformatics 2005, 21, 3422–3423. [Google Scholar] [CrossRef] [PubMed] [Green Version]
- Sivakumar, V.; Wang, R.L.; Hastings, G. Photo-oxidation of P740, the primary electron donor in photosystem I from Acaryochloris marina. Biophys. J. 2003, 85, 3162–3172. [Google Scholar] [CrossRef] [Green Version]
- Tomo, T.; Kato, Y.; Suzuki, T.; Akimoto, S.; Okubo, T.; Noguchi, T.; Hasegawa, K.; Tsuchiya, T.; Tanaka, K.; Fukuya, M.; et al. Characterization of highly purified photosystem I complexes from the chlorophyll d-dominated cyanobacterium Acaryochloris marina MBIC 11017. J. Biol. Chem. 2008, 283, 18198–18209. [Google Scholar] [CrossRef] [PubMed] [Green Version]
- Akiyama, M.; Miyashita, H.; Kise, H.; Watanabe, T.; Mimuro, M.; Miyachi, S.; Kobayashi, M. Quest for minor but key chlorophyll molecules in photosynthetic reaction centers-unusual pigment composition in the reaction centers of the chlorophyll d-dominated cyanobacterium Acaryochloris marina. Photosynth. Res. 2002, 74, 97–107. [Google Scholar] [CrossRef]
- Akiyama, M.; Miyashita, H.; Kise, H.; Watanabe, T.; Miyachi, S.; Kobayashi, M. Detection of chlorophyll d’ and pheophytin a in a chlorophyll d-dominating oxygenic photosynthetic prokaryote Acaryochloris marina. Anal. Sci. 2001, 17, 205–208. [Google Scholar] [CrossRef] [Green Version]
- Stolz, J. Bacterial Intracellular Membranes. In eLS; John Wiley & Sons, Inc: Hoboken, NJ, USA, 2020; pp. 1–7. [Google Scholar] [CrossRef]
- Miller, S.R.; Wood, A.M.; Blankenship, R.E.; Kim, M.; Ferriera, S. Dynamics of gene duplication in the genomes of chlorophyll d-producing cyanobacteria: Implications for the ecological niche. Genome Biol. Evol. 2011, 3, 601–613. [Google Scholar] [CrossRef] [Green Version]
- Partensky, F.; Six, C.; Ratin, M.; Garczarek, L.; Vaulot, D.; Probert, I.; Calteau, A.; Gourvil, P.; Marie, D.; Grebert, T.; et al. A novel species of the marine cyanobacterium Acaryochloris with a unique pigment content and lifestyle. Sci. Rep. 2018, 8, 9142. [Google Scholar] [CrossRef] [Green Version]
- Cai, F.; Axen, S.D.; Kerfeld, C.A. Evidence for the widespread distribution of CRISPR-Cas system in the phylum cyanobacteria. RNA Biol. 2013, 10, 687–693. [Google Scholar] [CrossRef] [Green Version]
- Waterworth, S.C.; Isemonger, E.W.; Rees, E.R.; Dorrington, R.A.; Kwan, J.C. Conserved bacterial genomes from two geographically isolated peritidal stromatolite formations shed light on potential functional guilds. Environ. Microbiol. Rep. 2021, 13, 126–137. [Google Scholar] [CrossRef]
- Emms, D.M.; Kelly, S. OrthoFinder: Solving fundamental biases in whole genome comparisons dramatically improves orthogroup inference accuracy. Genome Biol. 2015, 16, 157. [Google Scholar] [CrossRef] [PubMed] [Green Version]
- Li, Z.K.; Yin, Y.C.; Zhang, L.D.; Zhang, Z.C.; Dai, G.Z.; Chen, M.; Qiu, B.S. The identification of IsiA proteins binding chlorophyll d in the cyanobacterium Acaryochloris marina. Photosynth. Res. 2018, 135, 165–175. [Google Scholar] [CrossRef] [PubMed]
- Duxbury, Z.; Schliep, M.; Ritchie, R.J.; Larkum, A.W.D.; Chen, M. Chromatic photoacclimation extends utilisable photosynthetically active radiation in the chlorophyll d-containing cyanobacterium, Acaryochloris marina. Photosynth. Res. 2009, 101, 69–75. [Google Scholar] [CrossRef] [PubMed]
- Chan, Y.W.; Nenninger, A.; Clokie, S.J.H.; Mann, N.H.; Scanlan, D.J.; Whitworth, A.L.; Clokie, M.R.J. Pigment composition and adaptation in free-living and symbiotic strains of Acaryochloris marina. FEMS Microbiol. Ecol. 2007, 61, 65–73. [Google Scholar] [CrossRef] [Green Version]
- Chen, M.; Floetenmeyer, M.; Bibby, T.S. Supramolecular organization of phycobiliproteins in the chlorophyll d-containing cyanobacterium Acaryochloris marina. FEBS Lett. 2009, 583, 2535–2539. [Google Scholar] [CrossRef] [Green Version]
- Hu, Q.; Marquardt, J.; Iwasaki, I.; Miyashita, H.; Kurano, N.; Morschel, E.; Miyachi, S. Molecular structure, localization and function of biliproteins in the chlorophyll a/d containing oxygenic photosynthetic prokaryote Acaryochloris marina. Biochim. Biophys. Acta-Bioenerg. 1999, 1412, 250–261. [Google Scholar] [CrossRef] [Green Version]
- Kashimoto, T.; Miyake, K.; Sato, M.; Maeda, K.; Matsumoto, C.; Ikeuchi, M.; Toyooka, K.; Watanabe, S.; Kanesaki, Y.; Narikawa, R. Acclimation process of the chlorophyll d-bearing cyanobacterium Acaryochloris marina to an orange light environment revealed by transcriptomic analysis and electron microscopic observation. J. Gen. Appl. Microbiol. 2020, 66, 106–115. [Google Scholar] [CrossRef] [Green Version]
- Loughlin, P.; Lin, Y.K.; Chen, M. Chlorophyll d and Acaryochloris marina: Current status. Photosynth. Res. 2013, 116, 277–293. [Google Scholar] [CrossRef]
- Marquardt, J.; Mörschel, E.; Rhiel, E.; Westermann, M. Ultrastructure of Acaryochloris marina, an oxyphotobacterium containing mainly chlorophyll d. Arch. Microbiol. 2000, 174, 181–188. [Google Scholar] [CrossRef]
- Zhang, Z.-C.; Li, Z.-K.; Yin, Y.-C.; Li, Y.; Jia, Y.; Chen, M.; Qiu, B.-S. Widespread occurrence and unexpected diversity of red-shifted chlorophyll producing cyanobacteria in humid subtropical forest ecosystems. Environ. Microbiol. 2019, 21, 1497–1510. [Google Scholar] [CrossRef]
- Harrison, P.; Kim, N.; Young, J.P. Introducing the bacterial ‘chromid’: Not a chromosome, not a plasmid. Trends Microbiol. 2010, 18, 141–148. [Google Scholar] [CrossRef] [PubMed]
- diCenzo, G.C.; Mengoni, A.; Perrin, E. Chromids aid genome expansion and functional diversification in the family burkholderiaceae. Mol. Biol. Evol. 2019, 36, 562–574. [Google Scholar] [CrossRef] [PubMed]
- Hulter, N.; Ilhan, J.; Wein, T.; Kadibalban, A.S.; Hammerschmidt, K.; Dagan, T. An evolutionary perspective on plasmid lifestyle modes. Curr. Opin. Microbiol. 2017, 38, 74–80. [Google Scholar] [CrossRef]
- Miller, S.R.; Abresch, H.E.; Ulrich, N.J.; Sano, E.B.; Demaree, A.H.; Oman, A.R.; Garber, A.I. Bacterial adaptation by a transposition burst of an invading IS element. Genome Biol. Evol. 2021, 13, evab245. [Google Scholar] [CrossRef] [PubMed]


| Sample No. | Species | Algae Color Class | c-Culture p-Pigment |
|---|---|---|---|
| A-1 | Plocamium pacificum | red | |
| A-2 | Erythrophyllum delesserioides | red | |
| A-3 | Microcladia coulteri | red | |
| A-4 | Desmarestia herbacea | brown | |
| A-5 | Costaria costata | brown | |
| A-6 | Prionitis sternbergii | red | C |
| A-7 | Farlowia compressa | red | |
| A-8 | Cryptopleura lobulifera | red | |
| A-9 | Neorhodomela larix | red | |
| A-10 | * Osmundea spectabilis | red | C |
| A-11 | * Neogastroclonium subarticulatum | red | C |
| A-12 | Erythrophyllum delesseroides | red | C |
| A-14 | Savoiea bipinnata | red | C |
| A-15 | Sarcodiotheca gaudichaudii | red | C |
| A-16 | Cryptopleura ruprechtiana | red | C |
| A-17 | Chondracanthus canaliculatus | red | C |
| A-18 | * Chondracanthus canaliculatus | red | C |
| A-19 | * Stephanocystis osmundacea | brown | p, c |
| A-20 | Ptilota densa | red | C |
| A-21 | Cryptopleura ruprechtiana | red | C |
| A-22 | Chondracanthus exasperatus | red | |
| A-23 | Gelidium coulteri | red | C |
| A-24 | Mazzaella flaccida | red | |
| A-25 | Mazzaella splendens | red | C |
| A-26 | Pikea californica | red | C |
| A-27 | Mastocarpus jardinii | red | C |
| Genome | pMB01 | pMB02 | pMB03 | pMB04 | pMB05 | pMB06 | pMB07 | pMB08 | pMB09 | pMB10 | |
|---|---|---|---|---|---|---|---|---|---|---|---|
| Genome size | 5,709,274 | 394,275 | 276,907 | 187,211 | 180,652 | 148,788 | 140,525 | 93,257 | 89,712 | 27,872 | 16,256 |
| G+C content | 47.01 | 45.67 | 46.16 | 46.61 | 46.32 | 45.52 | 45.52 | 44.53 | 44.34 | 42.33 | 42.14 |
| Open reading frames | 4589 | 311 | 212 | 155 | 143 | 128 | 114 | 73 | 81 | 25 | 12 |
| Number conserved hypothetical | 1075 | 143 | 63 | 75 | 81 | 71 | 77 | 41 | 53 | 17 | 5 |
| Coding density | 84.24 | 81.93 | 83.43 | 81.80 | 84.78 | 80.77 | 77.37 | 78.64 | 75.72 | 67.95 | 63.40 |
| Average gene length | 931 | 867 | 849 | 859 | 969 | 828 | 755 | 733 | 799 | 676 | 736 |
| Ribosomal RNAs | 6 | 0 | 0 | 0 | 0 | 0 | 0 | 0 | 0 | 0 | 0 |
| Transfer RNAs | 65 | 0 | 0 | 0 | 0 | 0 | 0 | 0 | 0 | 0 | 0 |
| Pseudogenes | 502 | 57 | 60 | 23 | 15 | 17 | 30 | 27 | 4 | 3 | 2 |
| Insertion elements | 150 | 40 | 39 | 9 | 6 | 12 | 12 | 23 | 3 | 1 | 1 |
| Copy number (approximate) | 1 | 1 | 1 | 1 | 1 | 1 | 1 | 1 | 1 | 1 | 1 |
| Genome A | Genes in A | Genome B | Genes in B | Mean AAI (%) |
|---|---|---|---|---|
| Moss Beach | 6583 | S15 | 6307 | 97.6 |
| Moss Beach | 6583 | CCMEE 5410 | 7493 | 89.1 |
| Moss Beach | 6583 | MBIC11017 | 7495 | 88.9 |
| Moss Beach | 6583 | SU_5_25 | 2261 | 76.4 |
| Moss Beach | 6583 | CRU_2_0 | 4206 | 75.5 |
| Moss Beach | 6583 | RU_4_1 | 4566 | 75.4 |
| Moss Beach | 6583 | RCC1774 | 5531 | 65.8 |
Publisher’s Note: MDPI stays neutral with regard to jurisdictional claims in published maps and institutional affiliations. |
© 2022 by the authors. Licensee MDPI, Basel, Switzerland. This article is an open access article distributed under the terms and conditions of the Creative Commons Attribution (CC BY) license (https://creativecommons.org/licenses/by/4.0/).
Share and Cite
Kiang, N.Y.; Swingley, W.D.; Gautam, D.; Broddrick, J.T.; Repeta, D.J.; Stolz, J.F.; Blankenship, R.E.; Wolf, B.M.; Detweiler, A.M.; Miller, K.A.; et al. Discovery of Chlorophyll d: Isolation and Characterization of a Far-Red Cyanobacterium from the Original Site of Manning and Strain (1943) at Moss Beach, California. Microorganisms 2022, 10, 819. https://doi.org/10.3390/microorganisms10040819
Kiang NY, Swingley WD, Gautam D, Broddrick JT, Repeta DJ, Stolz JF, Blankenship RE, Wolf BM, Detweiler AM, Miller KA, et al. Discovery of Chlorophyll d: Isolation and Characterization of a Far-Red Cyanobacterium from the Original Site of Manning and Strain (1943) at Moss Beach, California. Microorganisms. 2022; 10(4):819. https://doi.org/10.3390/microorganisms10040819
Chicago/Turabian StyleKiang, Nancy Y., Wesley D. Swingley, Dikshyant Gautam, Jared T. Broddrick, Daniel J. Repeta, John F. Stolz, Robert E. Blankenship, Benjamin M. Wolf, Angela M. Detweiler, Kathy Ann Miller, and et al. 2022. "Discovery of Chlorophyll d: Isolation and Characterization of a Far-Red Cyanobacterium from the Original Site of Manning and Strain (1943) at Moss Beach, California" Microorganisms 10, no. 4: 819. https://doi.org/10.3390/microorganisms10040819