Incorporating Established Conservation Networks into Freshwater Conservation Planning Results in More Workable Prioritizations
 Nicholas A. Sievert
 Craig P. Paukert
 Joanna B. Whittier
- 1Missouri Cooperative Fish and Wildlife Research Unit, School of Natural Resources, University of Missouri, Columbia, MO, United States
- 2U.S. Geological Survey, Missouri Cooperative Fish and Wildlife Research Unit, School of Natural Resources, University of Missouri, Columbia, MO, United States
- 3School of Natural Resources, University of Missouri, Columbia, MO, United States
Resources for addressing stream fish conservation issues are often limited and the stressors impacting fish continue to increase, so decision makers often rely on tools to prioritize locations for conservation actions. Because conservation networks already exist in many areas, incorporating these into the planning process can increase the ability of decision makers to carry out management actions. In this study we aim to identify priority areas within established networks to provide an approach which allows managers to focus efforts on the most valuable areas they control, while identifying areas outside of the network, which support species with minimal representation within the network, for acquisition or conservation partnerships. The goal of this approach is to prioritize sites to achieve high levels of species representation while also developing workable solutions. We applied a methodology incorporating established networks into a systematic conservation planning process for fish in temperate wadeable streams located in Missouri, USA. We compared how well species were represented in our approach with two commonly used alternatives: A blank slate approach which used the same systematic conservation planning technique but did not incorporate established networks, and a habitat integrity approach based solely on anthropogenic threat data. Relative to the blank slate approach, our approach required 210% more segments for representation of all species, and contained an average of 0.5 additional occurrences for the least well-represented species. Although the blank slate solution was more efficient in achieving species representation, 77% of segments in this solution were not already protected. This would likely pose a challenge for implementing conservation actions. Relative to habitat integrity-based priorities, our approach required only 38% of the number of stream segments to achieve representation of all species and contained an average of 5 additional occurrences of the least represented species, representing a substantial gain in representation. Incorporating established networks may allow managers to focus resources on areas with the greatest conservation value within established networks and to identify the most valuable areas complementary to the established networks, resulting in priorities which may be more actionable and effective than those developed by alternative approaches.
Introduction
Conservation networks are important for the protection of increasingly imperiled stream fish communities (Saunders et al., 2002; Abell et al., 2007; Nel et al., 2009b; Arthington et al., 2016; Hermoso et al., 2016; Thieme et al., 2016). Habitat degradation, invasive species, flow alteration and climate change are expected to contribute to future declines of stream fish (Dudgeon et al., 2006). Conservation plans are important for the protection of biodiversity from these threats and have been developed to protect the current suite of species or communities, often through reserves or protected areas (Saunders et al., 2002; Abell et al., 2007; Nel et al., 2011b; Arthington et al., 2016; Jones et al., 2016; Bicknell et al., 2017). Resources for the establishment and management of reserves and protected areas are often limited; therefore, it is important to make scientifically informed decisions to achieve the greatest conservation outcomes for aquatic biodiversity (Thieme et al., 2012; Hermoso et al., 2016; Maire et al., 2016).
Effective conservation planning depends on the consideration of both biodiversity and the amount of resources available for protection, management, and research to meet goals (Linke et al., 2011). Historically, many conservation efforts have been aimed at protecting sites with minimal levels of anthropogenic impacts either locally or in their watersheds (Pressey et al., 1993; Margules and Pressey, 2000). Conservation plans for freshwater ecosystems have more recently centered on the development of spatial networks supporting a targeted set of species or features. Because resources for conservation are often limited, these plans also try to minimize cost by focusing on the complementarity (combined ability of set of sites to represent a suite of biodiversity features) of selected sites (Nel et al., 2009b). A variety of strategies and tools have been developed for creating conservation plans that emphasize complementarity and have been applied to a range of conservation planning efforts (Moilanen et al., 2009; Linke et al., 2011).
In freshwater stream systems, systematic conservation planning tools often have been used to design conservation networks or develop sets of priorities without consideration of any established conservation networks (i.e., Blank slate approach; Sowa et al., 2007; Leathwick et al., 2010; Strecker et al., 2011; Stewart et al., 2017; VanCompernolle et al., 2019). However, conservation networks may already have been established (e.g., state and federal wildlife management areas, refuges, and parks), and decision makers sometimes lack the flexibility or resources to start with a blank slate to create new conservation networks or priority areas. The implementation of conservation plans can present substantial challenges to practitioners as the majority of published conservation assessments do not result in conservation actions (Knight et al., 2008). Incorporating established conservation networks into the conservation planning process is gaining popularity in freshwater systems (Nel et al., 2009a; Esselman and Allan, 2011; Esselman et al., 2012; Hermoso et al., 2015a; Grantham et al., 2016; Howard et al., 2018; Linke et al., 2019; Jézéquel et al., 2020), however comparisons of these approaches to other frameworks are limited. This study expands on previous efforts by evaluating how the results derived from a prioritization which accounts for established conservation networks compares to two alternative approaches, one which does not incorporate established conservation networks (Blank slate approach) and another which relies on habitat integrity rather than species representation (Human threat index approach). In areas where conservation networks have already been established, evaluation and prioritization techniques which account for already established conservation networks may constitute a more feasible approach, and increase the likelihood that the results will be put to use by decision-makers by allowing them to work within the constraints of existing infrastructure (Esselman and Allan, 2011).
Management of established conservation networks can benefit from the prioritization of sites both within and complementary to the network. Due to the large size of many networks, and the frequent presence of competing uses, many conservation networks cannot be entirely managed for the purpose of freshwater conservation. Identifying the most critical areas within the network can facilitate conservation by prioritizing the allocation of limited resources to the areas most likely to have the greatest returns for conservation (Iojaa et al., 2010; Watson et al., 2014; Maire et al., 2016). Prioritizing areas outside of the network is also important, particularly since species sometimes lack representation within established networks (Rodrigues et al., 2004; Nel et al., 2007; Hermoso et al., 2015b; Jenkins et al., 2015; Raghavan et al., 2016; Cooper et al., 2019). Conservation networks are sometimes expanded (Jenkins and Joppa, 2009), and targeting locations for expansion which complement already protected lands is a valuable way for rare and underrepresented species to gain protection (Nel et al., 2009a).
The primary aim of this study was to evaluate the performance of a freshwater conservation plan which incorporated established conservation networks into the planning process relative to two alternative approaches to conservation planning (Blank slate; Habitat integrity). The results of these comparisons can be used to aid decision-makers in selecting what may be the most appropriate approach to take in a given situation.
Materials and Methods
Study Area and Data Sources
Wadeable stream segments (confluence to confluence sections), classified as 2nd−5th order and perennial, throughout Missouri, USA (Abbitt et al., 2004) were the focus of this research. The state of Missouri is comprised of three ecologically unique aquatic subregions: Central Plains, Ozarks, and Mississippi Alluvial Basin (MAB) (Sowa et al., 2007). The Central Plains is primarily composed of open grassland and agricultural land use (78% percent of landuse, Blodgett and Lea, 2005) with low gradient streams with high turbidity and fine silt and sand substrates. The Ozarks are primarily forested (51.4% percent of landuse, Blodgett and Lea, 2005), with high relief and rugged terrain resulting in streams with higher gradients with gravel, cobble, or bedrock as dominant channel substrates. The MAB is dominated by agriculture (83% percent of landuse, Blodgett and Lea, 2005) with low relief and streams are predominately low gradient, highly channelized, and have fine silt substrates. These aquatic subregions are subdivided into watersheds with shared physiographic characteristics, and are presumed to correspond to distinct fish communities (ecological drainage units, EDU; Sowa et al., 2007). The drainage unit boundaries were used to summarize species occurrences.
Prioritization was conducted with consideration of a network of traditional protected areas (TPA) in Missouri, USA. The TPA network was comprised of both public lands (e.g., state conservation areas, U.S. Fish and Wildlife Service Refuges, U.S. Forest Service Lands, and others), and private lands (e.g., Wetlands Reserve Program, The Nature Conservancy Preserves, Ozark Regional Land Trust, and others), which are managed with a primary purpose of wildlife conservation (Hoskins, 2005; Missouri Department of Conservation, 2005). In Missouri, there are 3,943 TPA units encompassing 13,183 km2 (~7% of the state's area) and 2,590 km (~6.5%) of wadeable stream length (Abbitt et al., 2004; Figg, 2011).
Fish community data were provided by Missouri Department of Conservation and included data collected from wadeable streams from 1990 to 2011 having at least 0.5 h of sampling effort using seines and electrofishing. All 769 samples from 1990 to 1999 represented community sampling efforts by Missouri Department of Conservation; while all 1,107 from 2000 to 2011 were sampled using standard procedures (electrofishing and seining within a reach bounded by block nets) as part of the Resource Assessment and Monitoring (RAM) program (Fischer and Combes, 2003; Sievert et al., 2019; Paukert et al., 2020). Sites were selected for RAM sampling based on a stratified random approach, in which sites were randomly sampled within select drainages each year and the drainages being sampled were rotated on an annual basis (Fischer and Combes, 2003; Paukert et al., 2020). Additional occurrence locations of state listed species were included from the Missouri Natural Heritage Program database (651 records), which were collected between 1990 and 2011 from wadeable streams, were used as supplementary data for rare species (Sievert et al., 2019).
Twenty-seven environmental variables were used to predict the probability of species presence in each wadeable stream segment in Missouri. These included variables related to biogeography, stream features, local landscape, upstream landscape, and anthropogenic impacts to each confluence to confluence stream segment acquired from the Missouri Resource Assessment Partnership (Appendix 1 in Supplementary Material; Abbitt et al., 2004). These variables were selected based on known linkages to fish species distributions in Missouri and elsewhere (Sowa et al., 2007; Strecker et al., 2011). Multicollinearity was largely avoided in variable selection by only including variables with correlation coefficients < 0.75 except in specific cases where collinear variables were both identified as being ecologically relevant to the species being modeled (Appendix 2 in Supplementary Material). These variables included forested, agricultural, and grassland watershed landuse, and local riparian intact percentage in the Plains; forested, and grassland watershed land use, and local intact riparian percentage in the Ozarks (Snyder et al., 2003; Allan, 2004; Nislow, 2005; Diana et al., 2006; Stewart et al., 2007; Marshall et al., 2008; Lange et al., 2014).
Quantifying Species Representation
Species distribution models were developed to determine species representation in each permanent, wadeable stream segment in Missouri. We developed four separate component models for each species with a minimum of 40 occurrences using commonly used distribution modeling approaches including multivariate adaptive regression splines [MARS], generalized additive models [GAM], boosted regression trees [BRT], and random forest models [RFM]. There were not enough stream segments sampled (36) to generate distribution models for species in the MAB subregion. Because of both temporal variability in species abundance and the differences in habitat volume between small and large streams we conservatively used presence absence rather than abundance or other population metrics as our response variable for species distribution modeling. A suite of 27 environmental variables commonly used in freshwater fish distribution modeling were used as predictors (Appendix 1 in Supplementary Material). Distribution models were developed using R statistical software with the “earth” package (MARS; Milborrow, 2014), “gam” package (GAM; Hastie, 2014), “gbm” package (BRT; Ridgeway, 2013), and “randomForest” package (RFM; Liaw and Wiener, 2002). Models were developed using randomly selected subsets of 70% of the species occurrence data for training with the remaining 30% used for model evaluation. Each component model was evaluated using three metrics; area under the receiver operator characteristic (AUC), calculated using the “ROCR” package (Sing et al., 2013), model bias (Difference between predicted and observed occurrences expressed as a percentage), and model fit (Mean absolute error (MAE) of a calibration curve with 10% probability of occurrence bins). We created our final distribution models using an ensemble model based on the average predicted probability of species occurrence of all component models which met our predetermined minimum evaluation standards: AUC ≥ 0.6, bias of ± 25%, and MAE of ≤ 0.125.
Species representation within and complementary to Missouri's TPA network was assessed by determining the number of stream segments a species was predicted to occupy within each conservation network. Species occupancy was accounted for in two ways. For species with models meeting the modeling requirements listed above, the predicted probabilities of occurrence were used. Because rare and vulnerable species are often some of the most important targets of conservation action it was important that known occurrence locations and watersheds they are known to inhabit be included for the development of conservation priorities. This approach gives high priority to sites with known occurrences of rare species. Although this approach likely elevates the prioritization values for known sites above unknown sites, in an applied study this is an approach which may appeal to managers who wish to invest resources in conserving rare species in areas where they are known to occur. For species without acceptable models, an occurrence probability of 1 was assigned to stream segments where the species had been collected, while the proportion of sites a species occurred at within each ecological drainage unit was assigned to all other stream segments (Sievert et al., 2019). This allowed known occurrences of species to be included in the planning process for species which could not be modeled and allowed a low level of potential representation to be included in watersheds they were known to inhabit. The predicted number of occupied stream segments within Missouri's TPA network was calculated for each species by summing the probabilities of occurrence for all stream segments within the network (e.g., Species A has probabilities of occurrence at four sites of 0.75, 0, 0.75, and 0.25; summing these probabilities of occurrence predicts two occurrences for this species across the four sites).
Determining Conservation Value
Stream segments were prioritized based on a measure of relative conservation value using the conservation planning software, Zonation, version 3.1, following an approach which will be referred to as Freshwater Conservation Network Prioritization (FCNP; Figure 1). Conservation value rankings were based on species representation, weighted by species vulnerability, while accounting for upstream watershed integrity, and stratifying removal based on established conservation network (more details on each of these components in following paragraphs). Conservation values were calculated via core-area Zonation which iteratively removes stream segments while minimizing marginal loss to conservation value of the remaining network until all segments have been removed (Moilanen et al., 2012).
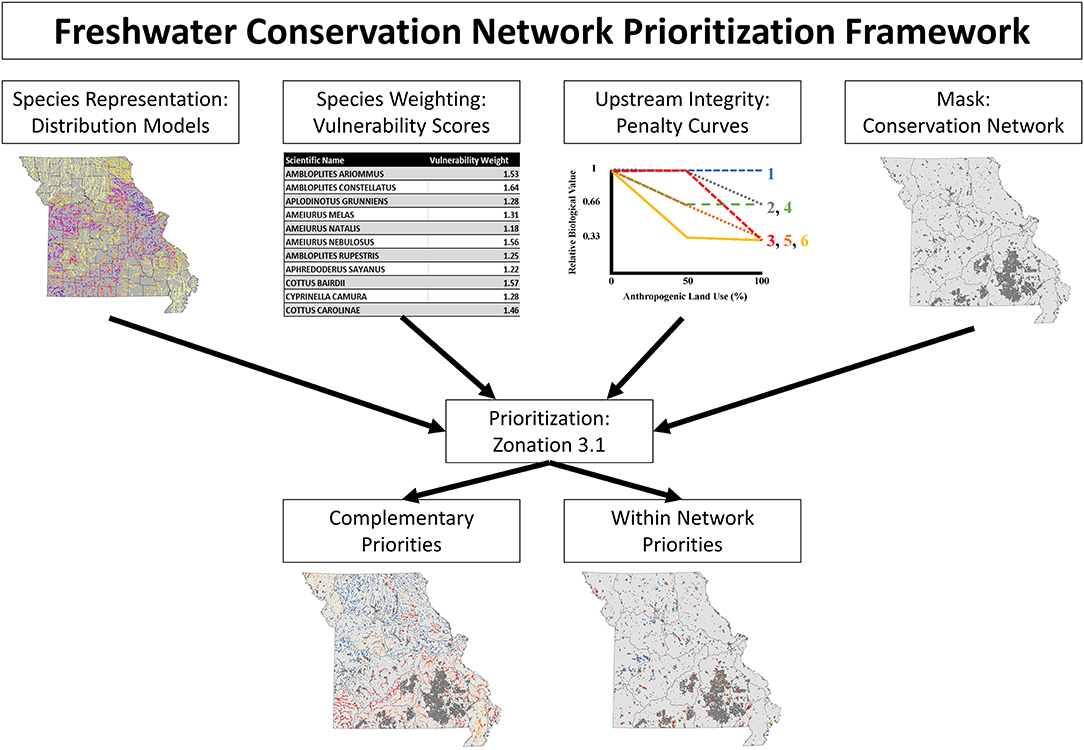
Figure 1. Schematic illustrating the Freshwater Conservation Network Prioritization framework. The top row illustrates the inputs which are fed into the conservation planning software, while the bottom row displays the results which are obtained.
Representation was weighted by species vulnerability to emphasize the selection of areas important for species in need of conservation. By implementing the weighting functionality of Zonation more vulnerable species gain additional representation at high priority levels proportional to their weight (a species with a weight of 2 will have occurrences retained at approximately twice the rate as would be retained if they had a weight of 1). Vulnerability weights ranged from 1 (lowest vulnerability score) to 2 (highest vulnerability score) based on scaled vulnerability scores {Weight = 1+(Species Vulnerability Score-Minimum Vulnerability Score)/(Maximum Vulnerability Score-Minimum Vulnerability Score)} from Sievert et al. (2016). These scores were taken from an assessment of a species vulnerability to habitat degradation, warming stream temperatures, and alterations to the flow regime while also considering a species dispersal ability, range size, rarity, and range-wide fragmentation (Sievert et al., 2016). By incorporating species weights based on their vulnerability, Zonation software emphasized the prioritization of sites with occurrences of highly weighted species retaining a proportionally larger percentage of those species' distributions at a given priority level.
The ability of species to persist was accounted for both through the predictions of distribution models of suitable habitat and by encouraging the protection of upstream watersheds in the prioritization process. To emphasize the protection of the upstream watershed for sensitive species we utilized a function of Zonation, the Neighborhood Quality Penalty, which penalizes the removal of upstream areas from a prioritization for species who are sensitive to upstream habitat degradation (Moilanen et al., 2008; Figure 2). Species-specific penalty curves were developed to account for the potential effect of habitat degradation of upstream segments on the local stream fish community. Penalty curves were created to represent the loss of value to downstream segments when an upstream segment was removed from the solution, potentially allowing the upstream watershed to become degraded. These penalty curves are based on observed decreases in species occurrence rates as levels of anthropogenic land use increase, where a sensitive species experiences a decrease in occurrence rates in areas with high levels of anthropogenic land use and tolerant species have stable occurrence rates across a range of anthropogenic land use. First each site was classified into one of three bins covering equal ranges of anthropogenic land use (Agricultural and Urban) in the watershed (Low 0–33%; Medium >33–66%; and High >66%; Figure 2). Next the occurrence rate for each species (with a minimum of 10 occurrences) was calculated for each habitat class within a species range by dividing the number of sites a species occurred at by the total number of sampled sites within that species range (Figure 2). For those rare species having <10 occurrences no penalty curves could be created, so no penalties were applied. Species ranges were defined as all sites within ecological drainage units where a species had at least one occurrence (Sowa et al., 2007). The relative biological value of each class, for each species, was determined by dividing the occurrence rate of each class by the occurrence rate of the low degradation class which served as a baseline (Figure 2). This identified the species that experienced declines in occurrence rates in the presence of anthropogenic habitat use. In order to create discrete penalty curves these values were rounded to the nearest value of 1 (no change in relative biological value), 0.66 (loss of 1/3 relative biological value), or 0.33 (loss of 2/3 relative biological value; Figure 2). The biological value cutoffs were determined by expert knowledge as suggested by Moilanen et al. (2008). Biological value was never allowed to be rounded below 0.33 in order to maintain some level of local value no matter how much of a segments upstream watershed was given a lower prioritization. The relative biological value for each species was calculated at each of the three habitat classes and plotted against anthropogenic land use percent. Following the calculations above each species values correspond directly with one of the 6 discrete penalty curves (Figure 2 [procedure], Appendix 3 in Supplementary Material [penalty curve assignments]). The relative biological value of the high anthropogenic habitat class was not allowed to exceed that of the medium anthropogenic class, when this occurred the value of the medium class was retained for the high class for purposes of assigning the correct penalty curve. These curves quantify species potential sensitivity to upstream habitat degradation by representing the relative change in the biological value of a stream segment based on the remaining proportion of its upstream watershed.
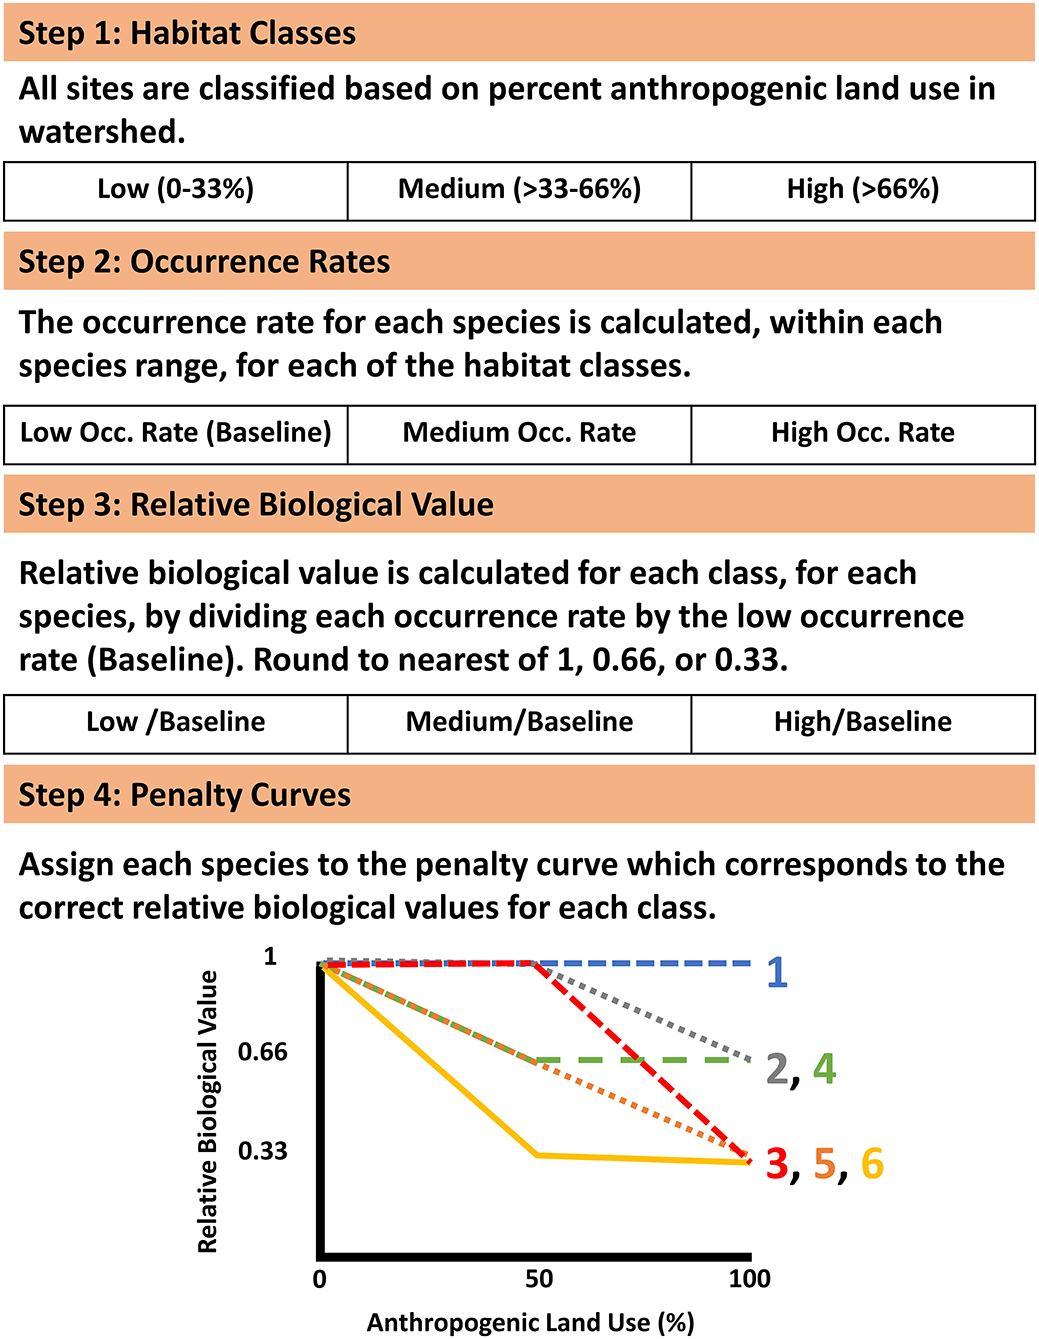
Figure 2. Framework used for developing upstream habitat integrity penalty curves. The penalty curve associated with each species can be found in Appendix 3 in Supplementary Material.
The established conservation network was used to stratify prioritization based on whether a segment is within or outside (complementary) of the protected area network. This was accomplished with the use of the removal mask feature of Zonation which constrained the initial removal to segments outside of the conservation network, once all complementary segments (segments outside of the network) were prioritized (removed); prioritization was allowed to proceed within the network. This creates a set of priorities in which the streams outside the network are ranked based on how well they complement what is represented within the network, while the streams within the network highlight the most and least valuable opportunities for conservation within protected areas.
Comparing Alternative Prioritization Methods
In addition to prioritization with the FCNP, we also conducted prioritizations using a blank slate approach which did not incorporate conservation networks into the planning process and used a set of priorities based on habitat integrity rather than species representation. The blank slate approach used all of the same inputs and settings as the FCNP except it did not use the masking feature which stratifies prioritization based on conservation network status. This created a prioritization where all stream segments are given equal consideration (no differentiation based on conservation network status) in prioritization. We also developed a third set of priorities based on human threat index (HTI) scores, which quantify stream health based on a suite of landscape level and local stressors where low values represent relatively low risk of degradation and high values represent high risk of habitat degradation (Sowa et al., 2007). To create our HTI prioritization, segments were ranked both within and complementary to the conservation network from lowest to highest HTI score. HTI priorities were developed with consideration of the established network by ranking from lowest HTI (highest conservation value) to highest HTI (lowest conservation value) within and complementary to the established network. The efficiency, or difference in representation of species, achieved by the alternative approaches was compared to the FCNP results to determine how well the framework performed. Additional metrics including the number of unrepresented species, the minimum species representation, and the average level of species representation were calculated based on the sum or average of the predicted occurrences for all segments at or above each priority level for each prioritization set (FCNP, HTI, and Blank slate). The proportion of species having greater representation based on the FCNP framework vs. the HTI and the blank slate approaches was calculated at two levels; high priority within the network (top 10% of segments) and high priority complementary areas (entire conservation network and top 10% of complementary segments). For the blank slate approach, we also calculated the number of unprotected stream segments to be added to create a new network of the same size as the established network. This allowed us to note the potential additional resources necessary to implement priorities with a blank slate approach.
Results
Quantifying Species Representation
Species distribution models were developed for 40 species in the Plains subregion, and 68 in the Ozarks subregion (Appendices 1, 3, 4 in Supplementary Material). All species with >40 occurrences, except Black Bullhead (Ameiurus melas) and Green Sunfish (Lepomis cyanellus) (both Plains models), had at least one of the four ensemble models meet minimum evaluation standards and were therefore represented via a species distribution model (Appendix 4 in Supplementary Material). All remaining species representations (44, 64, and 50 species for the Plains, Ozarks, and MAB respectively) had <40 occurrences within a subregion and were therefore classified based on occurrence locations and frequency of occurrence. More detailed information regarding the species distribution models can be found in Appendices 1 and 2 in Supplementary Material and in Sievert et al. (2019). All species were predicted to occur in at least 1 stream segment within the TPA network with seven species expected to be found in <10 stream segments (out of 4,010 segments). Ninety species were predicted to occupy >100 stream segments in the TPA network.
Determining Conservation Value
Statewide priorities developed using the FCNP framework for the TPA network revealed that high priority segments were distributed across the state but were most commonly found in areas with unique and diverse fish assemblages (Sievert et al., 2017, Appendix 5 in Supplementary Material). The greatest concentration of high-value complementary areas tends to be in the southwestern portion of the state, which has several unique species assemblages and a smaller proportion of the landscape within the TPA network. High priority areas within the TPA network tended to occur throughout the Ozarks where there are relatively unique assemblages among catchments, and also in species-rich basins in the Plains. The blank slate priorities mirrored the general patterns of the FCNP framework priorities with high-value areas concentrated in the Ozarks and scattered pockets of high-value areas in the Plains (Figure 3). High priority areas identified based on habitat alone (i.e., HTI) were concentrated in the central Ozarks similar to FCNP priorities, however the southwestern portion of the state had low values based on habitat integrity and high values based on FCNP, the MAB had very low values based on habitat integrity and intermediate to high values based on FCNP, and values in the Plains tended to be slightly higher according to HTI than FCNP (Figure 3).
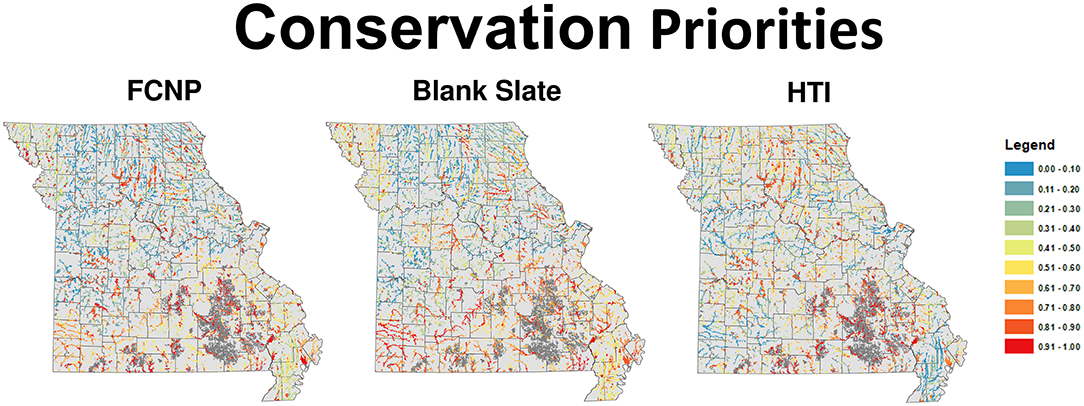
Figure 3. Conservation priority scores for all wadeable streams in Missouri USA for each of the three approaches used in this research. Scores range from 0 (least valuable) to 1 (most valuable). FCNP, Freshwater Conservation Network Prioritization, HTI, Human Threat Index.
Comparing Alternative Prioritization Methods
Efficiency analysis revealed substantial gaps in species representation between FCNP priorities and the HTI alternative prioritization. The number of segments to achieve representation of all species was ~2.6 times greater using the HTI approach compared to the FCNP approach (Figure 4A). The FCNP approach yielded a maximum of 51 more species represented at the same priority level as the HTI approach (Figure 4A; 133 species included in analysis). Across all priorities, the FCNP approach averaged five more occurrences for the species with the lowest level of representation (Figure 4B). The average number of additional occurrences, based on priorities established using the FCNP framework, for all species across all priorities, was 67 (Figure 4C). The majority of species (71%) achieved higher levels of representation based on FCNP priorities for the top 10% of segments within the conservation network and the entire network plus the top 10% of complementary segments.
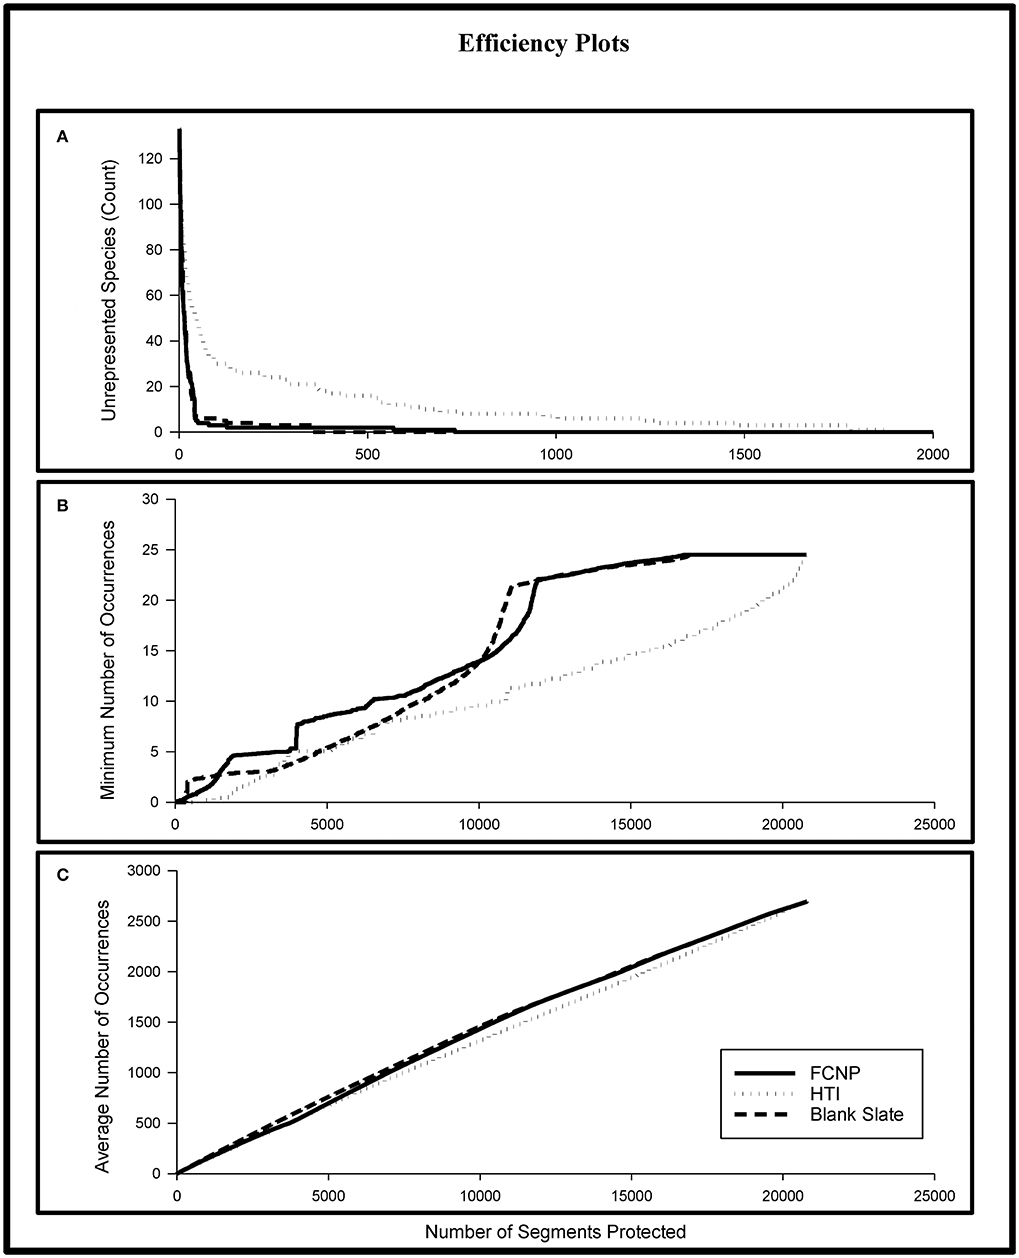
Figure 4. Differences in species representation for the FCNP, HTI, and Blank Slate prioritization approaches. Moving from left to right across the x-axis represents increasing levels of cumulative protection from only the highest priority stream segment (leftmost) to all stream segments (rightmost). (A) shows the number of species unrepresented; (B) shows the minimum level of representation; (C) shows the average level of representation. The steep increase in the minimum number of occurrences in (B) for the FCNP is due to the inclusion of high value complementary areas outside of the established network once all segments within the network have been included in the solution. FCNP, Freshwater Conservation Network Prioritization; HTI, Human Threat Index.
The blank slate approach will always represent the maximum efficiency in species representation (based on the inputs to the prioritization) because of the lack of constraint over the areas selected for inclusion in the solution, however that lack of constraint may lead to the selection of areas unavailable for conservation (i.e., private lands with landowners uninterested in engaging in conservation). On the other hand, the FCNP approach will necessarily achieve lower efficiency in representation than the blank slate approach due to the constraints on the inclusion of certain areas, but will create a solution that is compatible with established networks. Our analysis attempted to quantify the differences in both efficiency in representation and feasibility of carrying out the plan. The comparison of FCNP priorities to blank slate priorities revealed that creating a new network (of equal size to the TPA network) would require the addition of many currently unprotected segments for a relatively small gain in species representation. A blank slate network with the same number of segments as the established network would only have 23% of its segments within currently protected areas and would require the addition of 2,894 currently unprotected segments to duplicate the number of segments of the established network. There were relatively small differences in the efficiency of species representation between stream segments prioritized using the FCNP framework compared to the priorities established using a blank slate approach. The losses in the efficiency of species representation for the FCNP was relatively minor compared to the blank slate approach. The blank slate approach required 2.1 times fewer stream segments to achieve representation of all species, however both approaches had all but two species represented within the top 1% of sites (Figure 4A). The average number of unrepresented species across priorities established with the blank slate approach was nearly identical to the FCNP approach (average difference of 0.002 unrepresented species; Figure 4A). Across all priorities, the average of the minimum level of representation was slightly higher (0.5 occurrences) for the FCNP approach (Figure 4B). However, the blank slate approach achieved slightly higher average levels of species representation (21 occurrences; Figure 4C). The majority of species had higher levels of representation for the top 10% of segments within each network (62%) and the entire network plus the top 10% of complementary areas (71%) when priorities were established using the blank slate approach.
Discussion
This study examined the potential benefits and draw-backs of utilizing a prioritization approach which incorporates established conservation networks into the planning process (FCNP) with commonly used alternatives (Blank slate, HTI). Our results suggest that the FCNP approach provides actionable priorities for stream fish conservation over a broad spatial scale (State/Region, several hundreds of thousands of square kilometers). Incorporating established conservation areas resulted in more workable solutions, and incorporating species data rather than only anthropogenic threats resulted in better species representation,. Freshwater conservation planning often focuses on the development of priority areas through the use of a blank slate approach (Sowa et al., 2007; Strecker et al., 2011; Stewart et al., 2017; VanCompernolle et al., 2019), however recent work which incorporates established networks in conservation planning efforts represents a step forward in providing information to aid practitioners in converting planning into action (Nel et al., 2009a; Esselman and Allan, 2011; Esselman et al., 2012; Hermoso et al., 2015a; Grantham et al., 2016; Raghavan et al., 2016; Howard et al., 2018; Jézéquel et al., 2020). Our study provides a comparison between an approach which incorporates established networks into the planning process and two approaches which do not. This comparison represents a step forward by allowing researchers to evaluate some of the potential effects of selecting one approach over the other. Our results suggested that the implementation of a blank slate prioritization in Missouri would require the majority of conservation actions to occur on stream segments not currently protected (77% of a network of the same size as the current TPA are not protected), which is unlikely to be a workable solution for management agencies operating with limited resources (Naughton-Treves et al., 2005; Iojaa et al., 2010; Thieme et al., 2012). It is likely that in other states, ecoregions, or countries blank slate solutions would have limited overlap with established networks and the implementation of those prioritizations would be limited due to financial and logistical constraints. An approach which allows prioritization to account for areas already being protected and identify priority areas within and complementary to established networks, potentially allows for a more cost-effective, workable solution, than might be achieved with a blank slate approach, with a relatively small sacrifice in the efficiency of species representation (Esselman and Allan, 2011).
In many areas around the globe stream fishes are lacking representation within protected areas (Cooper et al., 2019). All 133 stream fish species found in wadeable streams in Missouri were predicted to be represented within the TPA network. However, protecting multiple areas to allow for redundancy in case of catastrophic declines and habitat changes due to climate change, invasive species, or anthropogenic disturbances may be needed to ensure species persistence (Stein et al., 2000). A lack of redundant coverage within protected areas suggests that long-term protection may be precarious for seven species predicted to occur within <10 protected stream segments. When possibilities for network expansion arise, targeting the complementary areas identified using FCNP approach may increase protection for underrepresented species and may improve the long-term outlook for those species, while bolstering the comprehensiveness of the established network.
Prioritization using the FCNP approach resulted in higher levels of efficiency (lower numbers of unrepresented species, higher minimum numbers of occurrence, and higher average numbers of occurrence across priority levels) in achieving species representation compared to an approach based on habitat integrity alone (HTI, Sowa et al., 2007). This suggests that using the FCNP approach for prioritizing conservation may result in substantial gains in the comprehensive protection of stream fish communities over a habitat only based approach. The use of the FCNP approach resulted in lower numbers of unrepresented species (and less stream segments needed to protect all species), higher minimum levels of representation, higher average levels of representation, and a majority of species with higher levels of representation at both high priority segments within the network and high priority complementary segments. Watershed level threat data are commonly used for identifying priority areas (Mattson and Angermeier, 2007; Sowa et al., 2007; Paukert et al., 2011; Terrado et al., 2016). These areas are often selected because they are pristine or have minimal anthropogenic impacts, or opportunistically because of lack of competing uses due to areas being rugged, isolated, or have limited economic value (Pressey et al., 1993; Margules and Pressey, 2000). Although these factors are important to consider, species with distributions in marginal habitats or close to anthropogenic development may be left out of high priority areas based on this approach. Landscape and habitat surrogates are both a useful alternative to representation based planning when sufficient data on species representation are not available (Trakhtenbrot and Kadmon, 2005) and a valuable piece of complementary information to better inform management. Ideally, representation-based and habitat or threat-based planning would both be used to capture both streams which would best protect a broad suite of species while also selecting areas with high quality habitat. Consideration of habitat integrity is often linked to selecting areas where species are likely to persist, however if these measures are not linked to the species being considered, their ability to inform management may be limited. Oftentimes species can persist and even thrive in degraded habitats if a species is not sensitive to the conditions resulting from the degradation (Morrow and Fischenich, 2000). If the primary objective is to ensure the adequate representation of all species, a systematic conservation planning approach which accounts for both species representation and likelihood of species persistence, through habitat models or protecting upstream watersheds, may be best suited to ensure adequate, long-term, species representation within high priority areas (Margules and Pressey, 2000; Linke et al., 2011).
While the blank slate approach provides the optimal solution in terms of the representation of species with consideration of the other constraints placed on the prioritization (vulnerability weighting, upstream integrity, etc.), it also creates a solution that may have limited utility given potential difficulties in protecting or managing lands which are not owned by the management agency or partner groups. In making this comparison, we aimed to assess the trade-off between loss of efficiency in species representation but gains in feasibility of implementation of the plan due to not requiring large-scale land acquisition or development of partnerships. The blank slate approach identified a set of priorities requiring the addition of many currently unprotected segments but achieved similar levels of efficiency of species representation. Implementing conservation plans based on blank slate approaches may be difficult due to limited resources to acquire land (Naughton-Treves et al., 2005; Iojaa et al., 2010; Thieme et al., 2012; Maire et al., 2016). Our results indicate that in Missouri over 75% of segments within blank slate priorities of equal size to the TPA network are currently outside of the established network, requiring acquisition of large amounts of land if a blank slate approach was to be implemented. The FCNP approach yielded similar numbers of unrepresented species across all priority levels (with more segments required to achieve representation of all species), slightly higher minimum levels of representation, slightly lower average levels of representation, and a minority of species with higher levels of representation at both the top 10% of segments within the conservation network and the entire network plus top 10% of complementary areas. This suggests that the gains in representation efficiency achieved through a blank slate approach may not be enough to offset the potential reductions in workability and cost, due to the additional resources required for acquisition or forming partnerships for the conservation of currently unprotected lands. The use of a blank slate approach is likely warranted where (1) robust conservation networks do not exist (Jenkins and Joppa, 2009), (2) conservation networks that do exist fail to achieve comprehensive species representation (Rodrigues et al., 2004; Hermoso et al., 2015b; Jenkins et al., 2015), or (3) large amounts of resources are available for the establishment of new networks. However, when robust networks exist (e.g., DellaSala et al., 2001; Commission of the European Communities, 2002; Pugh and Hall, 2006), building from the existing infrastructure using an approach incorporating established conservation networks may be a more effective method for developing actionable priorities.
Our approach is useful when existing conservation networks are established, but our methods have several limitations. Much of the literature employing species distribution modeling for stream fish does not account for spatial autocorrelation, and some studies have found that it may have limited impacts on results (Huang and Frimpong, 2016), however researchers may want to account for spatial autocorrelation to improve future species distribution models (Record et al., 2013). Relying on presence and frequency of occurrence data for rare species when species distribution models cannot be generated biases prioritizations toward selecting known sites and may cause sites with unknown populations to be given lower priority. Finding ways to better account for potential unknown occurrence locations for rare species would certainly benefit conservation planning efforts. Additionally, a variety of other methods of developing species distribution models exist and researchers should evaluate which techniques are most suitable for their dataset and objectives (Shabani et al., 2016). Our models were based on species presence/absence however recent work has shown that using other biological metrics such as species abundance can provide benefits for predictive accuracy (Yu et al., 2020). Zonation is a flexible conservation planning tool that works well for this purpose, however researchers should critically evaluate which specific tools and features may be most useful to achieve their desired results (Moilanen et al., 2009; Sievert et al., 2019), or whether and alternative conservation program such as Marxan (Watts et al., 2009) may be a better fit for their data and objectives.
Using an approach incorporating established conservation networks into the conservation prioritization process may aid aquatic biodiversity conservation efforts at regional, national, and international scales. Although some regions do not currently have sufficient biological or environmental data to tackle these types of analyses, there are examples from North and South America, Africa, Asia, and Europe where sufficient data exists (Lassalle and Rochard, 2009; Iojaa et al., 2010; Esselman and Allan, 2011; Nel et al., 2011b; Strecker et al., 2011; Thieme et al., 2012; Hermoso et al., 2015a; Maire et al., 2016; Raghavan et al., 2016; Bicknell et al., 2017; Jézéquel et al., 2020). Protected and priority areas, such as South Africa's National Freshwater Ecosystem Priority Areas (Nel et al., 2011a), Europe's Natura 2000 (Commission of the European Communities, 2002), and areas identified in State Wildlife Action Plans in the United States (Pugh and Hall, 2006), among many others, are examples of established networks upon which prioritization incorporating established conservation networks has been or could be beneficial. The ability to consider established conservation networks during the prioritization process increases the feasibility of taking action based on the results of systematic conservation planning. In regions where sufficient data exist to estimate the distributions of aquatic biodiversity, this framework may be utilized to inform management decisions within established networks, and can guide land acquisition and partnerships in selecting areas which best complement what is already being protected, and help prioritize restoration and management both within and complementary to established conservation networks.
Data Availability Statement
The datasets generated for this study are available on request to the corresponding author.
Ethics Statement
Ethical review and approval was not required for the animal study because, this study was based entirely on existing data, no surveys or samples were conducted for this study on living creatures.
Author Contributions
NS, CP, and JW contributed to the conception and design of this study. NS developed the species distribution models and zonation prioritizations and ran the analyses. CP and JW provided feedback on analysis. NS wrote the first draft of the manuscript. CP and JW provided revisions and editing of the manuscript. All authors read and approved the submitted version.
Funding
Funding for this project was provided through grant number G11AC20311 to the University of Missouri by the U.S. Geological Survey National and Northeast Climate Adaptation Science Centers. The Missouri Cooperative Fish and Wildlife Research Unit were jointly sponsored by the Missouri Department of Conservation, the University of Missouri, the U.S. Geological Survey, the U.S. Fish and Wildlife Service, and the Wildlife Management Institute.
Conflict of Interest
The authors declare that the research was conducted in the absence of any commercial or financial relationships that could be construed as a potential conflict of interest.
Acknowledgments
We would like to thank Matt Combes and Dr. Doug Novinger of the Missouri Department of Conservation for sharing much of the data used in this study with us. We also thank Dr. Michelle Staudinger, Dr. Tim Matisziw, Dr. Wes Daniel, and members of the River Studies Lab at the University of Missouri. Any use of trade, firm, or product names was for descriptive purposes only and did not imply endorsement by the U.S. Government.
Supplementary Material
The Supplementary Material for this article can be found online at: https://www.frontiersin.org/articles/10.3389/fenvs.2020.515081/full#supplementary-material
References
Abbitt, R., Annis, G., and Sowa, S. (2004). Missouri Streams with Landscape Variables. Columbia, MO: Missouri Resource Assessment Partnership.
Abell, R., Allan, J., and Lehner, B. (2007). Unlocking the potential of protected areas for freshwaters. Biol. Conserv. 134, 48–63. doi: 10.1016/j.biocon.2006.08.017
Allan, J. (2004). Landscapes and riverscapes: the influence of land use on stream ecosystems. Annu. Rev. Ecol. Evol. Syst. 35, 257–284. doi: 10.1146/annurev.ecolsys.35.120202.110122
Arthington, A., Dulvy, N., Gladstone, W., and Winfield, I. (2016). Fish conservation in freshater and marine realms: status, threats and management. Aquat. Conserv. Marine Freshw. Ecosyst. 26, 838–857. doi: 10.1002/aqc.2712
Bicknell, J., Collins, M., Pickels, R., McCann, N., Bernard, C., Fernandes, D., et al. (2017). Designing protected area networks that translate international conservation commitments into national action. Biol. Conserv. 214, 168–175. doi: 10.1016/j.biocon.2017.08.024
Blodgett, C., and Lea, R. (2005). Missouri Landcover Project. Available online at: http://morap.missouri.edu/index.php/land-cover/ (accessed April 28, 2020).
Commission of the European Communities (2002). Commission Working Document on Natura 2000. Brussels: European Commission on the Environment.
Cooper, A., Tsang, Y., Infante, D., Daniel, W., McKerrow, A., and Wieferich, D. (2019). Protected areas lacking for many common fluvial fishes of the conterminous USA. Biodivers. Res. 25, 1289–1303. doi: 10.1111/ddi.12937
DellaSala, D. A., Staus, N. L., Strittholt, J. R., Hackman, A., and Iacobelli, A. (2001). An updated protected areas database for the United States and Canada. Nat. Areas J. 21, 124–135.
Diana, M., Allan, D., and Infante, D. (2006). The influence of physical habitat and land use on stream fish assemblages in Southeastern Michigan. Am. Fisheries Soc. Symp. 48, 359–374.
Dudgeon, D., Arthington, A., Gessner, M., Kawabata, Z., Knowler, C., Leveque, C., et al. (2006). Freshwater biodiversity: importance, threats, status and conservation challenges. Biol. Rev. 81, 163–182. doi: 10.1017/S1464793105006950
Esselman, P., and Allan, J. (2011). Application of species distribution models and conservation planning software to the design of a reserve network for the riverine fishes of northeastern Mesoamerica. Freshw. Biol. 56, 71–88. doi: 10.1111/j.1365-2427.2010.02417.x
Esselman, P., Edgar, M., Breck, J., Hay-Chmielewski, E., and Wang, L. (2012). Riverine connectivity, upstream influences, and multi-taxa representation in a conservation area network for the fishes of Michigan, USA. Aquat. Conserv. Marine Freshw. Ecosyst. 23, 7–22. doi: 10.1002/aqc.2279
Figg, D. (2011). Conservation Priorities Decision Support Tool. Jefferson City, MO: Missouri Department of Conservation.
Fischer, S., and Combes, M. (2003). Resource Assessment Monitoring Program: Standard Operation Procedures-Fish Sampling. Missouri Department of Conservation.
Grantham, T., Fesenmyer, K., Peek, R., Holmes, E., Quinones, R., Bell, A., et al. (2016). Missing the boat on freshwater fish conservation in California. Conserv. Lett. 10, 77–85. doi: 10.1111/conl.12249
Hastie, T. (2014). gam: Generalized Additive Models. R Package. V. 1.09.01. doi: 10.1002/9781118445112.stat03141
Hermoso, V., Abell, R., Linke, S., and Boon, P. (2016). The role of protected areas for freshwate biodiversity conservation: challenges and opportunities in a rapidly changing world. Aquat. Conserv. Marine Freshw. Ecosyst. 26, 3–11. doi: 10.1002/aqc.2681
Hermoso, V., Filipe, A. F., Segurado, P., and Beja, P. (2015a). Filling gaps in a large reserve network to address freshwater conservation needs. J. Environ. Manage. 161, 358–365. doi: 10.1016/j.jenvman.2015.07.023
Hermoso, V., Filipe, A. F., Segurado, P., and Beja, P. (2015b). Effectiveness of a large reserve network in protecting freshwater biodiversity: a test for the Iberian Peninsula. Freshw. Biol. 60, 698–710. doi: 10.1111/fwb.12519
Hoskins, J. (2005). Missouri's Comprehensive Wildlife Strategy. Jefferson City, MO: Missouri Department of Conservation.
Howard, J., Fesenmyer, K., Grantham, T., Viers, J., Ode, P., Moyle, P., Kupferburg, S., et al. (2018). A freshwater conservation blueprint for California: prioritizing watersheds for freshwater biodiversity. Freshw. Sci. 37, 417–431. doi: 10.1086/697996
Huang, J., and Frimpong, E. (2016). Limited transferability of stream-fish distribution models among river catchments: reasons and implications. Freshw. Biol. 61, 729–744. doi: 10.1111/fwb.12743
Iojăa, C. I., Patroescua, M., Rozylowicza, L., Popescub, V. D., Vergheletc, M., Zottac, M. I., and Felciucc, M. (2010). The efficacy of Romania's protected areas network in conserving biodiversity. Biol. Conserv. 143, 2468–2476. doi: 10.1016/j.biocon.2010.06.013
Jenkins, C. N., and Joppa, L. (2009). Expansion of the global terrestrial protected area system. Biol. Conserv. 142, 2166–2174. doi: 10.1016/j.biocon.2009.04.016
Jenkins, C. N., Van Houtan, K. S., Pimm, S. L., and Sexton, J. O. (2015). US protected lands mismatch biodiversity priorities. PNAS 112, 5081–5086. doi: 10.1073/pnas.1418034112
Jézéquel, C., Tedesco, P., Darwall, W., Dias, M., Renata, G., Hidalgo, B., et al. (2020). Freshwater fish diversity hotspots for conservation priorities in the Amazon Basin. Conserv.Biol. 34, 956–965. doi: 10.1111/cobi.13466
Jones, K., Watson, J., Possingham, H., and Klein, C. (2016). Incorporating climate change into spatial conservation prioritization: a review. Biol. Conserv. 194, 121–130. doi: 10.1016/j.biocon.2015.12.008
Knight, A., Cowling, R., Rouget, M., Balmford, A., Lombard, A., and Campbell, B. (2008). Knowing but not doing: selecting priority conservation areas and the research-implementation gap. Conserv. Biol. 22, 610–617. doi: 10.1111/j.1523-1739.2008.00914.x
Lange, K., Townsend, C., Gabrielsson, R., Chanut, P., and Matthaei, C. (2014). Responses of stream fish populations to farming intensity and water abstraction in an agricultural catchment. Freshw. Biol. 59, 286–299. doi: 10.1111/fwb.12264
Lassalle, G., and Rochard, E. (2009). Impact of twenty-first century climate change on diadromous fish spread over Europe, North Africa and the Middle East. Glob. Chang. Biol. 15, 1072–1089. doi: 10.1111/j.1365-2486.2008.01794.x
Leathwick, J., Moilanen, A., Ferrier, S., and Julian, K. (2010). Complementarity-based conservation prioritization using a community classification, and its application to riverine ecosystems. Biol. Conserv. 143, 984–991. doi: 10.1016/j.biocon.2010.01.012
Linke, S., Hermoso, V., and Januchowski-Hartley, S. (2019). Toward process-based conservation prioritizations for freshwater ecosystems. Aquat. Conserv. Marine Freshw. Ecosyst. 27, 1149–1160. doi: 10.1002/aqc.3162
Linke, S., Turak, E., and Nel, J. (2011). Freshwater conservation planning: the case for systematic approaches. Freshw. Biol. 56, 6–20. doi: 10.1111/j.1365-2427.2010.02456.x
Maire, A., Laffaille, P., Maire, J., and Buisson, L. (2016). Identification of priority areas for the conservation of stream fish assemblages: implications for river management in France. River Res. Appl. 33, 524–537. doi: 10.1002/rra.3107
Margules, C., and Pressey, R. (2000). Systematic conservation planning. Nature 405, 243–253. doi: 10.1038/35012251
Marshall, D., Fayram, A., Panuska, J., Baumann, J., and Hennessy, J. (2008). Positive effects of agricultural land use changes on coldwater fish communities in Southwest Wisconsin streams. North Am. J. Fish. Manage. 28, 944–953. doi: 10.1577/M06-139.1
Mattson, K. M., and Angermeier, P. L. (2007). Integrating human impacts and ecological integrity into a risk-based protocol for conservation planning. Environ. Manage. 39, 125–138. doi: 10.1007/s00267-005-0238-7
Missouri Department of Conservation (2005). Missouri's Comprehensive Wildlife Conservation Strategy. Jefferson City, MO: Missouri Department of Conservation.
Moilanen, A., Kujala, H., and Leathwick, J. R. (2009). “The Zonation framework and software for conservation prioritization,” in Spatial Conservation Prioritization, eds A. Moilanen, K. Wilson, and H. Possingham, 196–210. Oxford: Oxford University Press.
Moilanen, A., Leathwick, J., and Elith, J. (2008). A method for spatial freshwater conservation prioritization. Freshw. Biol. 53, 577–592. doi: 10.1111/j.1365-2427.2007.01906.x
Moilanen, A., Meller, L., Leppanen, J., Pouzols, F. M., Arponen, A., and Kujala, H. (2012). Zonation Conservation Planning Software. Helsinki: Biodiversity Conservation Informatics Group, University of Helsinki.
Morrow, J., and Fischenich, C. (2000). Habitat Requirements of Freshwater Fishes. EMRRP Technical Notes Collection (ERDC TN-EMRRP-SR_06). Vicksburg, MS: U.S. Army Engineer Research and Development Center.
Naughton-Treves, L., Holland, M. B., and Brandon, K. (2005). The role of protected areas in conserving biodiversity and sustaining local livelihoods. Annu. Rev. Environ. Resour. 30, 219–252. doi: 10.1146/annurev.energy.30.050504.164507
Nel, J., Murray, K., Maherry, A., Petersen, C., and Roux, D. (2011a). Technical Report for the National freshwater Ecosystem Priority Areas Project. WRC Report No. 1801/2/11. Claremont: Water Research Commission.
Nel, J., Reyers, B., Roux, D., and Cowling, R. (2009a). Expanding protected areas beyond their terrestrial comfort zone: identifying spatial options for river conservation. Biol. Conserv. 142, 1605–1616. doi: 10.1016/j.biocon.2009.02.031
Nel, J., Reyers, B., Roux, D., and Cowling, R. (2011b). Designing a conservation area network that supports the representation and persistence of freshwater biodiversity. Freshw. Biol. 56, 106–124. doi: 10.1111/j.1365-2427.2010.02437.x
Nel, J., Roux, D., Abell, R., Ashton, P., Cowling, R., Higgins, J., et al. (2009b). Progress and challenges in freshwater conservation planning. Aquat. Conserv. Marine Freshw. Ecosyst. 19, 474–485. doi: 10.1002/aqc.1010
Nel, J., Roux, D., Maree, G., Kleynhans, C., Moolman, J., Reyers, B., Rouget, M., and Cowling, R. (2007). Rivers in Peril inside and outside protected areas: a systematic approach to conservation assessment of river ecosystems. Divers. Distrib. 13, 341–352. doi: 10.1111/j.1472-4642.2007.00308.x
Nislow, K. (2005). Forest change and stream fish habitat: lessons from 'Olde' and New England. J. Fish Biol. 67, 186–204. doi: 10.1111/j.0022-1112.2005.00913.x
Paukert, C., Kleekamp, E., and Tingley, R. (2020). Identifying candidate reference reaches to assess the physical and biological integrity of wadeable streams in different ecoregions and among stream sizes. Ecol. Indic. 111:105966.doi: 10.1016/j.ecolind.2019.105966
Paukert, C., Pitts, K., Whittier, J., and Olden, J. (2011). Development and assessment of a landscape-scale ecological threat index for the Lower Colorado River Basin. Ecol. Indic. 11, 304–310. doi: 10.1016/j.ecolind.2010.05.008
Pressey, R., Humphries, C., Margules, C., Vane-Wright, R., and Williams, P. (1993). Beyond opportunism: key principles for systematic reserve selection. Trends Ecol. Evolut. 8, 124–128. doi: 10.1016/0169-5347(93)90023-I
Pugh, C., and Hall, D. (2006). State Wildlife Action Plans, From Vision to On-the-Ground Action. Washington, DC: Association of Fish and Wildlife Agencies. p. 116.
Raghavan, R., Das, S., Nameer, P., Bijukumar, A., and Dahanukar, N. (2016). Protected areas and imperilled endemic freshwater biodiversity in the Western Ghats hotspot. Aquat. Conservat. Marine Freshw. Ecosyst. 26, 78–90. doi: 10.1002/aqc.2653
Record, S., Fitzpatrick, M., Finley, A., Veloz, S., and Ellison, A. (2013). Should species distribution models account for spatial autocorrelation? A test of model projections across eight millennia of climate change. Glob. Ecol. Biogeogr. 22, 760–771. doi: 10.1111/geb.12017
Rodrigues, A., Andelman, S., Bakarr, M., and Boitani, L. (2004). Effectiveness of the global protected area network in representing species diversity. Nature 428, 640–643. doi: 10.1038/nature02422
Saunders, D., Meeuwig, J., and Vincent, A. (2002). Freshwater protected areas: strategies for conservation. Conserv. Biol. 16, 30–41. doi: 10.1046/j.1523-1739.2002.99562.x
Shabani, F., Kumar, L., and Ahmadi, M. (2016). A comparison of absolute performance of different correlative and mechanistic species distribution models in an independent area. Ecol. Evol. 6, 5973–5986. doi: 10.1002/ece3.2332
Sievert, N., Paukert, C., Tsang, Y., and Infante, D. (2016). Development and assessment of indices to determine stream fish vulnerability to climate change and habitat alteration. Ecol. Indic. 67, 403–416. doi: 10.1016/j.ecolind.2016.03.013
Sievert, N., Paukert, C., and Whittier, J. (2017). Data Supporting a Framework to Incorporate Established Conservation Networks into Freshwater Conservation Planning. U.S. Geological Survey Data Release. doi: 10.5066/F7DF6Q34
Sievert, N., Whittier, J., and Paukert, C. (2019). “Influence of conservation planning methodology on species representation and spatial distribution of priority areas,” in Multispecies and Watershed Approaches to Freshwater Fish Conservation, eds D. Dauwalter, T. Birdsong, and G. Garrett (Bethesda, MD: American Fisheries Society), 85–108.
Sing, T., Sander, O., Beerenwinkel, N., and Lengauer, T. (2013). ROCR: Visualizing the Performance of Scoring Classifiers. R Package. V. 1.0–5.
Snyder, C., Young, J., Villella, R., and Lemarie, D. (2003). Influences of upland and riparian land use patterns on stream biotic integrity. Landsc. Ecol. 18, 647–664. doi: 10.1023/B:LAND.0000004178.41511.da
Sowa, S. P., Annis, G., Morey, M. E., and Diamond, D. D. (2007). A gap analysis and comprehensive conservation strategy for riverine ecosystems of Missouri. Ecol. Monogr. 77, 301–334. doi: 10.1890/06-1253.1
Stein, B. A., Kutner, L. S., and Adams, J., (Eds.). (2000). Precious Heritage: The Status of Biodiversity in the United States. Oxford: Oxford University Press. doi: 10.1093/oso/9780195125191.001.0001
Stewart, D., Underwood, Z., Rahel, F., and Walters, A. (2017). The effectiveness of surrogate taxa to conserve freshwater biodiversity. Conserv. Biol. 32, 183–194. doi: 10.1111/cobi.12967
Stewart, J., Wang, L., Lyons, J., Horwatch, J., and Bannerman, R. (2007). Influences of watershed, riparian-corridor, and reach scale characteristics on aquatic biota in agricultural watersheds. J. Am. Water Resour. Assoc. 37, 1475–1487. doi: 10.1111/j.1752-1688.2001.tb03654.x
Strecker, A., Olden, J., Whittier, J., and Paukert, C. (2011). Defining conservation priorities for freshwater fishes according to taxonomic, functional, and phylogenetic diversity. Ecol. Appl. 21, 3002–3013. doi: 10.1890/11-0599.1
Terrado, M., Sabater, S., Chaplin-Kramer, B., Mandle, L., Ziv, G., and Acuña, V. (2016). Model development for the assessment of terrestrial and aquatic habitat quality in conservation planning. Sci. Total Environ. 540, 63–70. doi: 10.1016/j.scitotenv.2015.03.064
Thieme, M., Rudulph, J., Higgins, J., and Takats, J. (2012). Protected areas and freshwater conservation: a survey of protected area managers in the Tennessee and Cumberland River Basins, USA. J. Environ. Manage. 109, 189–199. doi: 10.1016/j.jenvman.2012.06.021
Thieme, M., Sindorf, N., Higgins, J., Abell, R., Takats, J., Naidoo, R., and Barnett, A. (2016). Freshwater conservation potential of protected areas in the Tennessee and Cumberland River Basins, USA. Aquat. Conserv. Marine Freshw. Ecosyst. 26, 60–77. doi: 10.1002/aqc.2644
Trakhtenbrot, A., and Kadmon, R. (2005). Environmental cluster analysis as a tool for selecting complementary networks of conservation sites. Ecol. Appl. 15, 335–345. doi: 10.1890/04-0077
VanCompernolle, M., Knouft, J., and Ficklin, D. (2019). Multispecies conservation of freshwater fish assemblages in response to climate change in the southeastern United States. Divers. Distrib. 25, 1388–1398. doi: 10.1111/ddi.12948
Watson, J. E. M., Dudley, N., Segan, D. B., and Hockings, M. (2014). The performance and potential of protected areas. Nature 515, 67–73. doi: 10.1038/nature13947
Watts, M., Ball, I., Stewart, R., and Klein, C. (2009). Marxan with zones: software for optimal conservation based land-and sea-use zoning. Environ. Model. Softw. 24, 1513–1521. doi: 10.1016/j.envsoft.2009.06.005
Keywords: fish, protected areas, conservation, stream, representation, freshwater, conservation planning
Citation: Sievert NA, Paukert CP and Whittier JB (2020) Incorporating Established Conservation Networks into Freshwater Conservation Planning Results in More Workable Prioritizations. Front. Environ. Sci. 8:515081. doi: 10.3389/fenvs.2020.515081
Received: 26 November 2019; Accepted: 20 November 2020;
Published: 14 December 2020.
Edited by:
Gabriele Weigelhofer, University of Natural Resources and Life Sciences Vienna, AustriaReviewed by:
Stefanos Xenarios, Nazarbayev University, KazakhstanClemens Trautwein, Lucerne University of Applied Sciences and Arts, Switzerland
Copyright © 2020 Sievert, Paukert and Whittier. This is an open-access article distributed under the terms of the Creative Commons Attribution License (CC BY). The use, distribution or reproduction in other forums is permitted, provided the original author(s) and the copyright owner(s) are credited and that the original publication in this journal is cited, in accordance with accepted academic practice. No use, distribution or reproduction is permitted which does not comply with these terms.
*Correspondence: Nicholas A. Sievert, nas4tf@mail.missouri.edu