My First Data Art: NYC Taxi Defrag
In my data visualization NYC Taxis: A Day in the Life, there is a D3 chart at the bottom of the screen that shows when the vehicle has a fare, and when it is empty. I wanted to compare this pattern across many vehicles and see if any larger patterns jumped out. This is the result:
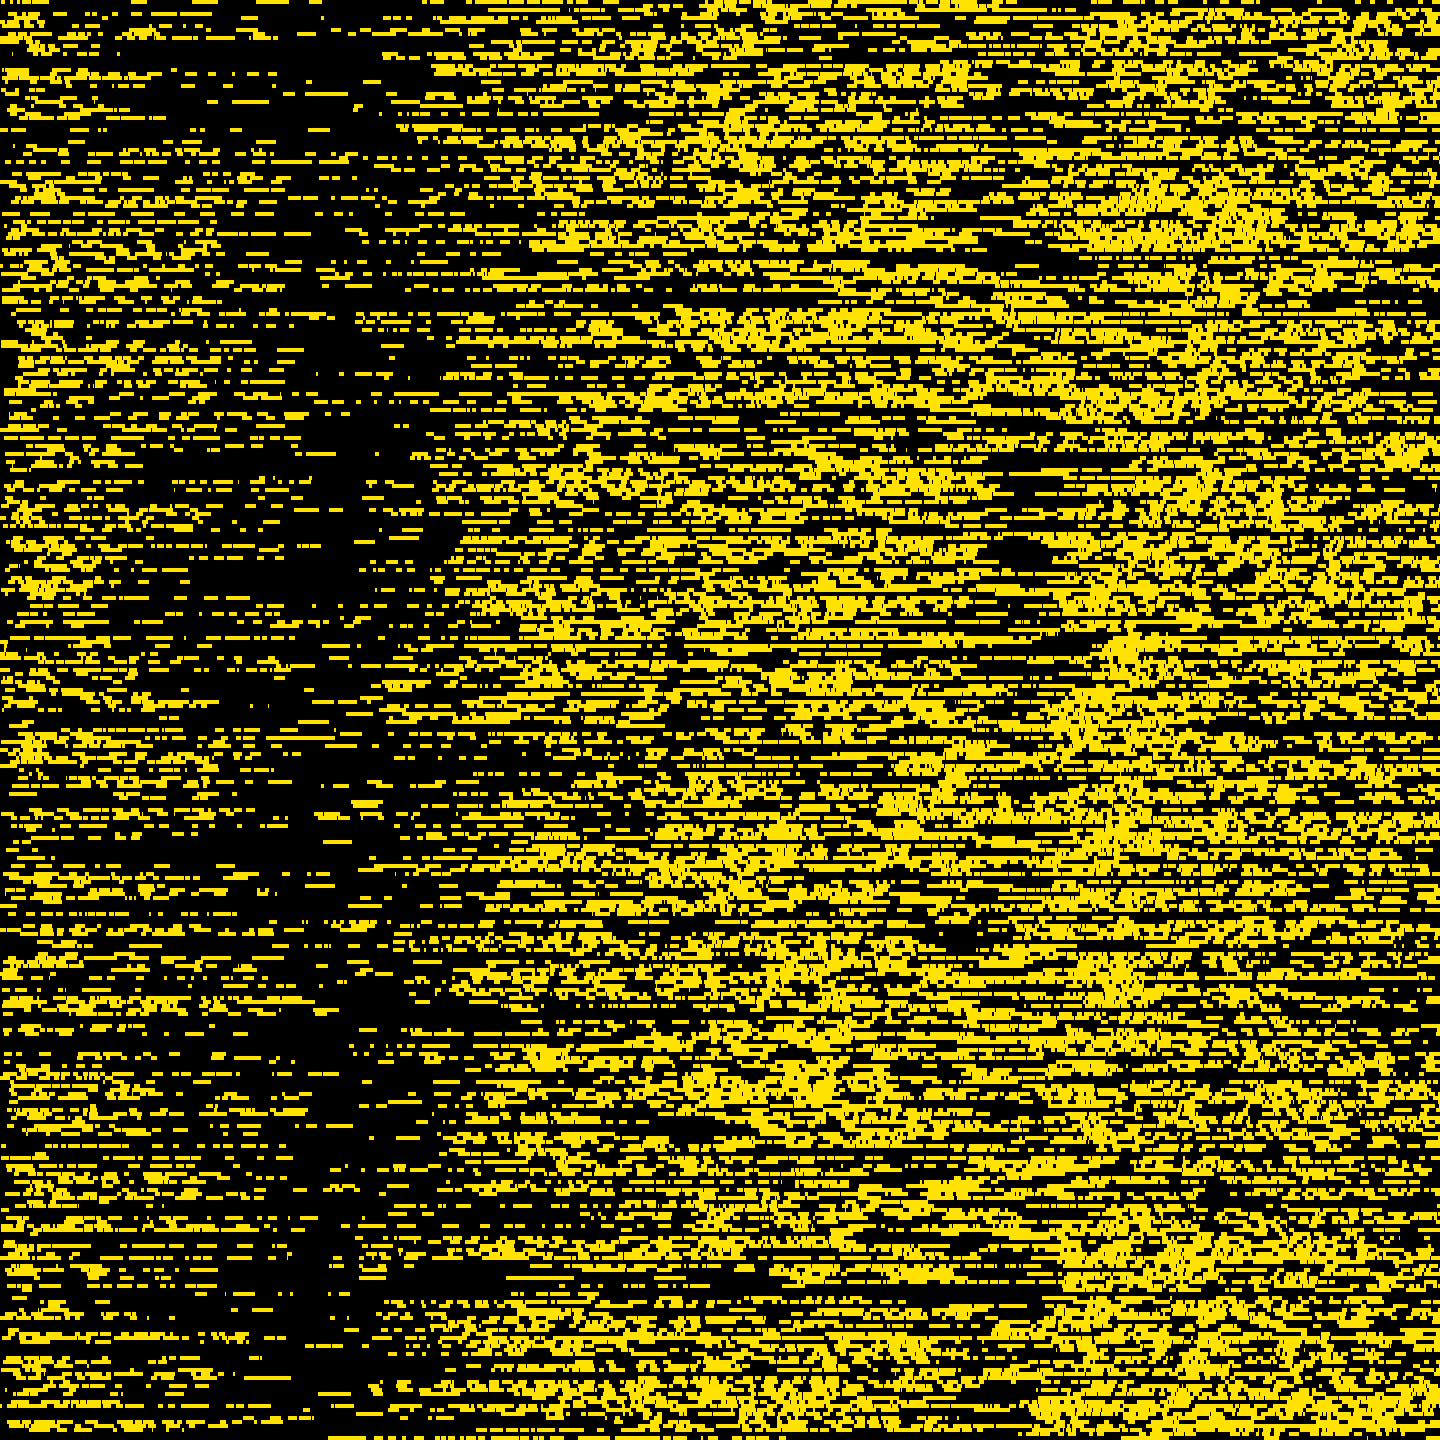 What are we looking at here? Each row is a single taxi represented over 24 hours. Each pixel of width represents one minute. There are 60 minutes in an hour, and 24 hours in a day, giving us 1440 pixels of width. Each row is 4 pixels high, so there are 360 taxis represented in this image. Yellow means the taxi had a fare, black means it did not.
We can see two big fuzzy stripes of black running vertically across the image: One in the early morning hours between 4 and 8 am, and a less visible one in the afternoon, which I assume represents shift change (where cabbies aren’t carrying fares because they are refueling or traveling back to their base).
I didn’t set out to make data art tonight, but that’s what I ended up with. I’m calling it NYC Taxi Defrag because it reminds me of the diagram you see when you defragment your hard drive. Who wants to buy one? :p
Edit 1/13/15: Now you can buy a print of NYC Taxi Defrag from my store!
Read on if you are interested in how this was built.
First, here’s my code on Github.
The data source for this is NYC’s 2013 Taxi Tripsheet data, which I received via FOIL request and published in the Summer of 2014.
To get a subset of the data for this project, I modified the same query that I used to grab data for NYC Taxis: A Day in the Life. Reddit user u/fhoffa helped me out with it the first time, and I often refer back to this thread on reddit for some great bigQuery Examples. I had intended make the output 1 pixel per row, so I grabbed 1440 cab/days worth of data at random with this query:
SELECT trip_data.medallion, trip_data.pickup_datetime,trip_data.dropoff_datetime
    FROM (
    SELECT medallion, pickup_datetime, dropoff_datetime
    FROM [833682135931:nyctaxi.trip_data] a
    JOIN (
     SELECT medallion onemedallion, DATE(pickup_datetime) onedate
     FROM [833682135931:nyctaxi.trip_data]
     WHERE RAND() < 1/173179759 * 14400
     LIMIT 1440) b
    ON a.medallion=b.onemedallion
    WHERE DATE(pickup_datetime)=onedate
    ) as trip_data
    JOIN EACH [833682135931:nyctaxi.trip_fare] as trip_fare
    ON trip_data.medallion = trip_fare.medallion
    AND trip_data.pickup_datetime = trip_fare.pickup_datetime
    ORDER BY trip_data.pickup_datetime ASC;
Next I wrote a little script in node that would parse the CSV and create a row of this image using HTML5 Canvas.
Since each pixel is a minute of the 24 hour day, I had to convert the timestamps in the data (which look like 10/7/13 0:01) into integers representing the number of minutes since midnight. This was easy with the help of moment.js, which can effortlessly parse the input strings, and just as effortlessly display minutes and hours.
	  var pickup = moment(values[1]);
	  var dropoff = moment(values[2]);

	  //convert hours and minutes to just minutes elapsed since midnight
	  pickup = (pickup.hour()*60) + pickup.minute();
	  dropoff = (dropoff.hour()*60) + dropoff.minute();
A little math converts the hours into minutes, and gives me an integer that I can use when drawing canvas rectangles.
Once I had a nice array of objects for each cab/day, I passed each one to the following function which draws the appropriate canvas elements.
function processCabDay(tripsArray) {
		//draw a black background across the entire row
		ctx.fillStyle = "rgba(0, 0, 0, 1)";
		ctx.fillRect( 0, row * rowheight, 1440, rowheight );

	//for each trip in the array, draw a yellow rectangle at the appropriate start and end column
	tripsArray.forEach(function(trip) {
		if(trip.pickup>trip.dropoff) {
			trip.dropoff = 1440;
		}
			ctx.fillStyle = "rgba(255, 226, 0, 1)";
			ctx.fillRect( trip.pickup, row * rowheight, trip.dropoff-trip.pickup, rowheight );

	})
	console.log(row);
	row++;
}
Finally, I create a new html file with an image built using canvas.toDataURL(), and use the node package “open” to automatically open it up in my browser for viewing.
function writeFile() {
var imgString = ' + ') ';
fs.writeFile("image.html", imgString, function(err) {
if(err) {
console.log(err);
} else {
console.log("The file was saved!");
open('http://localhost/~chriswhong/canvasTest/image.html');
}
});
}
';
fs.writeFile("image.html", imgString, function(err) {
if(err) {
console.log(err);
} else {
console.log("The file was saved!");
open('http://localhost/~chriswhong/canvasTest/image.html');
}
});
}
Thanks for reading!
Leave a Reply