I know everyone hates inflation and I get why that’s the case.
But it feels like people who are down on the economy because inflation is so high are missing the fact that the labor market is on fire.
The unemployment rate is basically back to pre-pandemic levels:
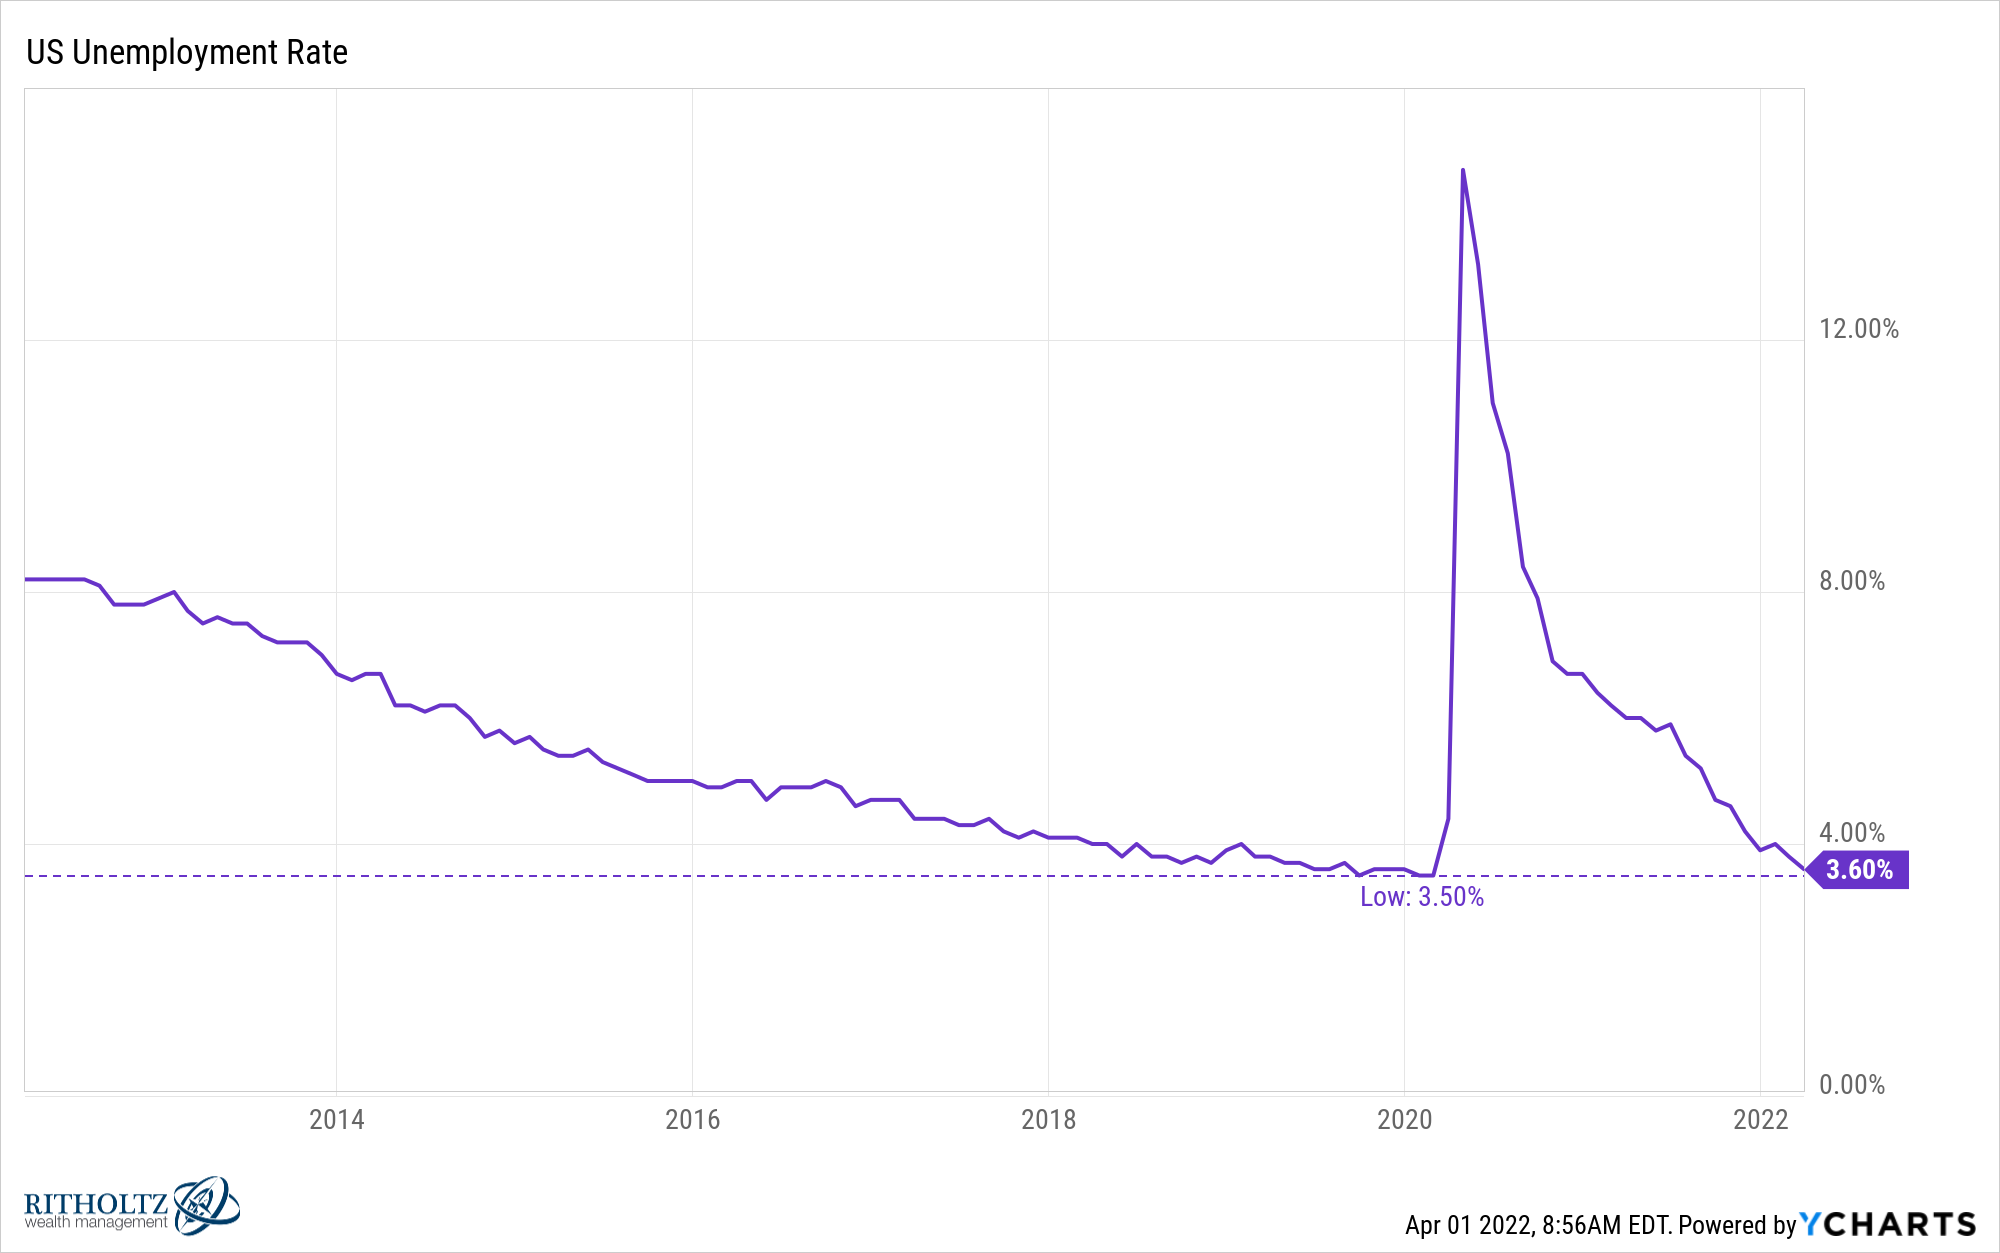
But Ben that’s just because no one wants to work anymore? Ever heard of the Great Resignation?
It is true that we’ve never seen so many people quit their jobs before:
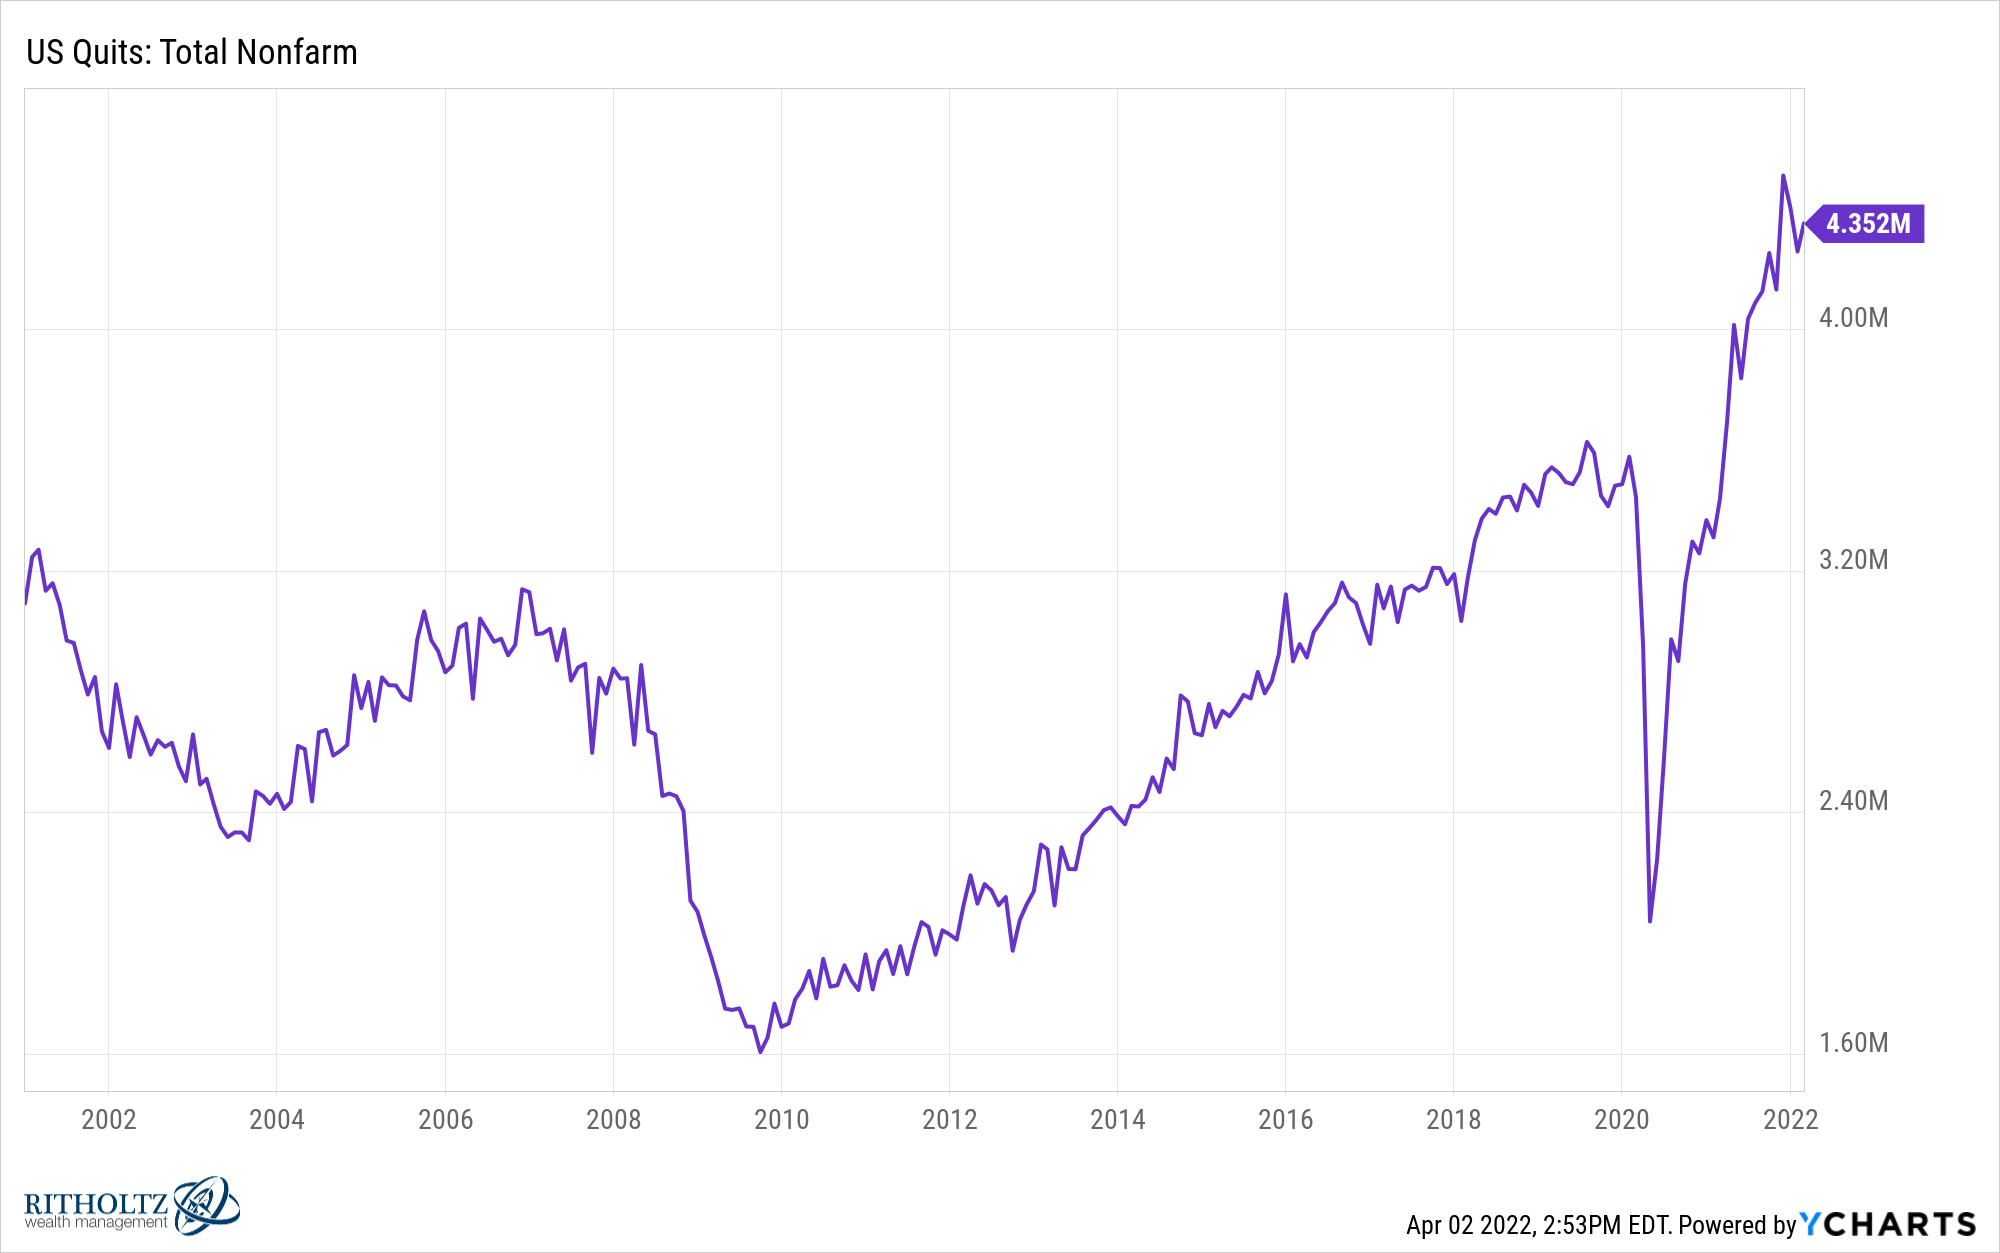
However, this is a good thing. It means people have confidence that they’ll find another job.
The Great Resignation needs to hire a PR agent. It should be rebranded as the Great Reshuffling.
The number of prime-age workers (ages 25-54) just hit a new all-time high, surpassing pre-pandemic levels:
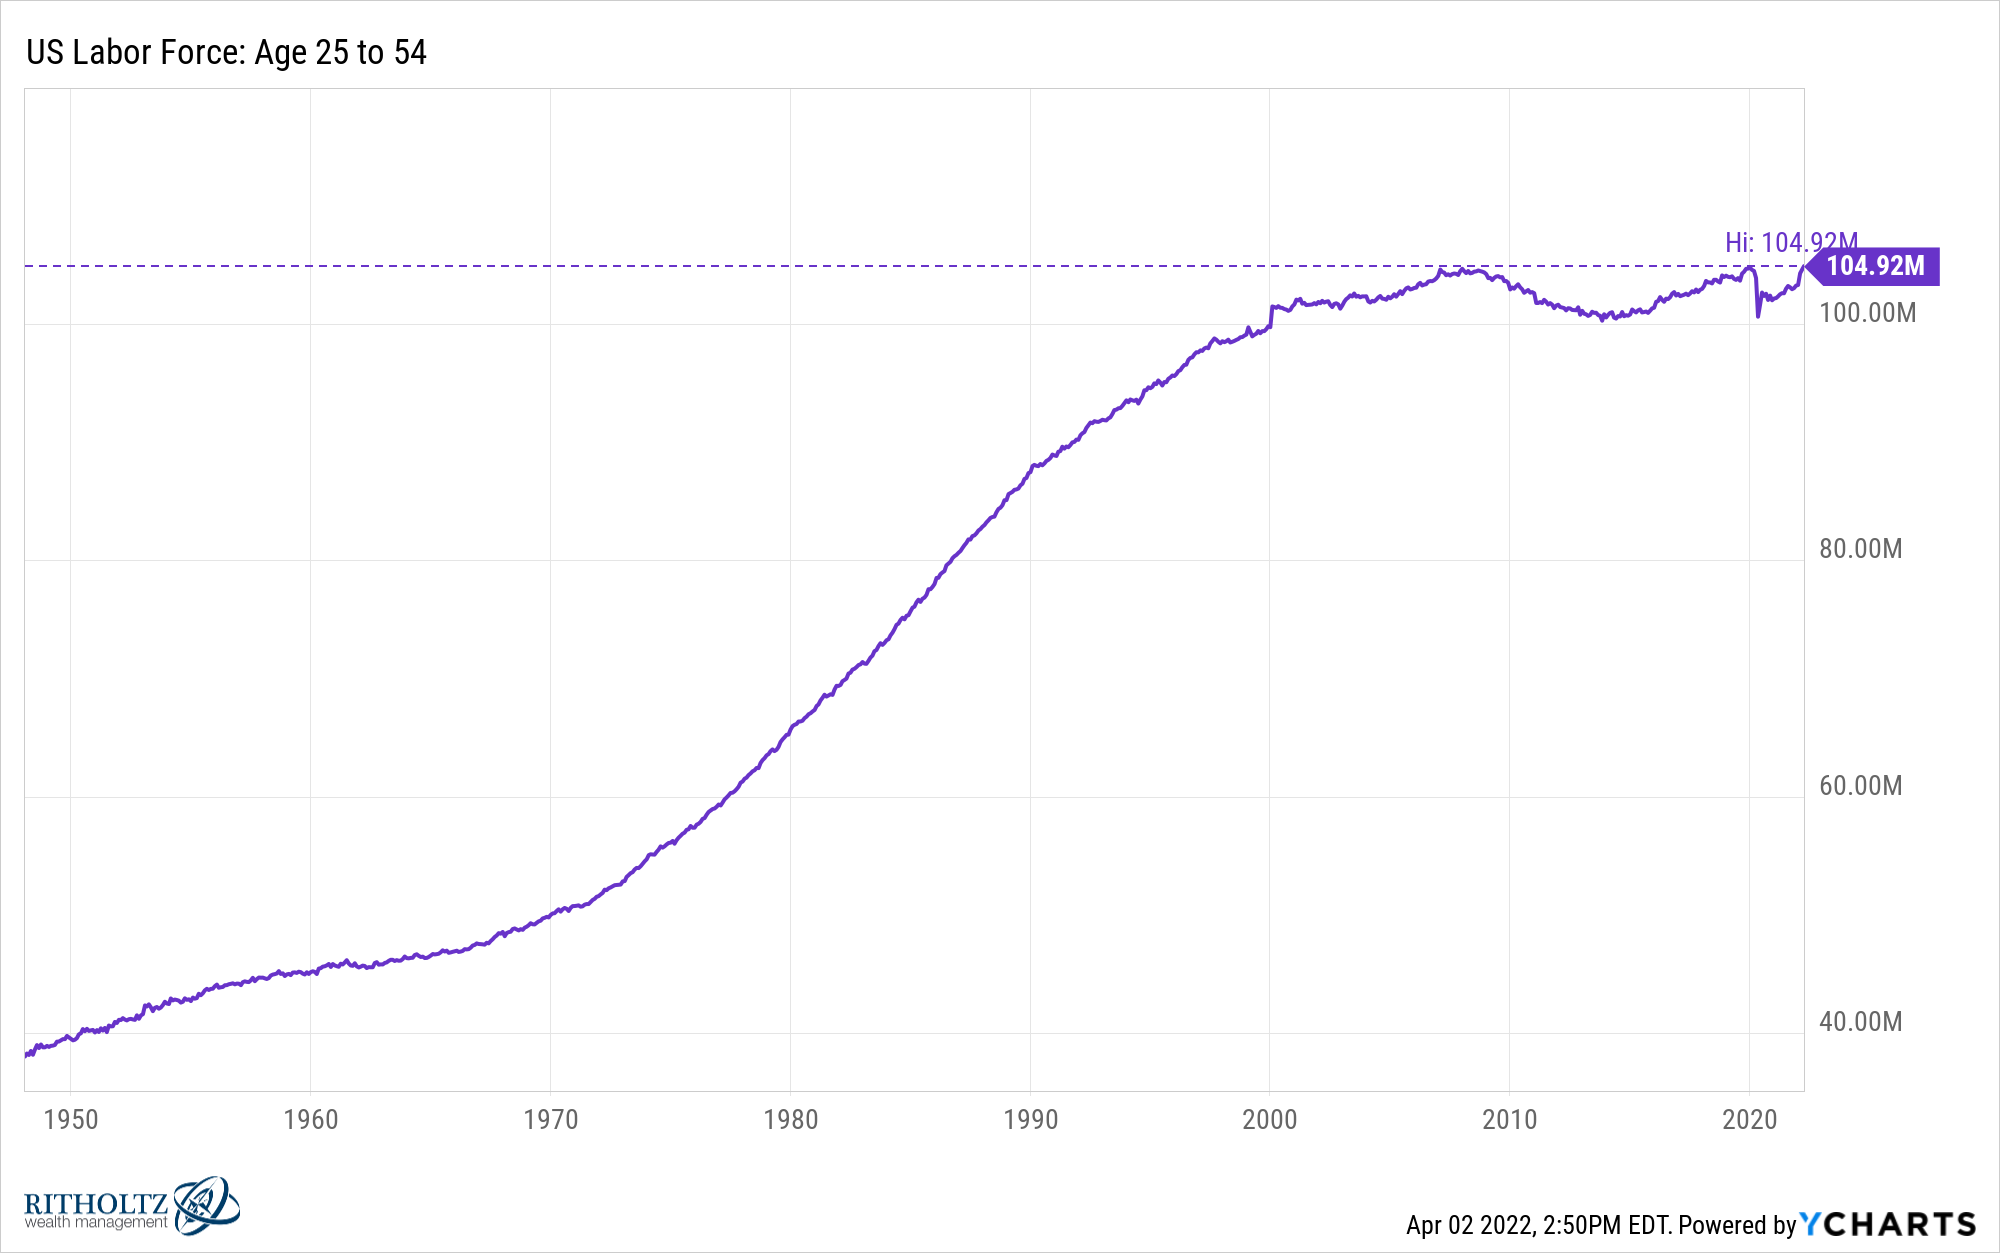
No this is not a typo or a chart crime. You can see labor force participation among this group1 is closing in on pre-pandemic levels as well:
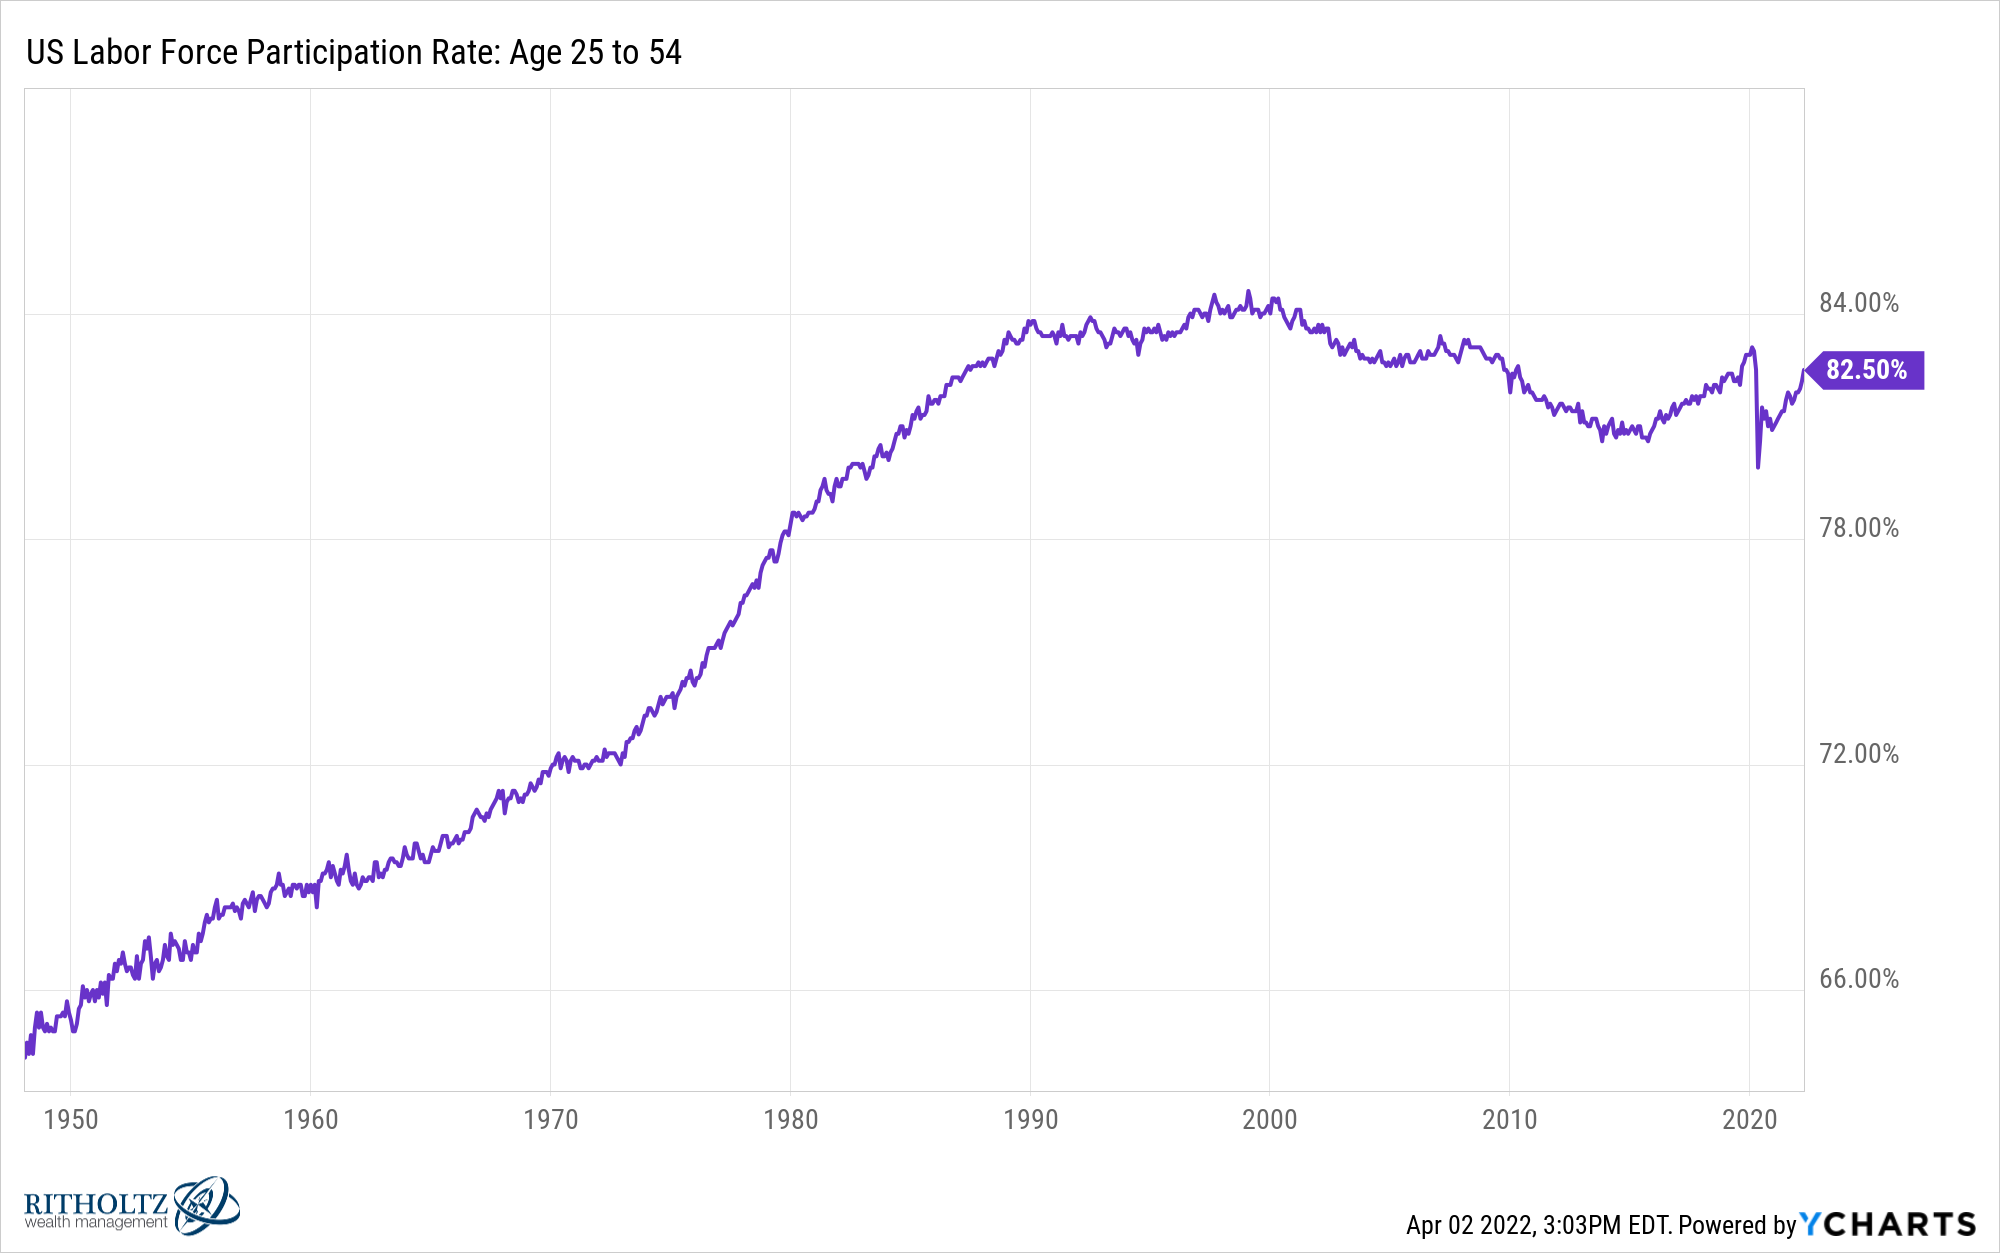
I know this goes against the prevailing narrative right now, but most people want or need to work.
Well what about all of the older people who retired early?
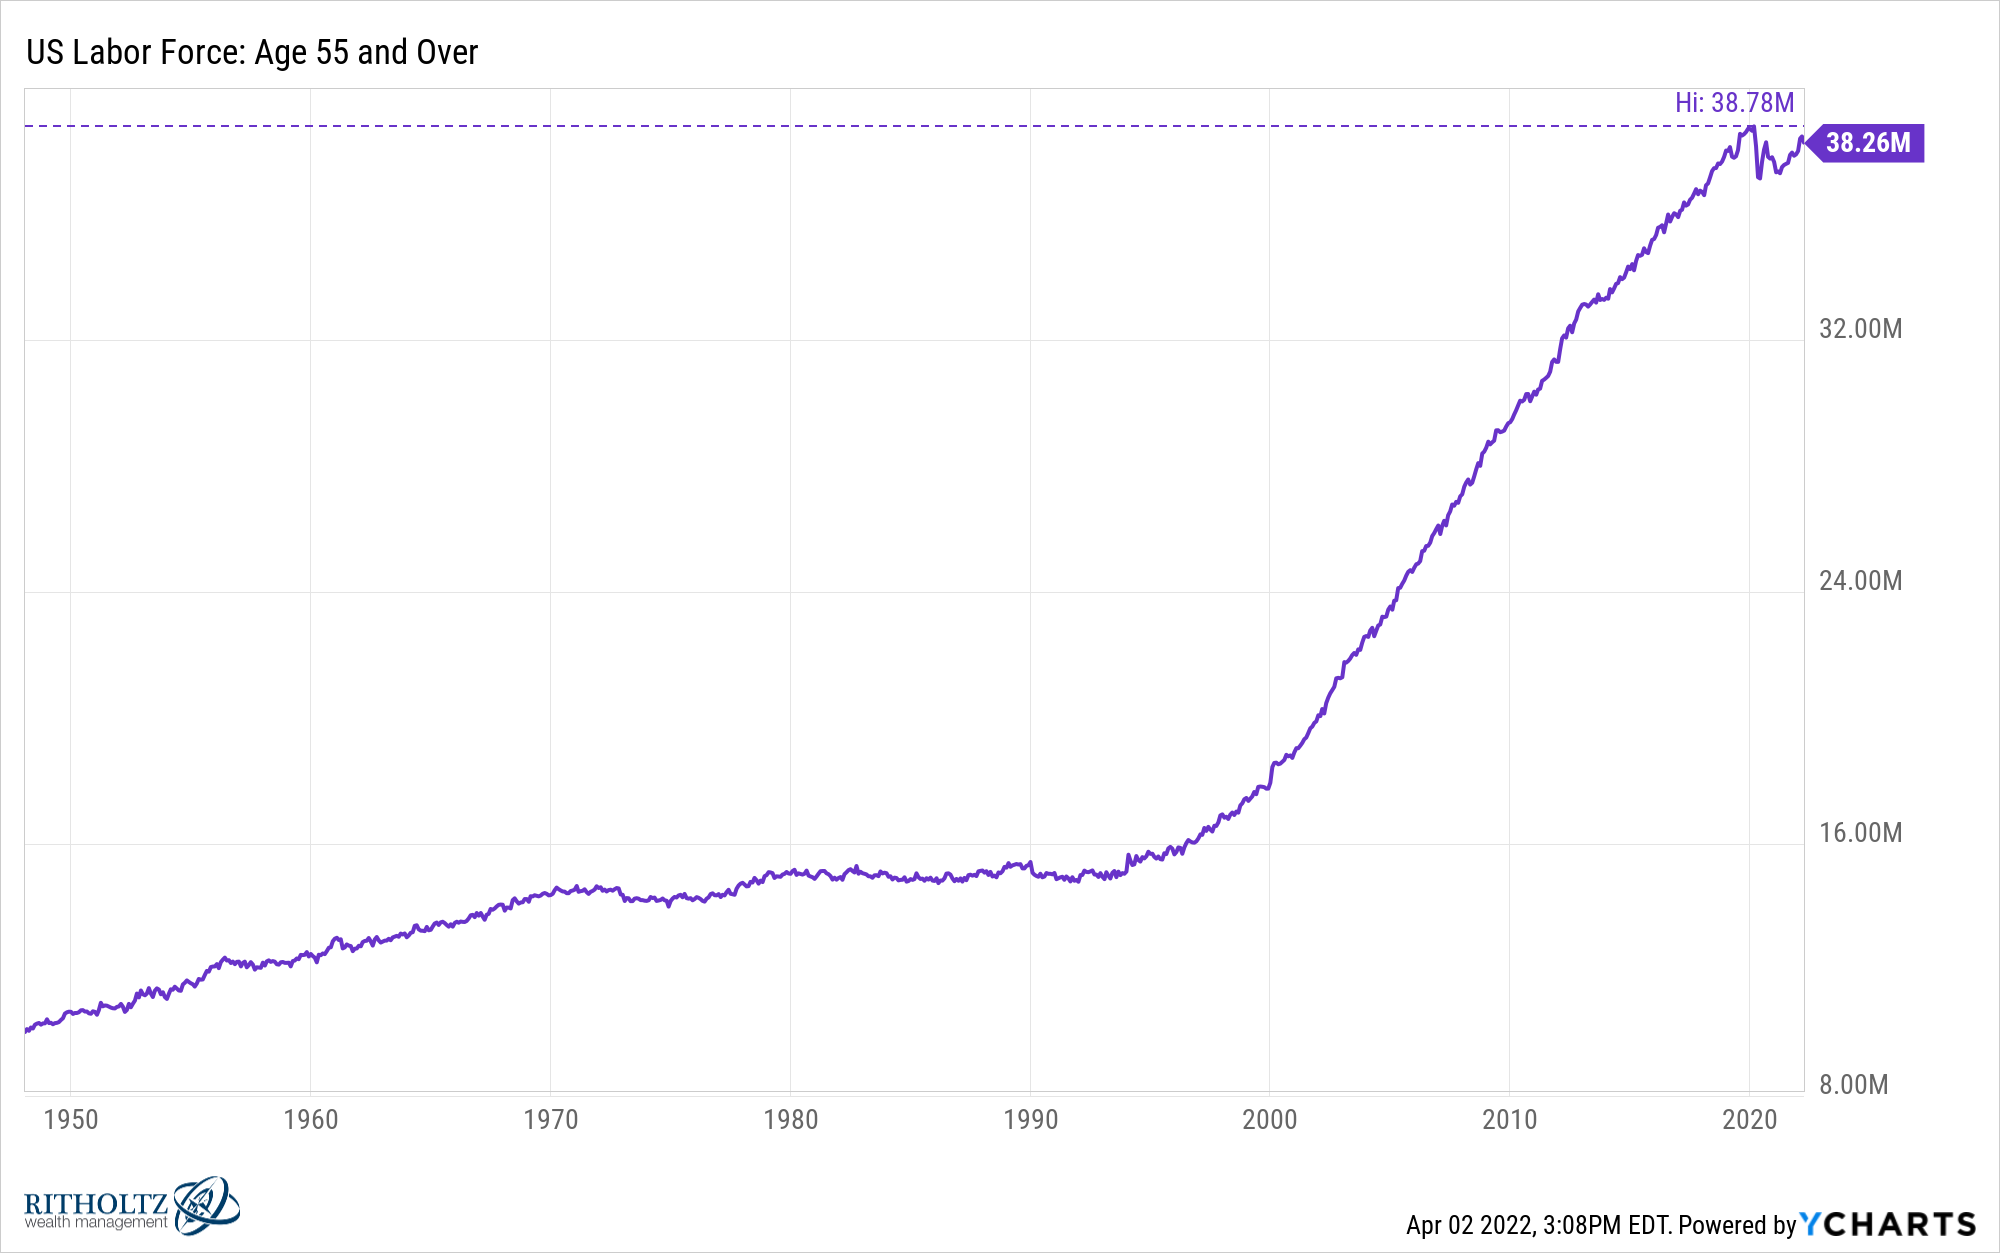
It is true there were millions of people who retired ahead of schedule but the labor force for the 55 and over cohort is almost back to 2019 levels as well:
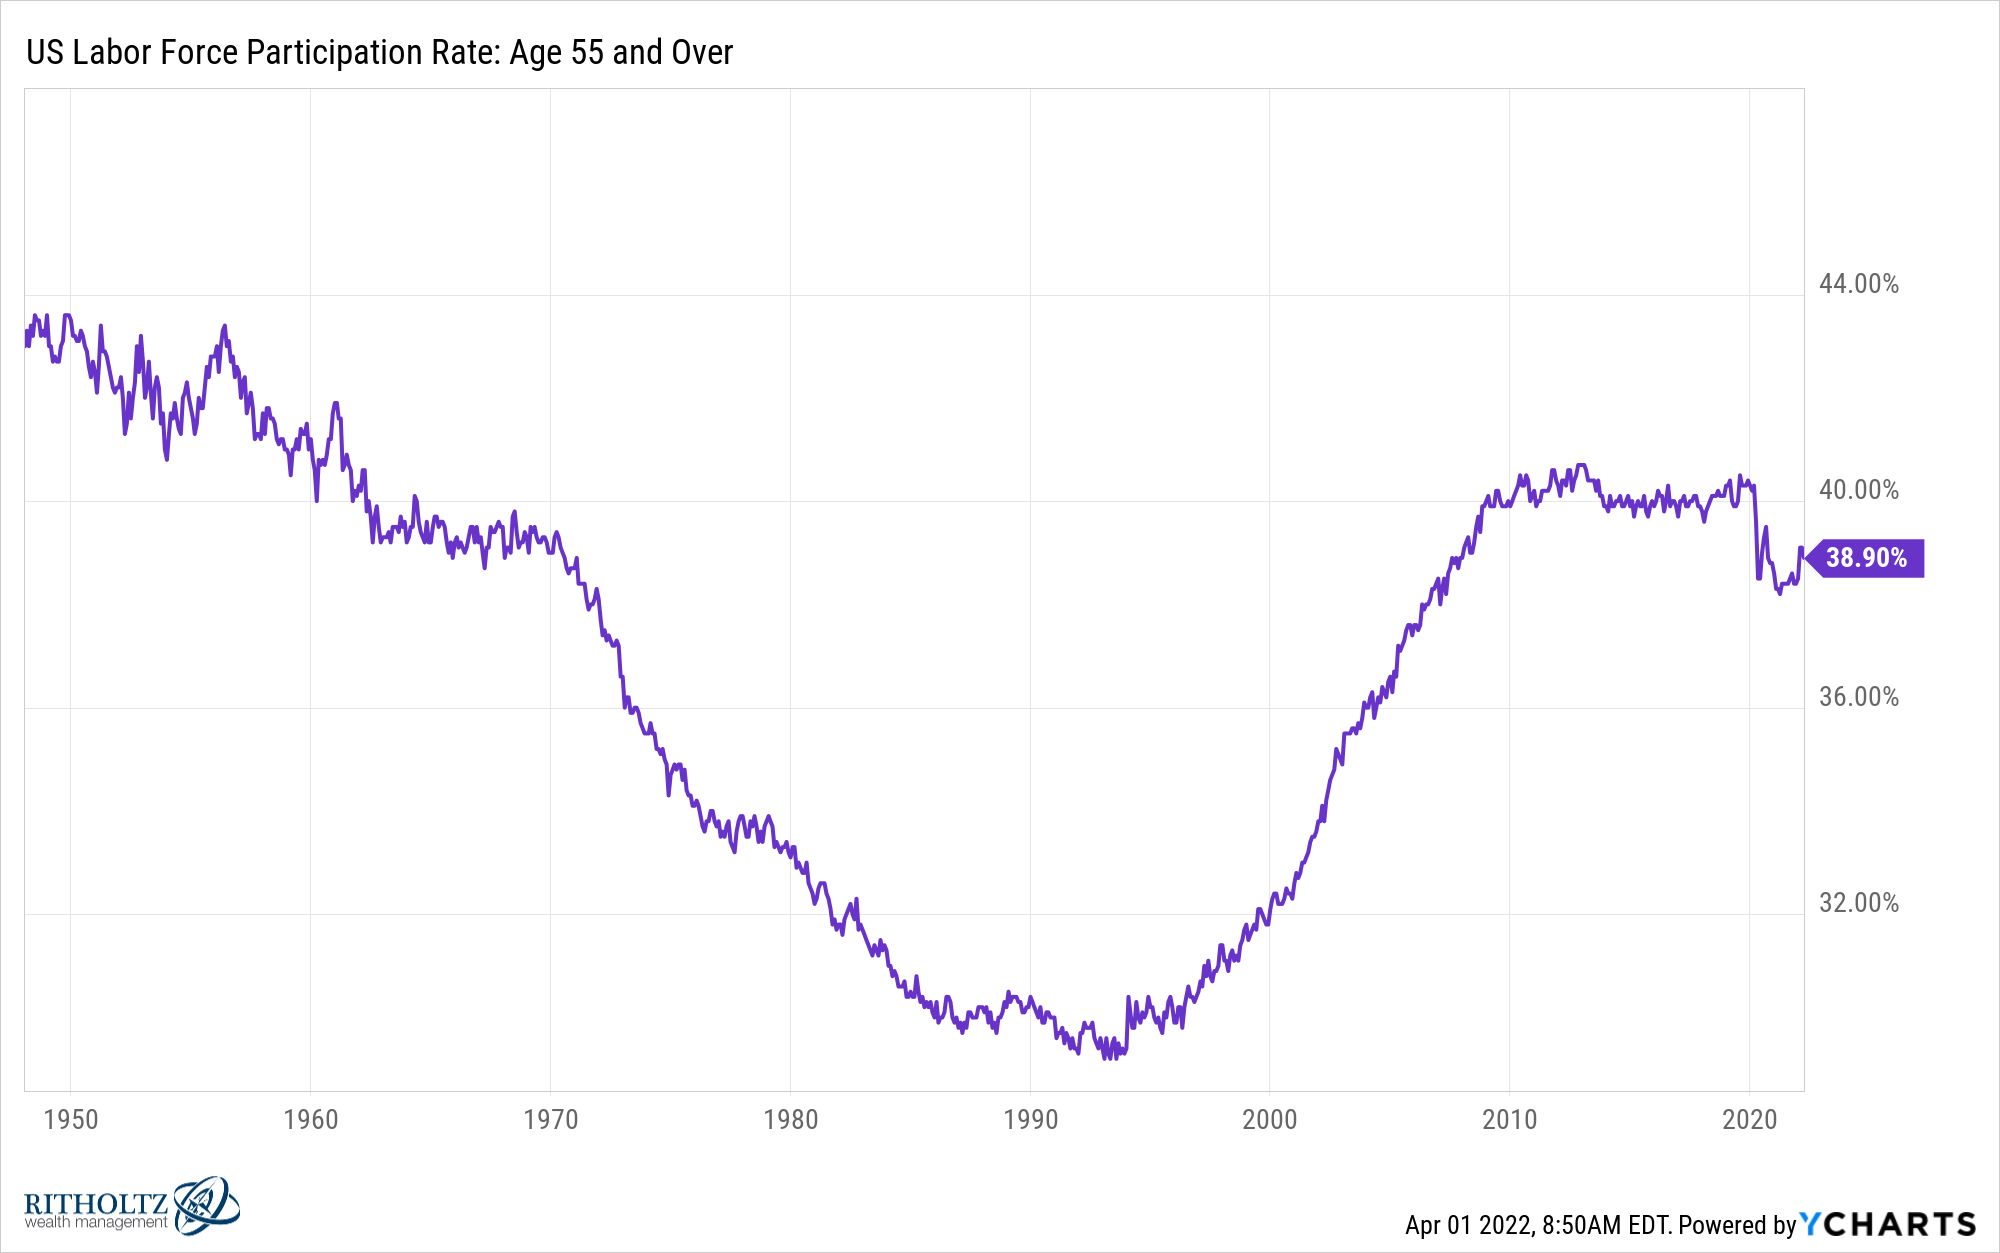
The labor force participation rate for those 55 and older still hasn’t recovered yet but it’s on the rise again and not too far off:
This chart from Bill McBride showing the current job recovery compared to the previous post-WWII recessions is something else:
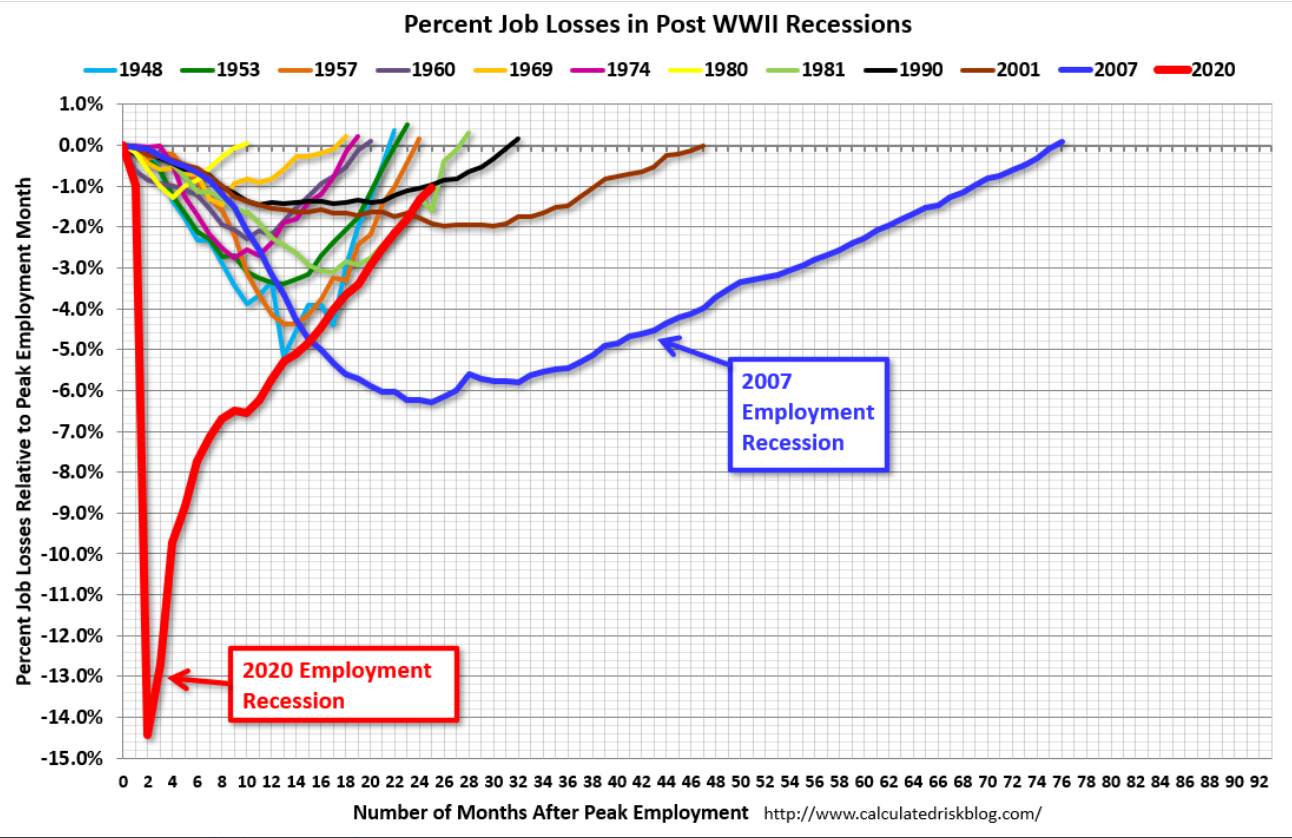
We just added 1.7 million new jobs in the first 3 months of the year alone.
That’s great Ben but what about wages?
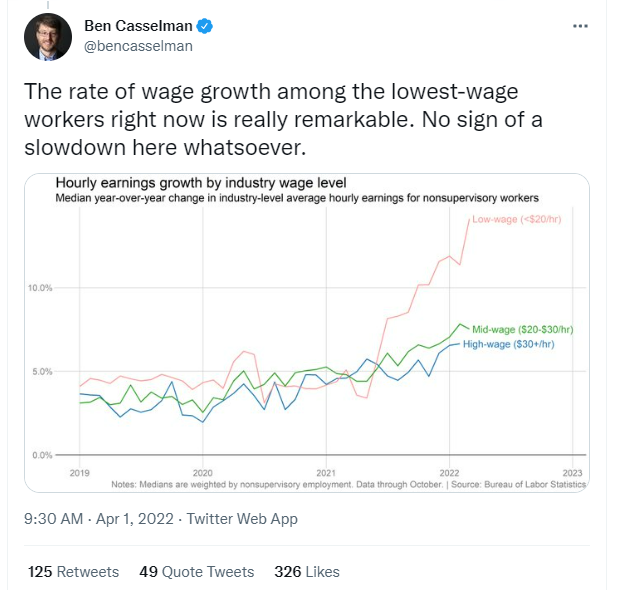
Fair point. There are many workers who are seeing their wages grow but not as fast as the inflation rate. That’s not great.
Surprisingly, people in the lowest-wage group are seeing the highest wage growth. Just look at this chart from Ben Casselman:
Talmon Smith at the New York Times wrote a piece this week about Nebraska, the state with the lowest unemployment rate in the country:
The unemployment rate in Nebraska was 2.1 percent in February, tied with Utah for the lowest in the nation and near the lowest on record for any state. In several counties, unemployment is below 1 percent. Even taking into account adults who have left the work force, the share of the population 16 and older employed in Nebraska is around 68 percent, the nation’s highest figure.
This story about a bartender who’s changing jobs because she keeps getting better offers says it all about who has the upper hand right now:
That included the bartender on the early-evening shift, Nikki Paulk, an easygoing woman with a flash of pink hair. “I’m in hot demand, baby,” she said, mentioning “desperate” employers with a burst of a grin. “I’ve worked at like six bars in the last six months because I just keep getting better offers I can’t turn down.”
Beyond inflation and employers having a hard time staffing up this all seems like a wonderful development. Workers finally have some negotiating power.
The only other potential downside I see here is that there probably isn’t much more room for improvement from here. It’s like we’re rolling up the tube to try and squeeze out that list little bit of toothpaste before moving on to a new tube.
The lowest the unemployment rate has ever gotten in modern economic times was 2.5% in the early-1950s:
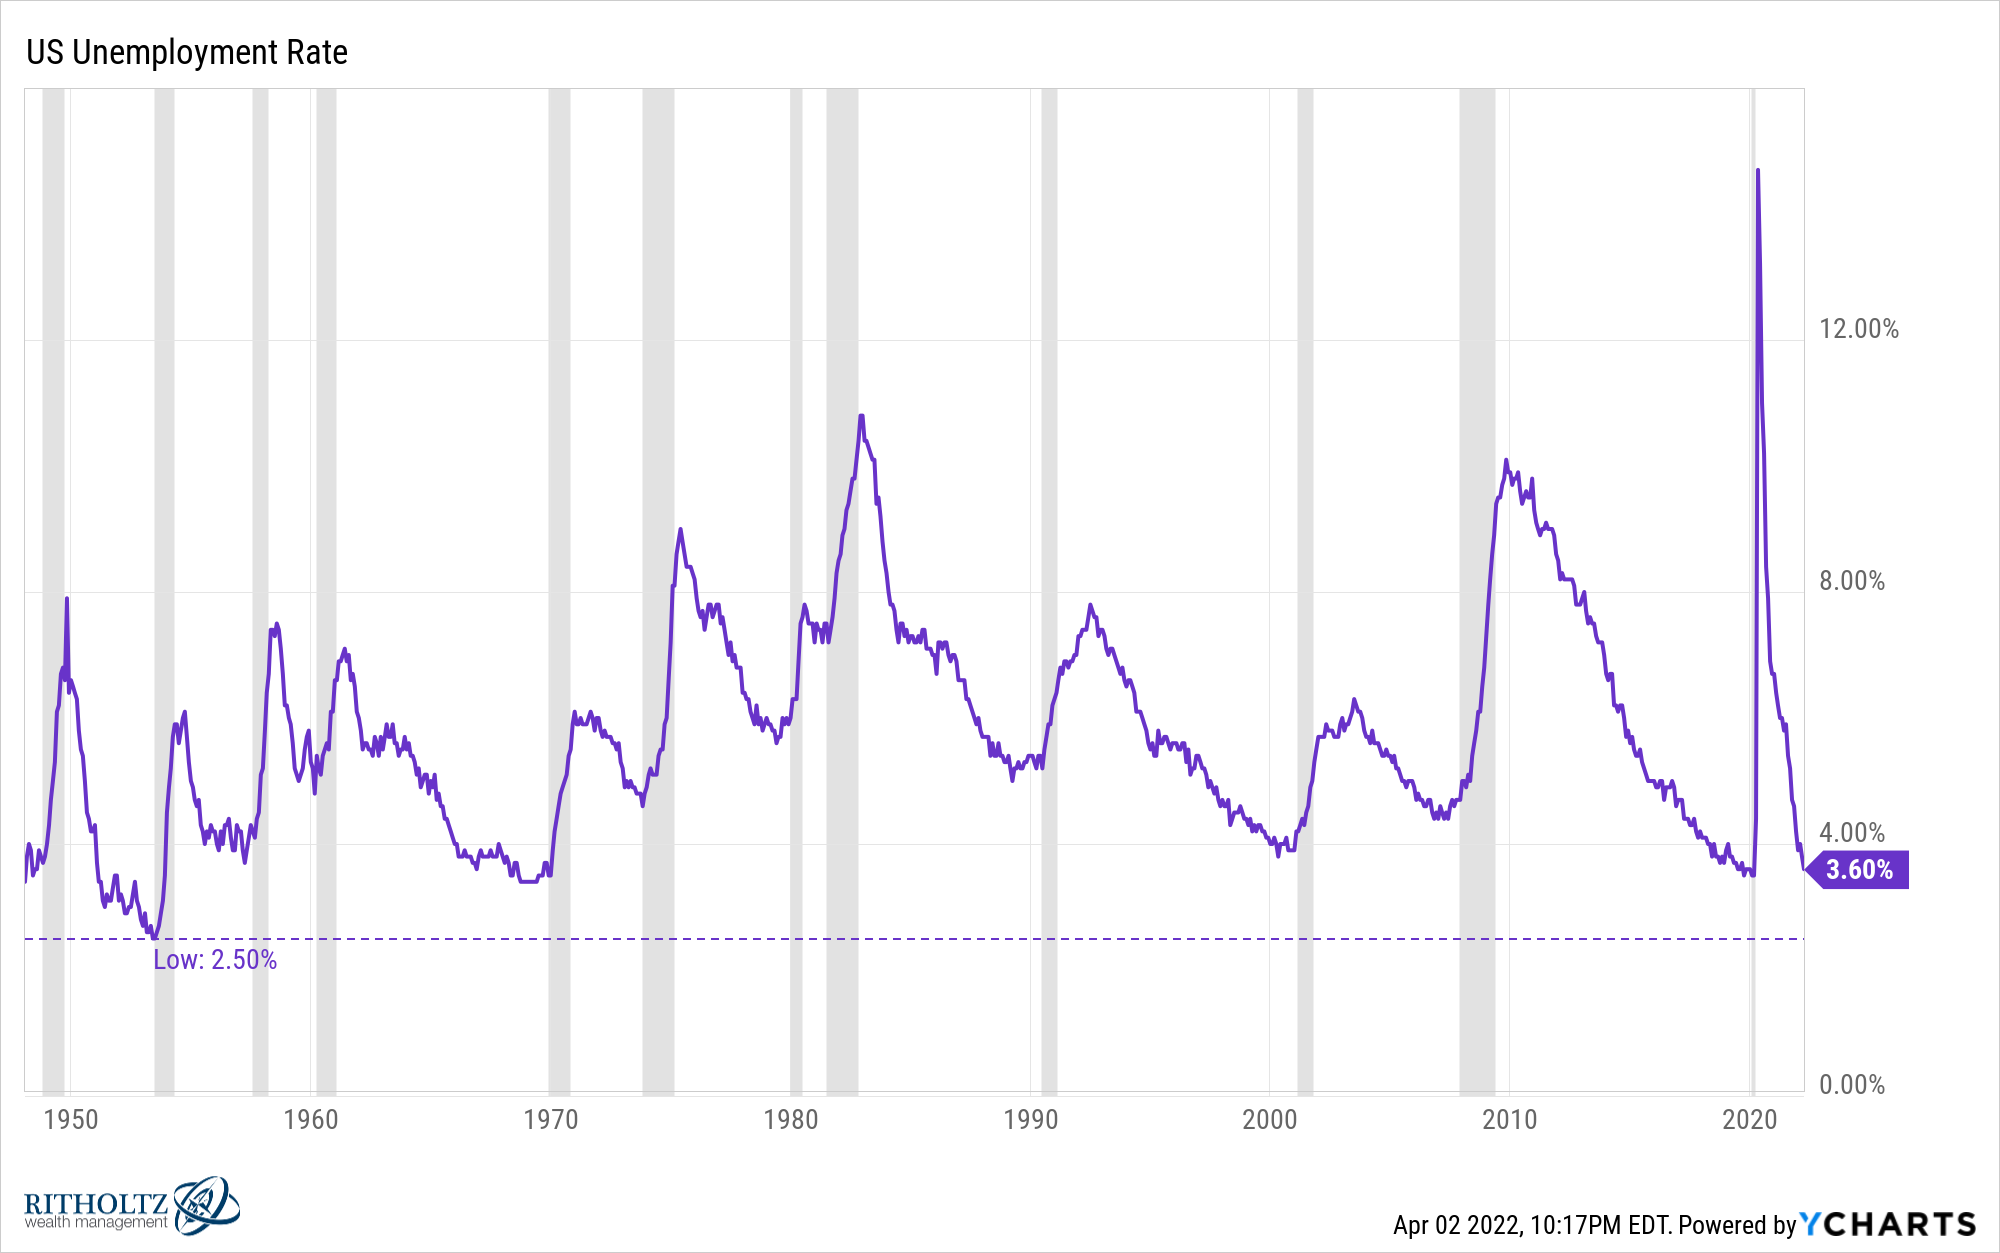
You can also see from this chart that low unemployment rates are typically followed by a recession. Not all recessions start from low levels of the unemployment rate but it makes when you consider recessions tend to come from excesses in the economy.
I’ve looked at the relationship between the unemployment rate and the stock market in the past. Average forward returns are higher when the unemployment rate is higher and lower when the unemployment rate is low.
This also makes sense since unemployment is higher during a recession which is also when the worst bear markets take place.
Buying when the stock market is crashing is a pretty good strategy long-term.
Let’s look at this another way. Going back to 1948, I looked at the worst outcomes for the S&P 5002 from different unemployment rate ranges:
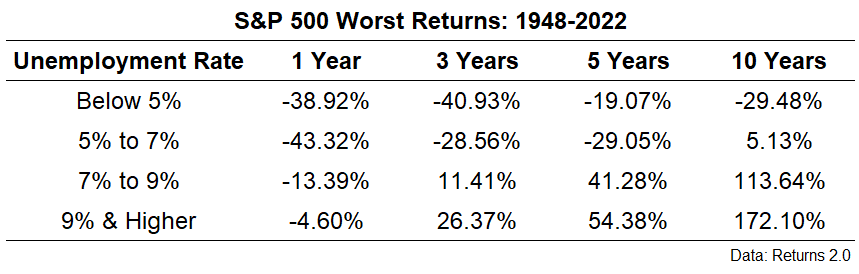
Again this is the worst-case scenario so this is not the base case but you can see a clear relationship in the data here.
The potential for poor outcomes in the stock market is greater when the unemployment rate is low. Investing when the unemployment rate is high is actually much safer.
I’m not saying this means a recession is imminent.
Recessions are easy to predict except for the timing, magnitude and length part.
With labor markets so strong, it’s possible this recovery could keep going for a few more years. Who knows?
And even if we do go into a recession in the coming months or years there’s no way to tell how the stock market will react.
My point is that sometimes markets and the economy are counterintuitive.
The good times and the bad times never last forever.
Further Reading:
How to Prepare for a Recession
1The growth in this chart since the 1950s is also crazy.
2These are total returns including dividends using monthly returns.
