As seen in the table below, the four-year period November 2016-October 2020 could be described as a “dark winter” for value stocks. U.S. value stocks underperformed U.S. growth stocks by 16.81 percentage points per annum (20.35% vs. 3.54%), the largest historical drawdown for value stocks in the U.S.—even greater than the during the dot-com bubble of the late 1990s. While the value premium’s drawdown was not as great in the rest of the world, outside the U.S. value stocks underperformed by a wide margin, 9.67 percentage points per annum (10.68% vs. 1.01%).
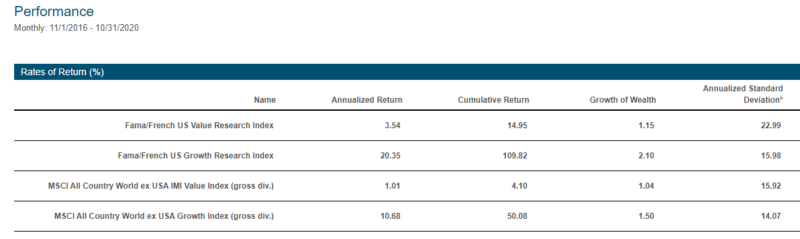
The massive drawdown led many investors to declare the death of the value premium, arguing that the trade had become “overcrowded” post-publication of the findings of a historically large value premium. However, academic research, including the 2017 study “Are Exchange-Traded Funds Harvesting Factor Premiums?” and the 2018 study “Characteristics of Mutual Fund Portfolios: Where Are the Value Funds?,” found that neither mutual funds nor ETFs systematically tilted their portfolios toward value stocks or, for that matter, to other profitable factors such as high momentum, small size, high profitability, and low investment growth.
It’s easy to show that the value premium was not overcrowded by looking at the spread in valuations between value and growth stocks. Using a composite value measure that includes P/B, P/E, price-to-forecasted earnings, and sales-to-enterprise value, AQR calculated an industry- and dollar-neutral value spread measure. The chart below shows that the four-year dark winter for value occurred mostly because the valuation spread between value and growth stocks widened dramatically, reaching levels only seen during the dot-com bubble.
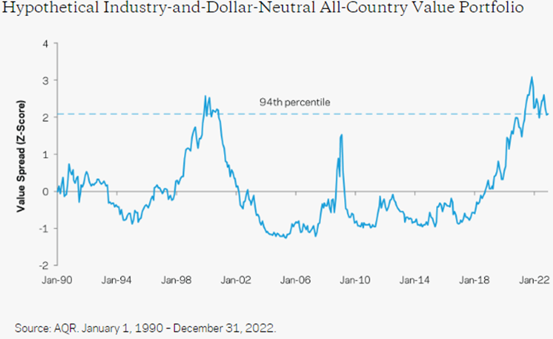
Valuations Spreads Provide Information
The research, including the 2018 study “Macro-Finance and Factor Timing: Time-Varying Factor Risk and Price of Risk Premiums” and the 2019 studies “Value Return Predictability Across Asset Classes and Commonalities in Risk Premia” and “Strategies Can Be Expensive Too! The Value Spread and Asset Allocation in Global Equity Markets,” has found that the value spread is a powerful and robust predictor of strategy returns. Given that the valuation spread had passed the 90th percentile (in 90% of the periods, the spread was narrower), investors should not have abandoned their belief in a value premium because there was a dark winter. Instead, they should have expected the likelihood of a larger than historical value premium going forward. Note that the spread reached its historical high around the end of the dark winter for value stocks—it’s darkest before the dawn.
And that is what happened. From November 2020 through December 2022, value stocks outperformed growth stocks in the U.S. by 27.43 percentage points per annum (30.71% vs. 3.28%). Outside the U.S., they outperformed by 13.94 percentage points per annum (11.29% vs. ‑2.65%).
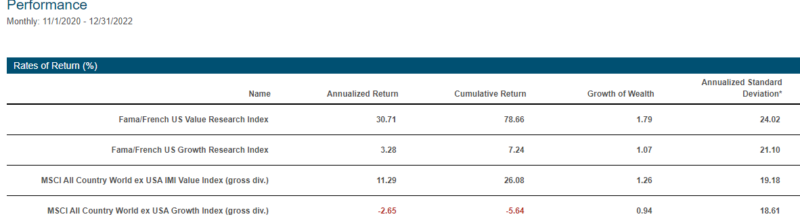
Despite their dramatic outperformance over the period, value stocks around the globe are still trading at about the 94th percentile of cheapness—suggesting the likelihood of a much larger than historical value premium going forward.
Thanks to the research team at Verdad, we can examine how the value factor performed following bouts of underperformance. Using data from Ken French’s library, they specifically examined the rolling three-year returns to the value premium in Europe. As the chart below shows, up until the decade of near-zero interest rates began in 2008, bouts of underperformance in value relative to growth were followed by relatively long periods of outperformance in value. And after the previous tech bubble burst in 2000, value’s outperformance was the strongest.
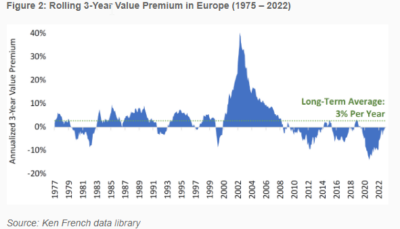
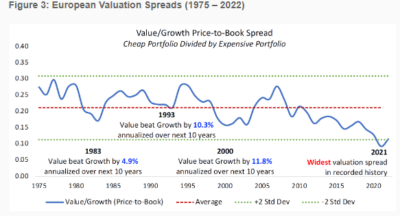
Given that the era of financial repression appears to be over (we seem to be returning to a more normal rate environment) and that valuation spreads remain at historically extreme levels, it seems likely that value stocks could be on the cusp of a winning stretch similar to the 1980s, 1990s or the 2000s. In other words, the rally that began in November 2020 may be just the tip of the iceberg, as wide divergences between the valuations of cheap stocks relative to expensive stocks have preceded significant outperformance for value over the subsequent decade, as shown in the figure below.
Investor Takeaways
For value investors, the above findings are good news, as the largest historical drawdown for the value premium from November 2016 through October 2020 led to a dramatic widening of the book-to-market spread between value and growth stocks. Even with the strong performance of the value premium since then, the spread is still much wider than its historical average and much wider than it was when Eugene Fama and Kenneth French published their famous study “The Cross-Section of Expected Stock Returns” in 1992. Thus, the expectation is that the value premium will be larger than its historical average.
For informational and educational purposes only and should not be construed as specific investment, accounting, legal, or tax advice. Certain information is based upon third party data which may become outdated or otherwise superseded without notice. Third party information is deemed to be reliable, but its accuracy and completeness cannot be guaranteed. Indices are not available for direct investment. Their performance does not reflect the expenses associated with the management of an actual portfolio nor do indices represent results of actual trading. Information from sources deemed reliable, but its accuracy cannot be guaranteed. By clicking on any of the links above, you acknowledge that they are solely for your convenience, and do not necessarily imply any affiliations, sponsorships, endorsements or representations whatsoever by us regarding third-party websites. We are not responsible for the content, availability or privacy policies of these sites, and shall not be responsible or liable for any information, opinions, advice, products or services available on or through them. The opinions expressed by featured authors are their own and may not accurately reflect those of Buckingham Strategic Wealth® or Buckingham Strategic Partners®, collectively Buckingham Wealth Partners. Neither the Securities and Exchange Commission (SEC) nor any other federal or state agency have approved, determined the accuracy, or confirmed the adequacy of this article. LSR-22-451

About the Author: Larry Swedroe
—
Important Disclosures
For informational and educational purposes only and should not be construed as specific investment, accounting, legal, or tax advice. Certain information is deemed to be reliable, but its accuracy and completeness cannot be guaranteed. Third party information may become outdated or otherwise superseded without notice. Neither the Securities and Exchange Commission (SEC) nor any other federal or state agency has approved, determined the accuracy, or confirmed the adequacy of this article.
The views and opinions expressed herein are those of the author and do not necessarily reflect the views of Alpha Architect, its affiliates or its employees. Our full disclosures are available here. Definitions of common statistics used in our analysis are available here (towards the bottom).
Join thousands of other readers and subscribe to our blog.