


Abstract
West Virginia consistently ranks in the top two nationally for per capita antibiotic prescription rates in both pediatric and adult outpatient populations. We present the first descriptive analysis evaluating outpatient prescription rates within the WV pediatric Medicaid population, which demonstrated significant antibiotic prescribing variability by provider type, specialty, and geography.
West Virginia (WV) consistently ranks in the top two nationally for per capita antibiotic prescription rates [1]. Border states also considered part of Appalachia such as Kentucky, Ohio, and Tennessee are affected by similar barriers to health care, comparably ranking within the top 10 for highest outpatient antibiotic prescriptions rates [1]. With overuse and misuse of antibiotics as primary drivers of antimicrobial resistance [2, 3], it remains imperative to develop novel, evidence-based strategies to reduce this significant public health risk throughout this region.
Inpatient antimicrobial stewardship programs (ASPs) decrease inappropriate antimicrobial prescribing and have helped reduce cost burden, patient morbidity/mortality, and infections caused by multidrug-resistant (MDR) pathogens [4, 5]. However, optimal outpatient stewardship strategies remain understudied and likely vary by provider setting and patient population [5–9].
Our research team collaborated with the WV Medicaid Drug Utilization Review (DUR) Team to better understand the factors associated with high outpatient antibiotic prescribing in WV. Annual census data consistently report WV as the state with the highest (~30%) share of total residents enrolled in Medicaid assistance with greater than 50% of all pediatric residents receiving Medicaid services [10]. To date, there are no published analyses of WV Medicaid antibiotic prescribing data in pediatric or adult populations. We hypothesized that geography and provider type would help predict some extent of antibiotic overuse; we intend to use these data to inform effective and sustainable outpatient stewardship.
METHODS
Study Population
We performed a cross-sectional analysis of all WV pediatric Medicaid outpatient pharmacy and medical claims during the calendar years (CYs) 2018 and 2019. Unique patients (denominator of rate calculations) were selected from Medicaid claims where the patient had a medical claim date of service in the CYs of the study and were <20 years of age as of December 31st of the same year. Children who were openly enrolled but did not have any medical or pharmacy claims in the CY were excluded. CYs 2018 and 2019 were analyzed separately for comparison and to examine trends over time.
Data Source
Pharmacy claims were selected based upon the pharmacy drug classes (National Drug Code), which included fields for Medicaid identification number, age, sex, patient zip code, date of service, provider specialty, and estimated prescription cost to Medicaid.
Provider specialty classifications were based on preexisting categories within the pharmacy claims and included the following designations: physician (medical doctor [MD] or doctor of osteopathy [DO]), nurse practitioner (NP), or physician assistant (PA). Physicians, NPs, and PAs were further classified by specialty including pediatric (eg, pediatricians) and non-pediatric (eg, family practice practitioners, internal medicine practitioners, emergency medicine [EM] practitioners, etc.) categories. Dental claims were excluded.
Narrow-spectrum antibiotics were defined as all first-generation cephalosporins, amoxicillin, dicloxacillin, and penicillin; all other antibacterials were labeled as broad-spectrum [4–9]. Non-oral antibiotics were excluded outside of a separate total cost evaluation. Antifungals and antivirals were also excluded.
We also linked medical claims for common outpatient pediatric infectious diagnoses with corresponding pharmacy claims within the subsequent 3 days, which included acute sinusitis (AS), acute otitis media (AOM), acute pharyngitis (AP), acute upper respiratory tract (AURI), acute lower respiratory tract infection (ALRI)/pneumonia, acute bronchitis (AB), skin and soft tissue infection (SSTI), and urinary tract infection (UTI). See Supplementary Table 1 for International Classification of Diseases (ICD) 10 diagnosis codes included for this study. Prescriptions without a medical claim within 3 days were excluded from the indication analysis.
Statistical Analysis
Rates of antibiotic prescribing were calculated as the number of prescriptions per 1000 children enrolled in WV Medicaid and stratified by age, sex, race/ethnicity, provider type/specialty, and geography. Geographic information system (GIS) mapping was used to depict geographic variation in prescribing by county and West Virginia Medicaid Region (WVMR). Common outpatient infectious diagnoses rates were calculated as the number of prescriptions per 1000 children who received a corresponding ICD 10 infectious diagnosis code within the Healthcare Cost and Utilization (HCUP) Clinical Classifications Software Refined (CCSR) aggregates [11]. See Supplementary Methods for more details regarding the analysis.
RESULTS
In CY 2018, 204606 WV pediatric Medicaid patients received 234482 antibiotic prescriptions (1146 prescriptions/1000 children). In 2019, 201925 WV pediatric Medicaid patients received 224847 antibiotic prescriptions (1114 prescriptions/1000 children) (Table 1). Non-physician, non-pediatric specialists accounted for most prescriptions (55% and 58% in 2018 and 2019, respectively). Of the oral antibiotics prescribed, narrow-spectrum were most frequent across both CYs. Total prescriptions and prescription rates were greatest among children of Caucasian/non-Hispanic race/ethnicity, females, and those living in “rural” Rural-Urban Continuum Code (RUCC) category [12] and WVMR 4. Prescription rates were greatest within the 0-2 years age range for both CYs.
WV Pediatric (<20 years) Medicaid Patient Population Demographics Summary by CY
| CY 2018 | CY 2019 | |||||||
|---|---|---|---|---|---|---|---|---|
| Patients | Rxs | % | Rate per 1000 | Patients | Rxs | % | Rate per 1000 | |
| Total (all WV Medicaid claims) | 204606 | 234482 | 1146 | 201925 | 224847 | 1114 | ||
| Age groupings (years)a | ||||||||
| 0-2 | 34732 | 48719 | 20.8 | 1403 | 33964 | 45642 | 20.3 | 1344 |
| 3-9 | 75220 | 91328 | 39.0 | 1214 | 73223 | 87828 | 39.1 | 1199 |
| 10-19 | 94654 | 94435 | 40.3 | 998 | 94738 | 91377 | 40.6 | 965 |
| Sex | ||||||||
| Female | 101040 | 125941 | 53.7 | 1246 | 99664 | 120274 | 53.5 | 1207 |
| Male | 103564 | 108541 | 46.3 | 1048 | 102261 | 104573 | 46.5 | 1023 |
| Race/ethnicity | ||||||||
| African American/non-Hispanic | 25039 | 25570 | 10.9 | 1021 | 25607 | 26333 | 11.7 | 1028 |
| Caucasian/non-Hispanic | 151606 | 180770 | 77.1 | 1192 | 148341 | 172010 | 76.5 | 1160 |
| Otherb | 27961 | 28142 | 12.0 | 1006 | 27977 | 26504 | 11.8 | 947 |
| Provider type/Specialty | ||||||||
| Physician/Pediatrics | 39983 | 17.1 | 38349 | 17.1 | ||||
| Physician/Other Specialtyc | 59501 | 25.4 | 51759 | 23.0 | ||||
| Other Providerc/Pediatrics | 5278 | 2.3 | 4912 | 2.2 | ||||
| Other Provider/Other Specialty | 129720 | 55.3 | 129827 | 57.7 | ||||
| Spectrum of antibiotic coverage | ||||||||
| Broad-spectrum | 107551 | 45.9 | 100847 | 44.9 | ||||
| Narrow-spectrum | 126931 | 54.1 | 124000 | 55.2 | ||||
| Geographic location (WVMR) | ||||||||
| WVMR 1 | 47304 | 48842 | 20.8 | 1033 | 46838 | 48056 | 21.4 | 1026 |
| WVMR 2 | 54472 | 61819 | 26.4 | 1135 | 54701 | 60100 | 26.7 | 1099 |
| WVMR 3 | 49469 | 52425 | 22.4 | 1060 | 49461 | 49554 | 22.0 | 1002 |
| WVMR 4 | 46291 | 65027 | 27.7 | 1405 | 46048 | 63314 | 28.2 | 1375 |
| Geographic location (population density)d | ||||||||
| Rural | 28457 | 36373 | 1278 | 28114 | 34674 | 1233 | ||
| Suburban | 55289 | 71784 | 1298 | 54487 | 68402 | 1255 | ||
| Urban | 120230 | 125398 | 1043 | 118827 | 121205 | 1020 | ||
Abbreviations: CY, calendar year; DO, doctor of osteopathy; MD, medical doctor; NPs, nurse practitioners; PAs, physician assistants; WV, West Virginia; WVMR, West Virginia Medicaid Region.
Age for patients as of December 31st of claim year; for prescription (Rx), at date of service (DOS).
“Other” includes Alaskan Natives and American Islanders race categories in addition to all those with Hispanic ethnicity.
“Other specialty” = any non-pediatric specialty; “Other provider” = non-MD, non-DO providers including NPs and PAs.
Based upon Rural-Urban Continuum Codes (RUCC) [12].
In addition to highest prescription rates, WVMR 4 totaled the largest spending of the four WVMRs (Figure 1). County-specific prescription rates across CYs provide a more granular display of WVMR data (Figure 1a and b). Notably, >80% (45 of total 55 counties) of WV counties have prescriptions rates >1000, 15% (7 of 45 counties) of which have rates >1500. WVMRs 2 and 4 demonstrated >$1000000 in spending for both CYs while WVMRs 1 and 3 total >$900000 (Figure 1c and d). Total WV Medicaid spending on outpatient oral antibiotics alone exceeded $4000000 across CYs (Supplementary Table 2); when all antibiotic types (oral and non-oral) were included, total WV Medicaid spending on its pediatric population increases to >$7000000. This averages to ~$18.00 per oral antibiotic prescription with numerous patients included in this cohort having >1 prescription across a CY.
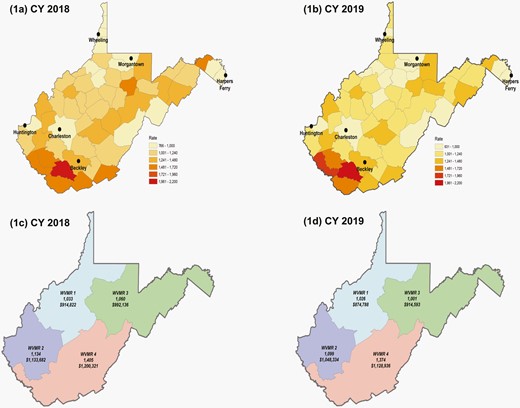
GIS mapping of prescription rates per 1000 WV children on Medicaid by county and WVMR, CY 2018 (a, c) and 2019 (b, d). Total oral antibiotic cost by WVMR also included (b, d). Colors are only representative of different WVMRs for both c and d. Abbreviations: GIS, geographic information system; WV, West Virginia; WVMR, West Virginia Medicaid Region.
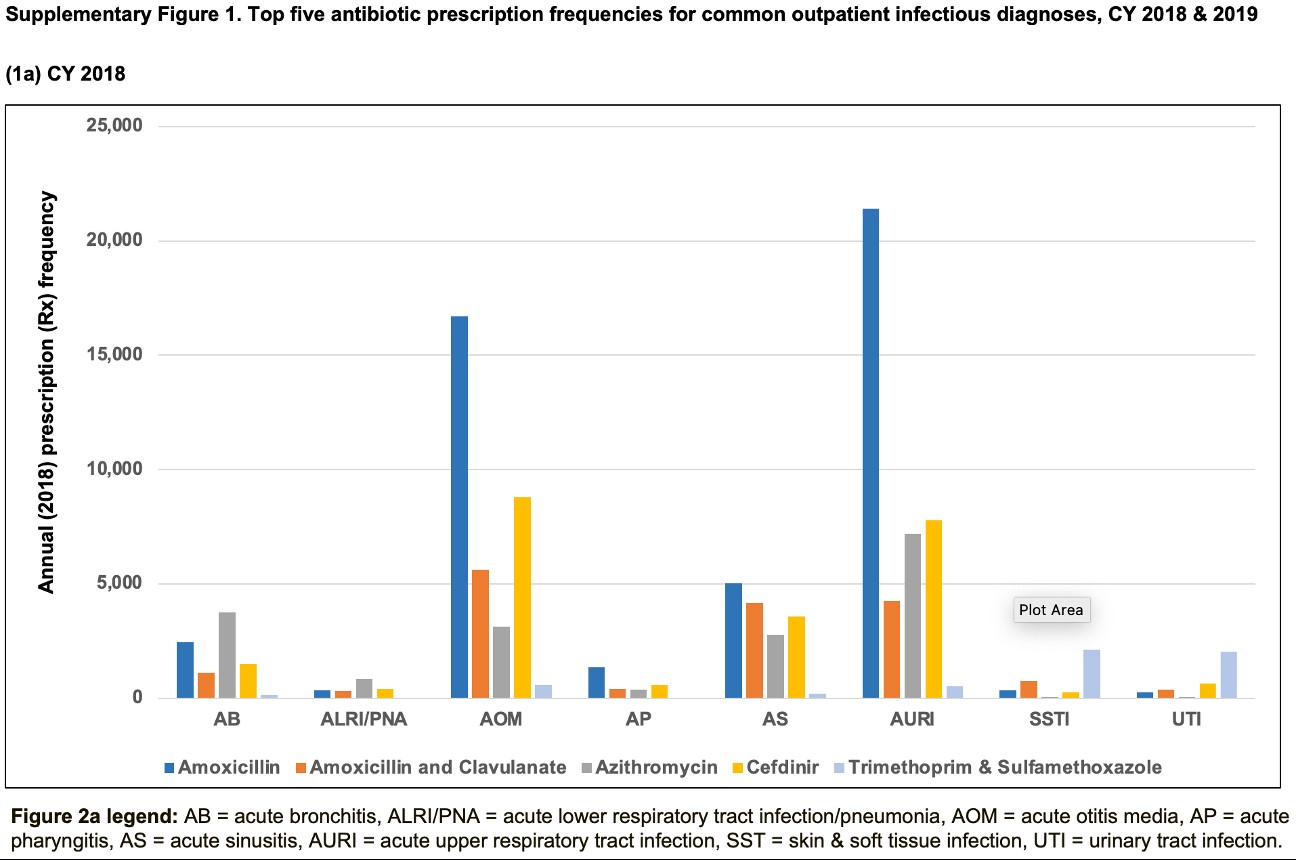
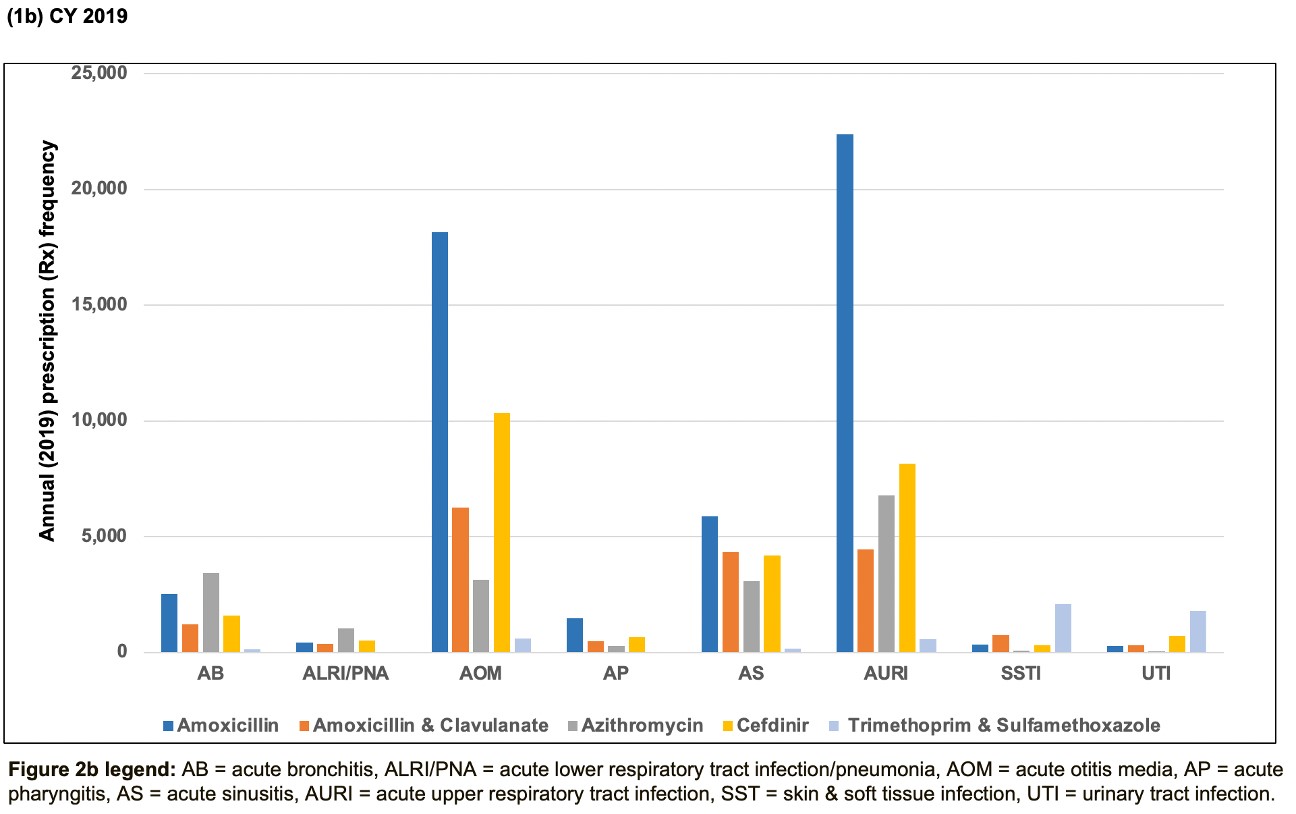
Amoxicillin, cefdinir, azithromycin, amoxicillin-clavulanate, and trimethoprim-sulfamethoxazole (TMP-SMX) were the most prescribed antibiotics accounting for >75% of both frequency and cost (Supplementary Table 3). The top 10 most prescribed oral antibiotics account for >97% frequency and >95% of the total cost across both CYs.
Amoxicillin was the most frequently prescribed oral antibiotic for AOM, AS, AP, and AURI in each year whereas cefdinir was the second-most frequently prescribed for AOM and AURI (Supplementary Figure 1a and b). Azithromycin was the most prescribed oral antibiotic for AB and ALRI, whereas TMP-SMX was the most prescribed oral antibiotic for both SSTI and UTI. UTI, acute sinusitis (AS), and AOM were associated with the highest diagnosis-specific antibiotic prescription rates across both CYs, all being >670 per 1000 diagnoses (eg, received an antibiotic at least 67% of the time per infectious diagnosis). All other included infectious diagnoses were associated with rates <660 per 1000 with ALRI being the lowest across both CYs.
DISCUSSION
We found that outpatient antibiotic prescription rates in pediatric patients covered by WV Medicaid are substantially above national average with average rates >1000 prescriptions/1000 patients; thus, children receiving Medicaid assistance are on average receiving >1 antibiotic prescription per year, and in some areas, closer to 2 per year. These findings are consistent with CDC data across the entire WV outpatient population including all ages and insurance coverages [1]. We identified patient, provider, and geographic variability in prescription across the state. Notably, non-physician, non-pediatric providers wrote the majority of prescriptions as compared to physician and pediatric specialty counterparts. This finding is consistent with published reports from neighboring states [7–9]. While our methodology is similar to these prior reports, our direct collaboration with the WV Medicaid DUR Team is unique and allows timely access to prescription data that is more conducive to prospective audit and feedback at the state level. Furthermore, the DUR team already has processes in place for provider feedback for other medications such as opiates and psychotropics. This existing quality framework can be leveraged for outpatient antimicrobial stewardship efforts moving forward.
Secondary analysis revealed an alarmingly high rate of broad-spectrum antibiotic prescriptions compared to narrow-spectrum. While we did not account for prior antibiotic exposure and/or penicillin allergy that may have led to appropriate use of broader-spectrum therapy, these remain unlikely explanations for such drastically high rates of broad-spectrum, non-penicillin oral antibiotic use in this patient cohort.
The dynamics that result in over-prescribing are complex and likely involve multiple factors beyond medicine including intricate social constructs that affect provider-patient interactions. Our findings provide the framework for impactful stewardship interventions through data-driven outreach strategies. Our group intends to host individualized educational sessions including de-identified provider comparison targeting non-physician, non-pediatric providers in WVMR 4 as a major focus in reducing outpatient oral antibiotic overuse and potential misuse in WV.
Study limitations include data that are only representative of children insured by WV Medicaid and may not be generalizable to other patient populations. We were unable to report rates of prescribing at the provider level because only pharmacy claims (ie, visits associated with a prescription) contain provider-level characteristics such as provider type and specialty. Diagnosis-specific prescription rates provide more granular insight into guideline-based prescribing, although were grouped by CCSR aggregate for analysis [11], which could affect overall rates. This study did not specifically evaluate the appropriateness of antibiotic prescriptions, but future studies analyzing guideline concordance could be quite beneficial to ongoing stewardship interventions.
Notes
Author contribution. J. T. K. conceived the paper, wrote the manuscript, and is the primary author of this paper. M. M. L. helped conceive the paper’s design and was a co-author and an editor for this paper. J. M. W. completed primary data analysis and contributed to manuscript preparation. M. J. M. reviewed primary data analysis, contributed to manuscript preparation, and was an editor for this paper. J. B. B. was a co-author and an editor for this paper. J. E. E. helped conceive the paper’s design and was a co-author and an editor for this paper. M. J. S. was the primary faculty mentor for this T32-sponsored project, helped conceive the paper’s design, and was a co-author and an editor for this paper.
Financial support. This work was supported by the Ruth L. Kirschstein National Research Service Award Institutional Research Training Grant [5T32AI007062-41], JW Sleasman, PI, JT Kilgore, Fellow Trainee.
Potential conflicts of interest. All authors: No reported conflicts. All authors have submitted the ICMJE Form for Disclosure of Potential Conflicts of Interest. Conflicts that the editors consider relevant to the content of the manuscript have been disclosed. This work was considered exempt by Marshall University IRB.
