


Abstract
Increased illness due to antigenically drifted A(H3N2) clade 3C.3a influenza viruses prompted concerns about vaccine effectiveness (VE) and vaccine strain selection. We used US virologic surveillance and US Influenza Vaccine Effectiveness (Flu VE) Network data to evaluate consequences of this clade.
Distribution of influenza viruses was described using virologic surveillance data. The Flu VE Network enrolled ambulatory care patients aged ≥6 months with acute respiratory illness at 5 sites. Respiratory specimens were tested for influenza by means of reverse-transcriptase polymerase chain reaction and were sequenced. Using a test-negative design, we estimated VE, comparing the odds of influenza among vaccinated versus unvaccinated participants.
During the 2018–2019 influenza season, A(H3N2) clade 3C.3a viruses caused an increasing proportion of influenza cases. Among 2763 Flu VE Network case patients, 1325 (48%) were infected with A(H1N1)pdm09 and 1350 (49%) with A(H3N2); clade 3C.3a accounted for 977 (93%) of 1054 sequenced A(H3N2) viruses. VE was 44% (95% confidence interval, 37%–51%) against A(H1N1)pdm09 and 9% (−4% to 20%) against A(H3N2); VE was 5% (−10% to 19%) against A(H3N2) clade 3C.3a viruses.
The predominance of A(H3N2) clade 3C.3a viruses during the latter part of the 2018–2019 season was associated with decreased VE, supporting the A(H3N2) vaccine component update for 2019–2020 northern hemisphere influenza vaccines.
(.)
Influenza viruses evolve rapidly, evading the human immune response. Emergence of antigenically drifted viruses requires updating vaccine components to provide optimal antigens. Recent evolution of A(H3N2) viruses has proved particularly challenging for vaccine strain selection as antigenic characterization of circulating A(H3N2) viruses has become more difficult and candidate vaccine viruses acquire antigenic changes during propagation in chicken eggs, which are used to produce most influenza vaccines. Vaccine strain selection requires analysis of circulating viruses from many geographic regions, prediction of predominant or emerging clades, generation of candidate vaccine viruses, and identification of those that generate a broadly protective response. To select vaccine reference strains, the World Health Organization (WHO) convenes technical consultations each February for northern hemisphere vaccines and each September for southern hemisphere vaccines to review data from global influenza surveillance systems, antigenic and genetic characterization, and potential candidate vaccine viruses [1].
The selection of vaccine viruses begins the process of producing, testing, and distributing the seasonal vaccine [2]. Delayed strain selection and changes in vaccine components may both cause delays in subsequent manufacturing and distribution processes. During the February 2019 consultation, WHO recommended updating the A(H1N1) component from A/Michigan/45/2015 to A/Brisbane/02/2018 and maintaining B vaccine reference viruses for the 2019–2020 northern hemisphere influenza vaccine [3]. For the first time since 2005 [4], the selection of the A(H3N2) component was delayed to obtain additional data on changes in the distribution of A(H3N2) viruses, with increased activity due to A(H3N2) clade 3C.3a in some regions, and enable complete characterization of new clade 3C.3a candidate vaccine viruses. On 21 March 2019, WHO recommended a clade 3C.3a virus as the A(H3N2) component of the 2019–2020 northern hemisphere vaccines [5], which was a change from the 2018–2019 A(H3N2) vaccine virus (subclade 3C.2a1) [6].
During the 2018–2019 influenza season in the United States, A(H1N1)pdm09 viruses were predominant in most regions early in the season [7], but from February to March 2019, illness due to A(H3N2) infections substantially increased, prompting the Centers for Disease Control and Prevention (CDC) to issue a health alert [8]. Antigenic characterization of A(H3N2) viruses circulating after February 2019 indicated that most reacted poorly (≥8-fold reduction in titer compared with homologous virus) with ferret antisera to cell culture–propagated A/Singapore/INFIMH-16–0019/2016 (subclade 3C.2a1), the A(H3N2) component of 2018–2019 northern hemisphere influenza vaccines [9].
We assessed virologic surveillance data from public health laboratories throughout the United States, which identified increased prevalence of A(H3N2) clade 3c.3a among influenza specimens submitted for genetic characterization. To examine the epidemiologic consequences of increasing prevalence of antigenically distinct A(H3N2) viruses in the United States, we analyzed data from the US Influenza Vaccine Effectiveness (Flu VE) Network, a multisite influenza research network that evaluates protection conferred by vaccination against influenza-associated illnesses in the ambulatory care setting. We used genetic data from viruses obtained from influenza-positive patients to calculate vaccine effectiveness (VE) against clade 3C.3a, which was not included in the 2018–2019 influenza vaccine.
METHODS
US Virologic Surveillance
Distribution of influenza viruses and A(H3N2) clades in the United States before and during the 2018–2019 influenza season was examined using viruses identified at US public health laboratories from 30 September 2018 through 18 May 2019 and submitted to the CDC for virus characterization [7]. For genetic characterization, the CDC requested that state public health laboratories submit 2 influenza A(H3N2)-positive specimens, 2 influenza A(H1N1)pdm09-positive specimens, and up to 4 influenza B–positive specimens every 2 weeks throughout the season. Genetic characterization was used to determine genetic group and clade based on hemagglutinin sequence [1].
We evaluated VE against influenza-associated illnesses in the Flu VE Network based on enrollment from 23 November 2018 through 3 May 2019. Details of this network have been described elsewhere [10, 11]. Study enrollment began after local surveillance identified increasing weekly influenza activity or ≥1 laboratory-confirmed case of influenza per week for 2 consecutive weeks. Eligible participants were patients aged ≥6 months receiving ambulatory medical care for acute respiratory illness with cough of ≤7 days in duration at 1 of 59 health facilities in Michigan, Pennsylvania, Texas, Washington, or Wisconsin. Patients who had received antivirals for their current illness, were aged <6 months as of 1 September 2018, or had enrolled in the study within the previous 14 days were ineligible. Study staff obtained informed consent from patients (parent/guardian for minors) and interviewed patients regarding demographics, self-reported health status, symptoms, and receipt of the current season’s influenza vaccine.
Laboratory Methods
At enrollment, study staff collected combined nasal and oropharyngeal swab specimens (nasal swab specimens only for children aged <2 years). Specimens were tested for influenza viruses using real-time reverse-transcriptase polymerase chain reaction (RT-PCR) [11]. Specimens were first tested for any influenza A and/or B virus; subsequent assays identified influenza A subtype and B lineage. Patients testing positive for influenza were designated as case patients, and those testing negative as noncase patients.
Influenza-positive respiratory specimens containing high levels of influenza virus RNA (defined as an RT-PCR cycle threshold value ≤30) were sent to the CDC for genetic characterization. Full-length hemagglutinin sequences were obtained by means of whole-genome sequencing from original specimen samples, performed as described elsewhere [12]. Sequence data for characterized influenza viruses were uploaded to the Global Initiative on Sharing All Influenza Data (Supplementary Material). Viruses were classified into hemagglutinin clade based on phylogenetic analyses [13].
Influenza Vaccination History
Virus strains recommended for 2018–2019 northern hemisphere influenza vaccines were A/Michigan/45/2015 (H1N1)pdm09-like, A/Singapore/INFIMH-16–0019/2016 (H3N2)-like, B/Colorado/06/2017-like virus (Victoria lineage), and (for quadrivalent vaccines), B/Phuket/3073/2013-like (Yamagata lineage) viruses. Participants (including children aged <9 years, who require 2 vaccine doses during their first vaccination season) were considered vaccinated if they received ≥1 dose of any seasonal influenza vaccine ≥14 days before illness onset, according to medical records and registries (Wisconsin site) or medical records and self-report (Michigan, Pennsylvania, Texas, and Washington sites).
Statistical Analysis
For estimates of VE, we excluded participants with inconclusive RT-PCR results, influenza-negative participants enrolled before periods of local influenza circulation, and participants vaccinated 14 or fewer days before self-reported illness onset. For the remaining participants, we calculated descriptive statistics separately for influenza case patients and noncase patients, including medians of continuous variables and distributions of categorical variables. Influenza VE was estimated using a test-negative design, which compares the odds of testing positive for influenza among vaccinated versus unvaccinated persons [14, 15].
Following Jackson and Nelson [14], we considered VE to be the relative difference in influenza risk between vaccinated and unvaccinated participants, expressed as a percentage and calculated as (1 − OR) × 100, where OR is the odds ratio for influenza among vaccinated compared with unvaccinated persons, determined from logistic regression models. The 95% confidence intervals (CIs) for VE were calculated as 1 − CIOR, where CIOR is the CI of the OR estimates. A priori, estimates were adjusted for network site, sex, age, race/ethnicity, self-reported general health status, interval from illness onset to study enrollment, and biweekly interval.
We estimated VE for any influenza-associated illness and separately for illness due to influenza A(H1N1)pdm09, A(H3N2), and A(H3N2) clade. In the subtype/clade-specific estimates, patients infected with other influenza subtypes/clades were excluded.
RESULTS
US Virologic Surveillance
From 30 September 2018 through 2 February 2019, influenza A(H1N1)pdm09 viruses accounted for the majority of influenza A viruses reported to the CDC from US public health laboratories (Figure 1). All A(H1N1)pdm09 viruses genetically characterized belonged to clade 6B.1, and the majority were antigenically similar to cell culture–propagated A/Michigan/45/2015 (6B.1), the reference virus representing the A(H1N1)pdm09 component for the 2018–2019 northern hemisphere influenza vaccines. The proportion of influenza A(H3N2) viruses began to increase nationally during the last week of January 2019, and A(H3N2) viruses predominated starting in the last week of February 2019. From 30 September 2018 through 2 February 2019, 194 (43%) of 455 genetically characterized influenza A(H3N2) viruses belonged to clade 3C.2a (including subclade 3C.2a1) and 261 (57%) to clade 3C.3a. The proportion that belonged to clade 3C.3a increased to 85% (544 of 638) identified from 3 February through 18 May 2019.
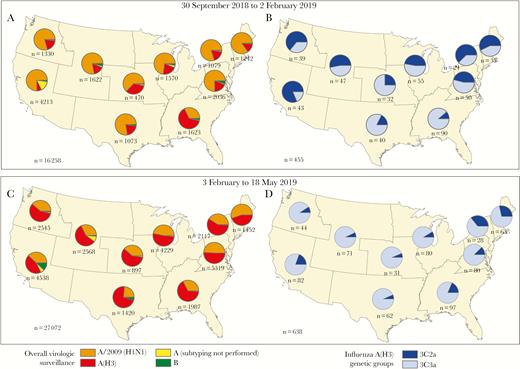
Geographic distribution of influenza-positive tests (n = 43 330) identified by US public health laboratories during the 2018–2019 influenza season and A(H3N2)-positive specimens submitted to the Centers for Disease Control and Prevention for genetic characterization (n = 1093), by US Department of Health and Human Services surveillance region. A, B, Influenza viruses by type and subtype and genetic clades for A(H3N2) identified from 30 September 2018 through 2 February 2019. C, D, Influenza viruses and A(H3N2) clades identified from 3 February through 18 May 2019. Pie charts present proportional distribution of virus type or A subtype (A, C) or A(H3N2) genetic clade (B, D), based on the number of subtyped or genetically characterized influenza viruses from each region.
Participant Characteristics
From 23 November 2018 through 3 May 2019, we enrolled 10 443 patients seeking care for acute respiratory illness (Table 1). We excluded 431 patients (4%) from the primary analyses, including 53 with inconclusive RT-PCR results, 127 who were vaccinated <14 days before illness onset, and 250 influenza-negative patients enrolled before periods of influenza circulation. Of the remaining 10 012 eligible patients, 2763 (28%) tested positive for influenza (case patients), with influenza-positive cases peaking in March 2019. The influenza case patients included 1317 (48%) infected with A(H1N1)pdm09, 1342 (49%) infected with A(H3N2), 22 (0.8%) infected with B/Yamagata, 41 (1%) infected with B/Victoria, 8 (0.3%) coinfected with A(H1N1)pdm09 and A(H3N2), and 32 (1.1%) infected with influenza A with no subtype determined. A total of 5381 patients (54%) were vaccinated ≥14 days before illness onset.
Characteristics of Study Participantsa
| Characteristic | Enrolled Patients, No. | Patients, No. (Row %) | ||
|---|---|---|---|---|
| Influenza Virus Positive | Influenza Virus Negative | Receipt of Seasonal Influenza Vaccine | ||
| Overall | 10 012 | 2763 (28) | 7249 (72) | 5381 (54) |
| Study site | ||||
| Michigan | 1817 | 477 (26) | 1340 (74) | 1138 (63) |
| Pennsylvania | 1701 | 540 (32) | 1161 (68) | 823 (48) |
| Texas | 1833 | 353 (19) | 1480 (81) | 777 (42) |
| Washington | 2692 | 778 (29) | 1914 (71) | 1620 (60) |
| Wisconsin | 1969 | 615 (31) | 1354 (69) | 1023 (52) |
| Sex | ||||
| Male | 4018 | 1224 (30) | 2794 (69) | 2061 (51) |
| Female | 5994 | 1539 (26) | 4455 (74) | 3320 (55) |
| Age group | ||||
| 6 mo to 8 y | 2428 | 751 (31) | 1677 (69) | 1278 (53) |
| 9–17 y | 1261 | 489 (39) | 772 (61) | 536 (43) |
| 18–49 y | 3256 | 821 (25) | 2435 (75) | 1397 (43) |
| 50–64 y | 1766 | 442 (25) | 1324 (75) | 1095 (62) |
| ≥65 y | 1301 | 260 (20) | 1041 (80) | 1075 (83) |
| Race/ethnicity | ||||
| White | 6845 | 1841 (27) | 5004 (73) | 3916 (57) |
| Black | 1142 | 350 (31) | 792 (69) | 419 (37) |
| Other race | 1023 | 301 (29) | 722 (71) | 558 (55) |
| Hispanic | 947 | 258 (27) | 689 (73) | 461 (49) |
aPatients with medically attended acute respiratory illness enrolled in the US Influenza Vaccine Effectiveness Network from 23 November 2018 through 3 May 2019, by influenza test result status and seasonal influenza vaccination status.
Genetic Characterization
Of 2699 influenza A-positive specimens from study participants, 2089 (77%) with low RT-PCR cycle thresholds were sent for genetic characterization at the CDC: 1035 (78%) of 1325 A(H1N1)pdm09 and 1054 (78%) of 1350 A(H3N2) virus–positive specimens. All 1035 A(H1N1)pdm09 viruses belonged to clade 6B.1A. Among 1054 A(H3N2) viruses characterized, 977 (93%) belonged to clade 3C.3a, 74 (7%) belonged to subclade 3C.2a1, which includes the 2018–2019 A(H3N2) vaccine reference virus, and 3 (0.3%) belonged to clade 3C.2a. The proportion of clade 3C.3a viruses also increased at US Flu VE Network sites during the 2018–2019 season; peak numbers of clade 3C.3a-positive patients were enrolled in February–March 2019, corresponding to the national increase in A(H3N2) cases (Figure 1). The distribution of influenza A viruses and A(H3N2) clades varied by US region in surveillance data and by site in the Flu VE Network (data not shown).
VE Estimates During Study Period
During the study period (23 November 2018 to 3 May 2019), the adjusted estimate of VE against influenza-associated illness was 29% (95% CI, 21%–35%) (Table 2). The VE against A(H1N1)pdm09-related illness during the same period was 44% (95% CI, 37%–51%), compared with 9% (−4% to 20%) for A(H3N2) and 5% (−10% to 19%) for clade 3C.3a. Age group-specific VE estimates against A(H1N1)pdm09 were highest among children aged 6 months to 8 years (59%; 95% CI, 47%–69%) and were not statistically significant among participants aged 9–17 or ≥65 years. Against A(H3N2) clade 3C.3a-related illness, age group-specific VE estimates were not statistically significant and were <0 (ie, higher odds of influenza among vaccinated compared with unvaccinated participants) among adults aged 18–49 or 50–64 years.
Adjusted Vaccine Effectiveness Against Influenza-Associated Illness Among Patients Aged ≥6 Monthsa
| Virus by Patient Age | No. Vaccinated/Total No. (% Vaccinated) | VE (95% CI), % | |
|---|---|---|---|
| Influenza-Positive (Case Patients) | Influenza Negative (Noncase Patients) | ||
| All influenza viruses | |||
| All ages | 1316/2763 (48) | 4065/7249 (56) | 29 (21–35) |
| 6 mo to 8 y | 301/751 (40) | 977/1677 (58) | 48 (37–58) |
| 9–17 y | 217/489 (44) | 319/772 (41) | 7 (−20 to 28) |
| 18–49 y | 320/821 (39) | 1077/2435 (44) | 25 (10–37) |
| 50–64 y | 266/442 (60) | 829/1324 (63) | 14 (−10 to 33) |
| ≥65 y | 212/260 (82) | 863/1041 (83) | 12 (−31 to 40) |
| A(H1N1)pdm09 | |||
| All ages | 563/1325 (42) | 4065/7249 (56) | 44 (37–51) |
| 6 mo to 8 y | 128/389 (33) | 977/1677 (58) | 59 (47–69) |
| 9–17 y | 47/115 (41) | 319/772 (41) | 24 (−18 to 51) |
| 18–49 y | 150/442 (34) | 1077/2435 (44) | 43 (28–55) |
| 50–64 y | 138/255 (54) | 829/1324 (63) | 30 (6–48) |
| ≥65 y | 100/124 (81) | 863/1041 (83) | 16 (−41 to 51) |
| All influenza A(H3N2) virusesb | |||
| All ages | 709/1350 (53) | 4065/7249 (56) | 9 (−4 to 20) |
| 6 mo to 8 y | 163/335 (49) | 977/1677 (58) | 24 (1–42) |
| 9–17 y | 162/355 (46) | 319/772 (41) | 3 (−30 to 28) |
| 18–49 y | 154/351 (44) | 1077/2435 (44) | 3 (−25 to 24) |
| 50–64 y | 121/176 (69) | 829/1324 (63) | −20 (−74 to 18) |
| ≥65 y | 109/133 (82) | 863/1041 (83) | 13 (−46 to 48) |
| A(H3N2) genetic group 3C.3a | |||
| All ages | 520/977 (53) | 4065/7249 (56) | 5 (−10 to 19) |
| 6 mo to 8 y | 132/270 (49) | 977/1677 (58) | 23 (−3 to 43) |
| 9–17 y | 128/276 (46) | 319/772 (41) | 7 (−28 to 33) |
| 18–49 y | 117/246 (48) | 1077/2435 (44) | −10 (−47 to 18) |
| 50–64 y | 76/103 (74) | 829/1324 (63) | −48 (−142 to 10) |
| ≥65 y | 67/82 (82) | 863/1041 (83) | 20 (−52 to 58) |
| A(H3N2) genetic group 3C.2a1 | |||
| All ages | 37/74 (50) | 4065/7249 (56) | 46 (11–68) |
| Influenza B | |||
| All ages | 31/64 (48) | 4065/7249 (56) | 34 (−12 to 62) |
Abbreviations: CI, confidence interval; VE, vaccine effectiveness.
aVE against influenza-associated illness in the ambulatory care setting among patients enrolled in the US Influenza Vaccine Effectiveness Network from 23 November 2018 through 3 May. VE was estimated as 100 × (1 − OR), where OR is the odds ratio for influenza among vaccinated compared with unvaccinated persons. ORs were estimated using logistic regression. If the 95% CI excludes 0, the results are considered statistically significant. Models adjusted study site, sex, age, race/ethnicity, self-reported general health status, interval from illness onset to study enrollment, and calendar time (biweekly interval).
bIncludes influenza A(H3N2) viruses for which genetic group was not determined.
DISCUSSION
The evasion of immunity through rapid evolution and accumulation of changes in major surface proteins of the A(H3N2) virus is a challenge for influenza vaccine strain selection and production. Since 2000, the A(H3N2) component of the northern hemisphere vaccine has been changed on 12 occasions, twice as often as the A(H1N1) component, and vaccine strain selection has been postponed on 3 occasions to collect additional data on emergent A(H3N2) viruses or characteristics of A(H3N2) candidate vaccine viruses [4]. For the 2018–2019 influenza season, data collected through 3 May 2019 indicate that influenza vaccines were 44% effective against A(H1N1)pdm09-related illnesses but provided limited protection against A(H3N2)-related illnesses. Although the season began with predominance of A(H1N1)pdm09 viruses in most US regions, the proportion of illness caused by antigenically distinct A(H3N2) viruses increased during the season, and A(H3N2) was the predominant influenza virus throughout the United States after February 2019.
Based on Flu VE Network data, the current analysis suggests that vaccination did not significantly reduce medically attended influenza illness due to A(H3N2) virus infection. This finding was consistent with laboratory analyses indicating antigenic difference between the 2018–2019 A(H3N2) reference virus (representing subclade 3C.2a1) and predominant clade 3C.3a viruses. Preliminary estimates were shared with the WHO before their final A(H3N2) vaccine composition recommendation. The rapid increase in clade 3C.3a circulation in the United States, with signs of increasing prevalence in other global surveillance data, prompted WHO and the US Food and Drug Administration to select A/Kansas/14/2017 (clade 3C.3a) as the A(H3N2) reference virus for the 2019–2020 northern hemisphere influenza vaccine formulation [5].
Experience from the 2018–2019 influenza season highlights recent challenges with VE against influenza A(H3N2) viruses and the need for more broadly cross-protective vaccines [16, 17]. The VE against A(H3N2) viruses was 33% during 2016–2017 [18] and 22% in 2017–2018 [19], despite antigenic match between the cell-propagated A(H3N2) vaccine reference virus and circulating viruses mainly belonging to the 3C.2a genetic group. Antigenic differences between egg-passaged vaccine viruses and circulating A(H3N2) viruses may have contributed to reduced VE, along with other factors [16, 17]. Reasons for increased A(H3N2) activity due to clade 3C.3a during the 2018–2019 season in the United States are unclear; before this season, clade 3C.3a viruses had cocirculated at low levels with clade 3C.2a viruses since 2014 [20].
When they first emerged, clades 3C.2a and 3C.3a viruses were antigenically related [20]. In 2014, ferret antisera to the cell-propagated 2015–2016 vaccine reference strain, A/Switzerland/9715293/2013 (clade 3C.3a), inhibited both 3C.2a and 3C.3a viruses [21]. Continued genetic evolution of A(H3N2) viruses resulted in multiple subclades of 3C.2a viruses and antigenic divergence from clade 3C.3a, such that ferret antisera to egg- or cell-propagated A/Singapore/INFIMH-16–0019/2016 (clade 3C.2a1) 2018–2019 vaccine reference virus poorly inhibited circulating clade 3C.3a viruses [9]. For improved VE, vaccine strategies that provide broad protection against antigenically distinct groups of A(H3N2) viruses are needed if diverse groups of viruses continue to cocirculate [17].
The annual development of influenza vaccines is a challenging race against the clock to detect and monitor antigenically drifted influenza viruses, predict which viruses will predominate, and manufacture and deliver vaccines in time for each influenza season [2]. Evolving evidence on emergence and fitness of antigenically drifted viruses, trends in prevalence, and characterization of potential candidate vaccine viruses are factors that contribute to strain selection and decisions to update vaccine components. Selection of a new vaccine reference virus can require additional manufacturing time, leading to potential public health consequences if vaccine availability is affected.
Postponement of A(H3N2) vaccine strain selection until 21 March 2019, the first postponement since February 2005, allowed collection of additional data on geographic distribution of A(H3N2) clades and development of potential candidate vaccine viruses and informed the selection of a clade 3C.3a vaccine candidate [4, 5]. Our findings of low effectiveness of 2018–2019 vaccines against A(H3N2)-related illness became available during strain selection deliberations and supported the decision to update the vaccine. Close monitoring of A(H3N2) 3C.3a viruses, disease epidemiology, and VE will be necessary to determine the epidemic potential and public health implications of this emerging clade.
These VE estimates may also inform public health efforts to control influenza. Intraseason estimates of VE may have implications for healthcare providers. Prompt and early antiviral treatment of high-risk and hospitalized patients with suspected influenza is particularly important when protection is suboptimal [22]. Increasing and widespread influenza activity in the United States related to A(H3N2) viruses late in the 2018–2019 season prompted the CDC to issue a national health advisory to alert clinicians to have a high suspicion for influenza, and reinforce recommendations for antiviral treatment [8].
Several limitations of our study should be considered. The validity of observational VE studies depends on accurate classification of vaccination status and influenza infection [14]. Vaccination status for this analysis included self-report at 4 of 5 sites, although documented vaccination status was used when available. Influenza infection was determined through systematic testing by highly specific molecular assays, and participants were enrolled within 7 days after illness onset when viral shedding was highest, decreasing the likelihood of false-negative results. Second, viruses submitted for genetic characterization were not representative of all influenza A virus-positive specimens because noncharacterized specimens had higher RT-PCR cycle threshold values, possibly corresponding with lower viral loads [23].
Owing to sample size, age group-specific estimates are less precise than overall estimates and have wide CIs when VE is low. As with any observational study, we cannot rule out unmeasured confounding as an explanation for our findings, although it is unlikely that potential biases would differ among influenza virus subtypes or clades. These estimates are limited to the prevention of ambulatory care visits, rather than more severe illness outcomes, such as hospitalization or death; additional studies are needed to evaluate VE against more severe illness. Finally, other factors in addition to antigenic drift may have contributed to reduced VE against A(H3N2) viruses and warrant investigation.
In conclusion, annual monitoring of VE with increased use of genetic characterization of circulating influenza viruses supports ongoing efforts to improve influenza vaccines. The rapid spread of antigenically distinct A(H3N2) viruses during the 2018–2019 season highlights the difficulty in ensuring antigenic match to optimize vaccine protection. Timely integration of clinical vaccine protection and virologic data may strengthen the evidence base for selecting influenza vaccine viruses and increase the probability that vaccine composition matches the predominant viruses.
Supplementary Data
Supplementary materials are available at The Journal of Infectious Diseases online. Consisting of data provided by the authors to benefit the reader, the posted materials are not copyedited and are the sole responsibility of the authors, so questions or comments should be addressed to the corresponding author.
Notes
Disclaimer. The findings and conclusions in this report are those of the authors and do not necessarily represent the official position of the CDC.
Financial support. This project was supported by the CDC through cooperative agreements with University of Michigan (grant U01 IP001034), the University of Pittsburgh (grant U01 IP001035), Kaiser Permanent Washington Health Research Institute (grant U01 IP001037), Marshfield Clinic Research Institute (grant U01 IP001038), and Baylor Scott & White Health (grant U01 IP001039). University of Pittsburgh also received funding from the National Institutes of Health (grant UL1TR001857).
Potential conflicts of interest. R. K. Z. has received research funds from Pfizer. R. K. Z., M. P. N., and E. T. M. have received research funds from Merck. R. K. Z. and A. S. M. have received research funds from Sanofi Pasteur. M. L. J. has received grants from Sanofi Pasteur. L. A. J. has received research funds from Novavax. A. S. M. has received personal fees from Novartis and Protein Sciences. E. T. M. has received research funds from Roche Pharmaceuticals. H. Q. M. has received research funding from Seqirus. All other authors report no potential conflicts. All authors have submitted the ICMJE Form for Disclosure of Potential Conflicts of Interest. Conflicts that the editors consider relevant to the content of the manuscript have been disclosed.
Acknowledgments
Baylor Scott and White Health, Texas A&M University College of Medicine: Michael Smith, Chandni Raiyani, Kempapura Murthy, Wencong Chen, Lydia Clipper, Kelsey Bounds, Amanda Drake, Teresa Ponder, Mary Kylberg, Natalie Settele, Jeremy Ray, Jennifer Thomas, Jamie Walkowiak, Renee Day, Madhava Beeram, John Erwin, and Alejandro Arroliga; University of Pittsburgh Schools of the Health Sciences and University of Pittsburgh Medical Center: Rose Azrak, G. K. Balasubramani, Todd M. Bear, Duane Eisaman, Heather Eng, Andrew Fackler, Edward Garofolo, Robert Hickey, Philip Iozzi, Monika Johnson, Stephanie Kirk, Jason A. Lyons, Donald B. Middleton, Krissy K. Moehling, Jonathan M. Raviotta, Evelyn C. Reis, Bret Rosenblum, Sean Saul, Theresa Sax, Michael Susick, Joe Suyama, Leonard F. Urbanski, Alexandra Weissman, and John V. Williams; Kaiser Permanente Washington Health Research Institute: Zoe Kappelman, Erika Kiniry, Lawrence Madziwa, Matt Nguyen, Suzie Park, C. Hallie Phillips, and Stacie Wellwood; University of Michigan and Henry Ford Health System: Allen Achkar, Elizabeth Alleman, Trinh Anh Minh, Habeeb Al-Shohatee, Gabriela Augustinaitis, Sarah Bauer, Danielle Carroll, Caroline K. Cheng, Robert Deblander III, Michelle Groesbeck, Emileigh Johnson, Anne Kaniclides, Armanda Kimberly, Jenna Kiryakos, Marym Kuril, Lois E. Lamerato, Ryan E. Malosh, Maria Matta, E. J. McSpadden, Madeleine Mendelow, Joshua G. Petrie, Niharika Rajesh, Bryan Richardson, Stephanie Robinson, Hannah Segaloff, Caleb Sokolowski, Rachael Swanson, and Rachel Truscon; Marshfield Clinic Research Institute: Elizabeth Armagost, Theresa Balinghasay, Tamara Braund, Deanna Cole, Carrie Curtis, Tom Dalcher, Alicia Easley, Terry Foss, Wayne Frome, Hannah Gourdoux, Gregg Greenwald, Sherri Guzinski, Kayla Hanson, Linda Heeren, Lynn Ivacic, Marie Janz, Tara Johnson, Julie Karl, Jennifer King, Tamara Kronenwetter Koepel, Diane Kohnhorst, Sarah Kopitzke, Erik Kronholm, Marcia Lichtenwald, Carrie Marcis, Karen McGreevey, Jennifer Meece, Nidhi Mehta, Vicki Moon, Madalyn Palmquist, Nan Pan, Rebecca Pilsner, DeeAnn Polacek, Martha Presson, Lauren Putnam, Carla Rottscheit, Crystal Sabatke, Jacklyn Salzwedel, Megan Sauer, Julian Savu, Ram Shrestha, Elisha Stefanski, Patrick Stockwell, and Sandy Strey; Centers for Disease Control and Prevention (CDC): Angie Foust, Wendy Sessions, LaShondra Berman, Juliana DaSilva, and Shoshona Le.

