


Abstract
Over 15 million epilepsy patients worldwide have drug-resistant epilepsy. Successful surgery is a standard of care treatment but can only be achieved through complete resection or disconnection of the epileptogenic zone, the brain region(s) where seizures originate. Surgical success rates vary between 20% and 80%, because no clinically validated biological markers of the epileptogenic zone exist. Localizing the epileptogenic zone is a costly and time-consuming process, which often requires days to weeks of intracranial EEG (iEEG) monitoring. Clinicians visually inspect iEEG data to identify abnormal activity on individual channels occurring immediately before seizures or spikes that occur interictally (i.e. between seizures). In the end, the clinical standard mainly relies on a small proportion of the iEEG data captured to assist in epileptogenic zone localization (minutes of seizure data versus days of recordings), missing opportunities to leverage these largely ignored interictal data to better diagnose and treat patients.
IEEG offers a unique opportunity to observe epileptic cortical network dynamics but waiting for seizures increases patient risks associated with invasive monitoring. In this study, we aimed to leverage interictal iEEG data by developing a new network-based interictal iEEG marker of the epileptogenic zone. We hypothesized that when a patient is not clinically seizing, it is because the epileptogenic zone is inhibited by other regions. We developed an algorithm that identifies two groups of nodes from the interictal iEEG network: those that are continuously inhibiting a set of neighbouring nodes (‘sources’) and the inhibited nodes themselves (‘sinks’). Specifically, patient-specific dynamical network models were estimated from minutes of iEEG and their connectivity properties revealed top sources and sinks in the network, with each node being quantified by source-sink metrics. We validated the algorithm in a retrospective analysis of 65 patients. The source-sink metrics identified epileptogenic regions with 73% accuracy and clinicians agreed with the algorithm in 93% of seizure-free patients. The algorithm was further validated by using the metrics of the annotated epileptogenic zone to predict surgical outcomes. The source-sink metrics predicted outcomes with an accuracy of 79% compared to an accuracy of 43% for clinicians’ predictions (surgical success rate of this dataset). In failed outcomes, we identified brain regions with high metrics that were untreated. When compared with high frequency oscillations, the most commonly proposed interictal iEEG feature for epileptogenic zone localization, source-sink metrics outperformed in predictive power (by a factor of 1.2), suggesting they may be an interictal iEEG fingerprint of the epileptogenic zone.
See Sinha (https://doi.org/10.1093/brain/awac373) for a scientific commentary on this article.
Introduction
Epilepsy is characterized by unprovoked, recurrent seizures and affects over 60 million people worldwide.1 Although about 70% of patients’ seizures are controlled with medication, 30% have drug-resistant epilepsy.2–4
The most effective treatments for drug-resistant epilepsy are interventions that surgically remove the epileptogenic zone (EZ), defined as the minimal area of brain tissue responsible for initiating seizures and whose removal (or disconnection) is necessary for seizure-freedom.5 A seizure-free outcome depends on epilepsy type and accurate localization of the EZ, but seizure-free rates vary between 20% and 80%, depending on a variety of clinical factors.6,7
Before surgery, patients undergo a thorough process to determine the location and extent of the EZ. First, non-invasive methods such as scalp EEG, MRI, PET and single-photon emission computerized tomography (SPECT) are used to hypothesize the location of the EZ. If non-invasive methods are discordant or inconclusive, invasive monitoring with intracranial EEG (iEEG) is often needed.8 Following electrode implantation, the patient remains in the hospital for several days to weeks. Clinicians wait for a sufficient number of seizure (ictal) events to localize the EZ through visual inspection of the iEEG data.9,10 They look for various epileptic signatures such as repetitive spikes, rhythmic slow waves or rapid fast intracortical frequencies.6–115
Ictal iEEG data are of higher value for localization purposes, but interictal (between seizure) data are also inspected to identify epileptiform spikes. The area of cortex that generates interictal spikes is denoted as possible EZ,8 but distinguishing between propagated and locally generated discharges is often non-trivial, making interictal spikes an unreliable iEEG marker for the EZ.9
Many computational approaches have been proposed to localize the EZ from iEEG data.13–44 In line with the standard of care visual analysis, most of the proposed methods depend on seizure data.13–24,44 Nevertheless, using interictal data has been of high interest as this could significantly improve the intracranial monitoring when it is interpreted in conjunction with the ictal data. The most frequently proposed interictal marker of the EZ are high frequency oscillations (HFOs).25–30 However, the reliability of HFOs as an iEEG marker of the EZ is debatable45 and by treating each channel independently, HFOs fail to capture network properties of the brain. Additionally, HFOs depend on epileptiform signatures being observable in the signals rather than detecting the underlying dynamical properties of the epileptic network.
In this study, we leverage interictal data to localize the EZ by developing a computational tool that (i) estimates patient-specific dynamical network models from interictal iEEG data; and (ii) uses connectivity properties of the models, based on the principle of ‘sources’ and ‘sinks’, to identify pathological network nodes (iEEG channels) that correspond to the EZ. Specifically, we hypothesized that when a patient is not having a seizure, it is because the EZ is being inhibited by neighbouring regions. We then developed and tested a new interictal iEEG marker of the EZ by identifying two groups of network nodes from a patient’s interictal iEEG network: those that are continuously inhibiting a set of their neighbouring nodes (denoted as ‘sources’) and the inhibited nodes themselves (denoted as ‘sinks’). We applied our algorithm to interictal iEEG snapshots from 65 patients treated across six clinical centres and evaluated performance by (i) comparing the EZ channels identified by our algorithm to those identified by clinicians; and (ii) predicting surgical outcomes as a function of source-sink metrics by employing the random forest framework.
Materials and methods
Patient population
Sixty-five adults [mean age 33.5 ± 13.0 (mean ± standard deviation, SD) years] with drug-resistant epilepsy who underwent intracranial EEG monitoring with stereotacticly placed depth electrodes [stereo-EEG (sEEG)] and received subsequent surgical treatment were selected retrospectively for the study. Post-sEEG surgical treatments included resective surgery (39 patients), laser ablation (17 patients) or responsive neurostimulation (nine patients). Patients were treated at one of the following institutions: Cleveland Clinic (CC), Johns Hopkins Hospital (JHH), University of Kansas Medical Center (KUMC), University of Miami Hospital (UMH), National Institutes of Health (NIH) and University of Pittsburgh Medical Center (UPMC). All patients had a minimum of 1 year follow-up to determine treatment outcomes. Patient population statistics are summarized in Table 1. For more detailed clinical data of each patient, see Supplementary Table 1. The study was approved by the Institutional Review Board (IRB) at each clinical institution and all patients provided informed consent prior to enrolment. All clinical decisions were made independently of this study.
Dataset demographic
| CC | KUMC | JHU | UMH | NIH | UPMC | Total | |
|---|---|---|---|---|---|---|---|
| Number of patients | 29 | 9 | 5 | 8 | 9 | 5 | 65 |
| Gender, male/female | 15/14 | 4/5 | 2/3 | 6/2 | 7/2 | 3/2 | 37/28 |
| Age, years | 30.5 ± 12.3 | 39.7 ± 16.9 | 35.3 ± 18.3 | 35.3 ± 12.7 | 33.1 ± 9.3 | 36.6 ± 12.0 | 33.5 ± 13.0 |
| Surgical outcome, successful/failed | 13/16 | 4/5 | 3/2 | 1/7 | 4/5 | 3/2 | 28/37 |
| MRI findings, normal/abnormal | 26/3 | 6/3 | 0/5 | 5/3 | 5/4 | 4/1 | 46/19 |
Data collection
Stereo-EEG recordings
SEEG data were recorded using Nihon Kohden or Natus (Natus Medical Inc.) EEG monitoring and diagnostic systems at a typical sampling frequency of 1 or 2 kHz. A small subset of sEEG was recorded at 500/512 Hz. The placement of each electrode was determined by the clinical team at each centre. For each patient, one interictal snapshot (average duration 5.3 ± 4.2 min) was randomly selected for analysis. Interictal periods were sampled at least 1 h away from seizures without application of specific selection criteria (such as the presence or absence of epileptiform activity).
Clinical annotations of the EZ
At each epilepsy centre, an EZ hypothesis was formulated independently of this study by the clinical team based on the non-invasive and invasive data gathered during presurgical evaluation for each patient. The clinically annotated EZ (CA-EZ) is defined as the anatomical area(s) to be treated (resected, ablated or stimulated). This includes sEEG channels demonstrating the earliest electrophysiological changes (generally characterized by low voltage fast activity) at the beginning of an ictal event (i.e. sEEG channels corresponding to the seizure onset zone), as well as channels involved in early propagation of the seizure. We note that because surgical treatment is based on the EZ hypothesis (with small variations), there is generally a great overlap between the CA-EZ and the actual treated area(s) in each patient.
Clinical classification of surgical outcomes
Surgical outcomes were classified by each centre’s epileptologists according to the Engel Surgical Outcome Scale46 and the International League Against Epilepsy (ILAE) classification system.47 Successful surgical outcomes were defined as free of disabling seizures (Engel class I and ILAE scores 1–2) and failure outcomes as not free of disabling seizures (Engel classes II–IV and ILAE scores 3–6) at 12+ months post-operation. Of 65 patients, 28 had a successful outcome, whereas 37 patients continued to experience seizures after receiving treatment (failure outcome). Visible lesions on MRI are associated with higher success rates,48 whereas non-lesional patients, and patients with extra-temporal or multi-focal epilepsy have higher rates of non-seizure free outcomes.11,49–51 To define the clinical complexity of each patient, the clinical team categorized patients as follows: (i) lesional (visible lesions on MRI) or non-lesional; (ii) mesial temporal or non-mesial temporal; and (iii) focal or multi-focal.
Data preprocessing
Data were bandpass filtered between 0.5 and 300 Hz with a fourth order Butterworth filter, and notch filtered at 60 Hz and its harmonics with a stopband of 2 Hz. A common average reference was applied to remove common noise from the signals. Final electrode locations were obtained by combining information from co-registered post-implantation CT and brain MRI scans (e.g. using BioImage Suite52). The clinical team at each centre then visually confirmed the electrode localizations for further accuracy. Finally, sEEG channels not recording from grey matter (e.g. located in white matter or outside of the brain) or otherwise deemed ‘bad’ (e.g. broken or excessively noisy or artifactual) by the clinicians were discarded from each patient’s dataset, resulting in a total of 95 ± 32 (mean ± SD) sEEG channels used per patient in the analysis. The sEEG recordings were divided into non-overlapping 500 ms windows for modelling and feature extraction (see details below). All data processing and analysis were performed using MATLAB R2020b (MathWorks, Natick, MA). Models for predicting surgical outcomes were built using Python3.6+ (Python Software Foundation, Wilmington, DE).
Sources and sinks in the epileptic brain network
We performed our analysis exclusively on interictal, seizure-free data, which leads to a fundamental question: how can one identify where seizures start in the brain without ever observing a seizure? Our source-sink hypothesis states that pathologic epileptogenic regions (denoted as sinks) are persistently inhibited by neighbouring regions (denoted as sources) during interictal periods to suppress seizures. The concept of sources and sinks within a network is well established and has been applied to many analyses of network systems.53 As schematically represented in Fig. 1, a ‘source’ node in our application is a region in the brain network that is highly influential towards other nodes but is not being influenced by others. In contrast, a ‘sink’ node is a region that is being highly influenced by other nodes but is not influential itself. During rest, our conjecture was that seizure onset is prevented by a strong inhibition exerted on the EZ by its neighbouring brain regions (sources), which restrict onset and propagation of the seizure activity, i.e. EZ regions are sinks that cannot influence the rest of the network. When an epilepsy patient has a seizure however, the EZ is triggered and the EZ nodes transition into sources as they work together as a collective group to initiate and spread seizure activity.
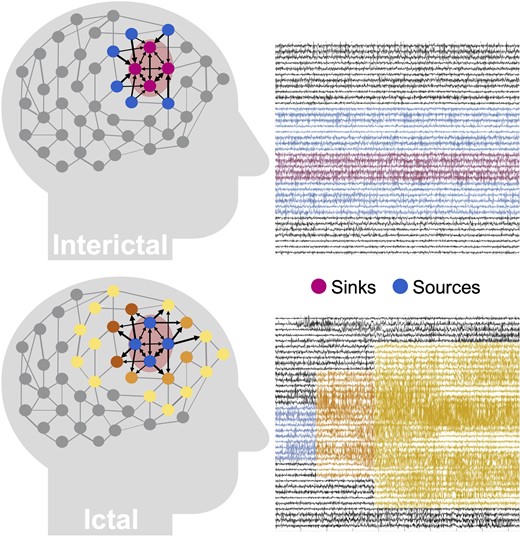
Source-sink hypothesis.Top: During interictal periods, epileptogenic nodes (shaded red region) are sinks that are strongly inhibited (influenced) by neighbouring regions (sources) to prevent seizures. Bottom: During ictal periods, however, epileptogenic nodes become sources as they work together as a tightly coupled group to initiate and spread epileptogenic activity to other regions of the brain.
Dynamical network models
Identifying sources and sinks in the iEEG dynamical network model
We defined two special groups of nodes in the iEEG DNM, subject to the source-sink hypothesis. Source nodes (blue nodes in Fig. 2A) are nodes that generally have high magnitude values in their columns of the A matrix (high influence on others) but low values across their rows (low influence from others). In contrast, sinks (pink nodes in Fig. 2A) exhibit the opposite pattern, high row values and low column values.
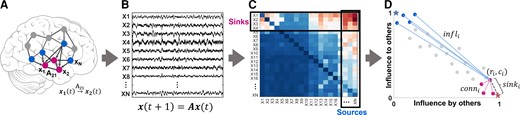
Identifying sources and sinks in the interictal iEEG network. (A) An N-channel iEEG network example. (B) Signals obtained from the implanted iEEG channels. (C) Corresponding A matrix, estimated from the signals in B. (D) 2D source-sink representation of the iEEG network with sink index (sinki), source influence (infli) and sink connectivity (conni) labelled. In this space, sources are channels located at the top left (blue circles), whereas sinks (pink circles) are located at the bottom right. Blue star = ideal source; pink star = ideal sink.
Computing source-sink metrics
Source-sink 2D-space
To identify the top sources and sinks in the DNM, we quantified each channel’s source-sink characteristics by computing the amount of influence to and from the channel based on the sum of the absolute values (the 1-norm) across its row and column in A (Fig. 2C), respectively. Once we obtained the total influence to/from each channel, we placed the channels in the source-sink 2D-space (SS-space, Fig. 2D). Finally, we computed three source-sink metrics (SSMs) subject to the source-sink hypothesis for each channel.
Sink index
Source index
Source influence
A high source influence suggests that channel i receives strong influence from the top sources in the interictal DNM.
Sink connectivity
The higher the sink connectivity, the stronger influence channel i receives from the top sinks in the network. All metrics were normalized by their maximum value.
We refer the reader to the Supplementary material for further details of the source-sink analysis and an example computation for a four-node network.
Predicting surgical outcomes using source-sink metrics
To evaluate the SSMs as interictal iEEG markers of the EZ, we tested their efficacy in predicting surgical outcomes following the same procedure as Li et al.14 (Supplementary Fig. 3) and compared performance against HFOs.59–61 Specifically, we modelled the probability of a successful surgical outcome, Ps, as a function of the three SSMs (sink index, source influence and sink connectivity) using an oblique random forest classifier.62 The SSMs were summarized with the mean and standard deviation across two sets of channels: (i) the CA-EZ; and (ii) all other channels not labelled as CA-EZ (CA-NEZ). For more details, see the Supplementary material. In general, the prediction of surgical outcomes using any feature (e.g. SSMs or HFO rate) conditioned on the CA-EZ enables us to evaluate the overall value of the feature as a potential EZ marker. Next, we performed a 10-fold nested leave-patient-out cross-validation (CV) and performed statistical analysis as described below.
Predicting surgical outcomes using HFOs
HFO rate (number of HFOs per minute per channel) is amongst the most commonly used metrics to test the value of HFOs as a biomarker of the EZ.25,29,35,63–68 Thus, we also modelled Ps as a function of HFO rate following the exact same paradigm as for the SSMs described above. We detected HFOs in the interictal data segments using two different automatic detectors for comparison: the Hilbert detector61 and the root-mean-square (RMS) detector67 (see the Supplementary material for full details).
Clinical annotations of CA-EZ and SSM correspondence
To evaluate the SSMs as an iEEG marker of the EZ, the clinical team at each centre reviewed the source-sink results for each patient and ranked the correspondence between the CA-EZ and the nodes that had high SSMs. Specifically, for each patient, clinicians were presented with a 2D SS-space (Fig. 2D), which showed the location of each implanted iEEG channel in the SS-space as well as the strongest connections from the top sources and sinks. The clinical team then compared the source-sink results to the CA-EZ regions and rated the clinical correspondence between the two sets as either: (i) agreement, if there was some or significant overlap with the CA-EZ; or (ii) no agreement, defined as no overlap with CA-EZ regions.
Quantifying CA-EZ and SSM correspondence
Finally, to quantify the correspondence between the CA-EZ and regions with high SSMs, we used a logistic regression model to compute the probability of a particular channel belonging to the EZ or not (PEz) as a function of the three SSMs. The model was trained, validated and tested using a 10-fold CV. We note that this part of the performance evaluation was only performed on seizure-free patients as we can assume that the EZ was accurately localized in these patients. For full details, see the Supplementary material.
Statistical analysis
Each random forest model (SSM and HFO) was validated using a stratified shuffle 10-fold leave-patient-out CV by creating 10 random splits of the entire dataset into training and test sets. In each such split, the hyperparameters were tuned using the training data (70% of the dataset), and performance was then evaluated on the remaining 30% of patients in the test dataset by applying a varying threshold to the model’s output and computing a receiver operating characteristic (ROC) curve, which plots true positive rates against false positive rates for various threshold values. We then applied a threshold (α = 0.5) to Ps to predict each patient’s outcome and evaluated performance by comparing the predicted outcome to the actual outcome. The decision threshold was determined as the default threshold for any statistical classification model, as opposed to choosing an optimal point on the ROC curve, to avoid the risk of overhyping (overfitting hyperparameters) and thus biasing the results of the final model.69
We used five metrics to measure model performance: (i) area under the curve (AUC) of the ROC; (ii) prediction accuracy; (iii) precision; (iv) sensitivity; and (v) specificity. We report results of the 10 CV folds (mean ± SD) below. We compared the performance metrics of the SSMs to those of HFO rates using a paired two-sample t-test. In all t-tests performed, the null hypothesis was that the two distributions have equal means, and the alternate hypothesis was that the means are different. Lastly, outcome predictions of the two models (Ps) were compared using a McNemar’s test for paired nominal data. For all tests, a P-value ≤ 0.05 was considered to be statistically significant.
Data availability
We released the raw iEEG data for patients from NIH, Miami and JHH in the OpenNeuro repository in the form of BIDS-iEEG (https://openneuro.org/datasets/ds003876.). Because of restrictions on data sharing from CC, KUMC and UPMC, we were unable to release the iEEG data that we received from these centres. Datasets from these centres are available upon request from authors at the corresponding centre.
Results
The SSMs highlight CA-EZ regions in patients with successful outcomes
From each patient’s interictal DNM, we quantified source-sink characteristics of every iEEG channel by computing its SSMs in every 500 ms sliding-window of the interictal recording. To visualize the spatiotemporal SSM heatmaps, we combined the indices into a single source-sink index by taking the product of the three (SSI = sink × infl × conn), see Fig. 3A for examples of 1-min snapshot of iEEG data and the corresponding spatiotemporal SSM heat maps for three patients with different surgical outcomes. Figure 3B shows the average interictal SSM of each iEEG contact, overlaid on each patient’s implantation map, and the placement of each channel in the 2D source-sink space is shown in Fig. 3C.
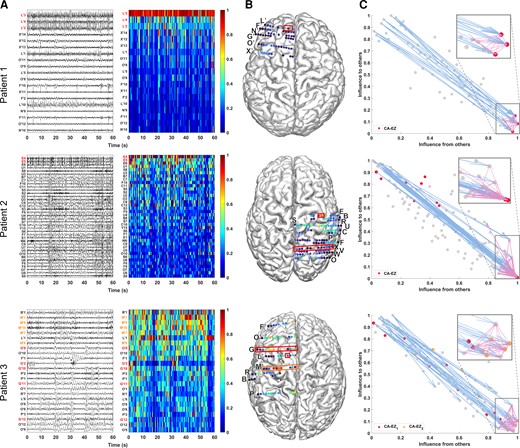
Three patient examples. Patient 1 (top) had a successful surgical outcome. Patient 2 (middle) had a failed surgical outcome. Patient 3 (bottom) had two surgeries. After the first surgery, the patient continued to have seizures (failed outcome) but became seizure-free (successful outcome) after the second surgery. (A) A 1-min interictal iEEG snapshot (left) and the resulting SSI (computed as the product of the three SSMs) of every channel (right). Channels are arranged from highest to lowest average interictal SSI. CA-EZ channels are coloured red. For Patient 3, the CA-EZ from the second surgery is coloured orange. Only the top 30% of channels are shown for better visualization purposes, and all channels not shown have low SSI values. In Patient 1 (top), CA-EZ channels had the highest SSI values, whereas only 2 of 13 CA-EZ channels had a high SSI in Patient 2 (middle). In Patient 3 (bottom), the CA-EZ that rendered the patient seizure-free had the highest SSI values. (B) Average SSI of each channel overlaid on the patients’ implantation maps. Red/orange boxes outline CA-EZ channels. (C) 2D source-sink space. Top sources are located in the top left and top sinks in the bottom right. CA-EZ channels are coloured red. The second CA-EZ in Patient 3 is coloured orange in the bottom panel. The blue and pink arrows indicate the strongest connections from the top sources and sinks, respectively, and the channels they point to. The most influential connections from sources (blue arrows) point to the sinks and the strongest connections from sinks (pink arrows) point to other sinks in Patient 1 (top), whereas the top sources point to nodes other than top sinks in Patient 2 (middle). Top sinks also point to these other nodes.
A high SSI indicates that the channel is a top sink that is both highly connected to other sinks and strongly influenced by the top sources of the network. In Patient 1, the iEEG channels with the highest SSI matched the channels identified as the EZ by clinicians (three out of three). In this patient, all three CA-EZ channels were included in the surgical treatment (laser ablation), which led to complete seizure freedom. In Patient 2, however, only 2 out of 13 CA-EZ regions had high SSI values, whereas the other iEEG channels with high values were not a part of the CA-EZ and thus were not treated during surgery. This patient did not become seizure free post-treatment. Finally, Patient 3 had two surgeries; first a laser ablation of superior frontal and cingulate gyri (contacts on L’ and G’ electrodes), which resulted in seizure recurrence, and later a resection of pre-, post-central and supplementary motor areas (M’ electrode), which led to complete seizure freedom. Interestingly, when the iEEG channels first identified as CA-EZ (CA-EZ1) were considered, none were amongst the channels with the highest 10% SSI values. However, most of the channels with the highest SSI values corresponded to the second identified CA-EZ (CA-EZ2, M’ electrode) that ultimately led to a successful outcome in this patient.
Identifying channels with high SSMs
As Fig. 3A shows, the SSMs remained consistent with little variation of each channel’s metric values across the interictal recordings. Thus, we computed an average A matrix to represent each patient’s interictal DNM (Supplementary material). From this matrix, we identified the top sources and sinks in the iEEG network by placing the channels in the SS-space (see Fig. 3C for three patient examples) based on their total influence. In patients with successful surgical outcomes, the CA-EZ channels are expected to be a subset of the top sinks (Fig. 3C, top). The most likely candidates of the true EZ, based on the source-sink hypothesis, are the subset of top sinks that are highly connected to other sinks and strongly influenced by top sources. In general, the top sources and sinks pointed to CA-EZ channels in patients with successful outcomes (Fig. 3C, top), whereas they may also connect to other channels in patients with failed surgical outcomes (Fig. 3C, middle). In Patient 3 (Fig. 3C, bottom), who continued to have seizures after the first surgery, the CA-EZ1 were not amongst the top sinks in the iEEG network, whereas the majority of CA-EZ2, the set of channels that led to seizure-freedom post-surgery, were top sinks. In addition, the latter set of channels were highly influenced by the top sources and sinks in the network and thus were considered likely candidates of the true EZ by the source-sink algorithm.
Temporal stability of sources and sinks during interictal periods
To verify the stationarity of the SSMs over time, we tested the sensitivity of the indices to duration and timing of the interictal snapshot. Specifically, we computed how many of the channels with 10% highest constant SSMs were captured in windows of five different sizes, ws = {1,2,3,5,10} min and compared this with how many channels were captured by chance (see full details in the Supplementary material). As Fig. 4 shows, over 90% of the top channels were captured on average for all indices—independent of the timing or duration of the interictal snapshot—compared with far fewer channels (around 10%) captured by chance (P << 0.05 for all metrics). This suggested that, given any snapshot of interictal data, even as short as 1 min, the results would be highly comparable to those obtained from the entire interictal snapshot for each patient.
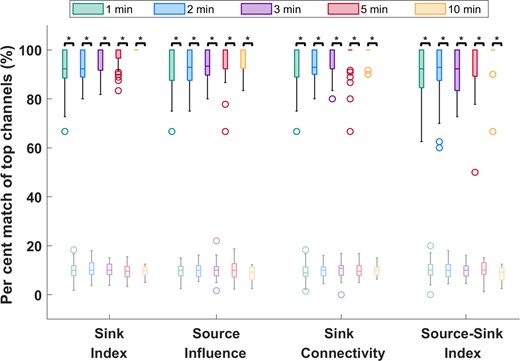
Temporal stability of the source-sink metrics. Darker colours represent distributions of SSMs, whereas lighter (transparent) colours represent channels captured by chance. On average, over 90% of channels are captured for all metrics, independent of the timing or duration of the interictal snapshot selected. Increasing the window size does not significantly change the percentage of top channels captured. In comparison, only around 10% of top channels are captured by chance. The asterisks indicate a statistically significant difference.
SSMs outperform HFOs in predicting surgical outcomes
As stated above, the source-sink metrics (and consequently the product of the three metrics, denoted as SSI) were significantly higher in CA-EZ channels compared with the rest of the iEEG network in patients with successful outcomes but not necessarily in patients with failed outcomes ( and , see other P-values in Supplementary Table 2). Taking advantage of this assumption, we built a random forest model to predict the probability of a successful surgical outcome (Ps) for each patient using (i) the source-sink metrics; and (ii) HFO rate, for comparison. The performances of both HFO detectors were highly comparable. We report results of the Hilbert detector below. Results of the RMS detector are shown in the Supplementary material. The resulting test-set ROC curves are shown in Supplementary Fig. 4. Figure 5A and B show Ps distributions across all CV-folds, using the SSMs and the HFO model, respectively. The dots are colour-coded based on each patient’s surgical outcome. A decision threshold of α = 0.5 was applied to the estimated probabilities (Ps) to predict each patient’s outcome. Using the SSMs (Fig. 5A), most patients with a sucessful outcome were above the threshold, with Ps > 0.5, whereas most patients with a failed outcome were below it. In contrast, there was no clear separation between patients with successful or failed outcomes using the HFO rate (Fig. 5B).
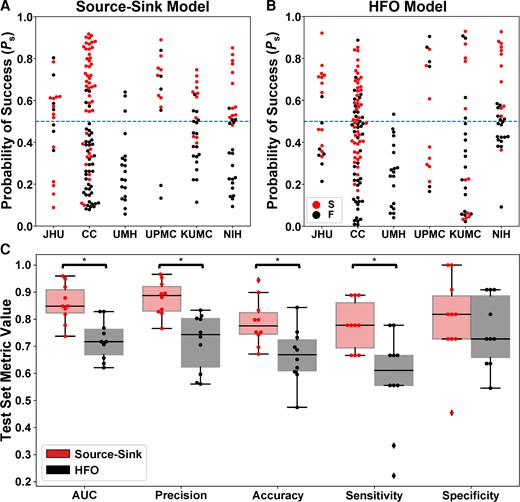
Performance of the source-sink and HFO metrics in predicing surgical outcomes. (A) Predicted probability of success (Ps) using the source-sink model across all CV folds. Each dot represents one patient and dots are colour-coded by surgical outcome. S = success, F = failure. Note that Ps-values from all 10 CV folds are shown, resulting in more data-points than the number of patients used in the study. The dashed line represents the decision threshold applied to Ps to predict outcomes. For the source-sink model, the majority of patients with a successful outcome (red dots) had Ps-values above the threshold, whereas patients with a failed outcome (black dots) generally had Ps-values below the threshold. (B) Predicted probability of success (Ps) using the HFO model across all CV folds. For the HFO model, there was no clear separation between the patients with successful or failed outcomes, with both groups having Ps-values above and below the decision threshold, thus resulting in lower prediction accuracy. (C) Performance comparison of the SSMs (red) to HFO rate (black). Boxes show distributions of each metric across the 10 CV folds. The asterisks indicate a statistically significant difference. The SSMs outperformed the HFO rate with significantly higher AUC, accuracy, average precision and sensitivity. The SSMs had an AUC of 0.86 ± 0.07 compared with an AUC of 0.72 ± 0.07 using the HFO rate. The source-sink model also outperformed HFOs in terms of average precision, which weighs the predictive power in terms of the total number of patients, with an average precision of 0.88 ± 0.06 compared with 0.72 ± 0.11 for the HFO rate. Using the SSMs, a threshold of α = 0.5 applied to Ps for each subject rendered a test-set accuracy of 78.9 ± 8.5%, compared with a considerably lower accuracy of 66.6 ± 10.1% using HFOs and an even lower clinical success rate of 43% in this dataset. The biggest performance difference between the two models was in terms of sensitivity (true positive rate), where the SSMs outperformed the HFO rate by 35%, with a sensitivity of 0.78 ± 0.09. However, both models performed similarly in predicting failed outcomes correctly, where the source-sink model had a marginally higher specificity of 0.80 ± 0.16 compared with 0.75 ± 0.13 for the HFOs.
Figure 5C compares the performance of the SSMs and HFOs in predicting surgical outcomes. The SSMs outperformed HFO rate with significantly higher AUC, accuracy, average precision and sensitivity (PAUC = 0.0015, Paccuracy = 0.0335, Pprecision = 8.33 × 10⁻⁴ and Psensitivity = 0.0066). Although the SSMs had a higher specificity on average, both models performed similarly (Pspecificity = 0.537).
Note that HFO rate was computed across the entire interictal snapshot provided for each patient. The longer the snapshot, the more likely it is to capture HFOs. In contrast, although the SSMs were also computed by averaging across the same recordings for each patient, we showed above that the results remain consistent independent of both timing and length of the recording.
SSMs are correlated with treatment outcomes
The separation between the Ps distributions of patients with successful or failed outcomes was greater for the source-sink model compared with the HFO model, and consequently so was the model’s ability to discriminate between the two outcome possibilities (Fig. 6A). In fact, we compared the performance of the two models with a contingency table (confusion matrix) and observed that the SSM model was statistically better with a P-value of P = 0.006. When further broken down by Engel class (Fig. 6B) or ILAE score (Fig. 6C), we observed a decreasing trend of Ps as the outcome score (and thus also the severity of postoperative seizure outcome) increased using the SSMs. In contrast, we did not see this clear separation of Ps-values using the HFO model, which had a much greater overlap between classes.
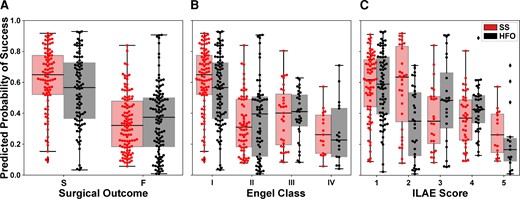
Predicted probability of success categorized by surgical outcomes. (A) Distributions of Ps as predicted by the source-sink model (red) and HFO model (black). Each box represents the distribution of Ps-values across all 10 CV folds. There was a clear separation between the distributions of patients with successful versus failed outcomes for the SSM model, whereas the distributions obtained using the HFO rate overlapped, and consequently the predictive power of the HFO rates was lower. (B) Distributions of Ps stratified by Engel Class (Engel I = successful outcome; Engel 2–4 = failed outcome). For the SSMs, there was a general trend of decreasing Ps-values as the Engel class (and thus also severity of surgical outcome) increased. In contrast, this did not hold for the HFO rate. (C) Distributions of Ps stratified by ILAE scores (ILAE 1–2 = successful outcome; ILAE 3–5 = failed outcome) followed a similar trend to those observed for the Engel class in B. F = failed surgical outcome; S = successful surgical outcome.
Top SSM regions correspond highly to CA-EZ in patients with successful surgical outcome
For each patient, the treating neurologist rated the correspondence between the CA-EZ and regions with top SSMs based on the patient’s 2D SS-map. Figure 7 shows the clinical correspondence scores between the two sets of regions for patients with successful versus failed outcomes. In general, there was more agreement between the CA-EZ and regions with high SSMs in patients with successful surgical outcomes compared to those with failed outcomes, indicating that the source-sink analysis often highlighted other, non-treated potential onset regions in patients with failed outcomes. In fact, clinicians agreed with the algorithm in 26 of 28 (93%) seizure-free patients, whereas only 54% of patients with failed outcomes were considered to be in agreement. When categorized by Engel scores, the rate of agreement decreased as the Engel class increased, which likely also reflects the increased difficulty of treatment in these patients. A similar trend was observed for the ILAE scores, with a higher rate of disagreement corresponding to a higher ILAE score.
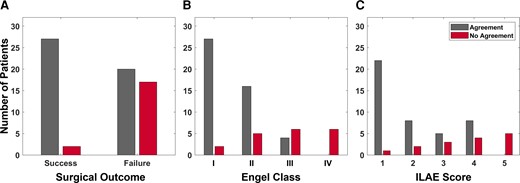
Clinical correspondence between CA-EZ and top SSM regions. (A) Clinical correspondence stratified by surgical outcome. For almost all patients with a successful outcome, the clinicians agreed with the channels with the highest SSM scores. This agreement was much lower for the patients with a failed outcome. Note that in some failed-outcome patients, clinicians may not have been able to treat all of the CA-EZ (e.g. if it is located in eloquent cortex). In those cases, the source-sink algorithm may agree with clinicians even though the patient had a failed surgical outcome. (B) Clinical correspondence stratified by Engel class. The rate of agreement was highest for Engel 1 (complete seizure-freedom) but decreased as the Engel class increased. No-agreement scores followed the opposite trend. (C) Clinical correspondence categorized by ILAE scores followed an overall similar trend with decreasing agreement (and increasing disagreement) as ILAE score increased.
Finally, to quantify the overlap between SSM and CA-EZ regions, we used them as inputs to a logistic regression model to predict whether a particular sEEG channel belongs to the EZ or not (Supplementary material). Supplementary Fig. 13A and B show the resulting training and test set ROC curves. The SSMs achieved a test set AUC of 0.77 ± 0.01 and the overall agreement between the high-SSM and CA-EZ regions was 72.5 ± 1.2. Distributions of PEz-values are shown in Supplementary Fig. 14. Although the predicted EZ probability was generally lower for channels outside of the EZ (non-EZ channels), PEz had a wide range of values for this group (right box in Supplementary Fig. 14), contributing to a lower prediction accuracy. In fact, we found that a large proportion of non-EZ channels with the highest PEz were located in early spread regions and other regions in close proximity to the CA-EZ, thus potentially having higher epileptogenicity, although not directly classified as EZ by clinicians.
Discussion
We proposed novel source-sink metrics as interictal iEEG markers to assist in EZ localization. The SSMs are based on the hypothesis that seizures are suppressed when the epileptogenic regions are effectively being inhibited by neighbouring regions. We sought to evaluate the performance of the SSMs on a diverse group of patients, reflecting different epilepsy aetiologies, treatment methods and post-treatment outcomes. We collected our iEEG data from six different clinical centres. As such, our dataset comprised a heterogeneous patient population, spanning varying case complexities (such as lesional or non-lesional, and temporal or extra-temporal epilepsy), epilepsy types (focal and multi-focal) and clinical practices, while at the same time reflecting the standard of care success rates of ∼50% on average.
Of 28 success patients in our dataset, the source-sink algorithm agreed with clinicians in 26 (93%) of patients. In contrast, only 54% of patients with failed outcomes were considered in agreement with clinicians, suggesting that in these patients, the source-sink algorithm highlighted other potentially epileptogenic areas than the ones identified and treated. Furthermore, in terms of predicting surgical outcomes, the SSMs outperformed the HFO rate, a frequently proposed interictal biomarker of the EZ, predicting 79% outcomes correctly, compared with the 67% accuracy of the HFO model.
Generalizability of the SSMs
Importantly, although not shown here, we show in Supplementary Figs 8–12 that the SSMs were agnostic to the clinical complexity of each patient (as defined by our clinical team), size of the network (i.e. number of sEEG channels), as well as treatment methods, suggesting that the tool is highly generalizable. Furthermore, the performance was very similar across all centres (Supplementary Figs 9 and 11), indicating that the tool generalized well across different datasets and the overall probabilities and scores were not biased by any centre.
Biological evidence supporting the source-sink hypothesis
From a cytological perspective, the source-sink hypothesis is supported by evidence that seizures are prevented when the EZ is effectively inhibited by other brain regions. Glutamate, the primary excitatory neurotransmitter in the brain, has been implicated as a neurotoxic agent in epilepsy, and studies have suggested that a relative imbalance between glutamate and the inhibitory neurotransmitter GABA plays a central role in epilepsy.70 Healthy brain function requires a balance between glutamate uptake and release to maintain the concentration of extracellular glutamate within a homeostatic range.71 Several studies have demonstrated the existence of elevated levels of extracellular glutamate in animal models of epilepsy72 and in human epilepsy patients.73 Additionally, sodium dependent glutamate transporters (GLTs) are thought to be crucial in preventing accumulation of neurotoxic levels of glutamate in the extracellular space by clearing unbound extracellular glutamate. This suggests that fluctuations in the expression of GLTs may modulate epileptogenicity.74 In fact, previous studies have shown an increased number of GLTs in human dysplastic neurons and posit that this enables a ‘protective’ inhibitory mechanism surrounding the epileptogenic cortex.75 Taking this together, the inhibitory (sink phenomena) and the excitatory (source phenomena) events within the potential EZ may have a biological substrate in the differential expression of glutamate transporters within the EZ.
IEEG studies supporting the source-sink hypothesis
IEEG studies also provide evidence that support a source-sink hypothesis. Several studies have demonstrated a high inward directed influence to the EZ at rest.63,76–78 In a recent study, Narasimhan et al.76 stated that high inward connectivity may reflect inhibitory input from other regions to prevent the onset and spread of seizure activity, but the direction of these signals may flip when seizure activity begins. This is supported by iEEG studies in neocortical epilepsy demonstrating functional isolation of epileptogenic areas at rest79,80 and that increased synchronization in seizure-onset regions may be suggestive of an inhibitory surround.81 It has also been hypothesized that widespread network inhibition seen in temporal lobe epilepsy may have evolved to prevent seizure propagation81 and that a reduction of the inhibitory influence may lead to increased excitability and propagation of seizure activity.82,83 Taken together, other iEEG studies are consistent with the findings of the source-sink analysis. The biggest difference to the source-sink algorithm, however, is the way connectivity is measured within the brain network. Many studies use measures of connectivity that require the selection of a frequency range over which the analysis is performed.63,76,77,79,83 As there are numerous possibilities for selecting these frequency bands, some of which may lead to different outcomes, results will depend on the selection of the appropriate frequencies to capture the true characteristics of the brain activity. In contrast, the source-sink algorithm operates in the time-domain and thus does not rely on any parameters to be specified a priori.
Source-sink results in line with the source-sink hypothesis
We also investigated source-sink properties of the iEEG network during ictal periods (Supplementary material). We found that in patients with a successful outcome (Supplementary Figs 16 and 17), CA-EZ channels had significantly higher SSM values compared with the rest of the channels during interictal periods, suggesting they were top sinks strongly influenced by top sources. However, during and right after seizure, the same channels had low SSMs, that is, they exhibited a strong source-like behaviour, which is in line with the source-sink hypothesis.
Challenges
Why the source-sink algorithm may disagree with clinicians in patients with a successful surgical outcome
For most patients with a successful outcome, the source-sink algorithm was in agreement with the clinicians regarding the location of the EZ (Fig. 7); the algorithm and clinicians were deemed to disagree in only 2 of 28 cases. In addition to completely removing the EZ, a disconnection of the EZ from the rest of the epileptogenic network or removal of the regions responsible for early spread of the seizure activity may also lead to a successful surgical outcome. Thus, it is possible that in these patients, the treated areas may have included the early spread regions instead of the onset zone and therefore did not overlap with the areas highlighted by the source-sink algorithm.
Why the source-sink algorithm may agree with clinicians in patients with a failed surgical outcome
Surgical treatment may fail for various reasons and, in more complex cases, removing the EZ may not be sufficient to achieve seizure freedom (e.g. a removal of the primary focus in multi-focal patients may lead to post-surgical emergence of seizures from a location that was previously not clinically evident). Consequently, the source-sink algorithm may be in full or some agreement with the treated areas, even in patients with failed outcomes. Additionally, incorrect or inaccurate localization of the EZ and incomplete treatment of these regions most likely leads to seizure recurrence after surgery. This can occur in cases where the implanted electrodes do not cover the true EZ, in which case it is impossible (for clinicians and algorithms) to detect the true EZ or whether the EZ is widely spread. Finally, in some patients, a complete resection of the EZ cannot be performed without causing a new, unacceptable deficit to the patient (e.g. if the EZ is in eloquent cortex). Instead, palliative treatments, including responsive neurostimulation or deep brain stimulation, have been used increasingly in patients who are not candidates for resective surgery or choose not to undergo resection. These treatments can be effective in reducing seizure frequency, but only a minority of patients experience complete seizure control.84–86 Thus, since responsive neurostimulation treatment may be selected for reasons that preclude resection of the EZ, the patient may have had a failed outcome even when the areas highlighted by the source-sink algorithm overlap with the CA-EZ.
Limitations of the most common interictal iEEG markers of the EZ
HFOs are some of the most studied iEEG features as a potential interictal marker of the EZ.25,28,29,35,60,61,87–101 However, there still remains considerable controversy surrounding HFOs as a valid EZ marker. Although there is evidence that regions belonging to the EZ have higher HFO rates compared with non-epileptogenic regions,29,66,87,88,90–92,99,100 other studies have not found a predictive value in the removal of these regions,88,92 and two meta-analyses of existing studies concluded that the evidence of HFOs as a predictor of surgical outcome is weak.89,102
Furthermore, several studies have questioned the reproducibility and reliability of HFOs as a EZ marker.45,91,92,103–108 First, there is variability in the exact features used to define HFOs,91,109 and second, HFOs can occur in non-epileptogenic regions and even in patients without epilepsy.45,110–112 Finally, HFO rates are not stable over time. Gliske et al.45 tested the consistency of channels exhibiting the highest number of HFOs across different 10 min segments of data. They showed that the location of the highest HFO-rate channels varied greatly when different segments were used. In contrast, we showed above that the source-sink analysis returns consistent results independent of recording length and is in fact, robust to any random selection of interictal activity (Fig. 4). Furthermore, we repeated the analysis with and without the removal of large artifacts from the sEEG snapshots and found that the results held.
Limitations and future directions
In this study, we performed a direct comparison between SSMs and HFOs on the same datasets. However, it is important to note that the sEEG snapshots in this study were short in duration compared with other HFO studies that often use hours of interictal data.25,28,45,64,67,68 While generating quantitative markers on short snapshots of sEEG data is an advantage of the SSM approach, the same comparison should be performed on longer datasets where HFO rates are more accurately captured. It may be the case that HFOs become comparable or better than SSMs when computed from longer snapshots, and thus both markers may have their pros and cons. That is, one computational marker may be more accurate for short snapshots and another for long snapshots. This is an important next step to pursue.
Validation of any iEEG marker remains challenging, because the EZ is a theoretical concept that cannot be directly measured,8 and thus no ground truth of its exact location exists. Instead, the best estimate that can be obtained is retrospectively, by assuming the EZ was included in the treated regions if surgical treatment renders the patient seizure free. Although the EZ hypothesis and treated areas may not always overlap completely, especially in patients treated with responsive neurostimulation, we defined the CA-EZ based on the presurgical EZ hypothesis and not the treated areas for two reasons. First, postoperative MRI data were not available for research purposes from all centres, and thus we were unable to confirm the precise locations of treated areas in some patients. Second, we envision the tool as an assistive computational tool to help clinicians form their EZ localization hypothesis. As such, the tool is designed to provide an additional source of information as they look for concordance with all other data regarding the location of the EZ. However, we note that generally the CA-EZ and treated areas greatly overlap, because surgical treatment is based on the CA-EZ, with small variations. Thus, we do not expect the definition of the EZ to bias the metrics used to evaluate the performance of the source-sink algorithm.
Because of the spatial resolution of the iEEG contacts, the DNMs cannot distinguish between excitatory and inhibitory connections, and thus the only information we can glean from the models is the amount of influence between any two nodes in the network. The high predictive performance of the SSMs does, however, suggest that the sources are likely dominated by inhibitory influence, consistent with the source-sink hypothesis. To understand the excitatory or inhibitory nature of the connections, future work may entail complementing the iEEG data with interictal functional MRI (rs-fMRI), which has a poorer temporal resolution, but generally a higher spatial resolution compared with iEEG.113 Thus, combining iEEG and rs-fMRI could provide a better understanding of the directionality of the network connections.114
In patients with electrodes targeting the hippocampal region, the hippocampal contacts were frequently identified as top sinks in the iEEG network. The hippocampus is a highly connected structure,78,115 and studies of mesial temporal lobe epilepsy (MTLE) have demonstrated the existence of strong connections within the hippocampal network in both epileptogenic as well as non-epileptogenic hippocampi.78,116,117 As such, the hippocampus is a structure that is highly influenced by other regions and by its nature acts as a sink in the brain network regardless of its epileptogenicity. Moreover, we found that in MTLE patients, contacts recording from the contralateral hippocampus commonly exhibited a stronger sink-like behaviour than the epileptogenic hippocampus. This connectivity asymmetry across hemispheres is in line with findings of other studies, which have demonstrated a decreased functional connectivity within the epileptogenic hippocampal networks with a concurrent increased connectivity in contralateral hippocampal pathways, possibly reflecting compensatory mechanisms with strengthening of alternative pathways.78,118–120 To that end, the connectivity patterns and sink-like behaviour of the hippocampus need to be taken into consideration as results of the source-sink analysis are reviewed and interpreted. Although the tool performs well with the hippocampal electrodes included in the datasets, as reflected by our results, there might be cases where these electrodes could be removed (e.g. hippocampi were sampled but were not suspected to be involved in seizure onset). Our preliminary testing has shown that inclusion or removal of hippocampal electrodes does not alter the source-sink behaviour of other contacts in the iEEG network and thus, a future augmentation of the tool could include an option to remove these electrodes before visual interpretation of the source-sink results is performed by clinicians.
Finally, the algorithm was developed and validated on adult patients only. Although we expect the results to hold in the paediatric population, an important next step would be a robust evaluation of the SSMs on interictal iEEG data from a large population of children with drug-resistant epilepsy.
In conclusion, our results suggest that the SSMs, metrics entirely based on the properties of the iEEG network at rest, capture the characteristics of the regions responsible for seizure initiation. The SSMs could significantly improve surgical outcomes by increasing the precision of EZ localization.
Funding
K.M.G. was supported by a grant from the American Epilepsy Society; S.V.S. was supported by National Institutes of Health R21 NS103113; N.W.C. was supported by an NIH T32 training grant; S.I. and K.A.Z. were supported by the Intramural Research Program at the National Institute of Neurological Disorders and Stroke.
Competing interests
The authors report no competing interests.
Supplementary material
Supplementary material is available at Brain online.
References
Author notes
Adam Li, Rachel J. Smith, Jorge Gonzalez-Martinez and Sridevi V. Sarma contributed equally to this work.

