Understanding Fundamental Phenomena Affecting the Water Conservation Technology Adoption of Residential Consumers Using Agent-Based Modeling


Abstract
:1. Introduction
2. Background
2.1. Water Conservation Affordability
2.2. Water Price and Incentives
2.3. Education and Demographics
2.4. Household/Building Attributes
2.5. Social Network Influence
3. Significance
4. Methodology
4.1. Agent-Based Modeling
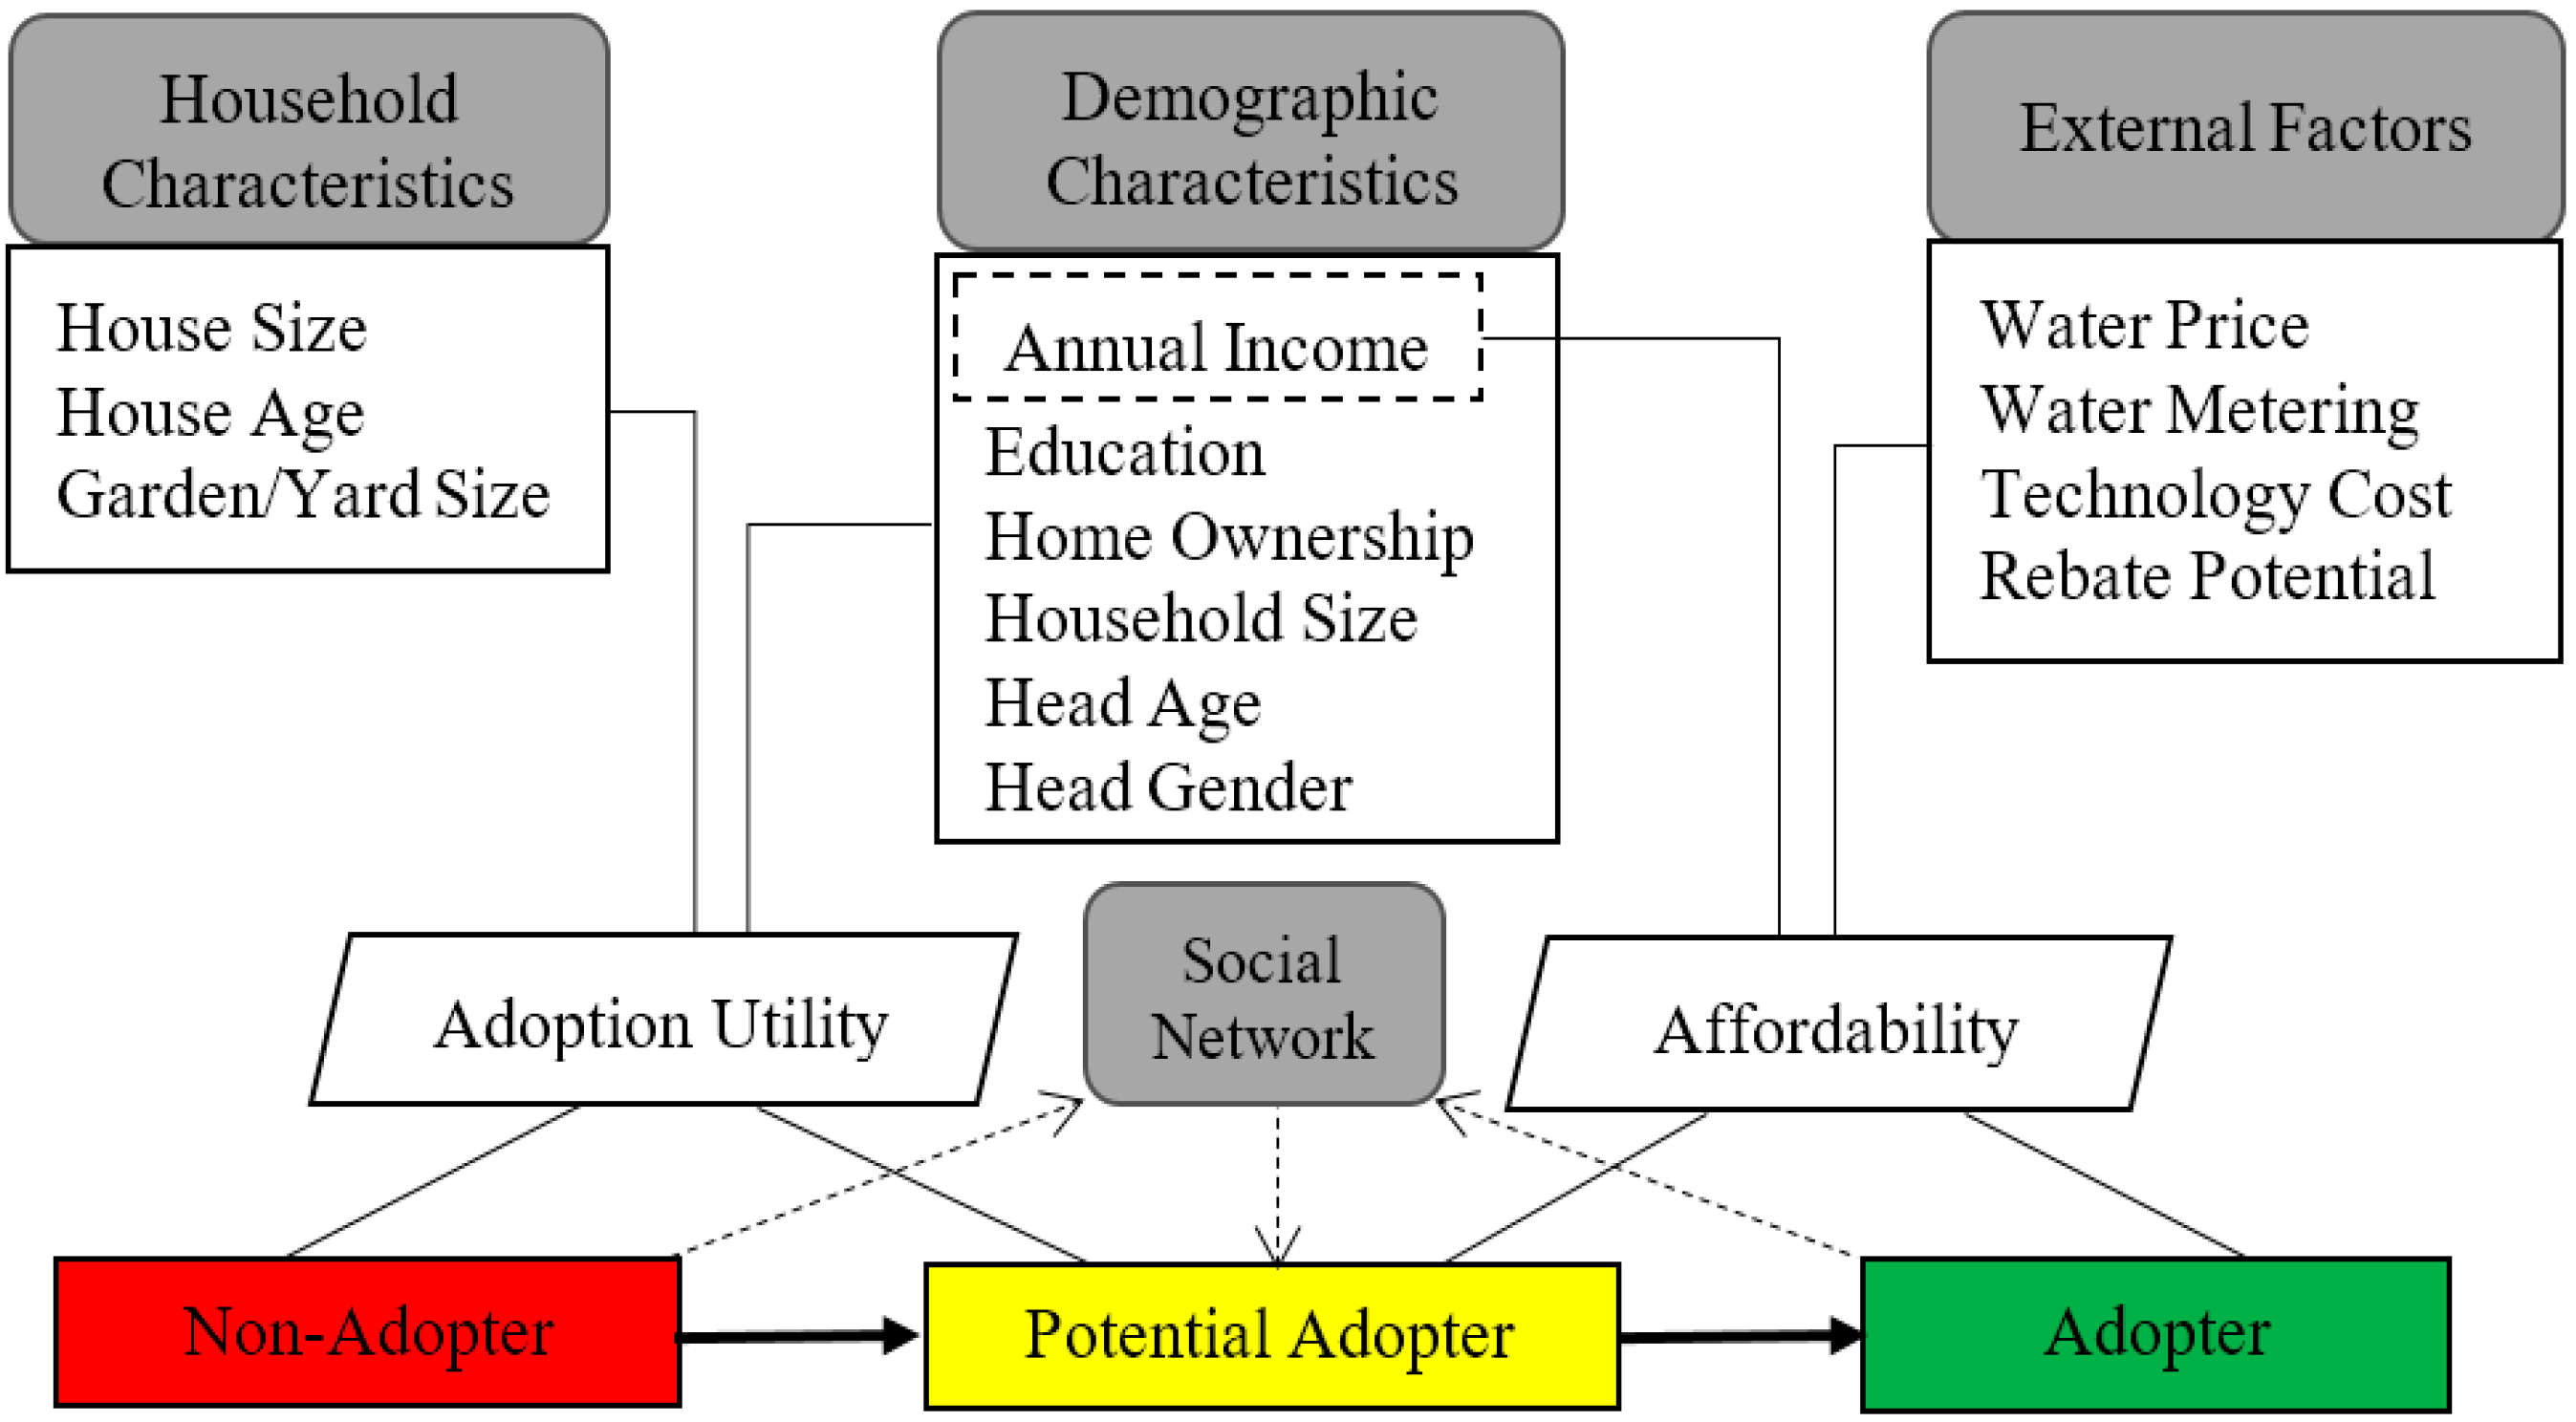
4.2. Theoretical Framework
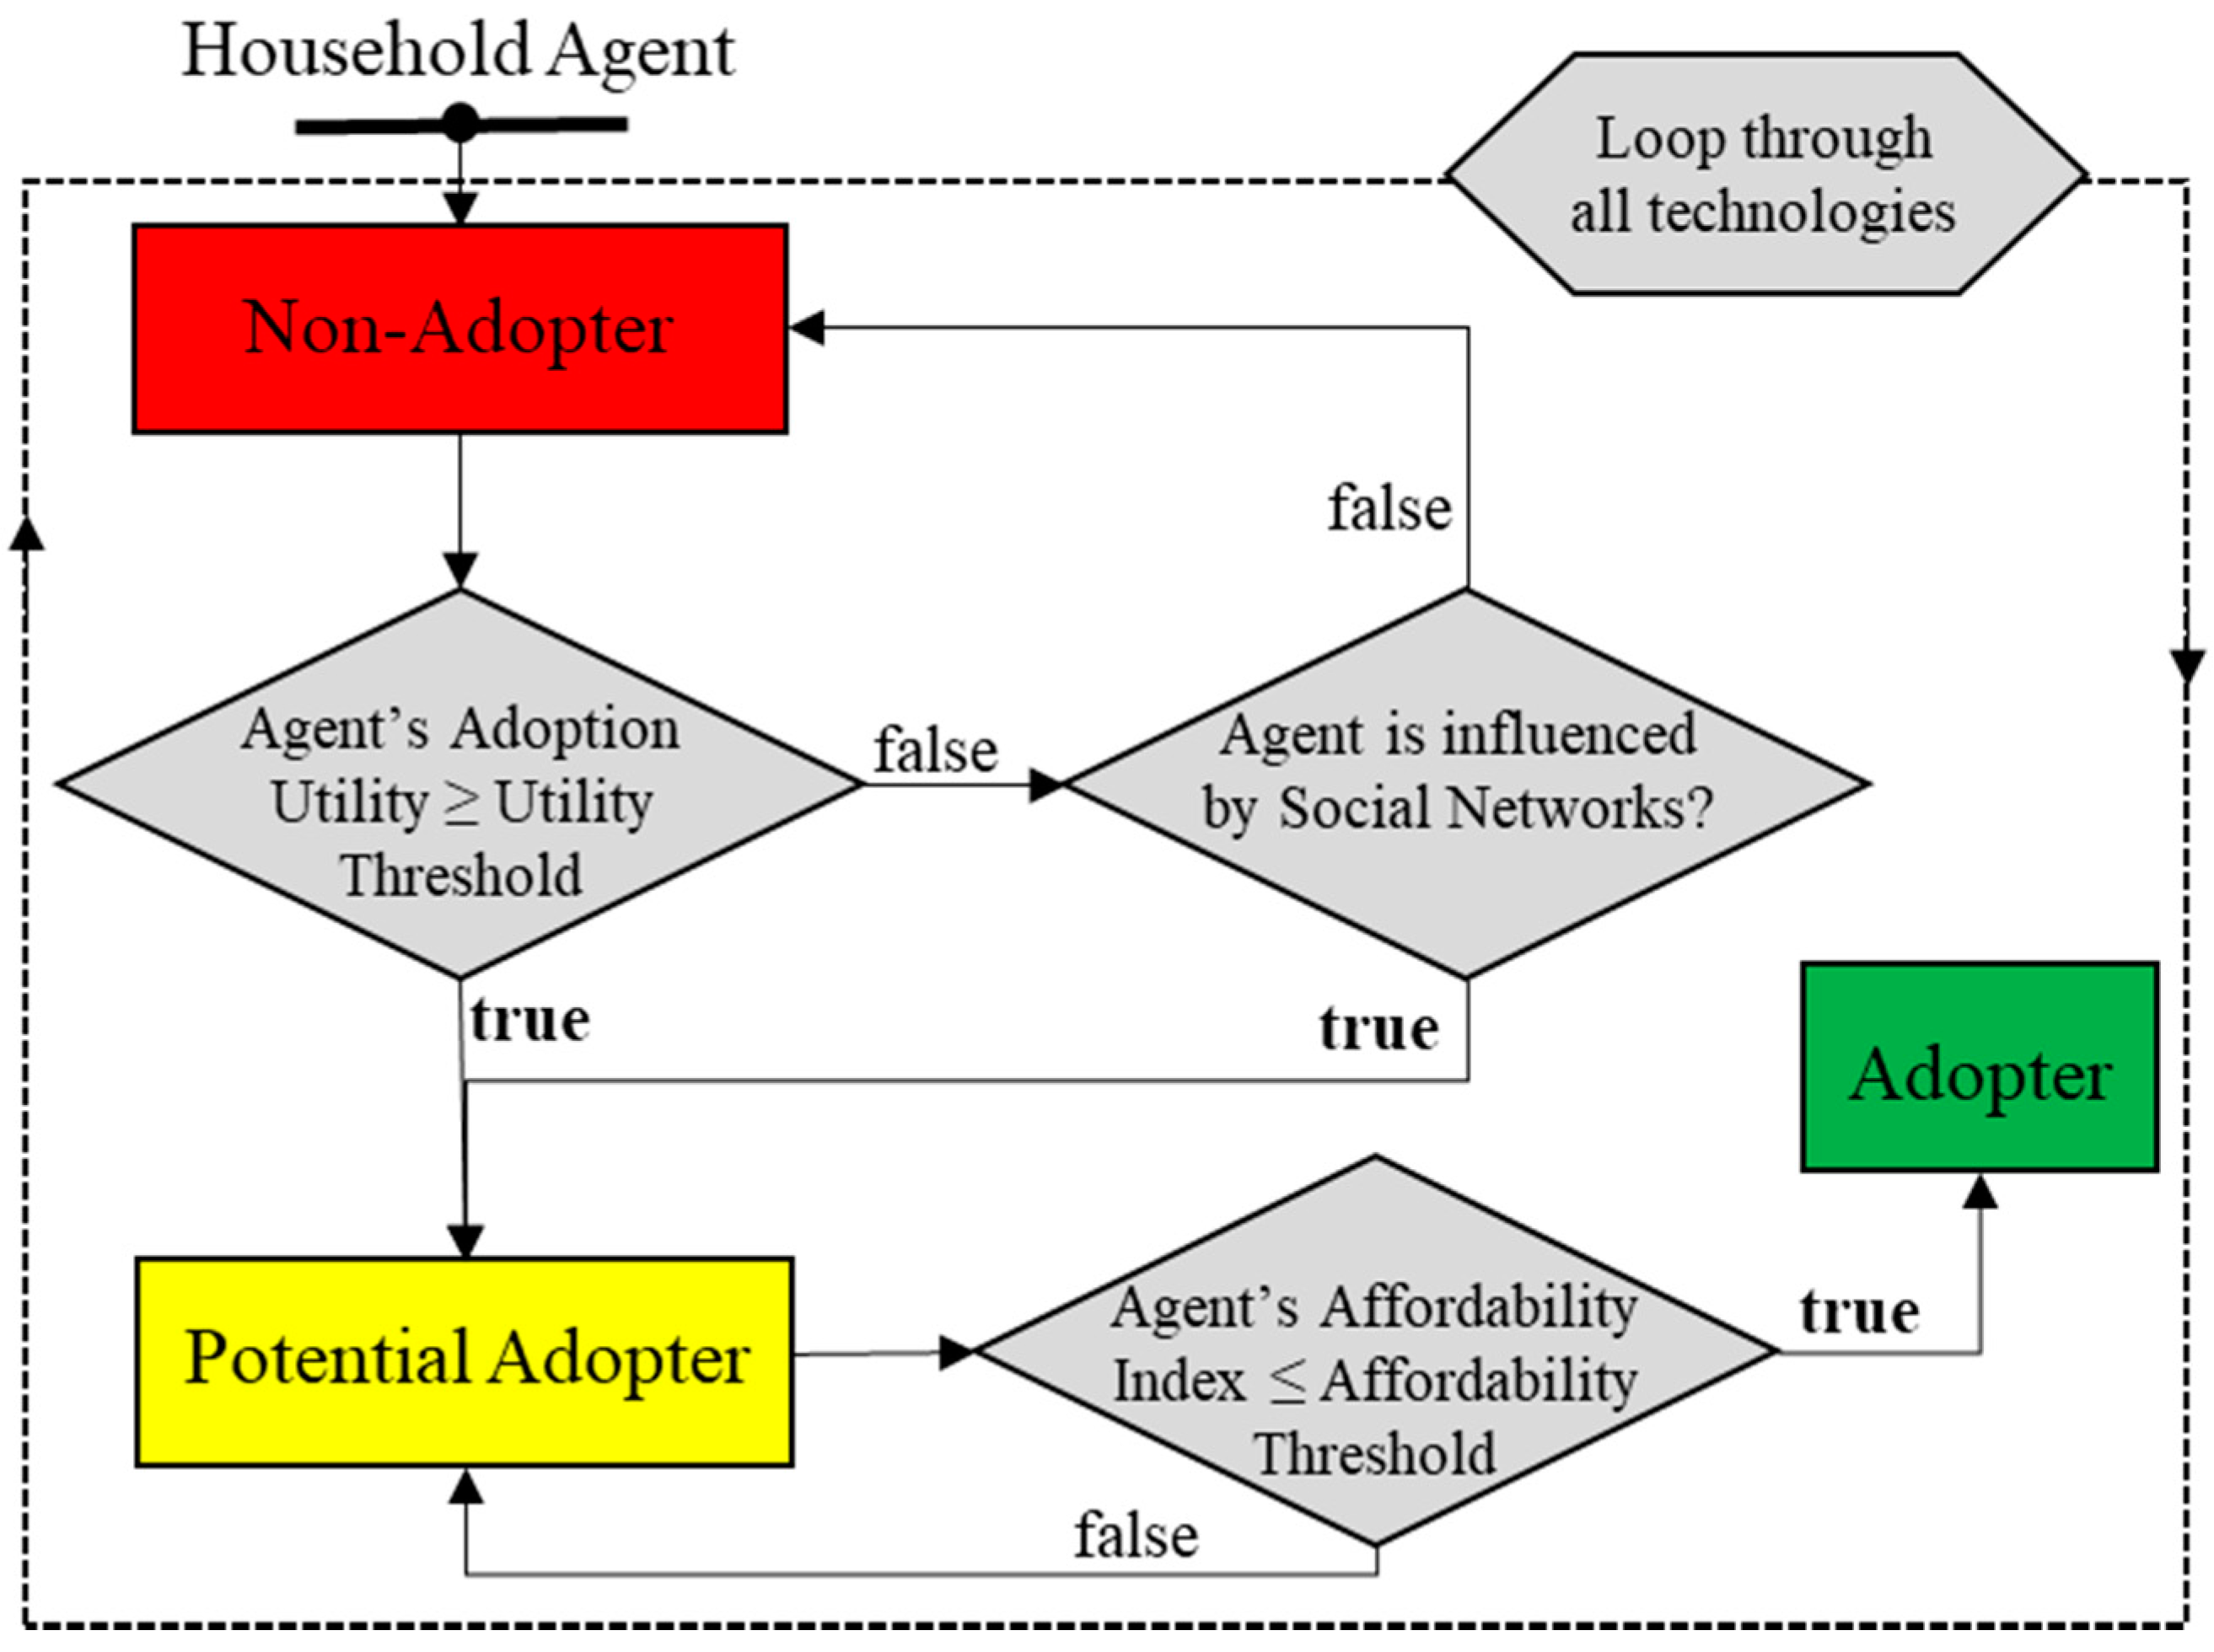
4.3. Computational Simulation
4.4. Model Initialization and Implementation
5. Model Verification and Validation
6. Scenario Setting
7. Results and Discussion
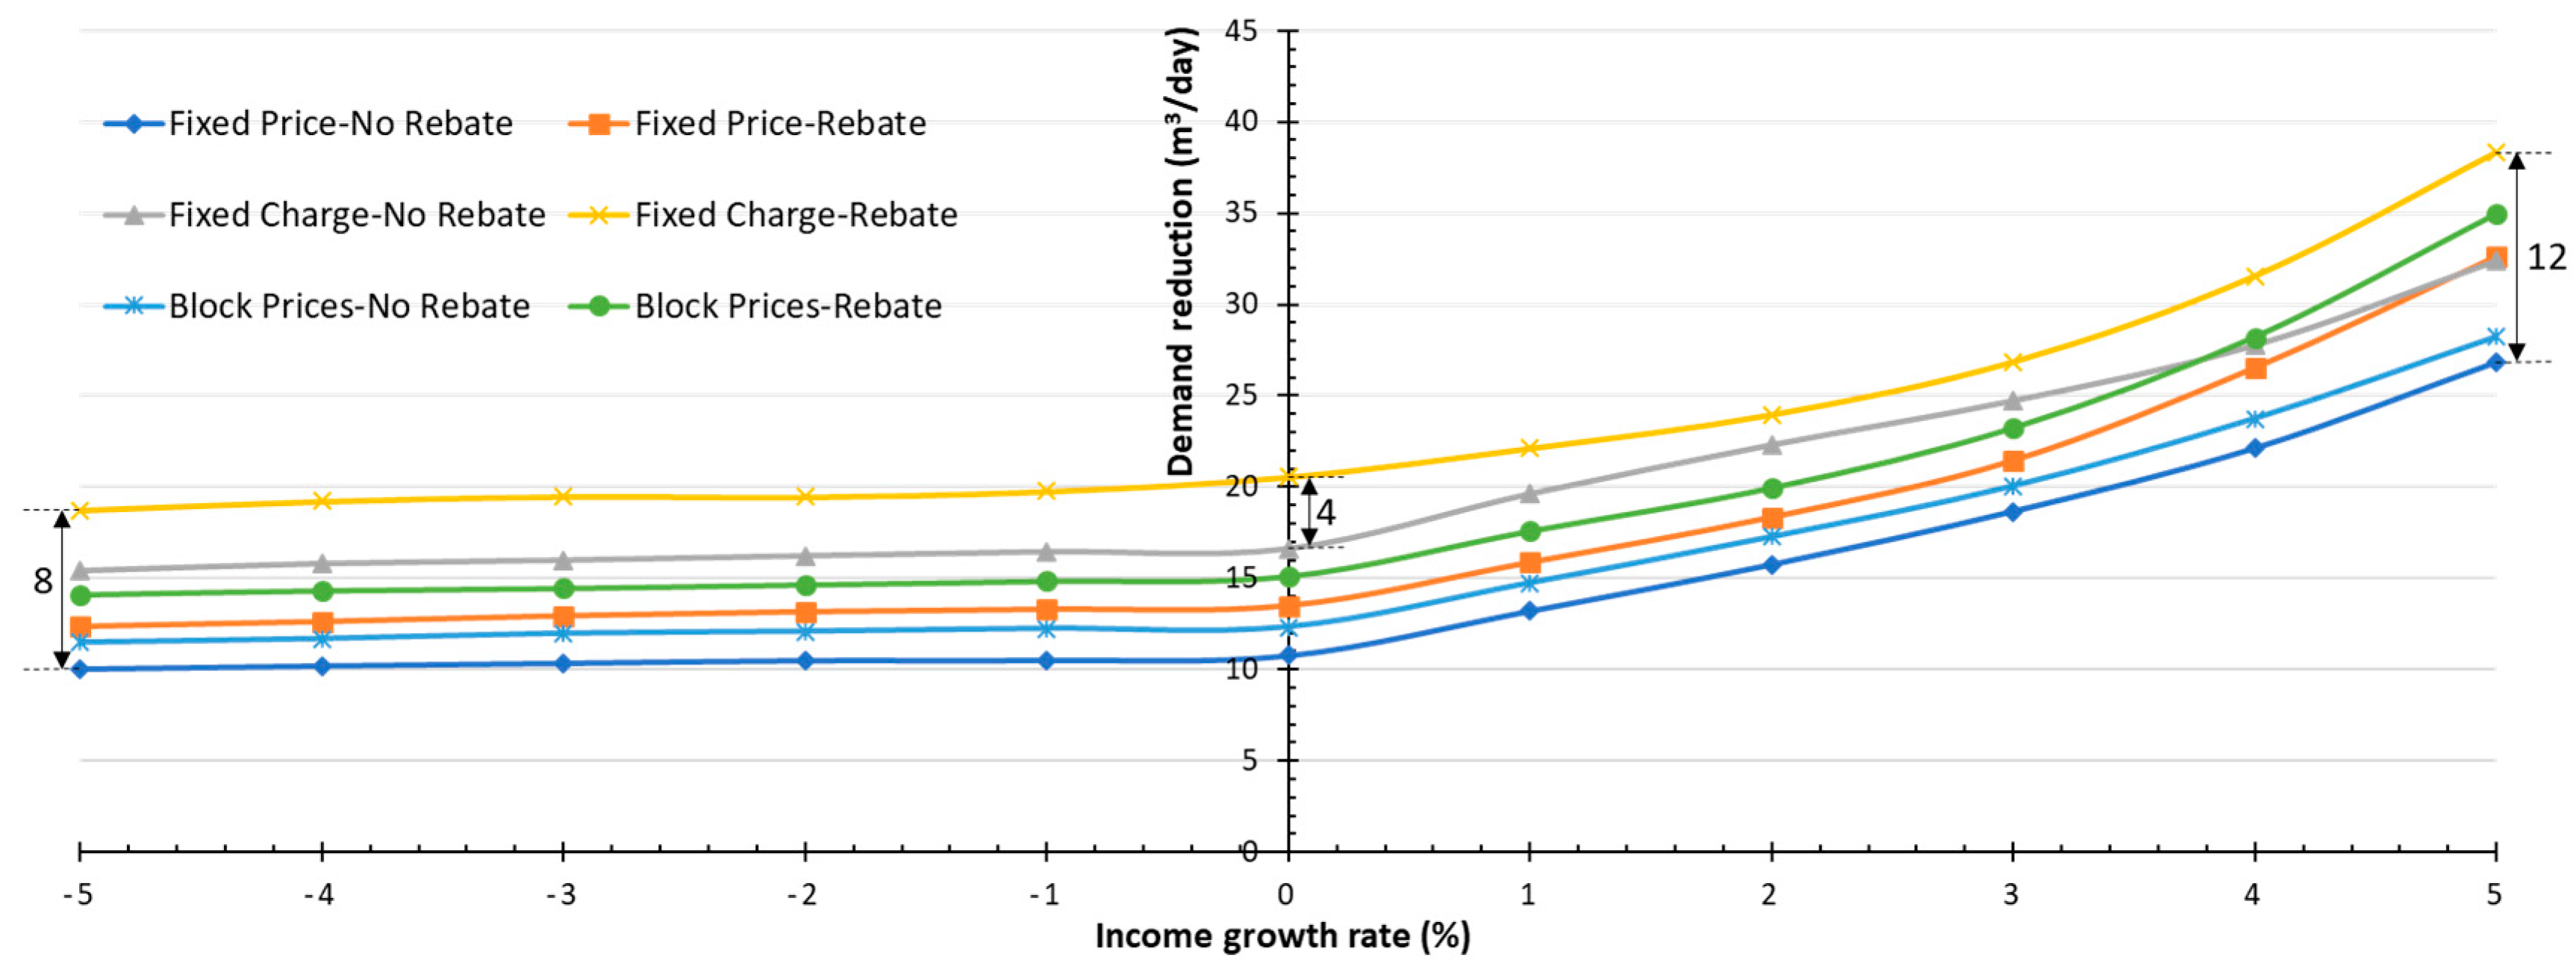
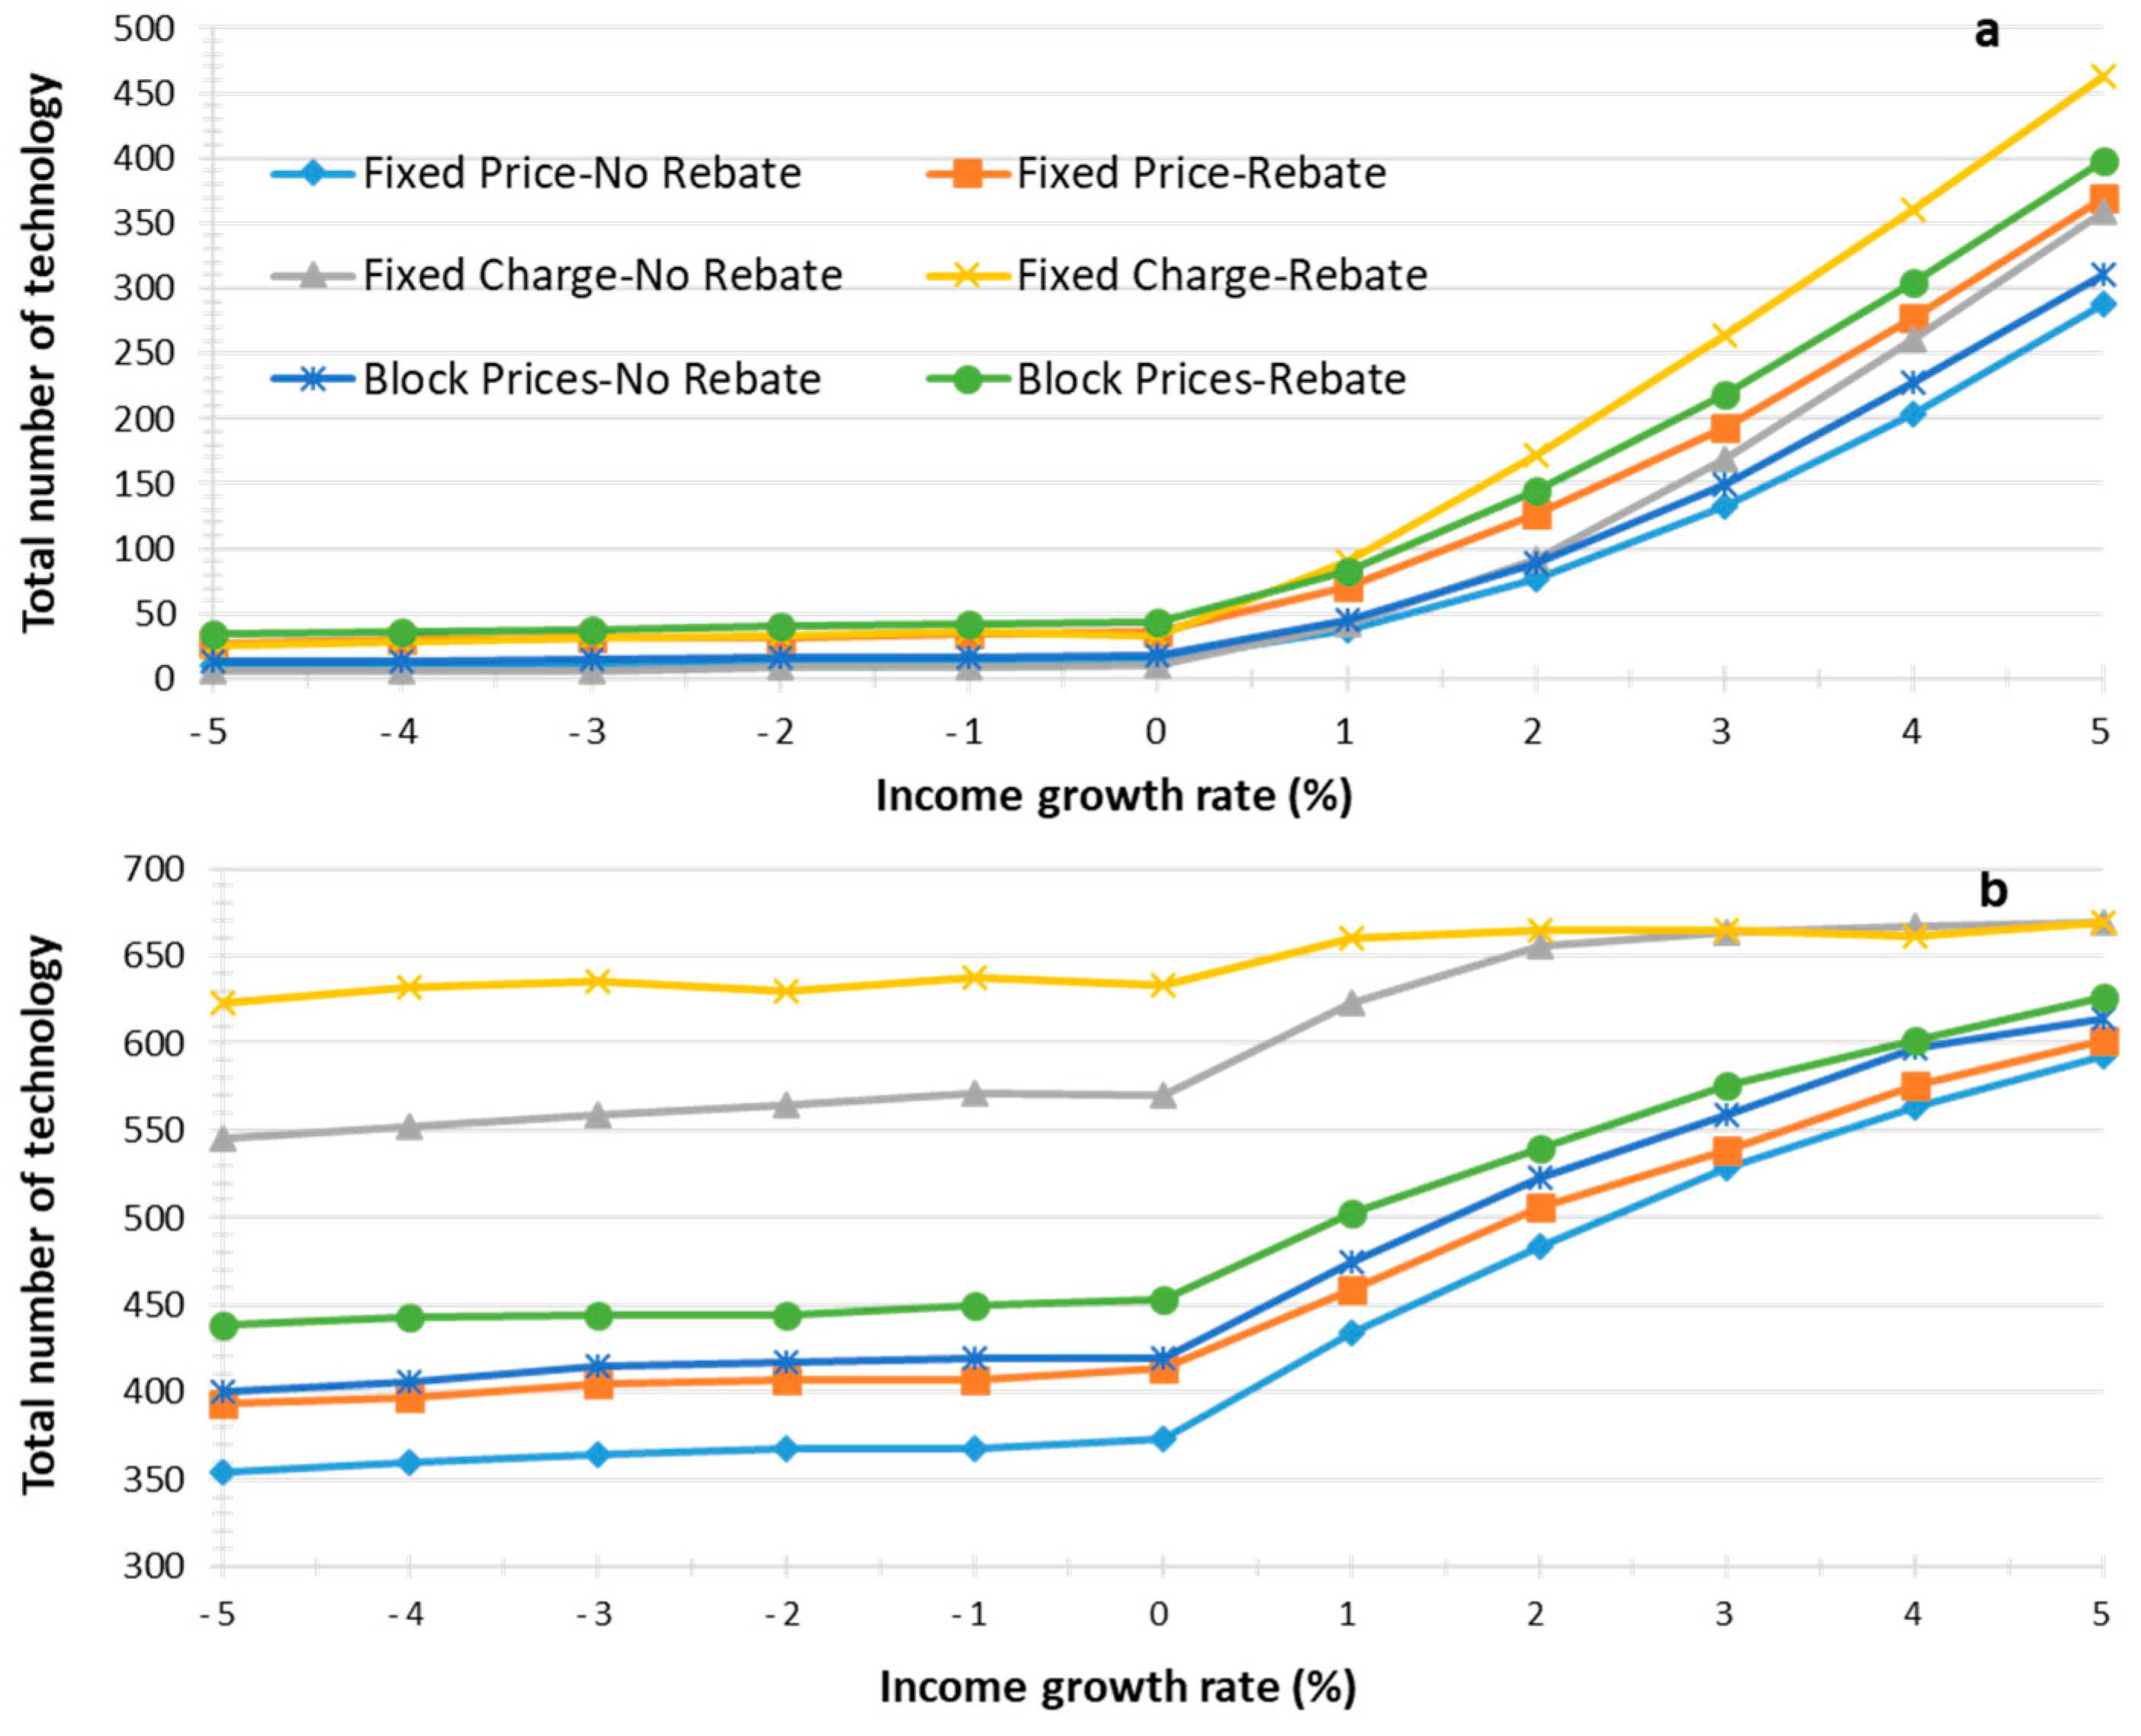
7.1. Socioeconomic Scenario Analysis
7.2. Social Network Influence Examination
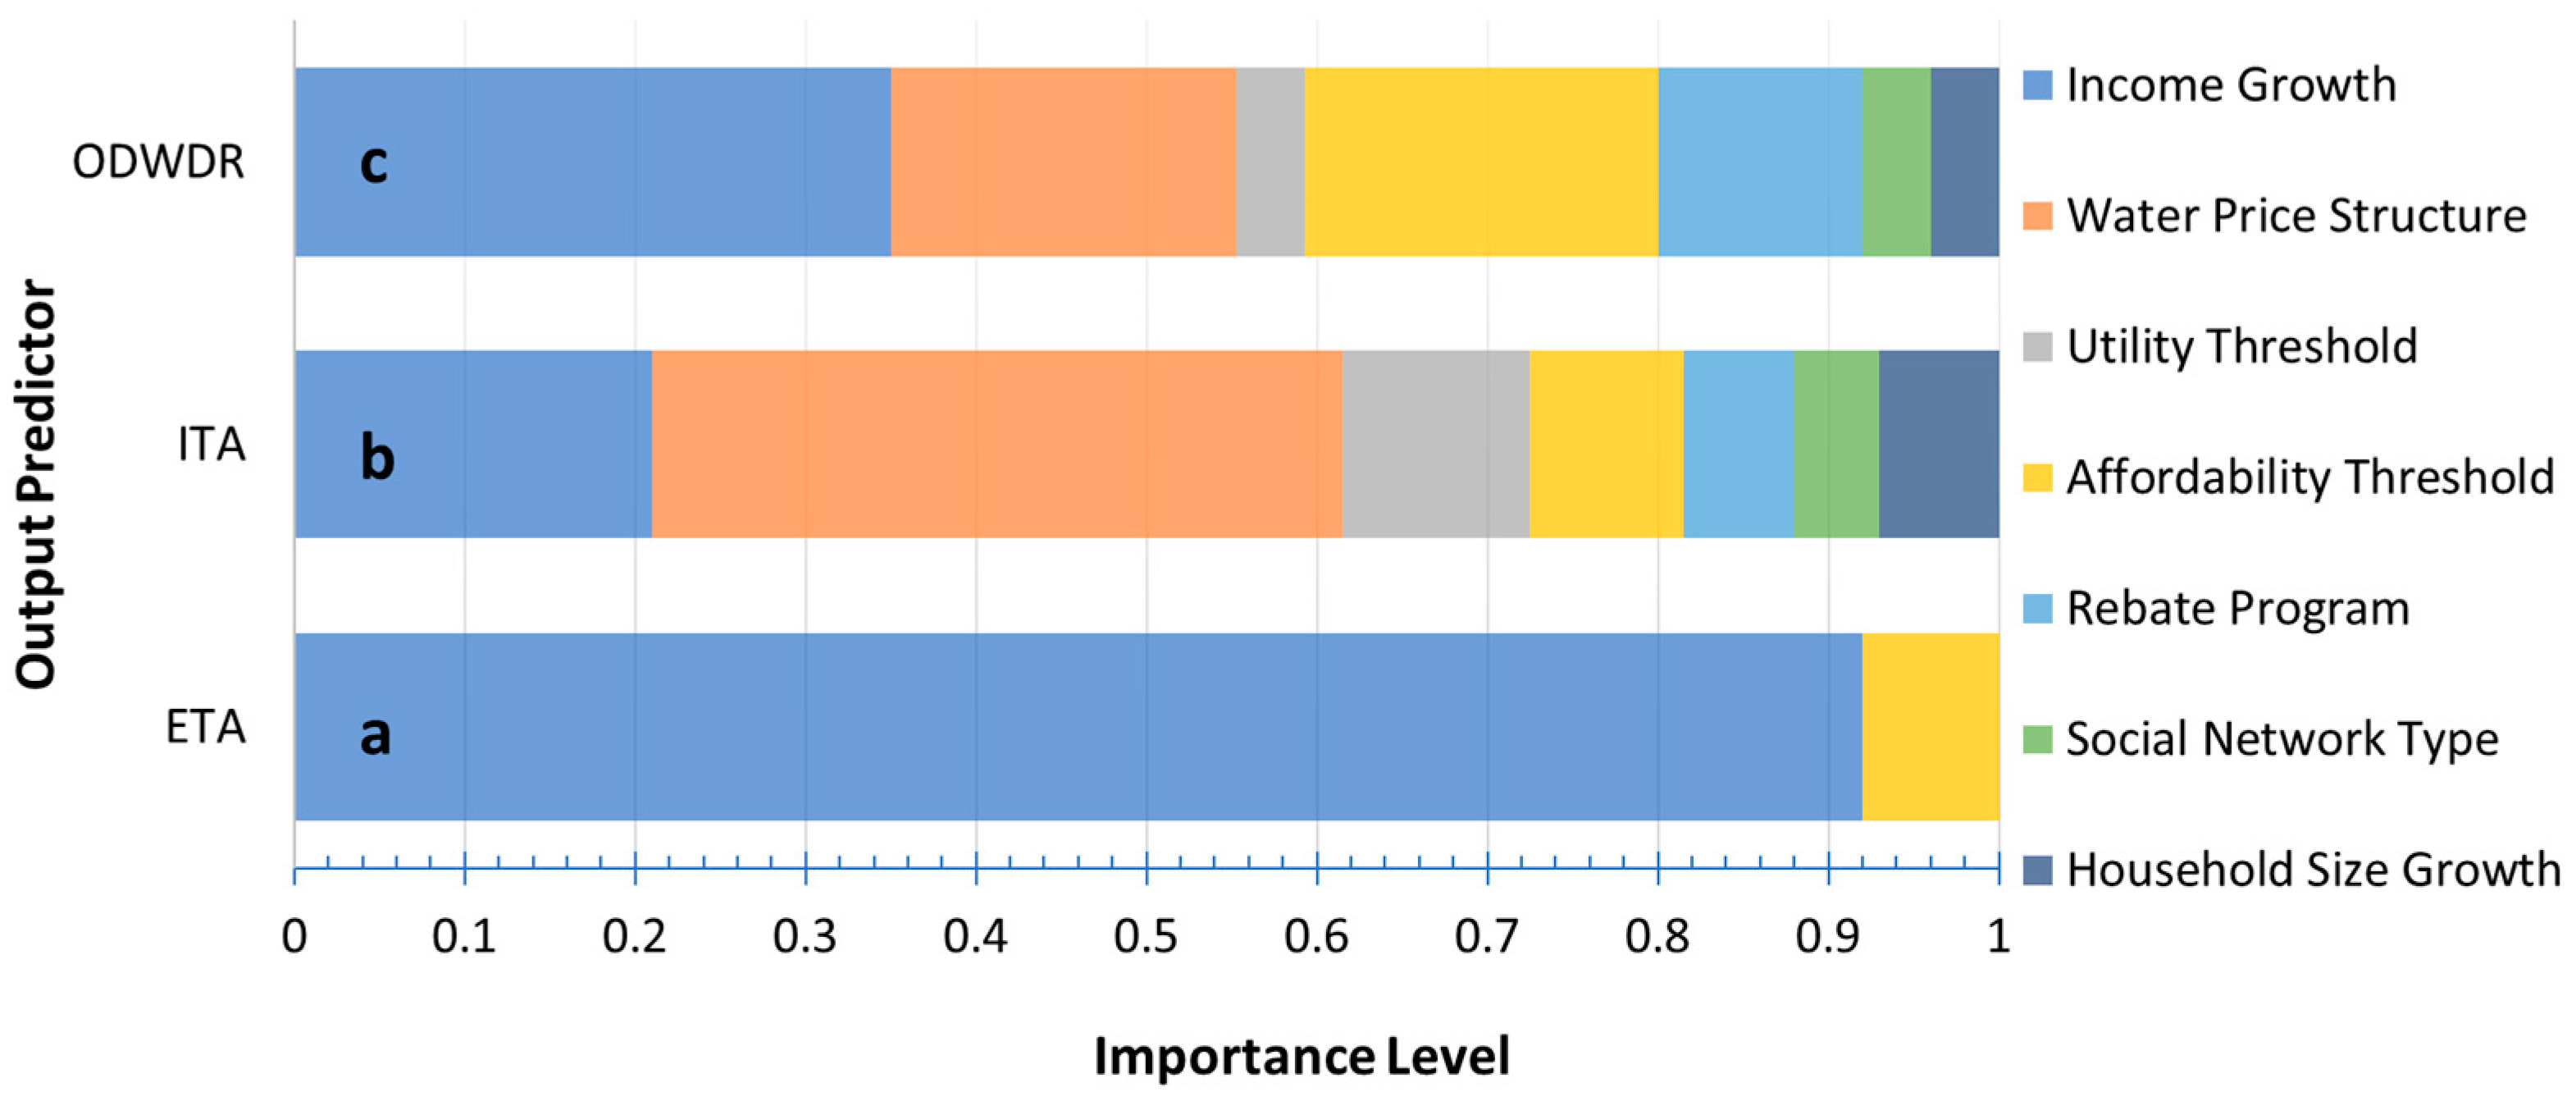
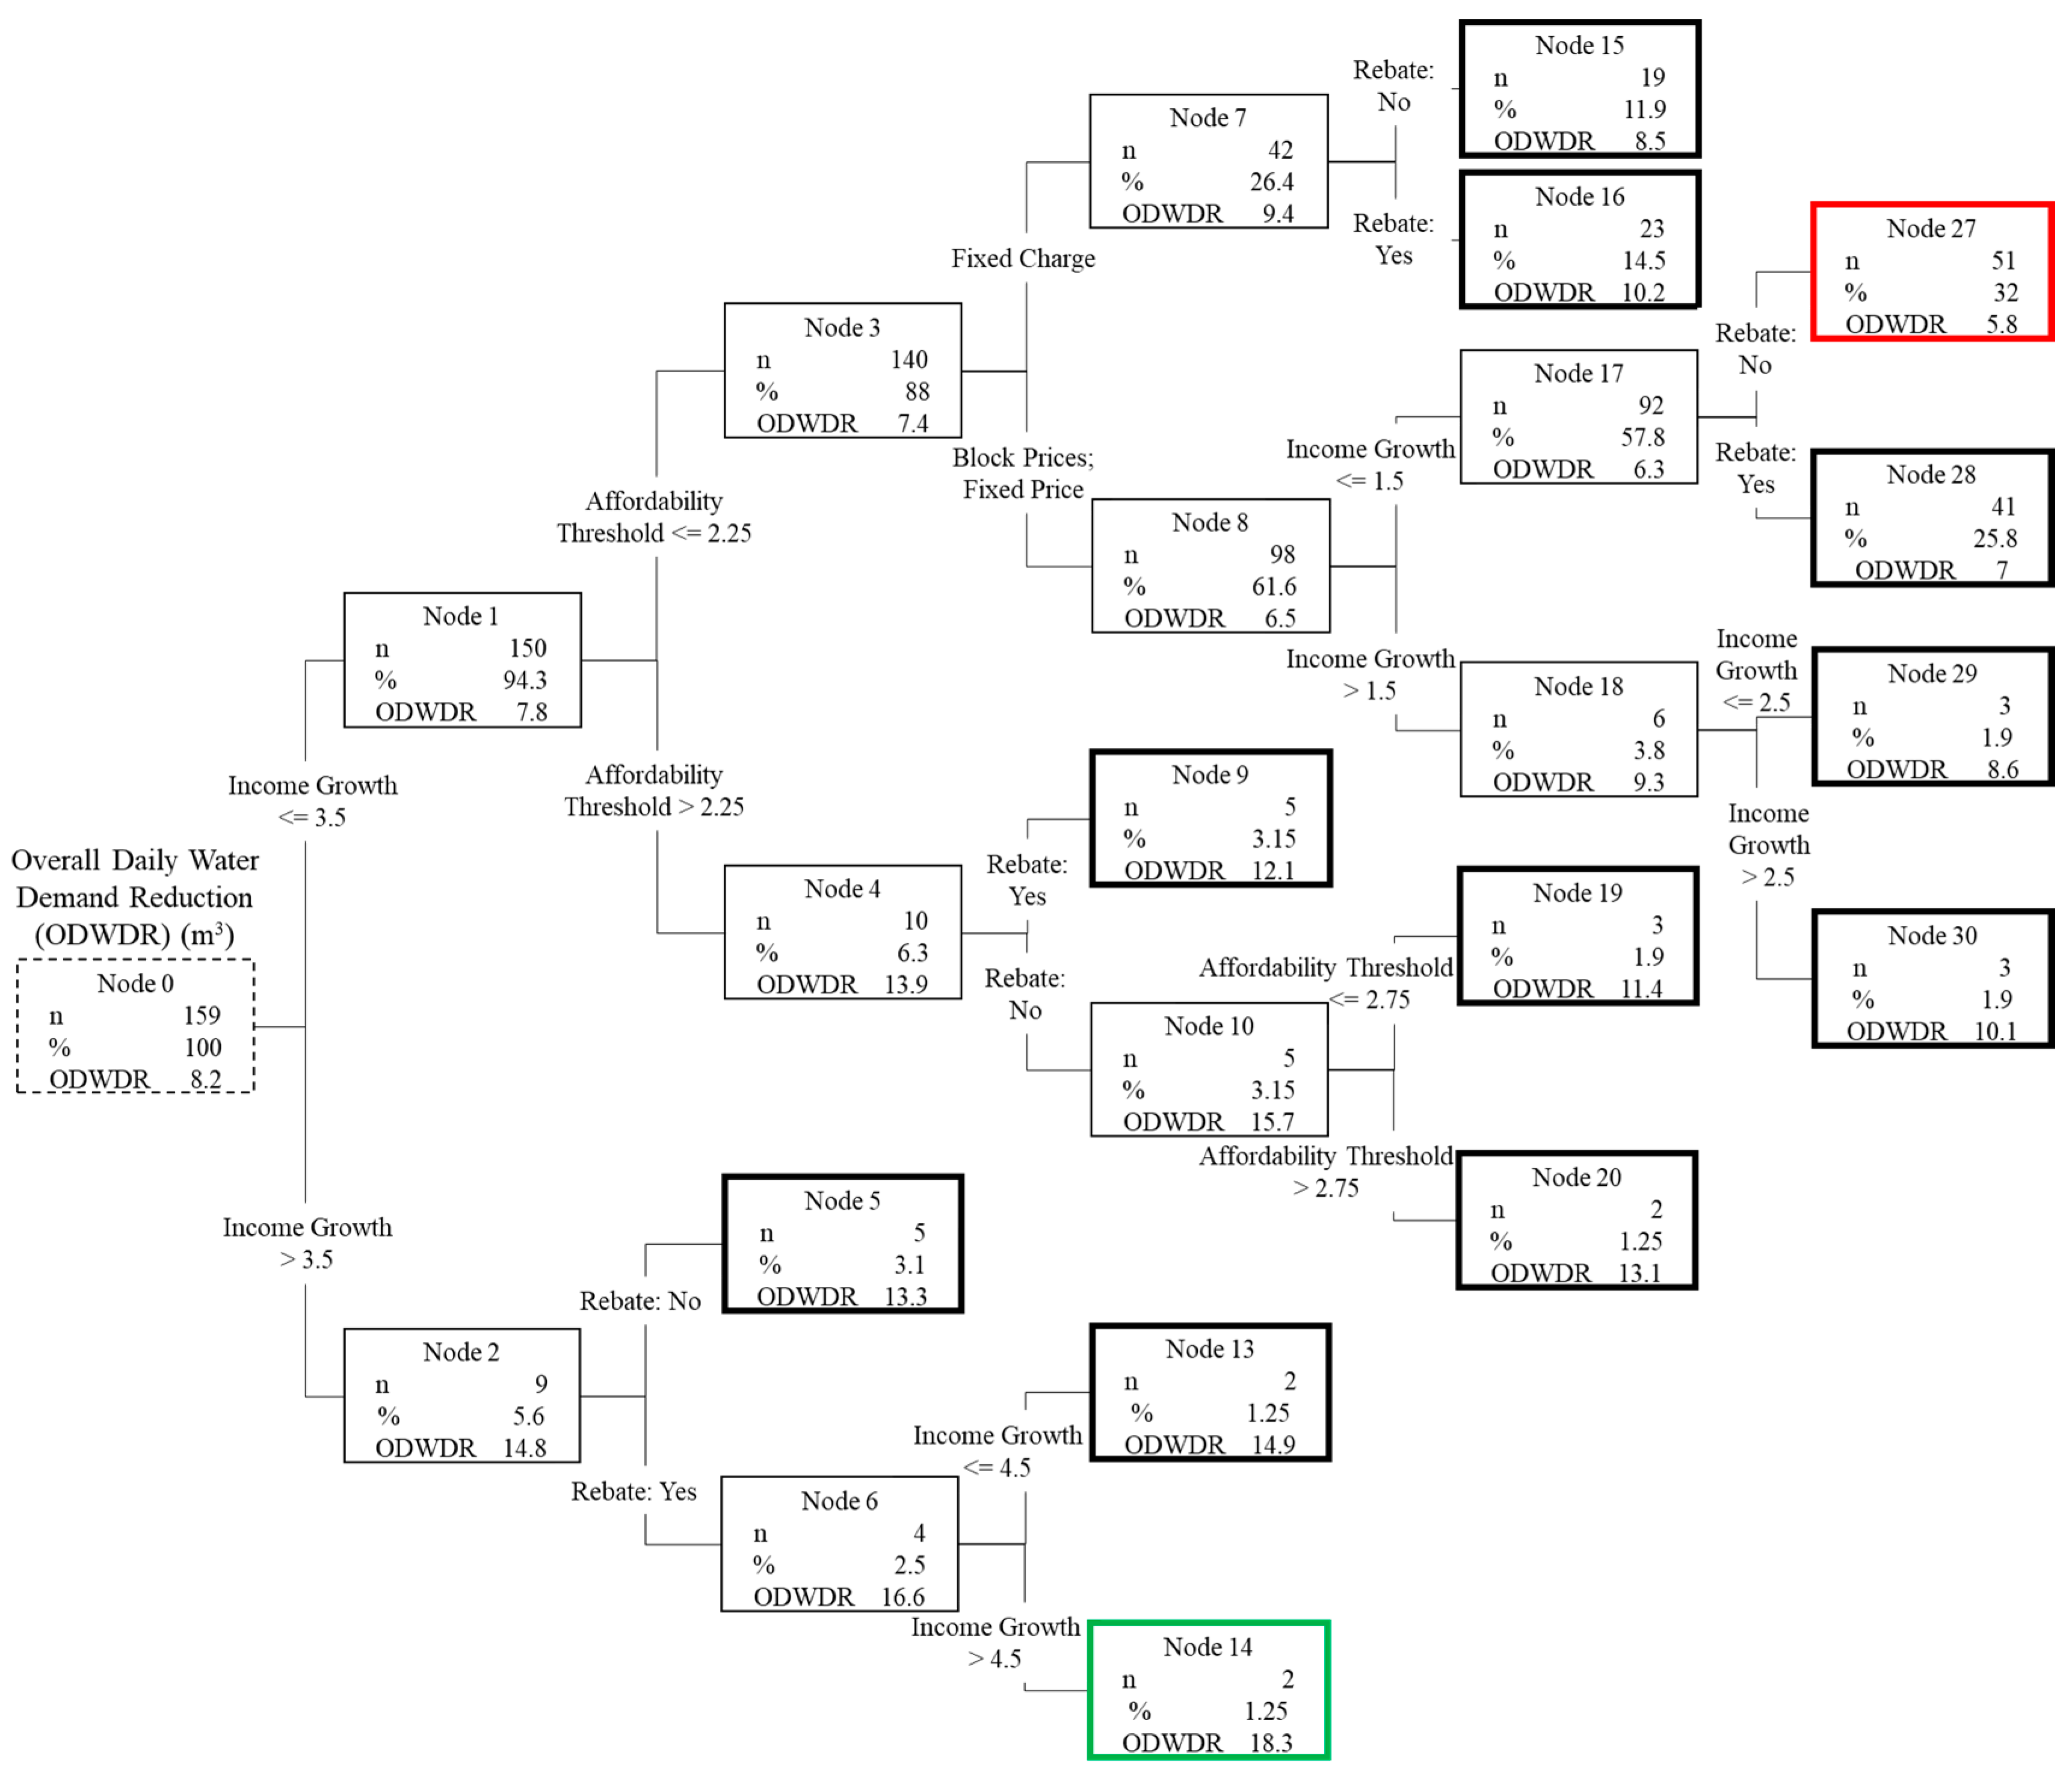
7.3. Scenario Landscape Analysis
8. Concluding Remarks
9. Limitations and Future Studies
Author Contributions
Funding
Acknowledgments
Conflicts of Interest
Appendix A

| Variable | Value | Coefficient | Distribution Type |
|---|---|---|---|
| Education: | |||
| High school or less | If Yes = 1, if No = 0 | 1.92 | Real data |
| Some college | If Yes = 1, if No = 0 | 2.58 | |
| College graduate | If Yes = 1, if No = 0 | 2.91 | |
| Advanced degree | If Yes = 1, if No = 0 | 4.39 | |
| Income | |||
| Less than $40,000 | If Yes = 1, if No = 0 | 0 | Real data |
| $40,000–$75,000 | If Yes = 1, if No = 0 | 1.07 | |
| Above $75,000 | If Yes = 1, if No = 0 | 1.58 | |
| Home ownership | Owner = 1, Renter = 0 | 1.84 | Real data |
| Head gender | Female = 1, Male = 0 | 1.21 | Random |
| Resident (head) age | Years | 1.01 | Histogram |
| House size | Square feet | 1 | Uniform (70; 56,000) |
| Garden size | Square feet | 1 | Uniform (0; 8000) |
| House age | Years | 0.99 | Random (1100) |
| Household size | Numbers | 0.98 | Real data |
| Technology | Price ($) | Potential Rebate ($) | Expected Water Savings (Gal/Day/Capita) | Category |
|---|---|---|---|---|
| Bathroom faucet | 15 | 15 | 0.57 | Inexpensive |
| Kitchen faucet | 15 | 15 | 2.8 | Inexpensive |
| Showerhead | 100 | 25 | 4.85 | Inexpensive |
| Toilet | 420 | 50 | 1.63 | Expensive |
| Washing machine | 670 | 150 | 6.91 | Expensive |
| Dishwasher | 500 | 50 | 0.35 | Expensive |
| Network Structure | Attribute | Parameter | Parameter values |
|---|---|---|---|
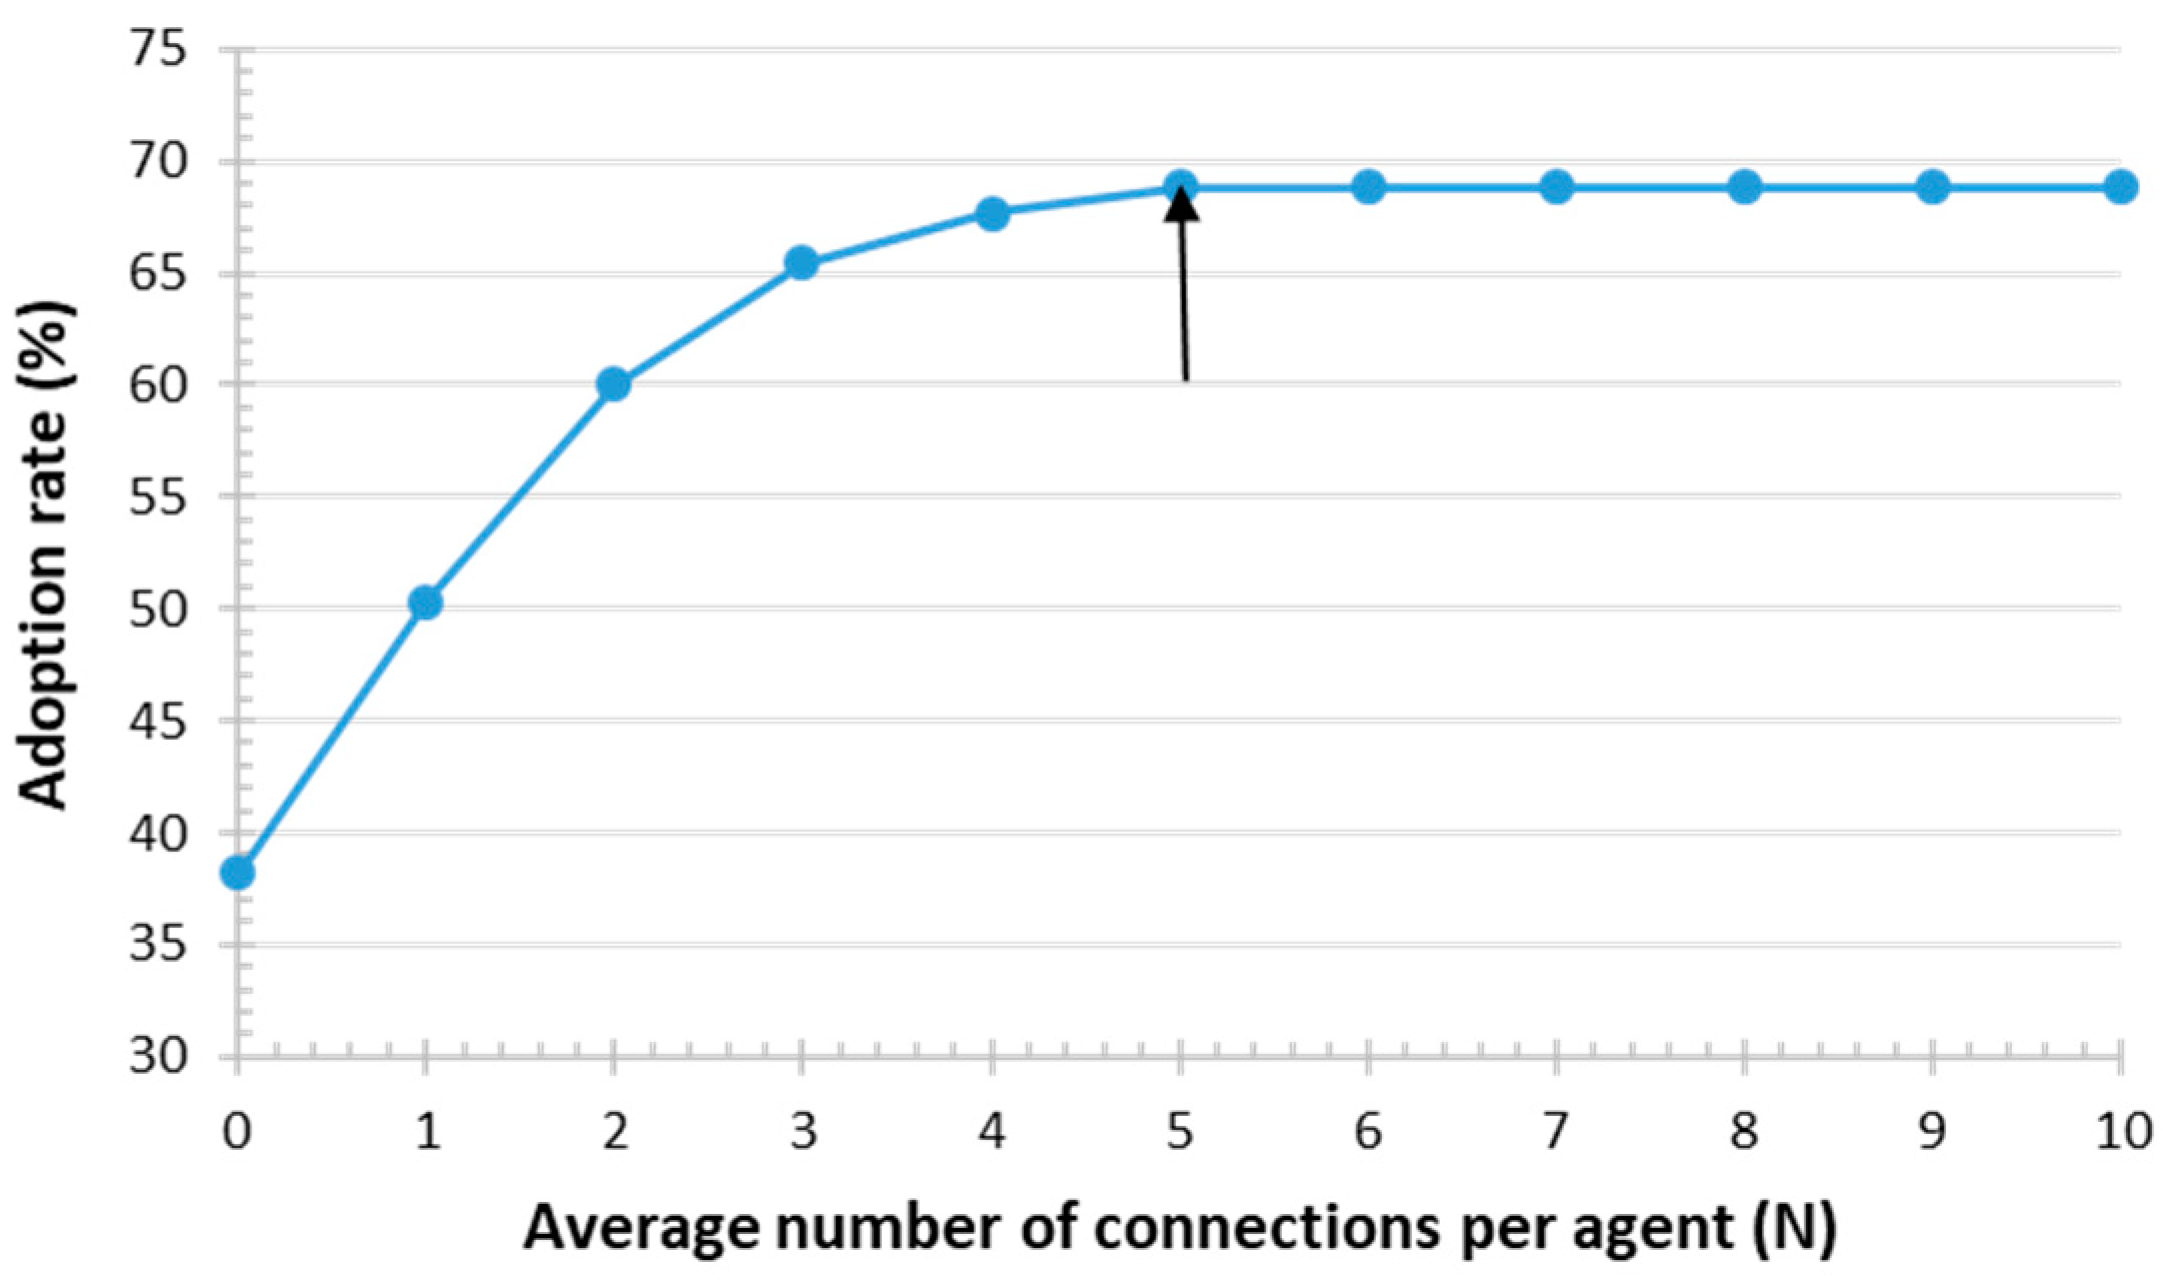
| Random | Assigns each agent a random number of connections within the given average. | Average number of connections per agent (N) | N = 0–10 |
| Distance-based | If the distance between two agents is less than the given maximum connection range (the maximum distance in meters between agents for there to be a connection), then both agents are connected. | Maximum connection ranges (R) | R = 0–500 |
| Ring lattice | Agents are connected according to their closeness to each other while also forming a ring. | Average number of connections per agent (N) | N = 0–10 |
| Small-world | Connections between agents are similar to the ring lattice, while also including some long-distance relationships. The neighbor link probability is the chance that two agents connected to the same neighbor may also connect to each other. | Average number of connections per agent (N); and Neighbor link probability (P) | N = 0–10 P = 0–1 |
| Scale-free | Some agents have multiple connections (considered as hubs), while others have very few connections. | Number of hubs (M) | M = 1–10 |

| Parameter | Use | Method | Input Unit Changes |
|---|---|---|---|
| Household | Agent | Estimation of consumption; Influence diffusion | No change; 280 agents were used throughout the experimentation process |
| Water price strategy | Input parameter | Fixed price; fixed charge; block tariffs | Nominal |
| Rebate status | Input parameter | Rebate; no rebate | Nominal |
| Social network structure | Input parameter | Random, distance-based, ring lattice, small world, scale-free | Nominal |
| Likelihood of adoption due to social network | Input parameter | Function of randomTrue (p), given the likelihood p; True/False result | 1, 5, 10, 15, …, 100% |
| Income growth | Input parameter | Change in annual income | −5, −4, …, 0, 1, …, 5% |
| Household size growth | Input parameter | Change in household size | −5, −4, …, 0, 1, …, 5% |
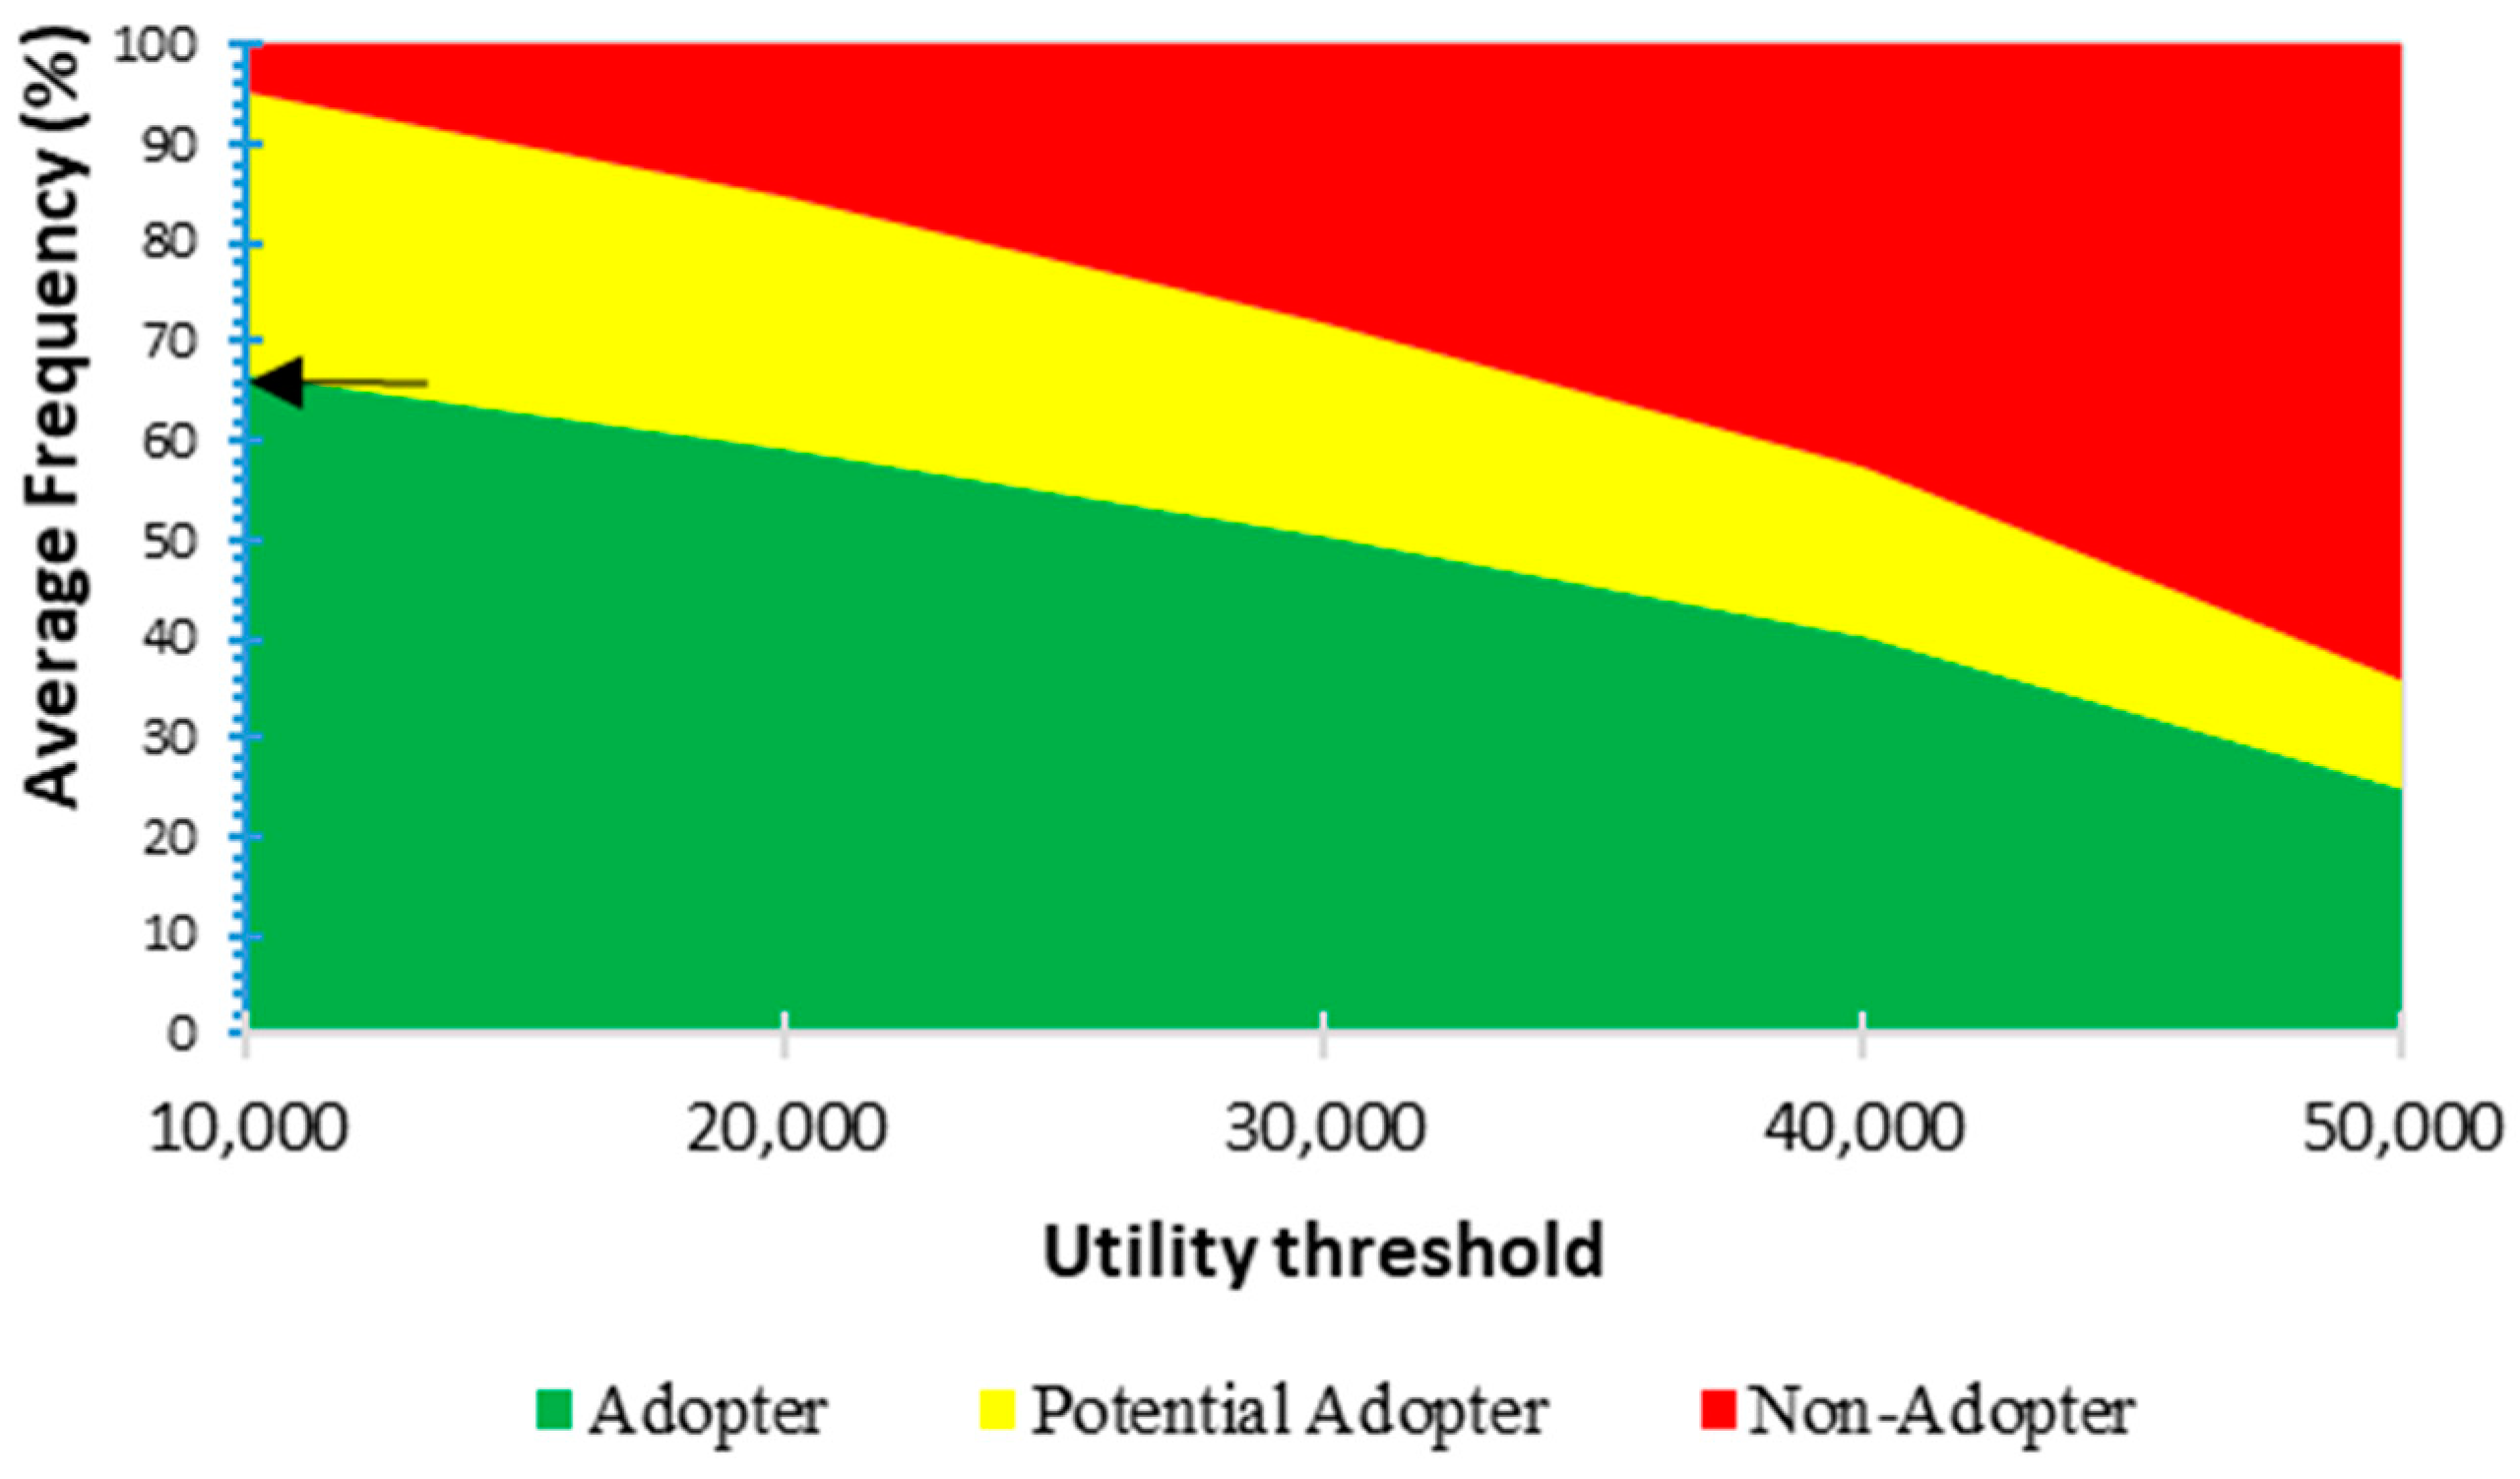
| Utility threshold | Input parameter | Accumulation of attributes influencing the potential for technology adoption (Utility > Threshold) | 10,000; 20,000; 30,000; 40,000; 50,000 |
| Affordability threshold | Input parameter | Household ability to pay water expenditures (annual water bill + technology cost) | 1, 1.5, 2, 2.5, 3% |
| Percent adopter | Output parameter | Percentage of agents that adopted at least one water conservation technology | (Changes in the outputs are a reflection of changes in the input parameters) |
| Demand reduction | Output parameter | per household | |
| Kitchen faucet | Output parameter | Number of kitchen faucets adopted | |
| Bathroom faucet | Output parameter | Number of bathroom faucets adopted | |
| Shower head | Output parameter | Number of shower heads adopted | |
| Toilet | Output parameter | Number of toilets adopted | |
| Washing machine (clothes) | Output parameter | Number of washing machines adopted | |
| Dishwasher | Output parameter | Number of dishwashers adopted |
References
- UN Water. Managing Water under Uncertainty and Risk, The United Nations World Water Development Report 4, UN Water Reports, World Water Assessment Programme; UN Water: Geneva, Switzerland, 2012. [Google Scholar]
- Postel, S.L. Entering an Era of Water Scarcity: The Challenges Ahead. Ecol. Appl. 2000, 10, 941–948. [Google Scholar] [CrossRef]
- Butler, D.; Memon, F.A. Water Demand Management; International Water Association IWA Publishing: London, UK, 2006. [Google Scholar]
- Kanta, L.; Zechman, E. Complex Adaptive Systems Framework to Assess Supply-Side and Demand-Side Management for Urban Water Resources. J. Water Resour. Plan. Manag. 2014, 140, 75–85. [Google Scholar] [CrossRef]
- Chen, Y.; Zhang, D.; Sun, Y.; Liu, X.; Wang, N.; Savenije, H.H.G. Water demand management: A case study of the Heihe River Basin in China. Phys. Chem. Earth 2005, 30, 408–419. [Google Scholar] [CrossRef]
- Inman, D.; Jeffrey, P. A review of residential water conservation tool performance and influences on implementation effectiveness. Urban Water J. 2006, 3, 127–143. [Google Scholar] [CrossRef] [Green Version]
- Renwick, M.E.; Green, R.D. Do Residential Water Demand Side Management Policies Measure Up? An Analysis of Eight California Water Agencies’. J. Environ. Econ. Manag. 2000, 40, 37–55. [Google Scholar] [CrossRef]
- White, S.B.; Fane, S.A. Designing cost effective water demand management programs in Australia. Water Sci. Technol. 2002, 46, 225–232. [Google Scholar] [CrossRef] [PubMed]
- Gilg, A.; Barr, S. Behavioural attitudes towards water saving? Evidence from a study of environmental actions. Ecol. Econ. 2006, 57, 400–414. [Google Scholar] [CrossRef]
- De Young, R. Changing Behavior and Making it Stick: The Conceptualization and Management of Conservation Behavior. Environ. Behav. 1993, 25, 485–505. [Google Scholar] [CrossRef]
- Jorgensen, B.; Graymore, M.; O’Toole, K. Household use behaviour: An integrated model. J. Environ. Manag. 2009, 91, 227–236. [Google Scholar] [CrossRef] [PubMed]
- Gleick, P.H.; Haasz, D.; Henges-Jeck, C.; Srinivasan, V.; Wolff, G.; Kao Cushing, K.; Mann, A. Waste Not, Want Not: The Potential for Urban Water Conservation in California; Pacific Institute: Oakland, CA, USA, 2003. [Google Scholar]
- Lee, M.; Tansel, B. Water conservation quantities vs customer opinion and satisfaction with water efficient appliances in Miami, Florida. J. Environ. Manag. 2013, 128, 683–689. [Google Scholar] [CrossRef] [PubMed]
- Baumann, D.D. Social acceptance of water reuse. Appl. Geogr. 1983, 3, 79–84. [Google Scholar] [CrossRef]
- Dolnicar, S.; Hurlimann, A.; Grün, B. Water conservation behavior in Australia. J. Environ. Manag. 2012, 105, 44–52. [Google Scholar] [CrossRef] [PubMed]
- Po, M.; Kaercher, J.D.; Nancarrow, B.E. Literature Review of Factors Influencing Public Perceptions of Water Reuse; CSIRO Land and Water Technical Report; CSIRO Land and Water: Acton, Australia, 2003. [Google Scholar]
- Bandiera, O.; Rasul, I. Social networks and technology adoption in Northern Mozambique. Econ. J. 2006, 116, 869–902. [Google Scholar] [CrossRef]
- Lee, Y.-H.; Hsieh, Y.-C.; Hsu, C.-N. Adding Innovation Diffusion Theory to the Technology Acceptance Model: Supporting Employees’ Intentions to use E-Learning Systems. Educ. Technol. Soc. 2011, 14, 124–137. [Google Scholar]
- Boyer, T.A.; Kanza, P.; Ghimire, M.; Moss, J.Q. Household Adoption of Water Conservation and Resilience Under Drought: The Case of Oklahoma City. Water Econ Policy 2015, 1, 1–28. [Google Scholar] [CrossRef]
- Friedkin, N.E. Norm formation in social influence networks. Soc. Netw. 2001, 23, 167–189. [Google Scholar] [CrossRef]
- Chu, J.; Wang, C.; Chen, J.; Wang, H. Agent-based residential water use behavior simulation and policy implications: A case-study in Beijing city. Water Resour. Manag. 2009, 23, 3267–3295. [Google Scholar] [CrossRef]
- DeOreo, W.B.; Mayer, P.W.; Martien, L.; Hayden, M.; Funk, A.; Kramer, M.; Davis, R.; Henderson, J.; Raucher, B.; Gleick, P.; et al. California Single Family Water Use Efficiency Study. Aquacraft, Inc.; Water Engineering and Management. Available online: http://www.energy.ca.gov/appliances/2013rulemaking/documents/responses/Water_Appliances_12-AAER-2C/California_IOU_Response_to_CEC_Invitation_to_Participate-Water_Meters_REFERENCE/DeOreo_2011_California_Single-Family_Water_Use_Efficiency_Study.pdf (accessed on 27 July 2018).
- Cahill, R.; Lund, J.R.; Deoreo, B.; Medellín-Azuara, J. Household water use and conservation models using Monte Carlo techniques. Hydrol. Earth Syst. Sci. 2013, 17, 3957–3967. [Google Scholar] [CrossRef] [Green Version]
- Athanasiadis, I.; Mylopoulos, Y.; Mentes, A.; Mitkas, P. A Hybrid Agent-Based Model for Estimating Residential Water Demand. Simulation 2005, 81, 175–187. [Google Scholar] [CrossRef] [Green Version]
- Koutiva, I.; Makropoulos, C. Modelling domestic water demand: An agent based approach. Environ. Model. Softw. 2016, 79, 35–54. [Google Scholar] [CrossRef]
- Young, R.A. Price Elasticity of Demand for Municipal Water: A Case Study of Tucson, Arizona. Water Resour. Res. 1973, 9, 1068–1072. [Google Scholar] [CrossRef]
- Lutzenhiser, L. Social and Behavioral Aspects of Energy Use. Ann. Rev. Energy Environ. 1993, 18, 247–289. [Google Scholar] [CrossRef]
- Olmstead, S.M.; Stavins, R.N. Comparing price and nonprice approaches to urban water conservation. Water Resour. Res. 2009, 45. [Google Scholar] [CrossRef] [Green Version]
- Willis, R.M.; Stewart, R.A.; Giurco, D.P.; Talebpour, M.R.; Mousavinejad, A. End use water consumption in households: Impact of socio-demographic factors and efficient devices. J. Clean. Prod. 2013, 60, 107–115. [Google Scholar] [CrossRef]
- Lynne, G.D.; Franklin Casey, C.; Hodges, A.; Rahmani, M. Conservation technology adoption decisions and the theory of planned behavior. J. Econ. Psychol. 1995, 16, 581–598. [Google Scholar] [CrossRef]
- Stern, P.C.; Aronson, E.; Darley, J.M.; Hill, D.H.; Hirst, E.; Kempton, W.; Wilbanks, T.J. The Effectiveness of Incentives for Residential Energy Conservation. Eval. Rev. 1986, 10, 147–176. [Google Scholar] [CrossRef]
- Corral-Verdugo, V.; Bechtel, R.B.; Fraijo-Sing, B. Environmental beliefs and water conservation: An empirical study. J. Environ. Psychol. 2003, 23, 247–257. [Google Scholar] [CrossRef]
- Domenech, L.; Sauri, D. Socio-technical transitions in water scarcity contexts: Public acceptance of greywater reuse technologies in the Metropolitan Area of Barcelona. Resour. Conserv. Recycl. 2010, 55, 53–62. [Google Scholar] [CrossRef]
- Millock, K.; Nauges, C. Household adoption of water-efficient equipment: The role of socio-economic factors, environmental attitudes and policy. Environ. Resour. Econ. 2010, 46, 539–565. [Google Scholar] [CrossRef]
- Perret, S.R.; Stevens, J.B. Socio-economic reasons for the low adoption of water conservation technologies by smallholder farmers in southern Africa: A review of the literature. Dev. South. Afr. 2006, 23, 461–476. [Google Scholar] [CrossRef]
- Mansur, E.T.; Olmstead, S.M. The value of scarce water: Measuring the inefficiency of municipal regulations. J. Urban Econ. 2012, 71, 332–346. [Google Scholar] [CrossRef]
- Spulber, N.; Sabbaghi, A. Economics of Water Resources: From Regulation to Privatization; Spulber, N., Sabbaghi, A., Eds.; Springer Science and Business Media: Berlin, Germany, 2012. [Google Scholar]
- Tran, M. Commun Nonlinear Sci Numer Simulat Agent-behaviour and network influence on energy innovation diffusion. Commun. Nonlinear Sci. Numer. Simul. 2013, 17, 3682–3695. [Google Scholar] [CrossRef]
- Ramirez, A. The Influence of Social Networks on Agricultural Technology Adoption. Procedia Soc. Behav. Sci. 2013, 79, 101–116. [Google Scholar] [CrossRef]
- Anderson, K.; Asce, S.M.; Lee, S.; Asce, A.M.; Menassa, C. Impact of Social Network Type and Structure on Modeling Normative Energy Use Behavior Interventions. J. Comput. Civ. Eng. 2004, 28, 30–39. [Google Scholar] [CrossRef]
- Rai, V.; Robinson, S.A. Agent-based modeling of energy technology adoption: Empirical integration of social, behavioral, economic, and environmental factors. Environ. Model. Softw. 2015, 70, 163–177. [Google Scholar] [CrossRef] [Green Version]
- Mostafavi, A.; Ganapati, N.E.; Nazarnia, H.; Pradhananga, N.; Khanal, R. Adaptive capacity under chronic stressors: Assessment of water infrastructure resilience in 2015 Nepalese Earthquake using a system approach. Nat. Hazards Rev. 2018, 19, 05017006. [Google Scholar] [CrossRef]
- Davis, J.; Eisenhardt, K.M.; Bingham, C.B. Developing Theory through Simulation Methods. Acad. Manag. Rev. 2007, 32, 480–499. [Google Scholar] [CrossRef]
- Bonabeau, E. Agent-based modeling: Methods and techniques for simulating human systems. Proc. Natl. Acad. Sci. USA 2002, 99 (Suppl. 3), 7280–7287. [Google Scholar] [CrossRef] [PubMed] [Green Version]
- Gilbert, N. Agent-Based Models. No. 153; Sage: Newcastle upon Tyne, UK, 2008. [Google Scholar]
- Fang, J.; El-Tawil, S.; Aguirre, B. New Agent-Based Egress Model Allowing for Social Relationships. J. Comput. Civ. Eng. 2016, 30, 04015066. [Google Scholar] [CrossRef]
- Mostafavi, A.; Abraham, D.; DeLaurentis, D. Ex-Ante Policy Analysis in Civil Infrastructure Systems. J. Comput. Civ. Eng. 2014, 28, A4014006. [Google Scholar] [CrossRef]
- Mostafavi, A.; Kandil, A.; Sinfield, J.; Queiroz, C.; Abraham, D.; DeLaurentis, D. Agent-Based Simulation Model for Assessment of Financing Scenarios in Highway Transportation Infrastructure Systems. J. Comput. Civ. Eng. 2015, 30, 4015012. [Google Scholar] [CrossRef]
- Rasoulkhani, K.; Reyes, M.P.; Mostafavi, A. Emergence of Resilience from Infrastructure Dynamics: A Simulation Framework for Theory Building. Comput. Civ. Eng. 2017, 256–264. [Google Scholar]
- Galán, J.M.; López-Paredes, A.; del Olmo, R. An agent-based model for domestic water management in Valladolid metropolitan area. Water Resour. Res. 2009, 45. [Google Scholar] [CrossRef] [Green Version]
- Laciana, C.E.; Rovere, S.L. Ising-like agent-based technology diffusion model: Adoption patterns vs. seeding strategies. Physics A 2011, 390, 1139–1149. [Google Scholar] [CrossRef] [Green Version]
- Schwarz, N.; Ernst, A. Agent-based modeling of the diffusion of environmental innovations—An empirical approach. Technol. Forecast. Soc. Chang. 2009, 76, 497–511. [Google Scholar] [CrossRef]
- Bankes, S. Exploratory Modeling for Policy Analysis. Oper. Res. 1993, 41, 435–449. [Google Scholar] [CrossRef] [Green Version]
- Kwakkel, J.H.; Pruyt, E. Technological Forecasting & Social Change Exploratory Modeling and Analysis, an approach for model-based foresight under deep uncertainty. Technol. Forecast. Soc. Chang. 2013, 80, 419–431. [Google Scholar]
- Bankes, S.C. Tools and techniques for developing policies for complex and uncertain systems. Proc. Natl. Acad. Sci. USA 2002, 99 (Suppl. 3), 7263–7266. [Google Scholar] [CrossRef] [PubMed] [Green Version]
- Lambert, E.G.; Hogan, N.L.; Barton, S.M. The nature of work-family conflict among correctional staff: An exploratory examination. Crim. Just. Rev. 2004, 29, 145–172. [Google Scholar] [CrossRef]
- Mohor, G.S.; Rodriguez, D.A.; Tomasella, J.; Siqueira Júnior, J.L. Exploratory analyses for the assessment of climate change impacts on the energy production in an Amazon run-of-river hydropower plant. Int. J. Disaster Risk Reduc. 2015, 4, 41–59. [Google Scholar] [CrossRef]
- Azar, E.; Menassa, C.C. Agent-Based Modeling of Occupants and Their Impact on Energy Use in Commercial Buildings. J. Comput. Civ. Eng. 2012, 26, 506–518. [Google Scholar] [CrossRef] [Green Version]
- Raftelis, G.A. Water and Wastewater Finance and Pricing: A Comprehensive Guide; Raftelis, G., Ed.; CRC Press: Boca Raton, FL, USA, 2005. [Google Scholar]
- Pacific Institute. Water Rates: Water Affordability. 2012. Available online: http://www.financingsustainablewater.org/sites/www.financingsustainablewater.org/files/resource_pdfs/Pac-Inst%282012%29Rate-Factsheet-Affordability.pdf (accessed on 1 January 2018).
- MDWSD. Miami-Dade Water and Sewer Department Schedule of Rates. 2017. Available online: http://www.miamidade.gov/water/library/fees/rate-schedule-2017-18.pdf (accessed on 1 January 2018).
- Miami-Dade County. High Efficiency Fixture Rebate Program. 2016. Available online: http://www.miamidade.gov/waterconservation/high-efficiency-fixture-rebates.asp (accessed on 1 January 2018).
- Azar, E.; Al Ansari, H. Multilayer Agent-Based Modeling and Social Network Framework to Evaluate Energy Feedback Methods for Groups of Buildings. J. Comput. Civ. Eng. 2017, 31, 04017007. [Google Scholar] [CrossRef]
- Rasoulkhani, K.; Logasa, B.; Reyes, M.P.; Mostafavi, A. Agent-based Modeling Framework for Simulation of Complex Adaptive Mechanisms Underlying Household Water Conservation Technology Adoption. In Proceedings of the 2017 Winter Simulation Conference, Las Vegas, NV, USA, 3–6 December 2017; pp. 1109–1120. [Google Scholar]
- Berglund, E.Z. Using Agent-Based Modeling for Water Resources Planning and Management. J. Water Resour. Plan. Manag. 2015, 141, 04015025. [Google Scholar] [CrossRef]
- Azar, E.; Menassa, C.C. Framework to Evaluate Energy-Saving Potential from Occupancy Interventions in Typical Commercial Buildings in the United States. J. Comput. Civ. Eng. 2014, 28, 63–78. [Google Scholar] [CrossRef]
- Matsumoto, K. Evaluation of an artificial market approach for GHG emissions trading analysis. Simul. Model. Pract. Theory 2008, 16, 1312–1322. [Google Scholar] [CrossRef]
- Lee, M.; Tansel, B.; Balbin, M. Influence of residential water use efficiency measures on household water demand: A four year longitudinal study. Resour. Conserv. Recycl. 2011, 56, 1–6. [Google Scholar] [CrossRef]
- Espey, M.; Espey, J.; Shaw, W.D. Price elasticity of residential demand for water: A meta-analysis. Water Resour. Res. 1997, 33, 1369–1374. [Google Scholar] [CrossRef] [Green Version]
- Weinreich, N.K. What Is Social Marketing? 2006. Available online: http://www.social-marketing.com/Whatis.html (accessed on 26 July 2017).
- Breiman, L.; Friedman, J.H.; Olshen, R.; Stone, C.J. Classification and Regression Trees; Wadsworth: Belmont, CA, USA, 1984. [Google Scholar]
- Lawrence, R.L.; Wrlght, A. Rule-Based Classification Systems Using Classification and Regression Tree (CART) Analysis. Photogramm. Eng. Remote Sens. 2001, 67, 1137–1142. [Google Scholar]
- De’ath, G.; Fabricius, K.E. Classification and Regression Trees: A Powerful yet Simple Technique for Ecological Data Analysis. Ecology 2000, 81, 3178–3192. [Google Scholar] [CrossRef]
- Van Oel, P.R.; Krol, M.S.; Hoekstra, A.Y.; Taddei, R.R. Feedback mechanisms between water availability and water use in a semi-arid river basin: A spatially explicit multi-agent simulation approach. Environ. Model. Softw. 2010, 25, 433–443. [Google Scholar] [CrossRef]


| Aspect of Technology Adoption | Findings of the Model | Examples of Other Studies with Similar Findings |
|---|---|---|
| Impact of conservation technology adoption on water demand reduction of the service area | Adoption of water conservation technology under various scenarios potentially could lead to a 3–10% reduction in the overall demand of the City of Miami Beach. | About a 6–14% reduction in water demand has been observed during the implementation of the water conservation incentives program for the residential consumers in Miami-Dade [68] |
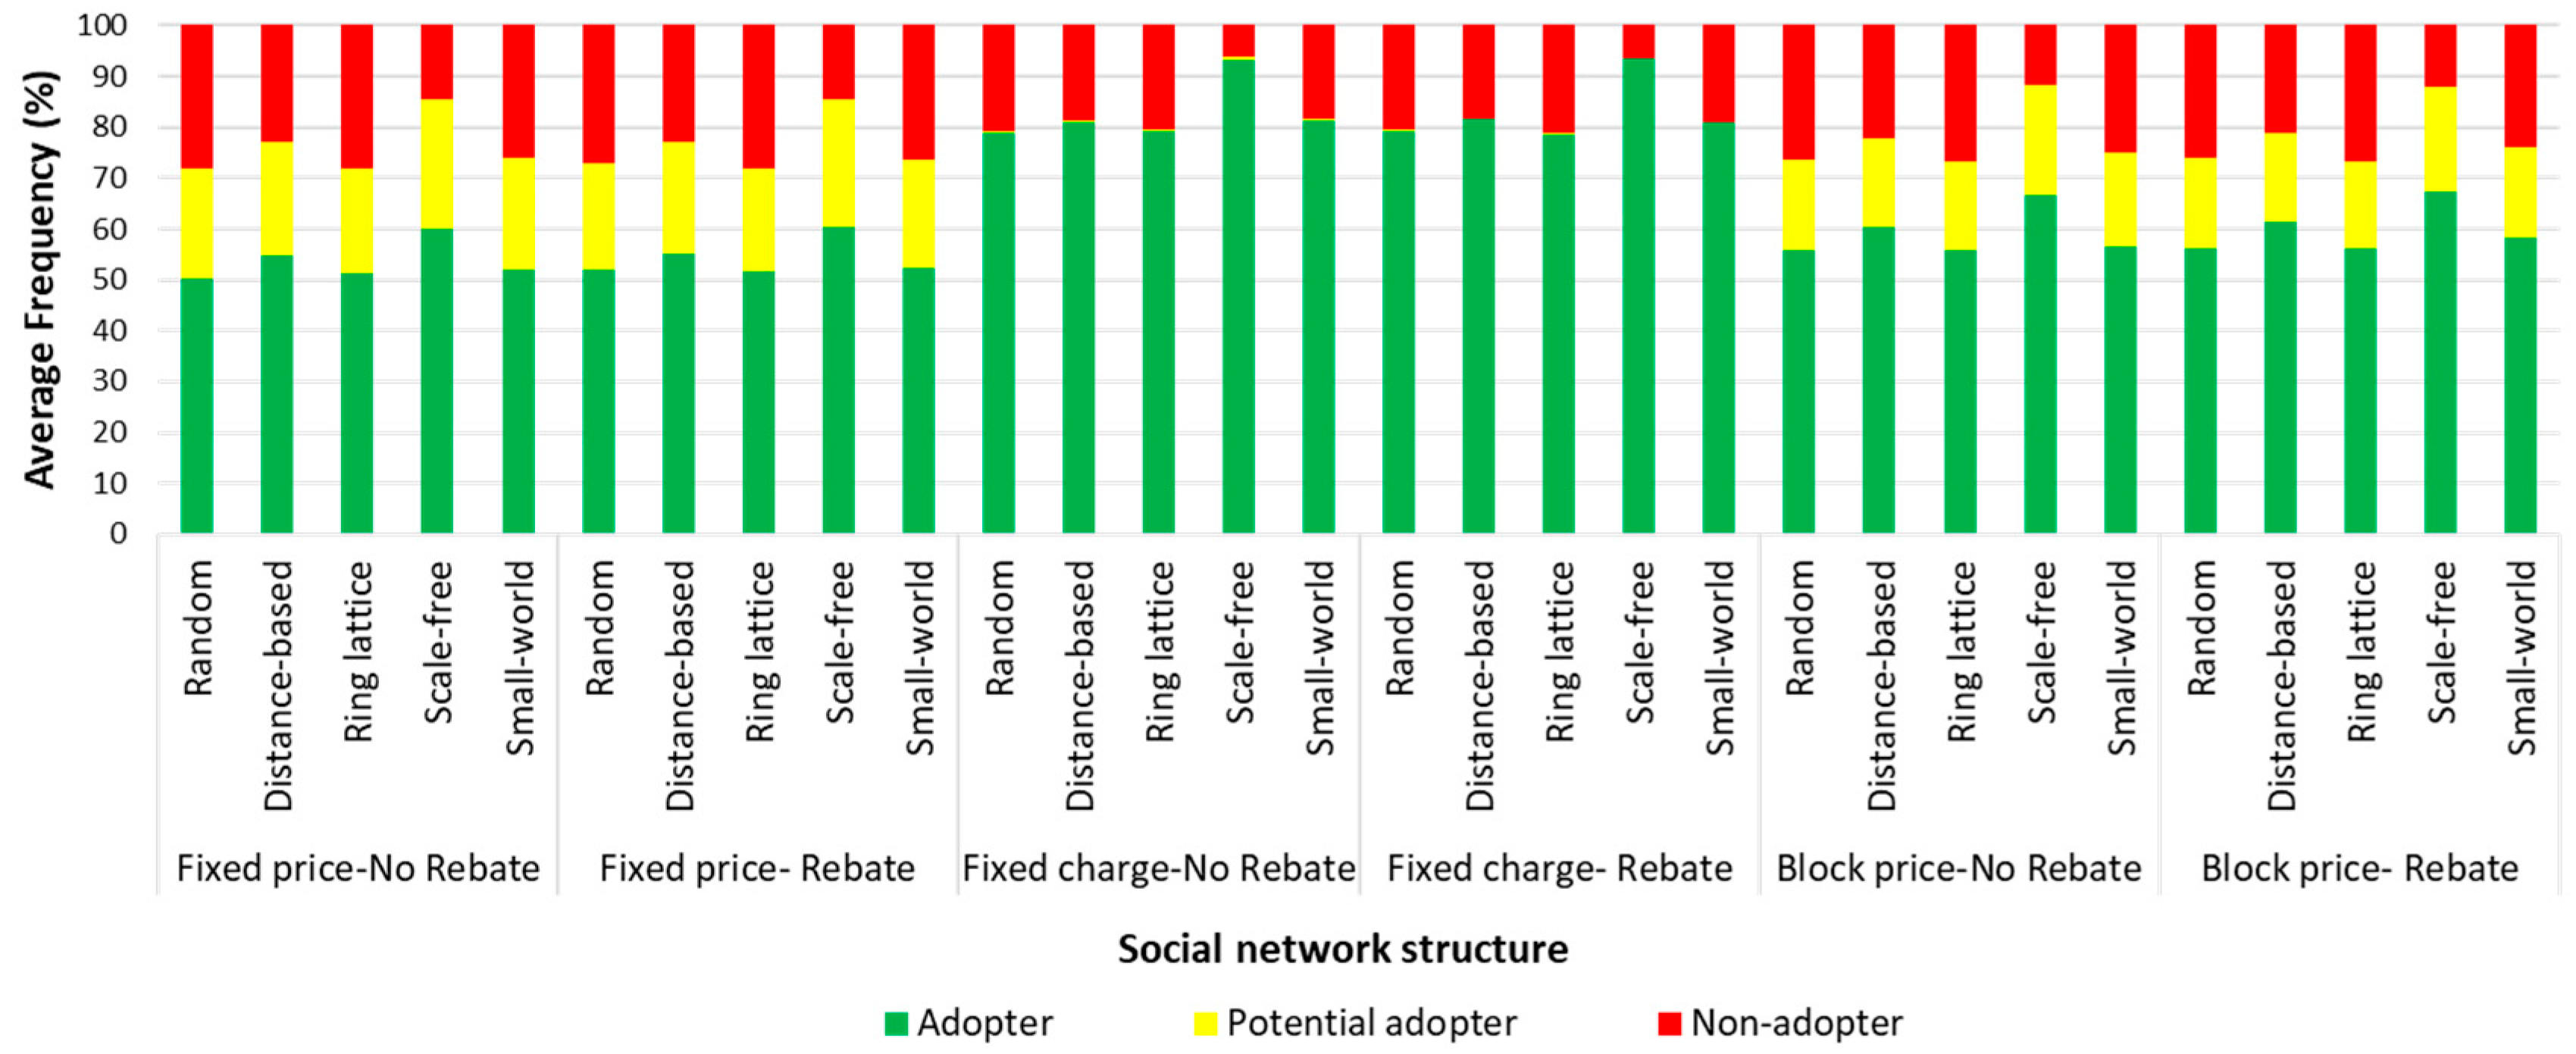
| Effect of water price strategy | Fixed charge strategy of water pricing, which provides cheaper water for households, led to a greater number of adoptions in the model. | “Pricing structure plays a significant role in influencing price responsiveness” [69]. The higher the price of water, the less technology one would adopt; conversely, the lower the price of water, the more technology one would install [28]. |
| Effect of rebate and incentives | Rebate allocation in low-income communities could increase the adoption of the expensive water conservation technologies. | Providing incentives such as rebates for retrofitting households with water-efficient technologies have shown mixed results in terms of reducing water use, especially when compared to price-based approaches [13] |
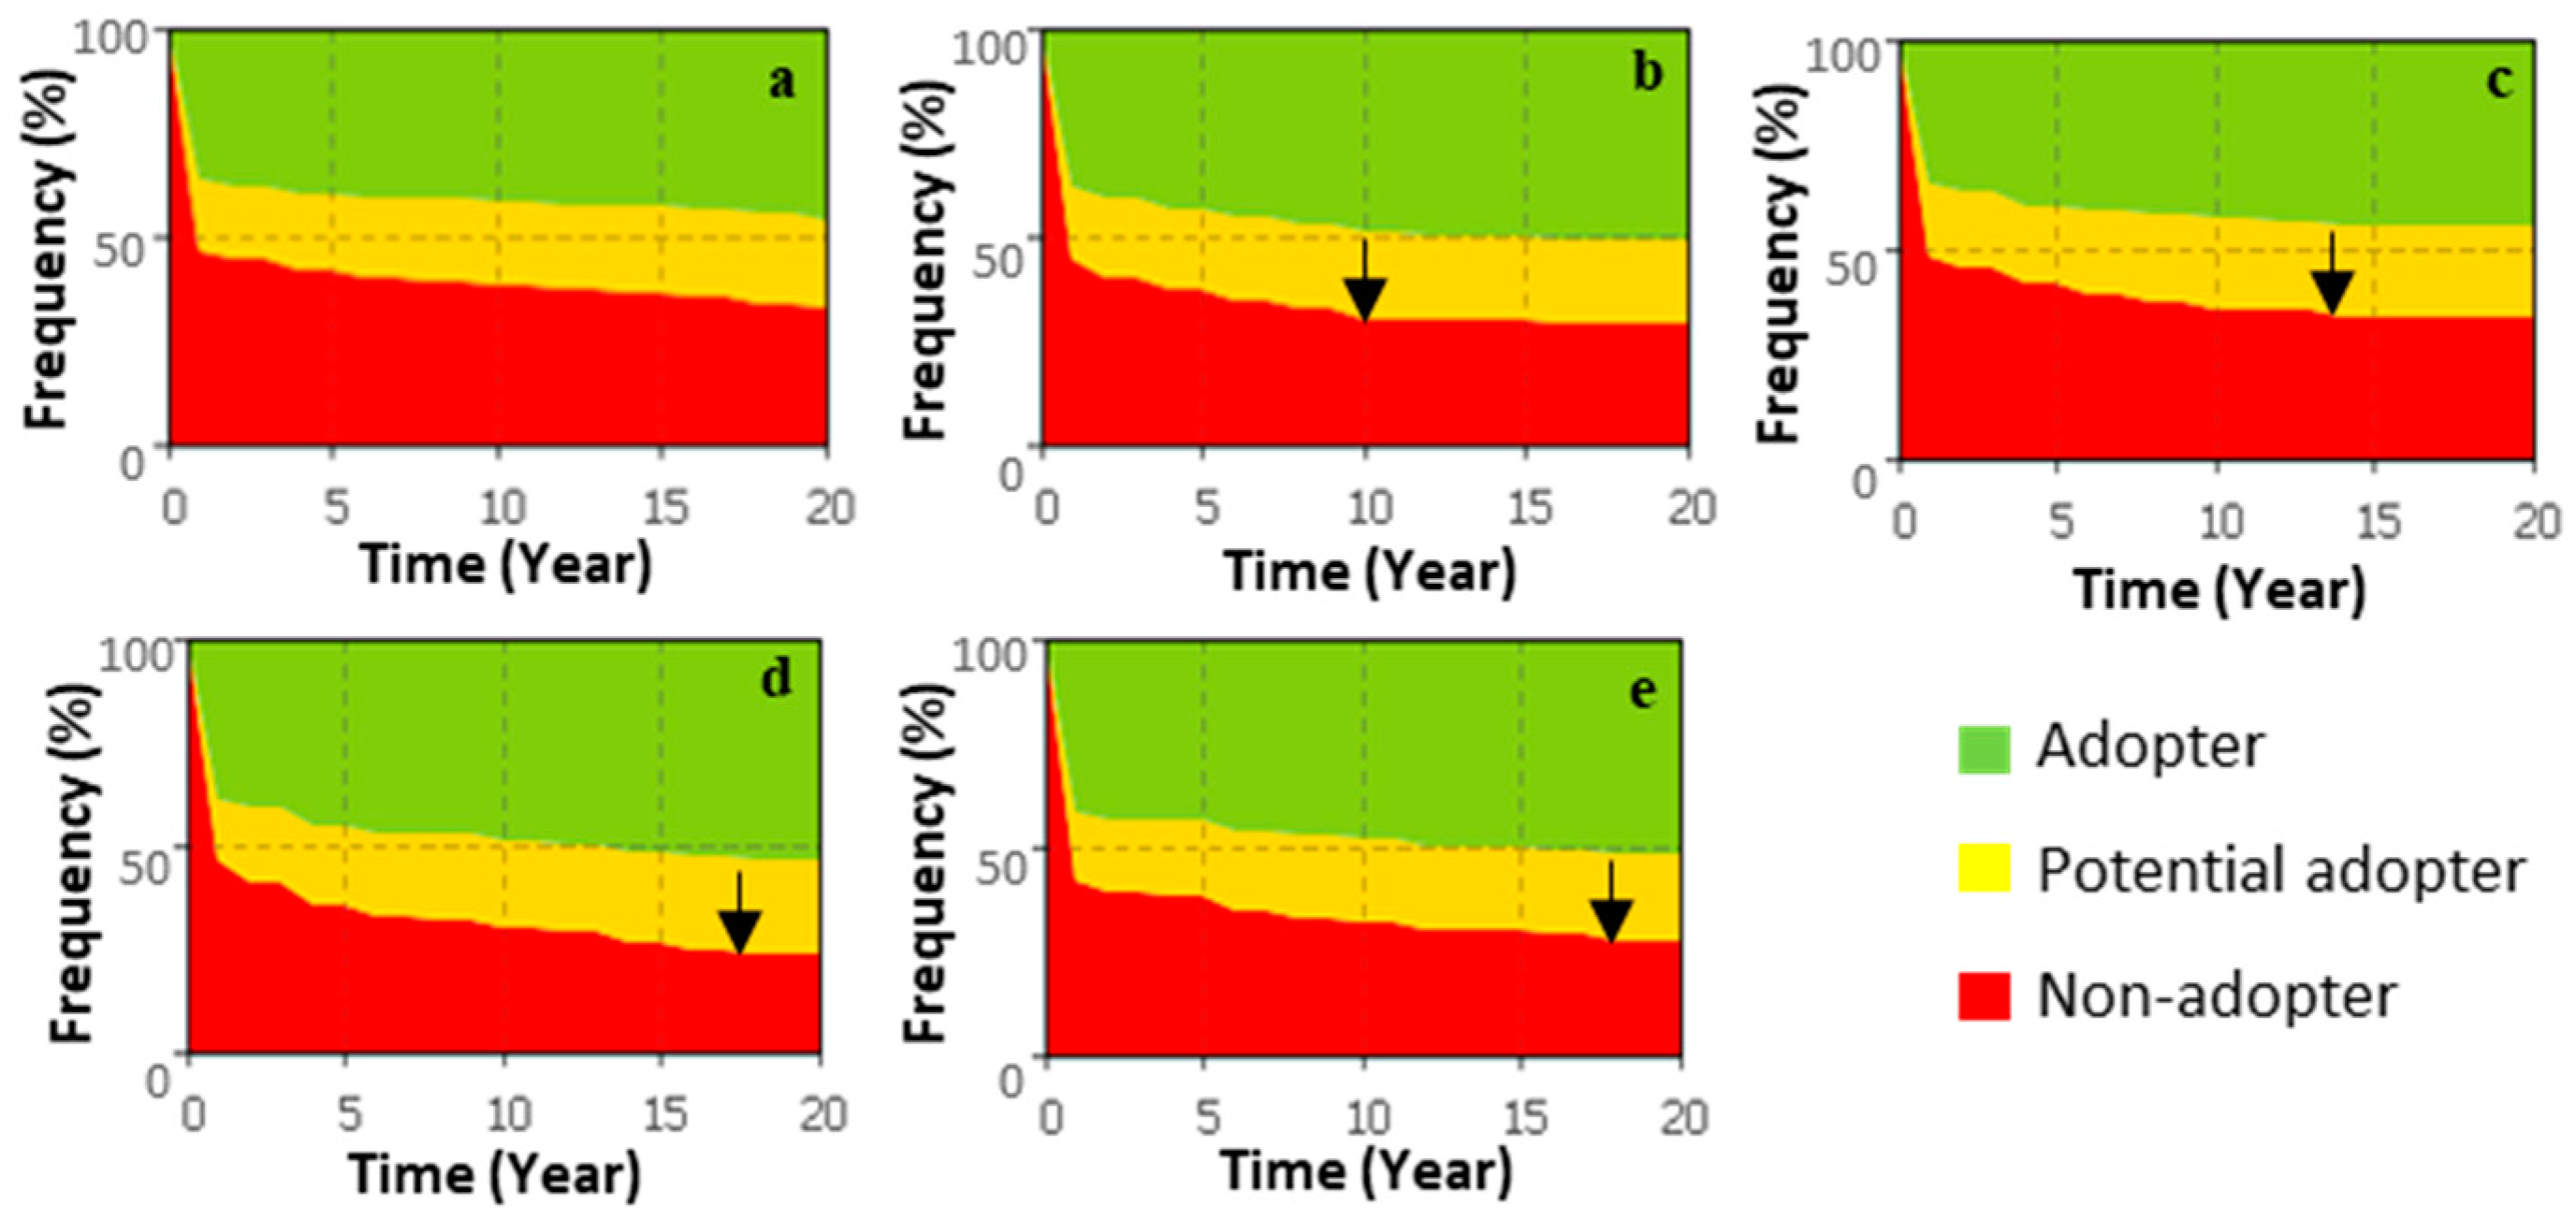
| Effect of social networks | Social interactions speeded up the diffusion of water conservation technology. Although the structure of a network was not important in the adoption of technology, it affected the time required for the adoption rate to reach an equilibrium. | “Social network type is not significant in determining mean energy use change, but is when considering the time required the network to reach equilibrium” [40]. |
| Effect of household income level | Income growth mostly influences a household’s willingness to adopt water conservation technology. | “We have previously found financial variables to be important supplements to attitude measures in technology adoption modeling” [30]. |
| Model Input Parameter | Possible Values | Value in Base Scenario |
|---|---|---|
| Water pricing structure | Fixed price; fixed charge; block prices | Fixed price |
| Rebate status | Rebate; no rebate | No rebate |
| Income growth (%) | −5; −4; −3; −2; −1; 0; 1; 2; 3; 4; 5 | 0 |
| Household size growth (%) | −5; −4; −3; −2; −1; 0; 1; 2; 3; 4; 5 | 0 |
| Utility threshold | 10,000; 20,000; 30,000; 40,000; 50,000 | 30,000 |
| Affordability threshold (%) | 1, 1.5, 2, 2.5, 3 | 1.5 |
| Social network structure | Random (N = 1); distance-based (R = 100); ring lattice (N = 1); scale-free (M = 1); small-world (N = 1, P = 0.1) | Random (N = 1) |
© 2018 by the authors. Licensee MDPI, Basel, Switzerland. This article is an open access article distributed under the terms and conditions of the Creative Commons Attribution (CC BY) license (http://creativecommons.org/licenses/by/4.0/).
Share and Cite
Rasoulkhani, K.; Logasa, B.; Presa Reyes, M.; Mostafavi, A. Understanding Fundamental Phenomena Affecting the Water Conservation Technology Adoption of Residential Consumers Using Agent-Based Modeling. Water 2018, 10, 993. https://doi.org/10.3390/w10080993
Rasoulkhani K, Logasa B, Presa Reyes M, Mostafavi A. Understanding Fundamental Phenomena Affecting the Water Conservation Technology Adoption of Residential Consumers Using Agent-Based Modeling. Water. 2018; 10(8):993. https://doi.org/10.3390/w10080993
Chicago/Turabian StyleRasoulkhani, Kambiz, Brianne Logasa, Maria Presa Reyes, and Ali Mostafavi. 2018. "Understanding Fundamental Phenomena Affecting the Water Conservation Technology Adoption of Residential Consumers Using Agent-Based Modeling" Water 10, no. 8: 993. https://doi.org/10.3390/w10080993