The Study of the Coastal Management Criteria Based on Risk Assessmeant: A Case Study on Yunlin Coast, Taiwan


1
Department of Harbor and River Engineering, National Taiwan Ocean University, Keelung 20224, Taiwan
2
Center of Excellence for Ocean Engineering, National Taiwan Ocean University, Keelung 20224, Taiwan
3
Water Resources Planning Institute, Water Resources Agency, Ministry of Economic Affairs, Taichung 41350, Taiwan
*
Author to whom correspondence should be addressed.
Water 2018, 10(8), 988; https://doi.org/10.3390/w10080988
Submission received: 18 June 2018
/
Revised: 19 July 2018
/
Accepted: 25 July 2018
/
Published: 26 July 2018
(This article belongs to the Special Issue Coastal Vulnerability and Mitigation Strategies: From Monitoring to Applied Research
)
Abstract
:In this study, we used the natural and anthropogenic characteristics of a coastal region to generate risk maps showing vulnerability and potential hazards, and proposed design criteria for coastal defense and land use for the various kinds of risks faced. The Yunlin coast, a first-level protection area in mid-west Taiwan, was then used as an example to illustrate the proposed design criteria. The safety of the present coastal defenses and land use of the Yunlin coastal area was assessed, and coastal protection measures for hazard prevention were proposed based on the generated risk map. The results can be informative for future coastal management and the promotion of sustainable development of coastal zones.
1. Introduction
Like most developing countries, Taiwan’s coast has been alternatively used for settlement, agriculture, trade, industry, and recreation without careful and thorough planning in the development stage since 70s. The continuous expansion and diversity of urbanization together with the accumulation of deleterious effects on the coastal zone has intensified natural disasters in certain areas and their consequences for coastal residence. The conflicts between coastal exploitation and restriction continued because the Coastal Zone Management Act had not yet become a statutory law. This made it difficult to draw up strategies for Integrated Coastal Zone Management (ICZM), as there was no legal ground for the planning of land use in coastal areas. The Act came into effect in February 2015. It regulates the classification of coastal areas as first- or second-level coastal protection areas; and specifies which authorities are responsible for drawing up the respective coastal protection plans. Huang et al. (2016) (see also Chien et al., 2016) showed the zoning principles of the coastal protection areas which were based on the severity level of coastal hazards, however, neglecting the vulnerability [1,2]. The possible risks that a coastal area faces are not clearly identified. Thus, the most important step in facilitating coastal management is to generate risk maps in order to develop robust adaptation strategies and measures for different levels of protection areas respectively.
The concept of hazard risk analysis proposed by the United Nations Disaster Relief Organization (UNDRO, 1980) [3] involves a comprehensive examination of the relationship between hazard and vulnerability (risk = hazard × vulnerability). The hazard potential factor refers to the variability of hazards. In general, an increase in hazard intensity and frequency causes more serious damage and loss. There are five kinds of hazards for coastal areas in Taiwan, namely, storm surge, coastal erosion, flooding, ground subsidence, and tsunami (Chien et al., 2012) [4]. While the first four hazards are most frequent, the last one is relatively rare. The Coastal Zone Management Act therefore listed the first four hazards as the ‘primary concerns’ of coastal risks.
Coastal vulnerability can be defined as a measure of the degree to which natural hazards can affect coastal residents (McCarthy et al., 2001; van der Veen and Logtmeije, 2005; Parkinson and McCue, 2011) [5,6,7]. Possible losses increase when vulnerability increases (Cutter, 1996) [8]. Different variables have been used to evaluate coastal vulnerability according to the research orientation and perspective, for example the effect of sea-level rise (Khouakhi et al., 2013; Özyurt and Ergin, 2010), coastal erosion (Fitton et al., 2016; Merlotto, et al., 2016; Tarragoni et al., 2014), and sustainable development (Schernewski et al., 2014) [9,10,11,12,13,14]. Generally speaking, the variables can be categorized into geophysical, social, and socio-environmental contexts (Zanetti et al., 2016) [15]. The geophysical vulnerability focused on the relationships between physical features and coastal hazards. Hammar-Klose and Thieler (2001) used the six physical variables proposed by Gornitz et al. (1994) and Shaw et al. (1998) to assess the vulnerability of coasts in the United States [16,17,18]. Social vulnerability identifies the characteristics of coastal communities that enable them to respond to and recover from hazards (Cutter et al., 2003) [19]. In socio-environmental vulnerability the combined effects of both social and environmental vulnerabilities were taken into consideration (Wang et al., 2014) [20]. The United Nations Office for Disaster Risk Reduction (UNISDR, 2004) assessed vulnerability by grading physical, environmental, social and economic variables [21]. As social and economic conditions were taken into consideration, the potential threats of coastal hazards to natural surroundings and coastal residents can be clearly evaluated.
The combinations of the potential hazards and coastal vulnerability can be used to generate risk maps. Chien et al. (2013) used the risk maps to assess existing hazard prevention and coastal management measures in Taiwan [22]. Wang et al. (2014) conducted a comprehensive risk assessment strategy based on the risk matrix approach (RMA), which consisted of a probability phase and a severity phase [20]. Note that a relationship between the hazard map and the coastal protection criteria has not been clearly identified in any of these studies. Carrasco et al. (2012) and Ward et al., (2014) pointed out that flood hazard maps based on return periods could be useful in evaluating the physical damage to infrastructure, economy, and ecological resources of a region [23,24]. The risk maps with classified grades can be helpful in understanding the possible risks that a coastal area faces and determining the criteria for coastal protection.
Traditionally, coastal hazard management has concentrated on providing protection against floods through coastal defenses. However, severer marine conditions including sea level rise and the increasing intensity of storms due to climate change appear to be unavoidable and will inevitably threaten the residents of coastal areas (Van Vuren et al., 2004) [25]. To strengthen coastal defenses unlimitedly against climate change effects may lead to significant ecological losses and high cost (Penning-Rowsell et al., 2014) [26]. Nowadays, the coastal hazard management has moved away from engineering-dominated approaches to formulate adaptation strategies (Dinh et al., 2012; ESCAP/UNISDR, 2012; Luo et al., 2015; Salik et al., 2015) [27,28,29,30]. Non-engineering measures can be incorporated, for those hazards beyond the design criteria of coastal defenses. The non-engineering measures should be encouraged since, now the “Coast Zone Management Act” has come into effect, the government will have a legal basis to take action. Regulations to limit or even ban further exploitation of hazard-prone coastal areas can thus now be enacted and climate change adaptation strategies enforced.
Coastal risk maps are important for both decision-makers and engineers. They contain essential information for the former to make policies, for the latter to assess the design criteria of the coastal defenses, and are also required to implement the Coastal Zone Management Act. In this study, the coastal risk map was drawn to assess the current coastal areas whether coastal areas should be managed by mitigation and/or adaptation. We believe that this could be helpful in achieving integrated coastal management in Taiwan.
2. Background
2.1. Coastal Protection Areas in Taiwan
To promote the sustainable development of coastal areas, coastal zone planning under the Act consists of designating conservation and protection areas with the aim of establishing a spatial development strategy. Conservation areas afford legal protection to natural resources, whereas protection areas are aimed at preventing coastal hazards and protecting the lives and assets of residents. Coastal areas, consisting of shore land areas and offshore areas, were demarcated and declared by the Construction and Planning Agency of the Ministry of the Interior (CPAMI). Shore areas were defined as extending from the mean high tide line to the nearest provincial highway, major coastal road, or ridgeline. Relevant assessments were restricted to the areas defined in this manner, that is, conservation or protection areas cannot be demarcated beyond these coastal areas. The two areas were demarcated and announced in the “Integrated Coastal Zone Management Plan” (CPAMI, 2017) [31]. This study focuses on the management of coastal protection areas.
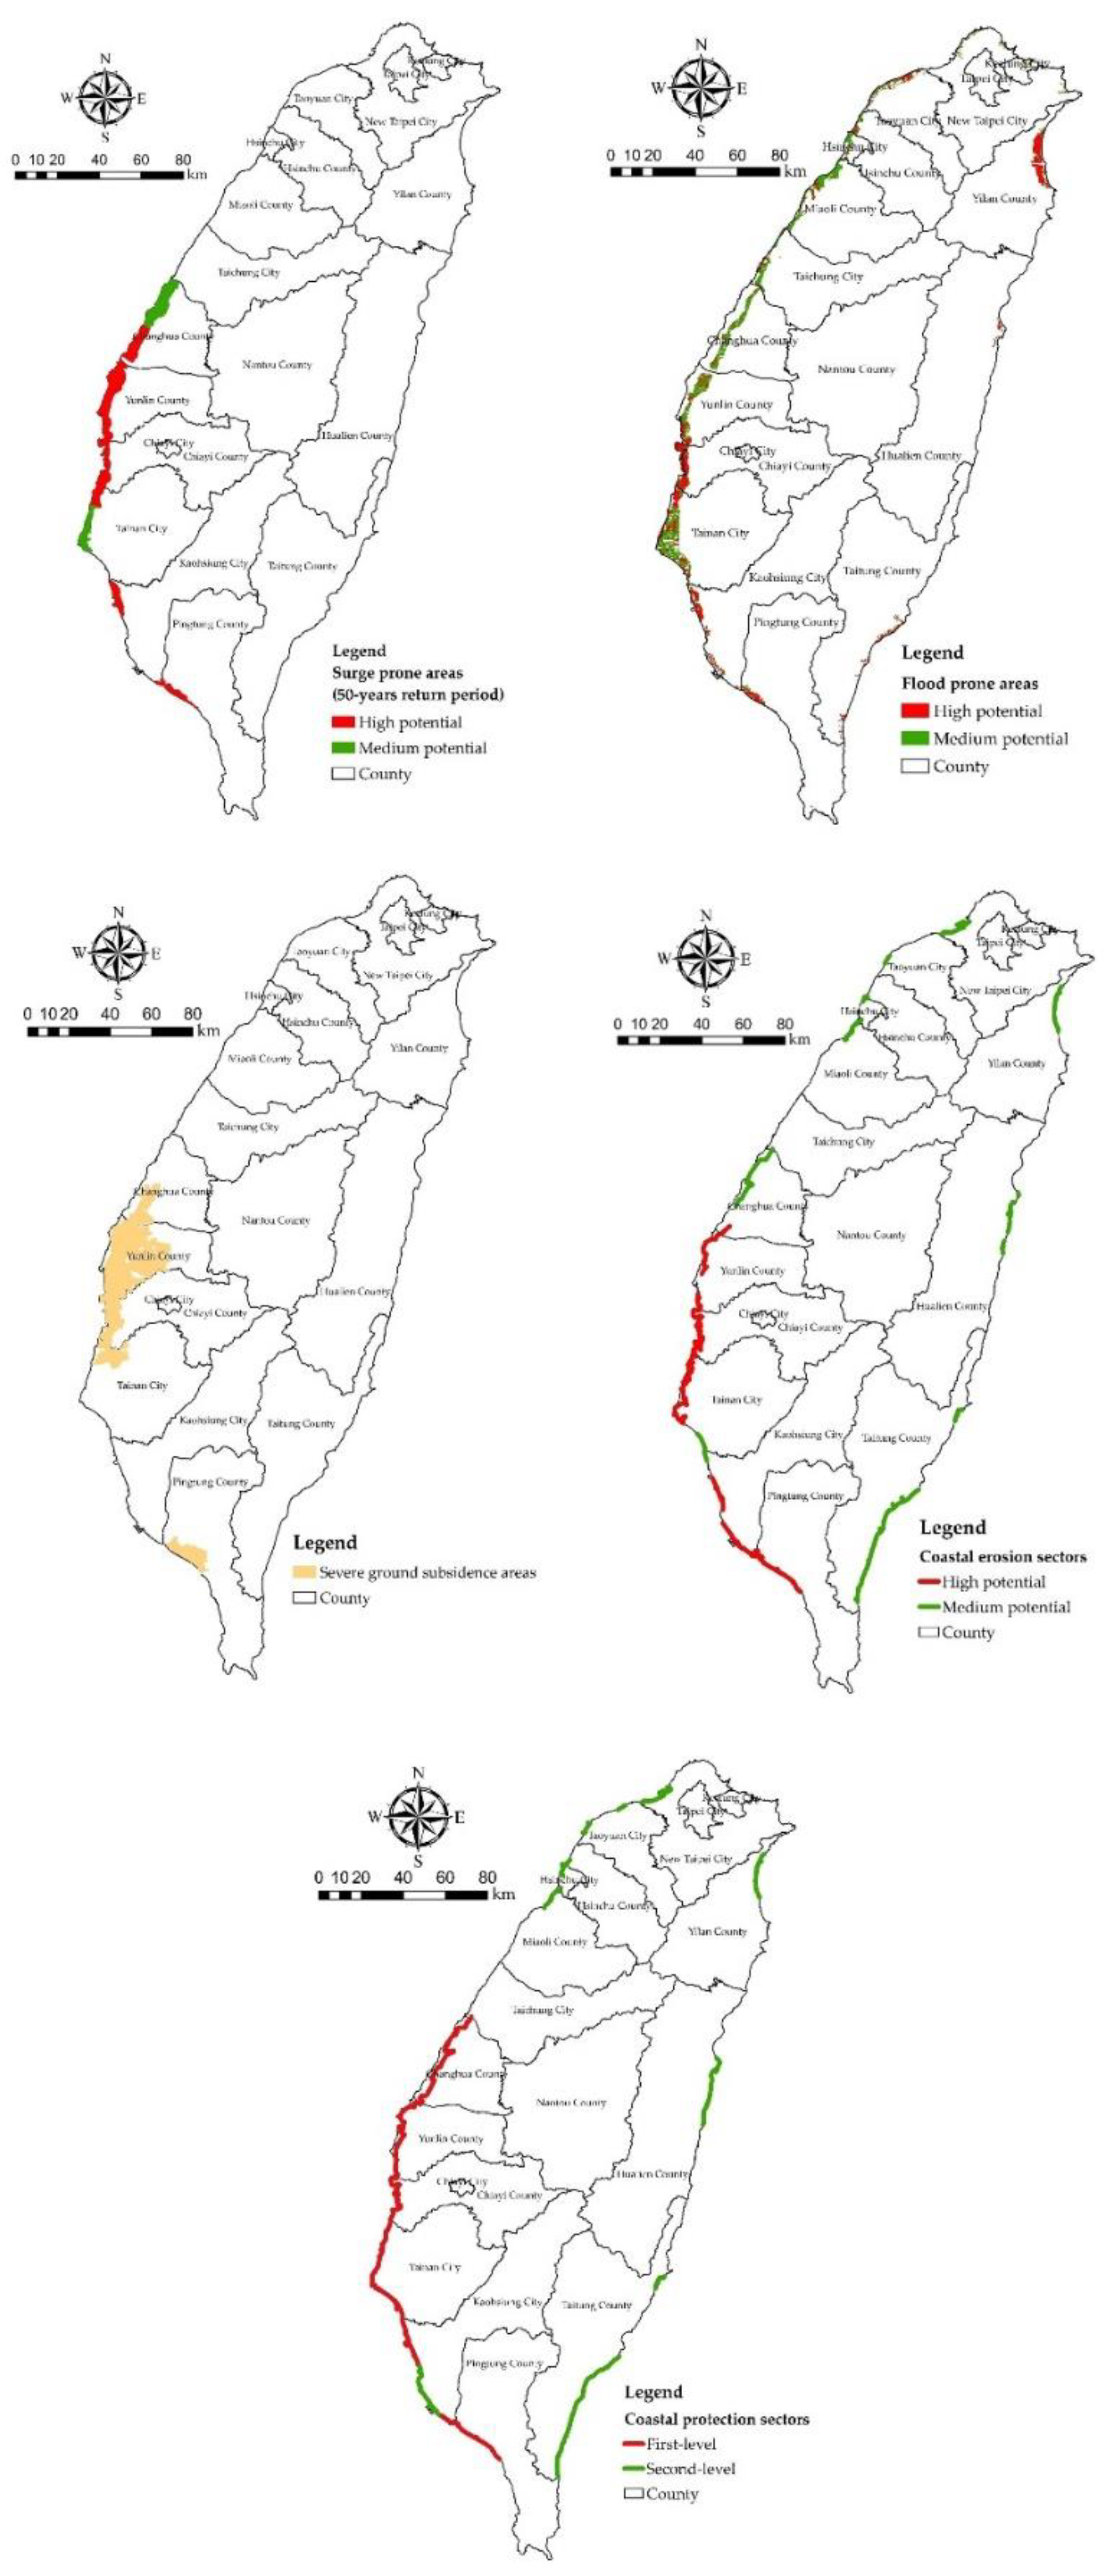
Coastal protection areas were designated as first- and second-grade according to the severities of aforementioned four hazards. Table 1 lists the severity of the hazards and zoning principles. Two types of inundations, storm surge and flood, are considered to be hazardous to coastal areas. The surge hazard is defined as the coastal area inundated by sea water. It should be noted that most of the sea walls in Taiwan are higher than the 100-year surge water levels. Most of the flooding by seawaters is due to run-ups and overtopping of waves, where the duration is very short and flooded areas are relatively small. The “Integrated Coastal Zone Management Plan” thus treats the potential of surge hazard as the elevation difference between the heights of shore land and storm surge, ignoring the function of seawalls. Flooding is due to overland flows. Coastal erosion takes erosion rates and potential effects into consideration. Ground subsidence has an added effect to the other three hazards. However, it is considered as to pose no immediate threats to coastal residences alone. Thus, areas having ground subsidence were demarcated into protection areas when overlaid with areas having one or more of the other three hazards.
After determination of the potential severity of coastal hazards, the “Coastal Protection Sectors” can be delimited following the zoning principles. First-grade coastal protection sectors are those with high potential coastal hazard. Sectors with severe ground subsidence and having areas with one other potential coastal hazard are also categorized as the first grade coastal protection sectors. The second-grade coastal protection sectors are those with one or more medium potential compound hazards. Furthermore, coastal sectors with similar natural hazards and protection requirements were incorporated in the same grade and their extents were zoned according to the appropriate administrative boundaries or landmarks.
Figure 1 presents the distributions of four kinds of hazard prone areas. The total coastline of the first- and second-level protection areas was 478.3 km and 181 km, respectively. Most of the first-level protection areas were distributed in the southwestern region of Taiwan, in the counties of Changhua, Yunlin, Kaohsiung, and Pingtung. All these areas suffer from severe ground subsidence induced by the excessive pumping of groundwater for aquaculture. We selected Yunlin, one of these counties, for further discussion.
2.2. Coastal Protection Strategies
In the past, coastal protection measures were formulated based on the Seawall Management Regulations, which stipulate that the measures can only be implemented within the extent of seawall areas. The zoning of seawall areas was greatly restricted because of inflexible coastal protection measures due to peripheral social and economic developments. The need to protect coastal areas from the impact of tides and waves when other auxiliary protection measures were lacking led to the construction of hard engineering structures (e.g., seawalls) with relatively strict design criteria and resulting in the construction of rather massive structures. However, extreme climate events have become more frequent and severe (Webster and Holland, 2005; Landsea et al., 2006; Elsner et al., 2008) [32,33,34]. For example, in recent decades, the annual minimum typhoon pressure of typhoons that have made landfall in Taiwan has gradually decreased, while the maximum wind speed has increased (Lan et al., 2013) [35]. The conventional mode of using a single protection strategy for coastal areas has thus become outdated. To depend on conventional protection modes, current protection structures must be reinforced to respond to the unpredictable trends of environmental changes. Nevertheless, the use of a single protection measure is limited with regard to economics, environmental impact, and protection effectiveness. Global practice for coastal protection remedies has gradually demarcated setback lines for coastal areas with high hazard risks. In other words, there is no longer a complete reliance on protection defense when facing unpredictable natural hazards. Instead, the conventional conception of zero disaster is discarded, hazards are allowed to occur to an acceptable extent, and attempts are made to reduce hazard-induced damage through risk management. It is suggested that both engineering and non-engineering measures should be conducted to facilitate the goals of ICZM.
3. Methodology
Coastal areas have different characteristics and degrees of exploitation; therefore, a single set of protection design criteria cannot satisfy the aim of sustainable coastal development. Environmental characteristics should be taken into consideration when formulating design criteria for the coastal defense of different regions. The process should be based on hazard risk classes to provide references for developing corresponding design criteria and formulating hazard protection and management measures.
As stated earlier, coastal protection areas in Taiwan were designated according to the criteria set out in the Coastal Zone Management Act, which did not include tsunami hazards. Wave gauging stations around Taiwan also indicate that there has been no tsunami that has caused any casualties in the last century (Central Weather Bureau, CWB; Chen and Chen, 2011; Kontar et al., 2014) [36,37,38]. Nevertheless, Taiwan is located in the Circum-Pacific seismic zone, and the threat of tsunamis is not negligible. Particularly, the potential threat of tsunamis originating from the Manila Trench, the East Luzon trench, and the Ryukyu trench is of concern (Lin et al., 2015; Wu and Huang, 2009; Wu et al., 2015) [39,40,41]. Therefore, the tsunami hazards are included in consideration.
The present study aims to establish methods for assessing the design criteria of coastal defense and land use management in various coastal areas. These methods were mainly based on a set of systematic assessment principles, from which relevant indicators were selected for further management.
Based on the risk management policy proposed by the Executive Yuan, Taiwan, the hazard risk can be defined in terms of the product of potential hazards and vulnerability. Coastal hazards were classified into the five coastal hazard types discussed above. While the hazard index can be quantified based on hazard severity, the coastal vulnerability index (CVI) must be developed relative to specific combinations of different objectives, processes, and spatial and temporal scales (Özyurt and Ergin, 2010) [10]. Furthermore, both natural and anthropogenic factors should be considered. The objective of a protection area is to minimize the impacts of coastal hazards on residents, which means that the focus is on socio-environmental concerns; in contrast, natural factors are incorporated into the hazard indices. Chien et al. (2012) suggested that vulnerability in protection areas should refer to the possibility of life-threatening events or property loss induced by potential hazard factors in a given hazard-prone area [42]. We therefore chose socio-environmental indicators for the assessment of CVI.
First, we decided on the spatial units used to estimate vulnerability in our analysis. Although adopting large-scale units may allow easy and rapid operations and high data accessibility, the resulting failure to reflect local or regional characteristics may lead to their underrepresentation during analysis of the results. To ascertain coastal characteristics accurately, we adopted townships/villages as the analytical and statistical spatial unit, and used currently accessible data in this study. According to the spatial overlay, coastal areas in Taiwan were comprised of 110 townships, which were further subdivided into 898 villages.
Second, we selected indicators for grading before conducting risk analyses and assessments. From a statistical perspective, adopting more indicators generates results that are more representative of the characteristics of analyzed targets. However, in practice, the information required for indicators frequently fails to satisfy analytical requirements for spatial units and accuracy, and relevant survey data may even be completely lacking. This study proposed the following principles for selecting indicators:
- Adopt indicators that can be obtained from accessible databases, or use simple statistical analyses that satisfy the spatial unit and accuracy requirements.
- To ensure data impartiality, data or research projects announced or published by public institutions or government authorities are to be prioritized.
Accordingly, the indicators chosen to assess vulnerability in this study were as follows: population density, annual comprehensive income, and land use.
Regarding indicator weights, expert consensus (e.g., the Analytic Hierarchy Process or the Delphic Hierarchy Process) has generally been relied upon in previous studies, albeit still modified by the personal approaches of the experts involved and the number of survey samples (Ward, 2014) [24]. For this reason, this study still focused on establishing a methodology and assessing its feasibility. Hazard and vulnerability factors were given equal weights in the calculation.
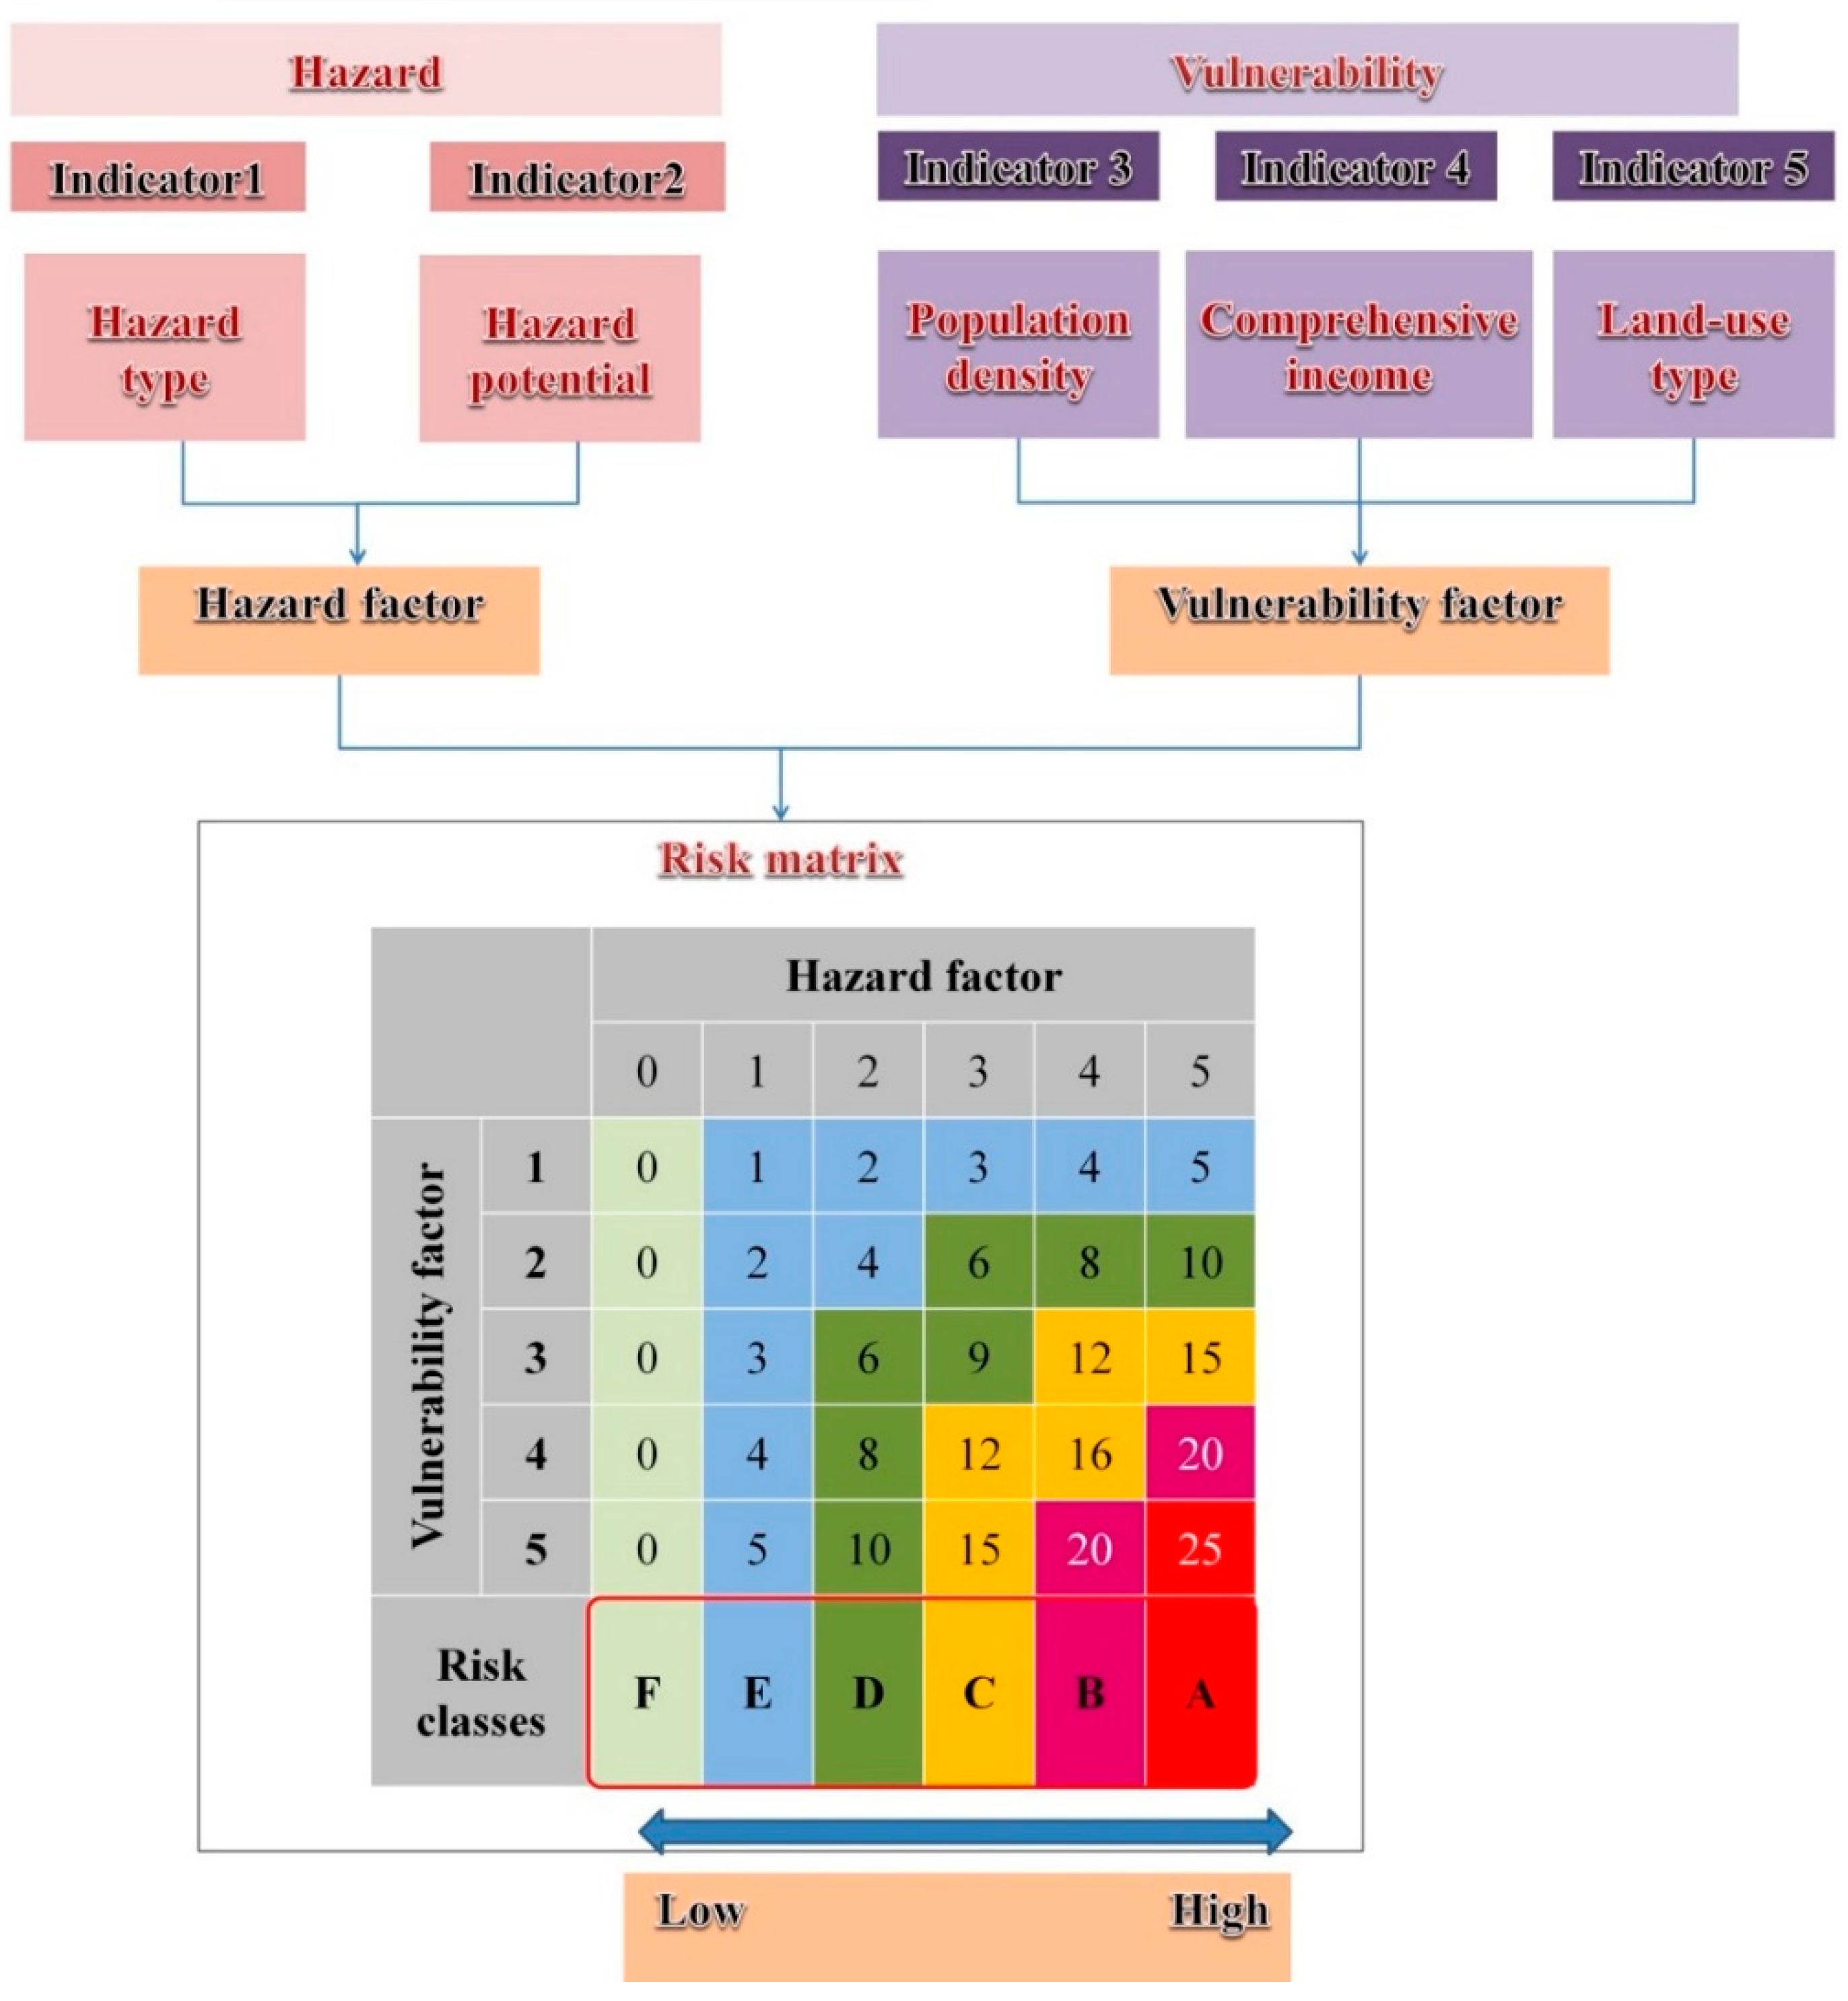
Table 2 graded the scores of each hazard factors and CVI for further risk analysis. Each factor is independent. Hazard potential was defined as the ratio of the hazard-prone area to the shore land area; the greater of these two indicators defined the score of the hazard factor.
Hazard-prone areas were demarcated following the criteria for “High potential” (Table 1). Areas prone to flooding due to storm surges and floods were estimated through numerical simulations. Coastal erosion and ground subsidence areas were demarcated based on survey data sourced from the Water Resource Agency of Taiwan. Furthermore, potential tsunami threats for coasts around Taiwan were taken from the results of the National Science and Technology Center for Disaster Reduction (NCDR, 2015) [43]. The detailed procedure can be found in the following case study.
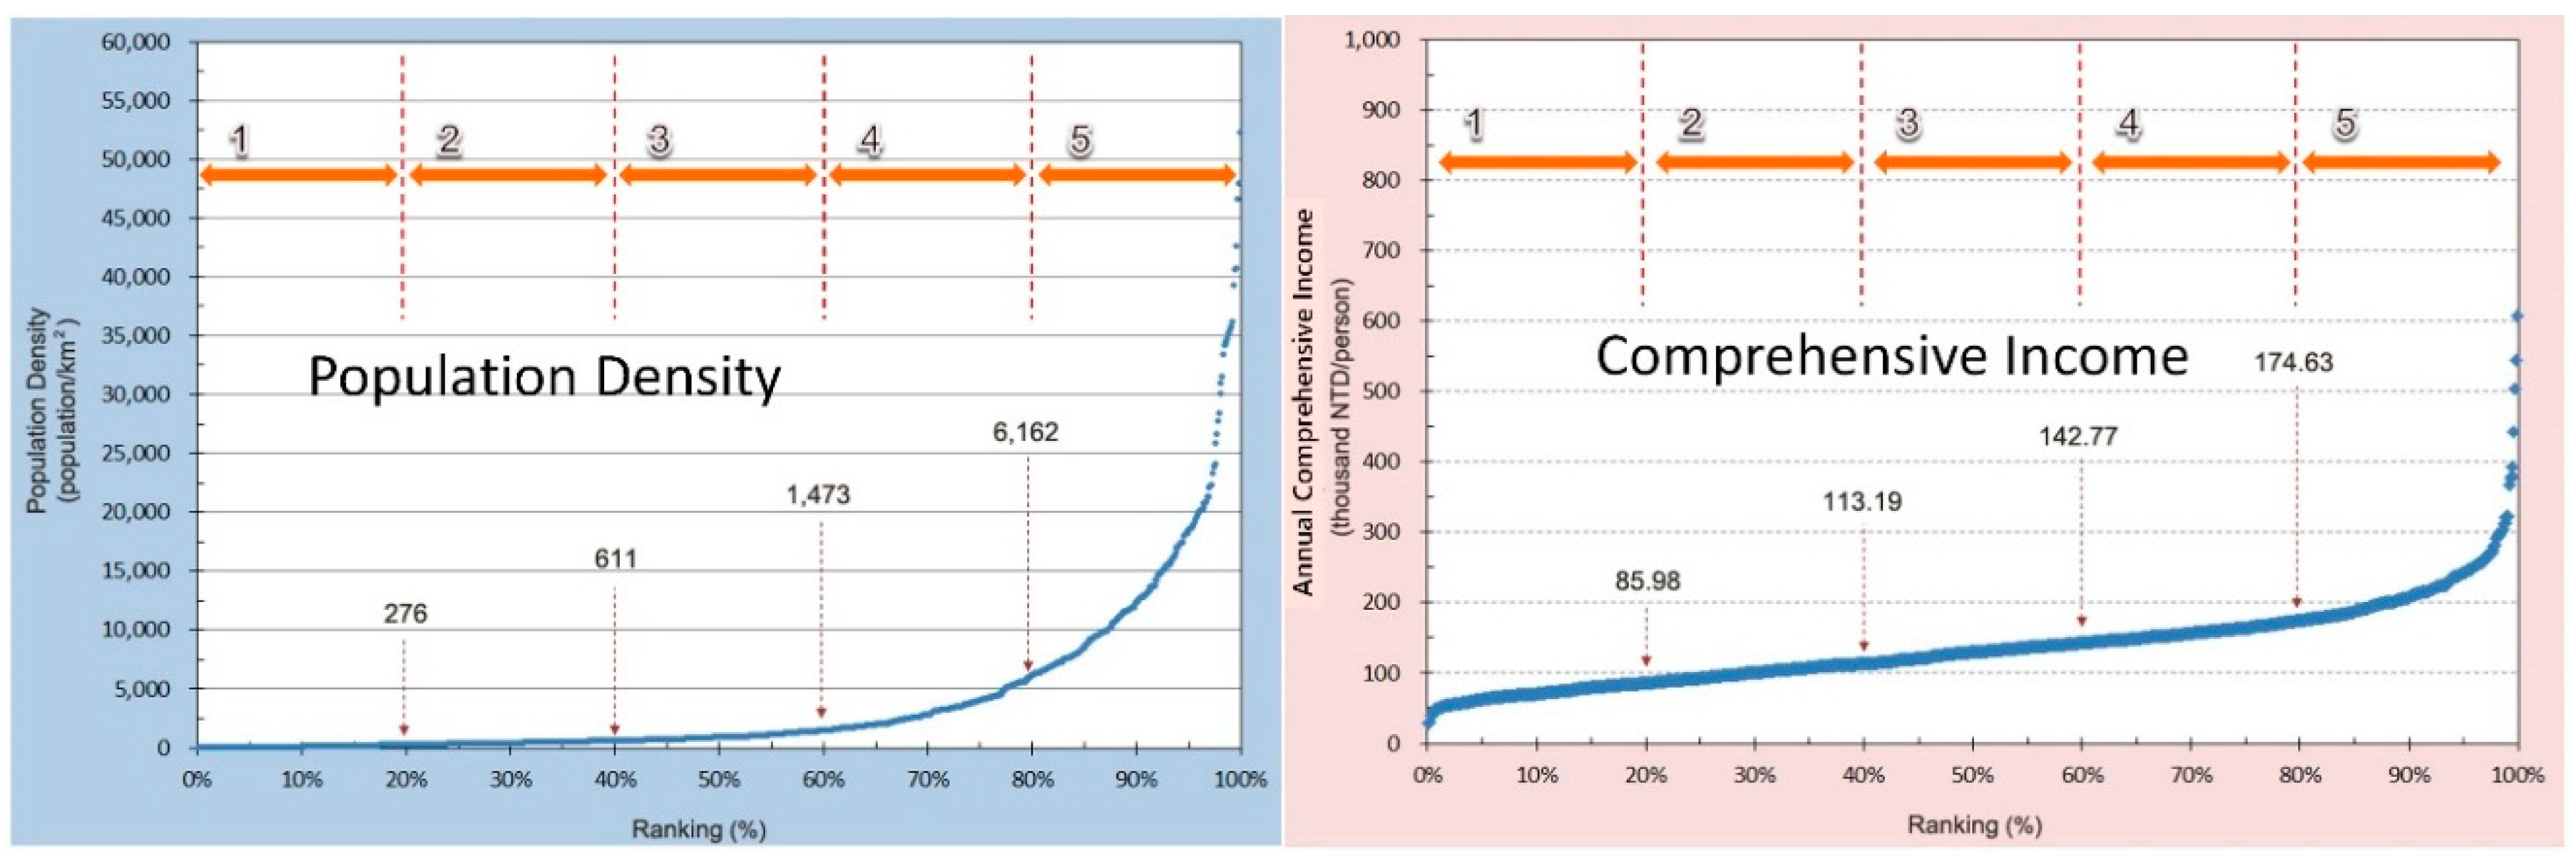
Vulnerability was scored on a scale of 1 to 5, with 1 indicating the least vulnerability, and 5 indicating greatest vulnerability. The population density and comprehensive income of the 898 villages within coastal areas in Taiwan were divided into five classes, by ranking them in 20% increments in ascending order (Figure 2). Five classes were also used to score land use, with vulnerability referring to the impact on human life and property (Table 2). The level of vulnerability estimated in the risk matrix is the average score of the three indicators.
The hazard and vulnerability factors were multiplied in a 6 × 5 risk matrix, generating six risk classes ranging from A to F that denoted high, high-intermediate, moderate, low-intermediate, low, and minimal protection levels, respectively. These risk classes were subsequently used to determine the appropriate design criteria. The assessment procedure and framework for this method are presented in Figure 3.
4. Results
4.1. Formulation of Design Criteria
It should be noted that most of the coastal protective facilities in Taiwan were completed within the last three decades. The design criteria were based on the marine climate, including the impact of waves and surges, for a return period of 50–100 years. However, land use in the protection area was not taken into consideration. It is not economically viable to use the same design criteria to protect shore land areas that have different land uses; for example, residential use should assume a larger protective return period than agricultural use. For sustainable use in a coastal zone, the design criteria should be formulated based on the requirements of coastal protection and hazard management. In this study, shore land areas with different natural and anthropogenic environmental characteristics were objectively investigated and provided with distinct protection strategies and suitable design criteria, upon which subsequent comprehensive protection strategies were planned and designed.
It is noted that ordinary coastal defenses are not designed to withstand tsunami impacts, but normal wave climates and the effects of typhoons. Given the high return period of major tsunami events in the area, it is arguably better to mitigate their potential effects using non-engineering measures.
The design criteria were divided into two categories. One category focused on regulating coastal defenses, and a set of coastal protection structural design criteria were formulated based on the marine climate. These design criteria specified that the protection capabilities of coastal defenses must fulfill the safety standards formulated based on the wave and water level conditions of a certain return period. The other category of design criteria highlighted the need to ensure the safety of coastal social and economic environments, and a set of design criteria for protection was formulated for hazard management.
4.2. Design Criteria for Coastal Defense and Land Use
Coastal erosion and ground subsidence are long-term hazards which pose no immediate threat to human lives. In contrast, waves, storm surge, and tsunamis are major destructive events that can constitute life-threatening hazards. Consequently, the relevant coastal defenses must be capable of controlling the tides and waves caused by extreme conditions, preventing them from severely affecting protected coastal areas, while reducing coastal hazards. This principle was a crucial factor in the safety validation conducted in the design of coastal defenses. The design criteria proposed here is mainly concerned with the safety of coastal defenses, while against waves and storm surges. However, tsunami forces were not considered when assessing the engineering measures, since these typically have a high design criterion that is probably able to withstand low-level tsunami events. To be on the safe side, possible inundation through tsunami was set as 1 m. Higher than 1 m, it is proposed that tsunami threats be treated with non-engineering measures. Regions with potential inundation through tsunami of less than 1 m are suggested to follow the measures against surges.
The design criteria for different types of land use were selected according to risk levels. It is suggested that building foundations should be elevated above the proposed design criteria to prevent inundation caused by floods or surges. Agriculture and aquafarming areas situated at elevations lower than specified in the design criteria can experience constant inundation, and should be reported. In such cases, we suggest modification of the land use of these areas.
Integrated coastal protection should be realized through a combination of engineering and non-engineering measures. The design criteria for these two categories were flexibly formulated based on actual combinations of protection measures. The proposed principles for formulating coastal protection structural design criteria and land use refer to various risk levels are presented in Table 3 and as follows:
- High risk level (level A): marine conditions (including waves and surges) in a 100-year return period were adopted as the design criteria.
- High-intermediate risk level (level B): a 50–100 year return period was adopted as the design criterion. However, to avoid any negative environmental impact caused by design criteria upgrades, the original design criterion is still considered applicable for coastal defenses meeting the criteria of a 50-year return period, if modifying the coastal defenses (structural measures) or extending the buffer zone (nonstructural measures) enables the coastal defense to reduce external impact sufficiently for the original design criterion to withstand it.
- Moderate risk level (level C): a 50-year return period was adopted as the design criterion.
- Low-intermediate risk level (level D): a 25–50 year return period was adopted as the design criterion. As above, to prevent any negative environmental impact caused by upgrading design criteria, the original design criterion was still considered applicable if other supportive measures can reduce external impact sufficiently for the original design criterion to withstand it.
- Low risk level (level E): a 25-year return period was adopted as the design criterion.
- Minimal risk level (level F): no protection facility is required.
Both coastal defenses and planning of land use can be reevaluated at a later point.
5. Discussion
This study used Yunlin County as case study for further discussion to verify the proposed assessment principles on design criteria and risk analyses. It is hoped that the results can be used for future coastal management. The data used in this study were obtained from the databases listed below:
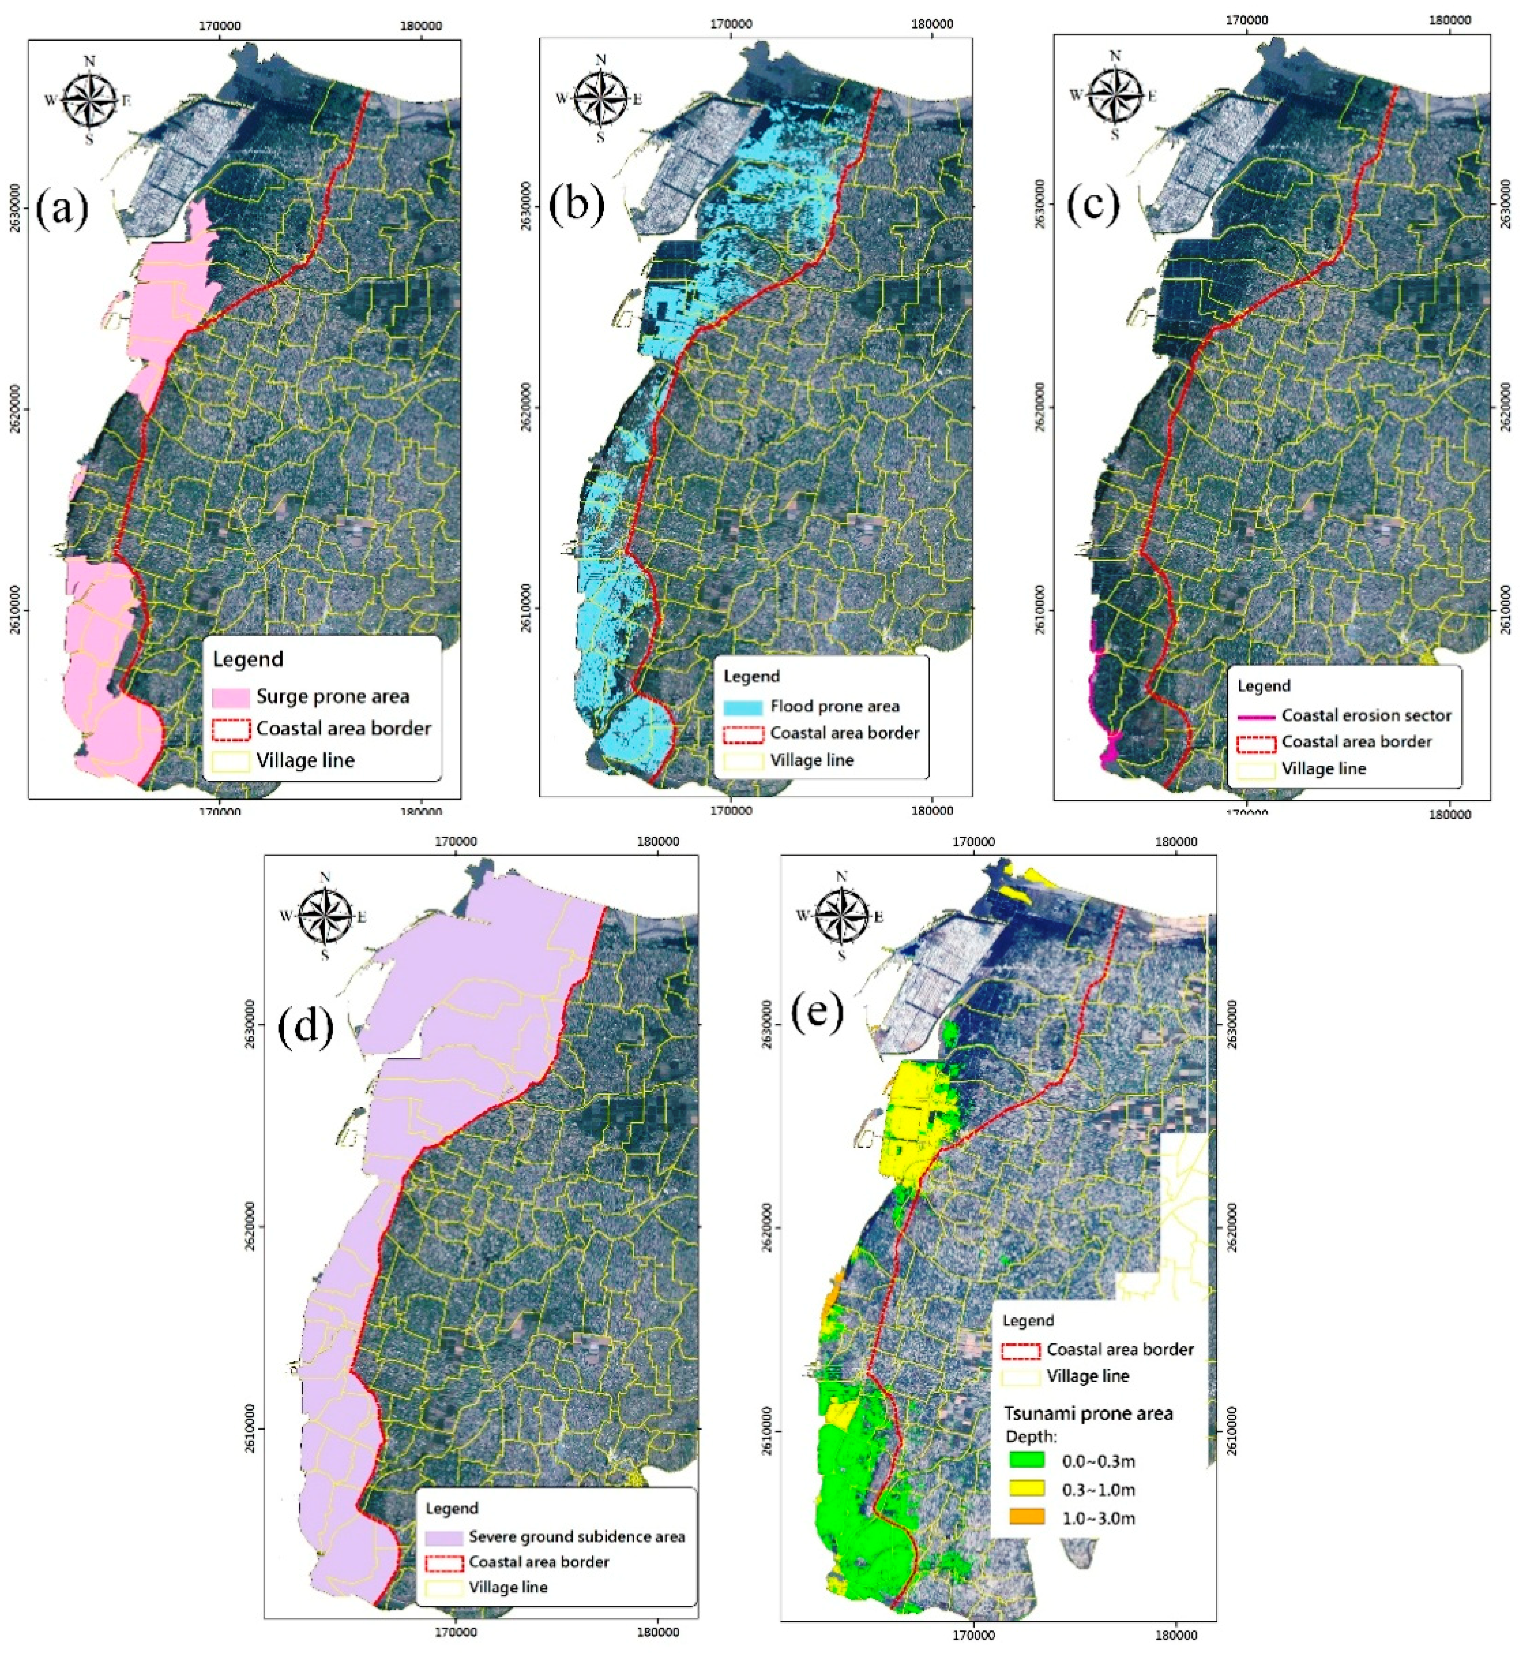
- Storm surges: The 50-year return period of storm surge height along the Yunlin coast is +2.64 m, based on “The Assessment on Coastal Protection of Sea Dikes” plan (Water Resources Planning Institute (WRPI), 2014) [44]. The design codes proposed in this plan were applied by the River Management Offices to assess the safety and capability of currently existing sea walls. Areas with potential inundation depths greater than 1 m were estimated based on storm surge water levels and land elevation. The criterion of having an inundation depth of 1 m or more is given in Table 1, which defines the severity of coastal hazards where inundation may cause danger to life. As the height of the sea wall throughout the areas studied is greater than the potential storm surge heights, the extent of inundation-prone areas was estimated with the assumption that there were no sea walls in the area. The Taixi and Kouhu Townships were estimated to be the areas that most prone to surge hazards (Figure 4a).
- Coastal erosion: The erosion coastlines of Yunlin County were estimated using data from the historical bathymetry survey. The coastline of Kouhu Township was found to be subject to coastal erosion (Figure 4c).
- Tsunami: Areas under potential tsunami threats were studied by the NCDR (2015) [43]. The results were derived from the numerical simulations of 600 scenarios. Eighteen possible epicenters of earthquakes distributed in the oceans around Taiwan were considered. These include the Manila trench, one of the most hazardous tsunami source regions. The maximum possible earthquake scenarios within these trenches and troughs were considered. The areas that can be potentially affected by tsunamis in Yunlin County have a similar distribution to storm surge inundation areas. Essentially, Taixi and Kouhou Townships were estimated to be most prone to tsunami hazards (Figure 4e).
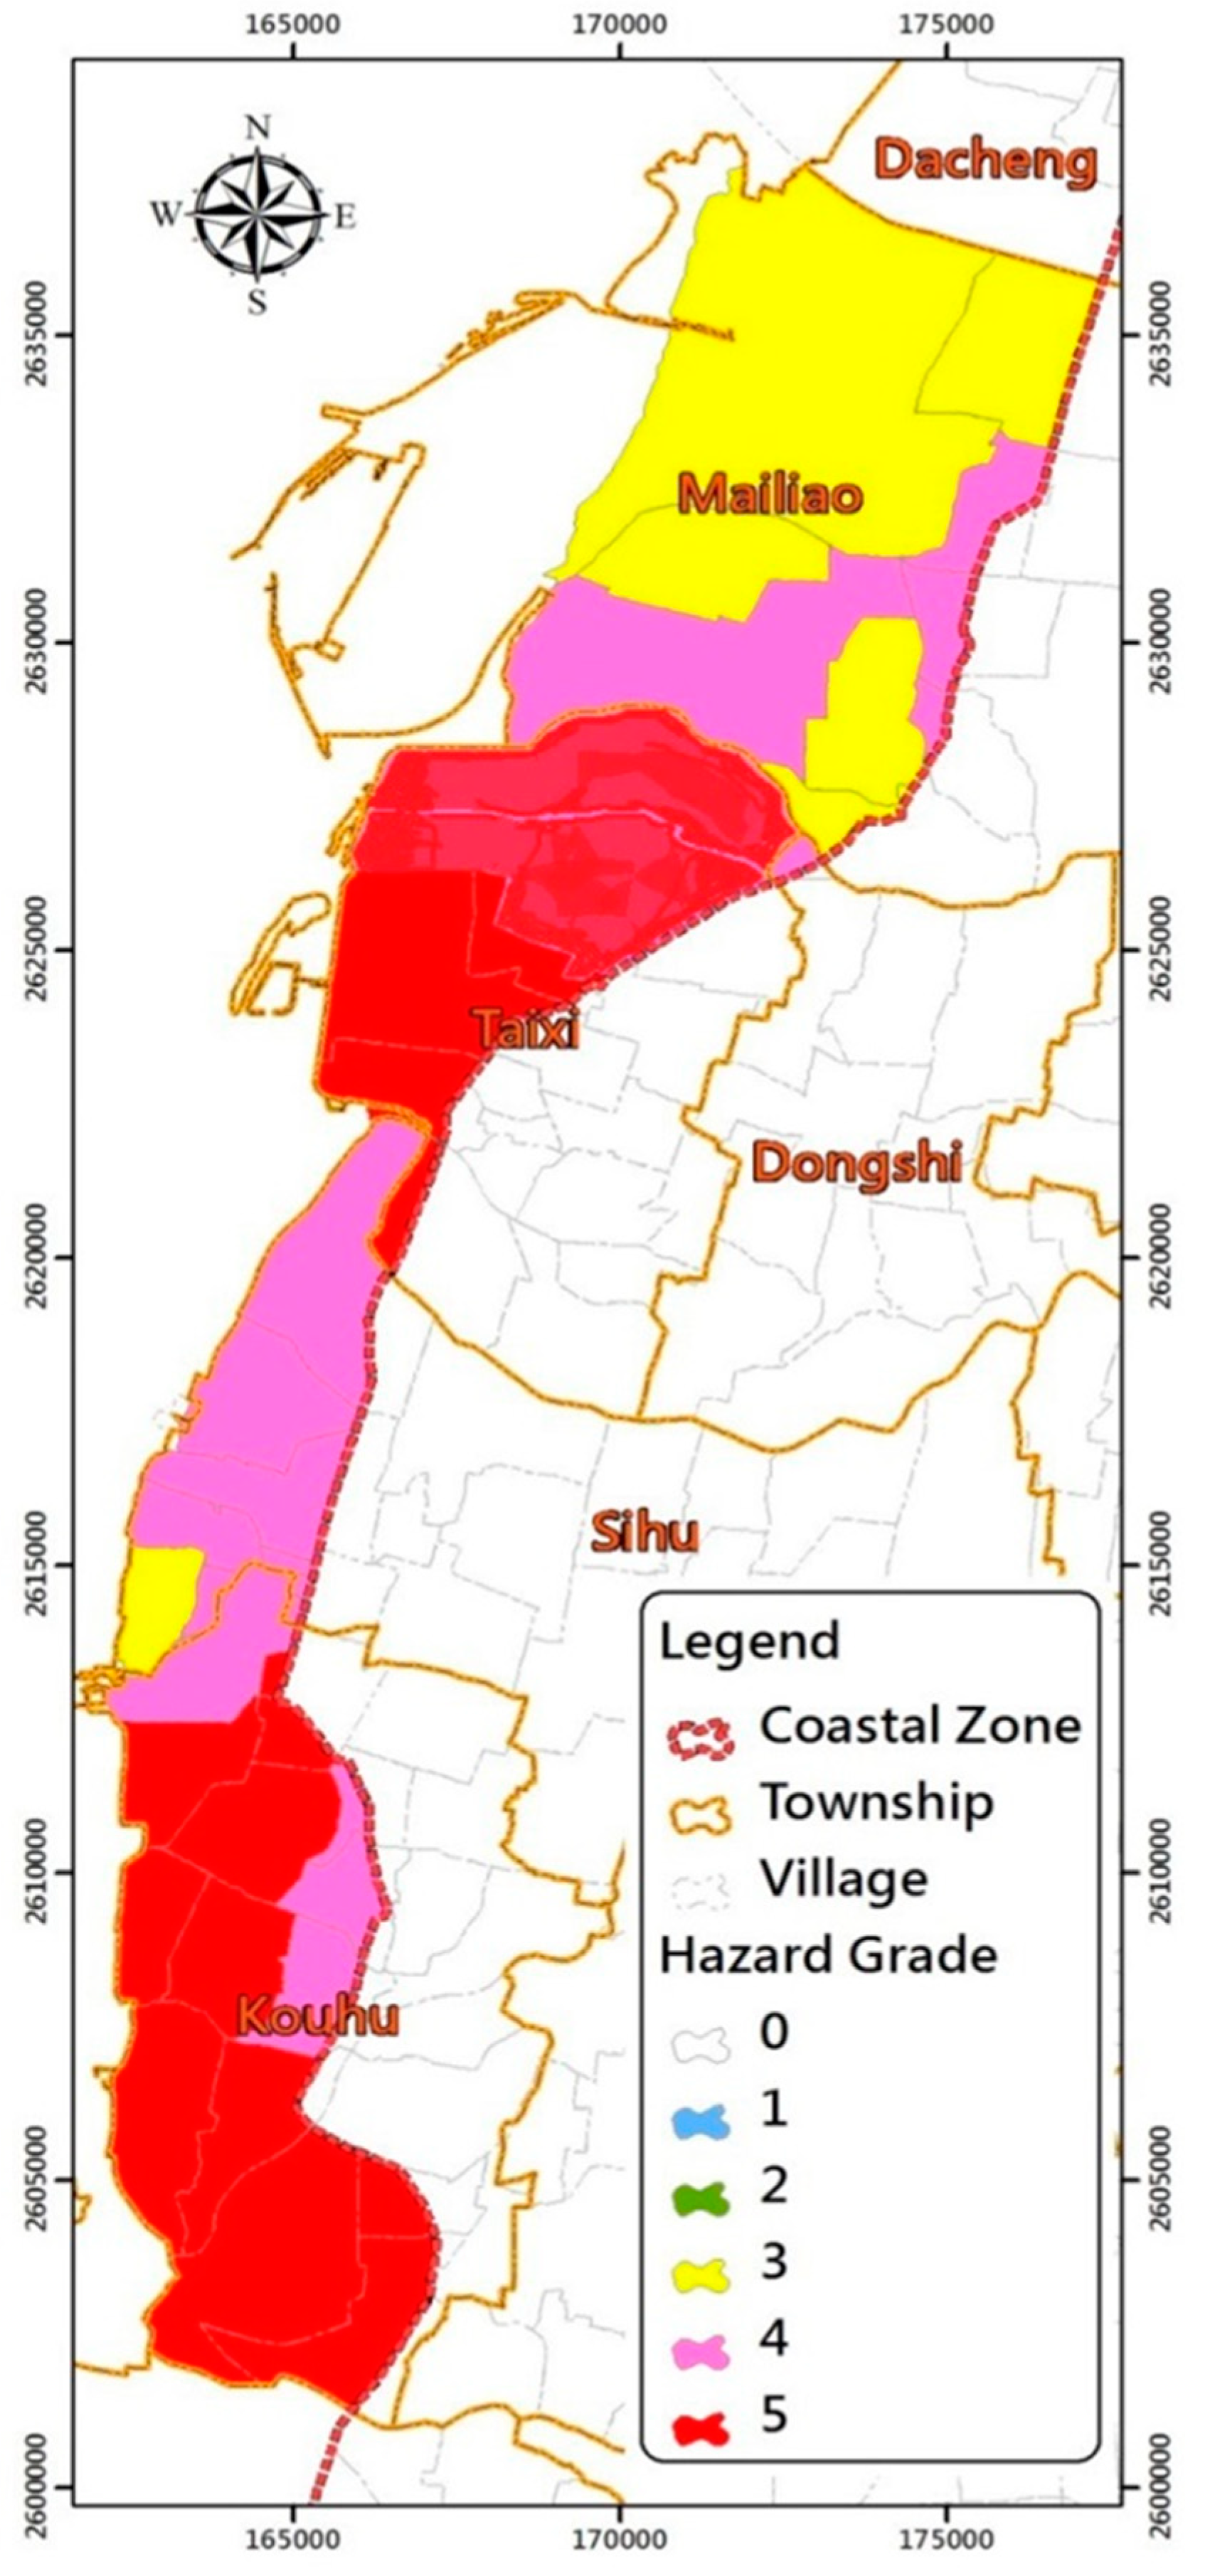
The data for the five hazards were all acquired from official sources, in accordance with the stated requirement of data impartiality in this study. After overlaying the resulting five coastal hazard-prone area layers, we found that Kouhu Township was subject to a combination of all five hazard types. This township made up over 66% of the total hazard-prone area, resulting in a hazard factor score of 5. The rest of the villages had scores of 3 or above. The hazard factor score of each village is presented in Figure 5.
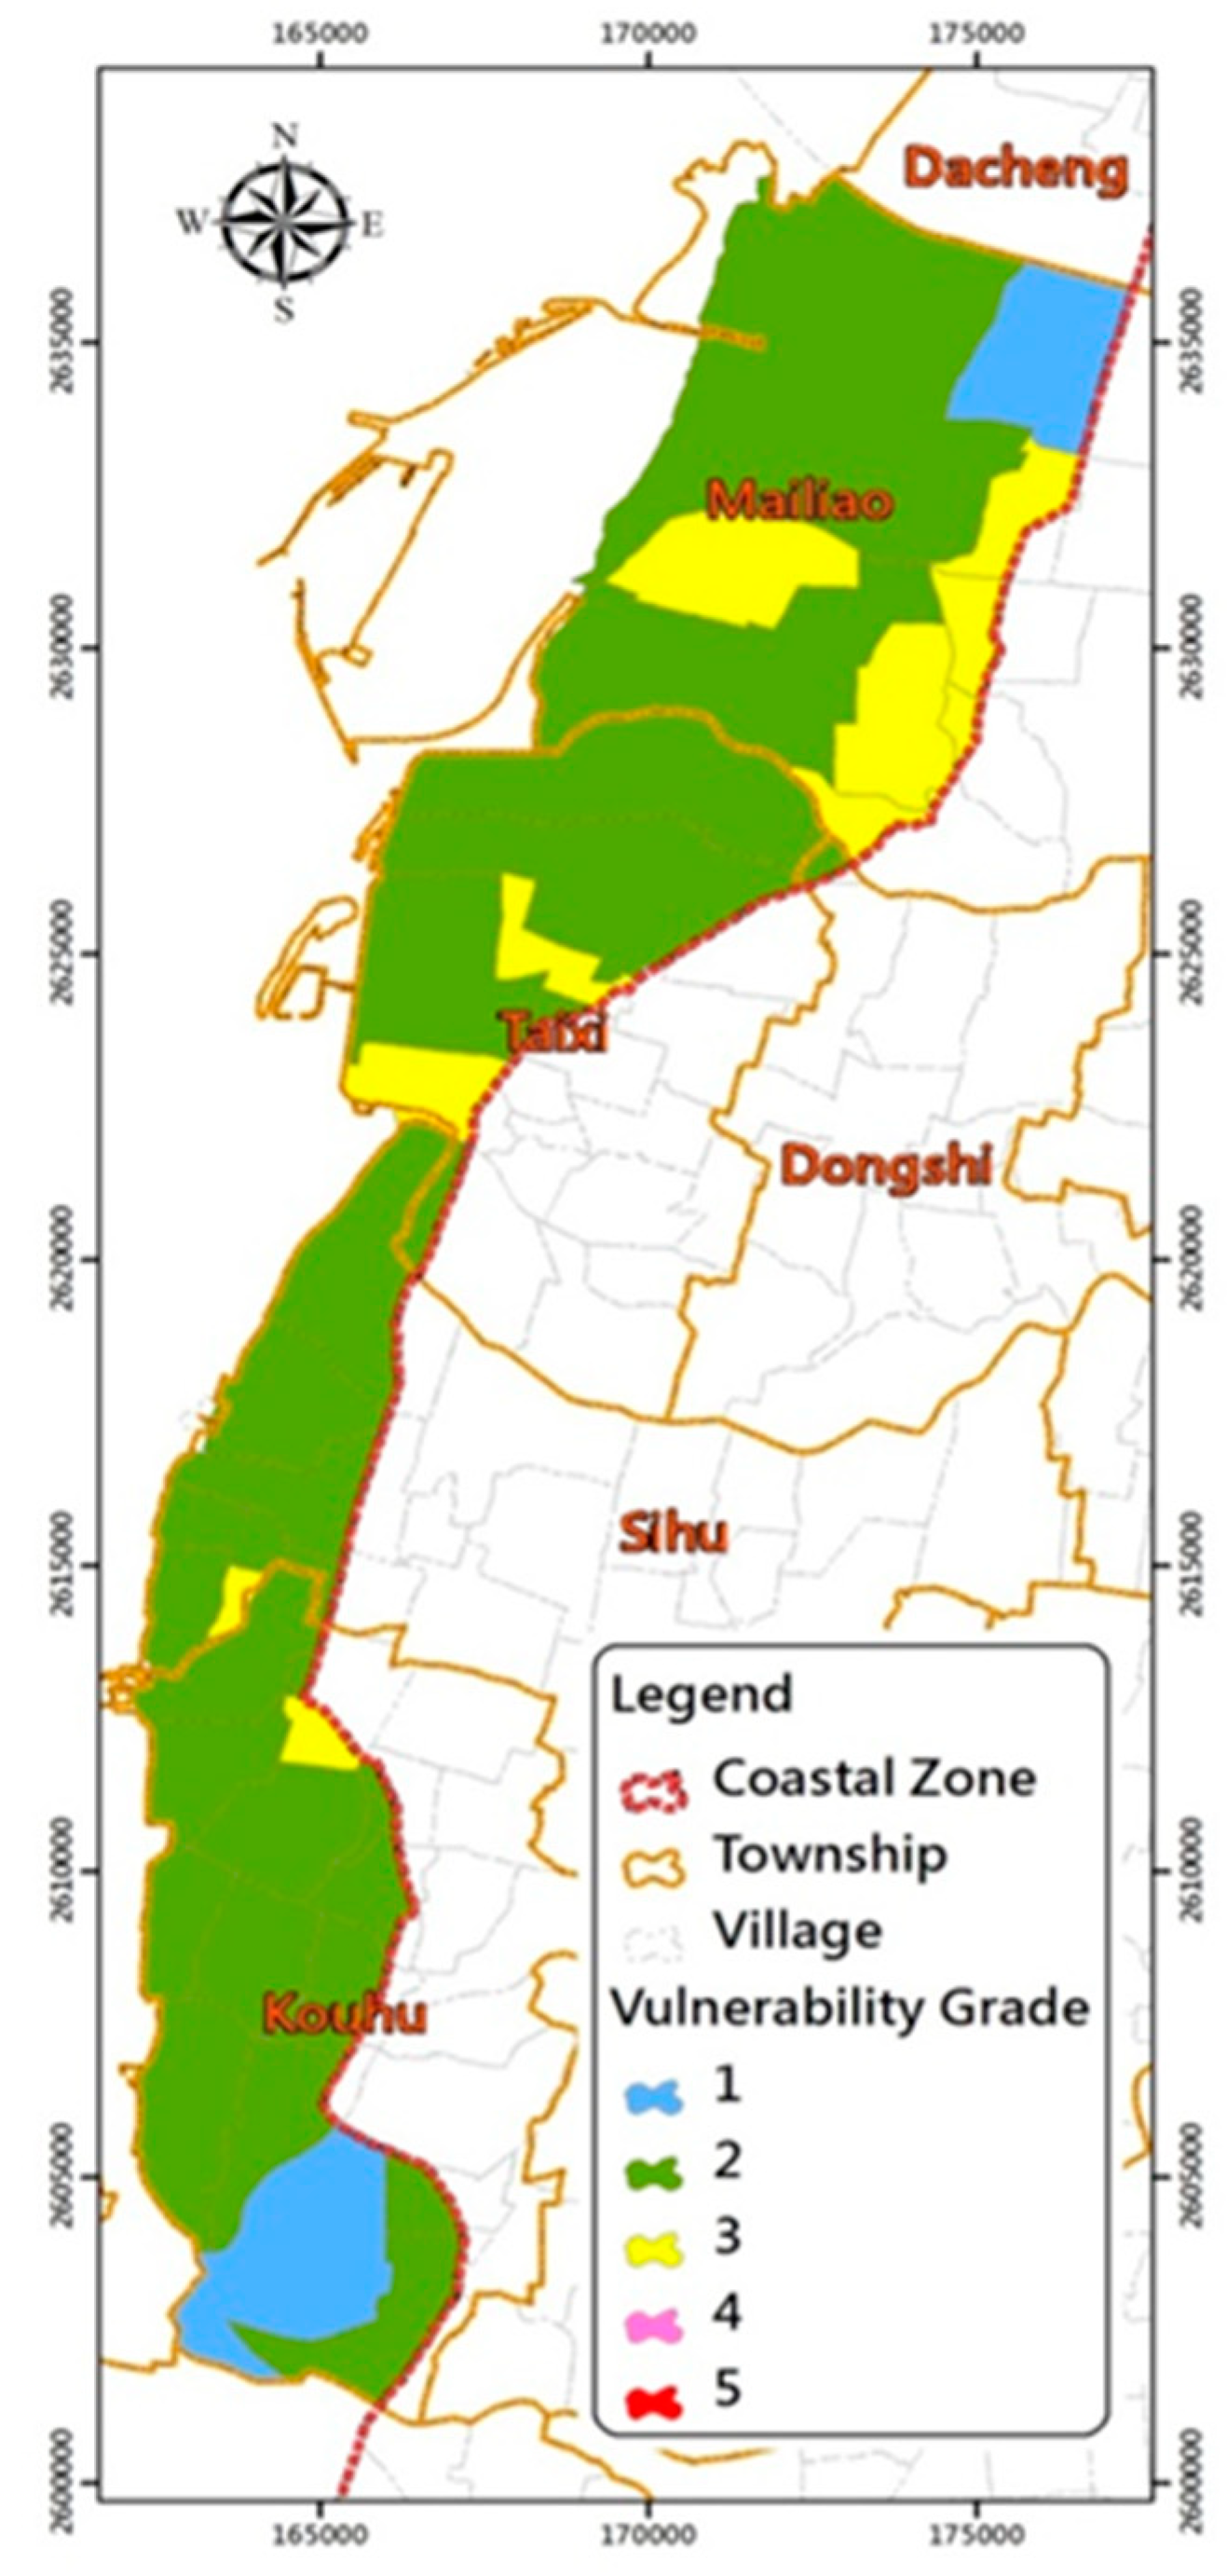
Population density, comprehensive income, and land use data were acquired from county government statistics, and were used to estimate vulnerability. Population densities and comprehensive incomes of the villages within the coastal area of Yunlin range from 1 to 4, and 1 to 3, respectively. Land use scores are 2 or 3, with most of the villages constituting productive areas, although a few non-productive areas also exist. The vulnerability grading was derived from the average score of the three indicators for each village (Figure 6).
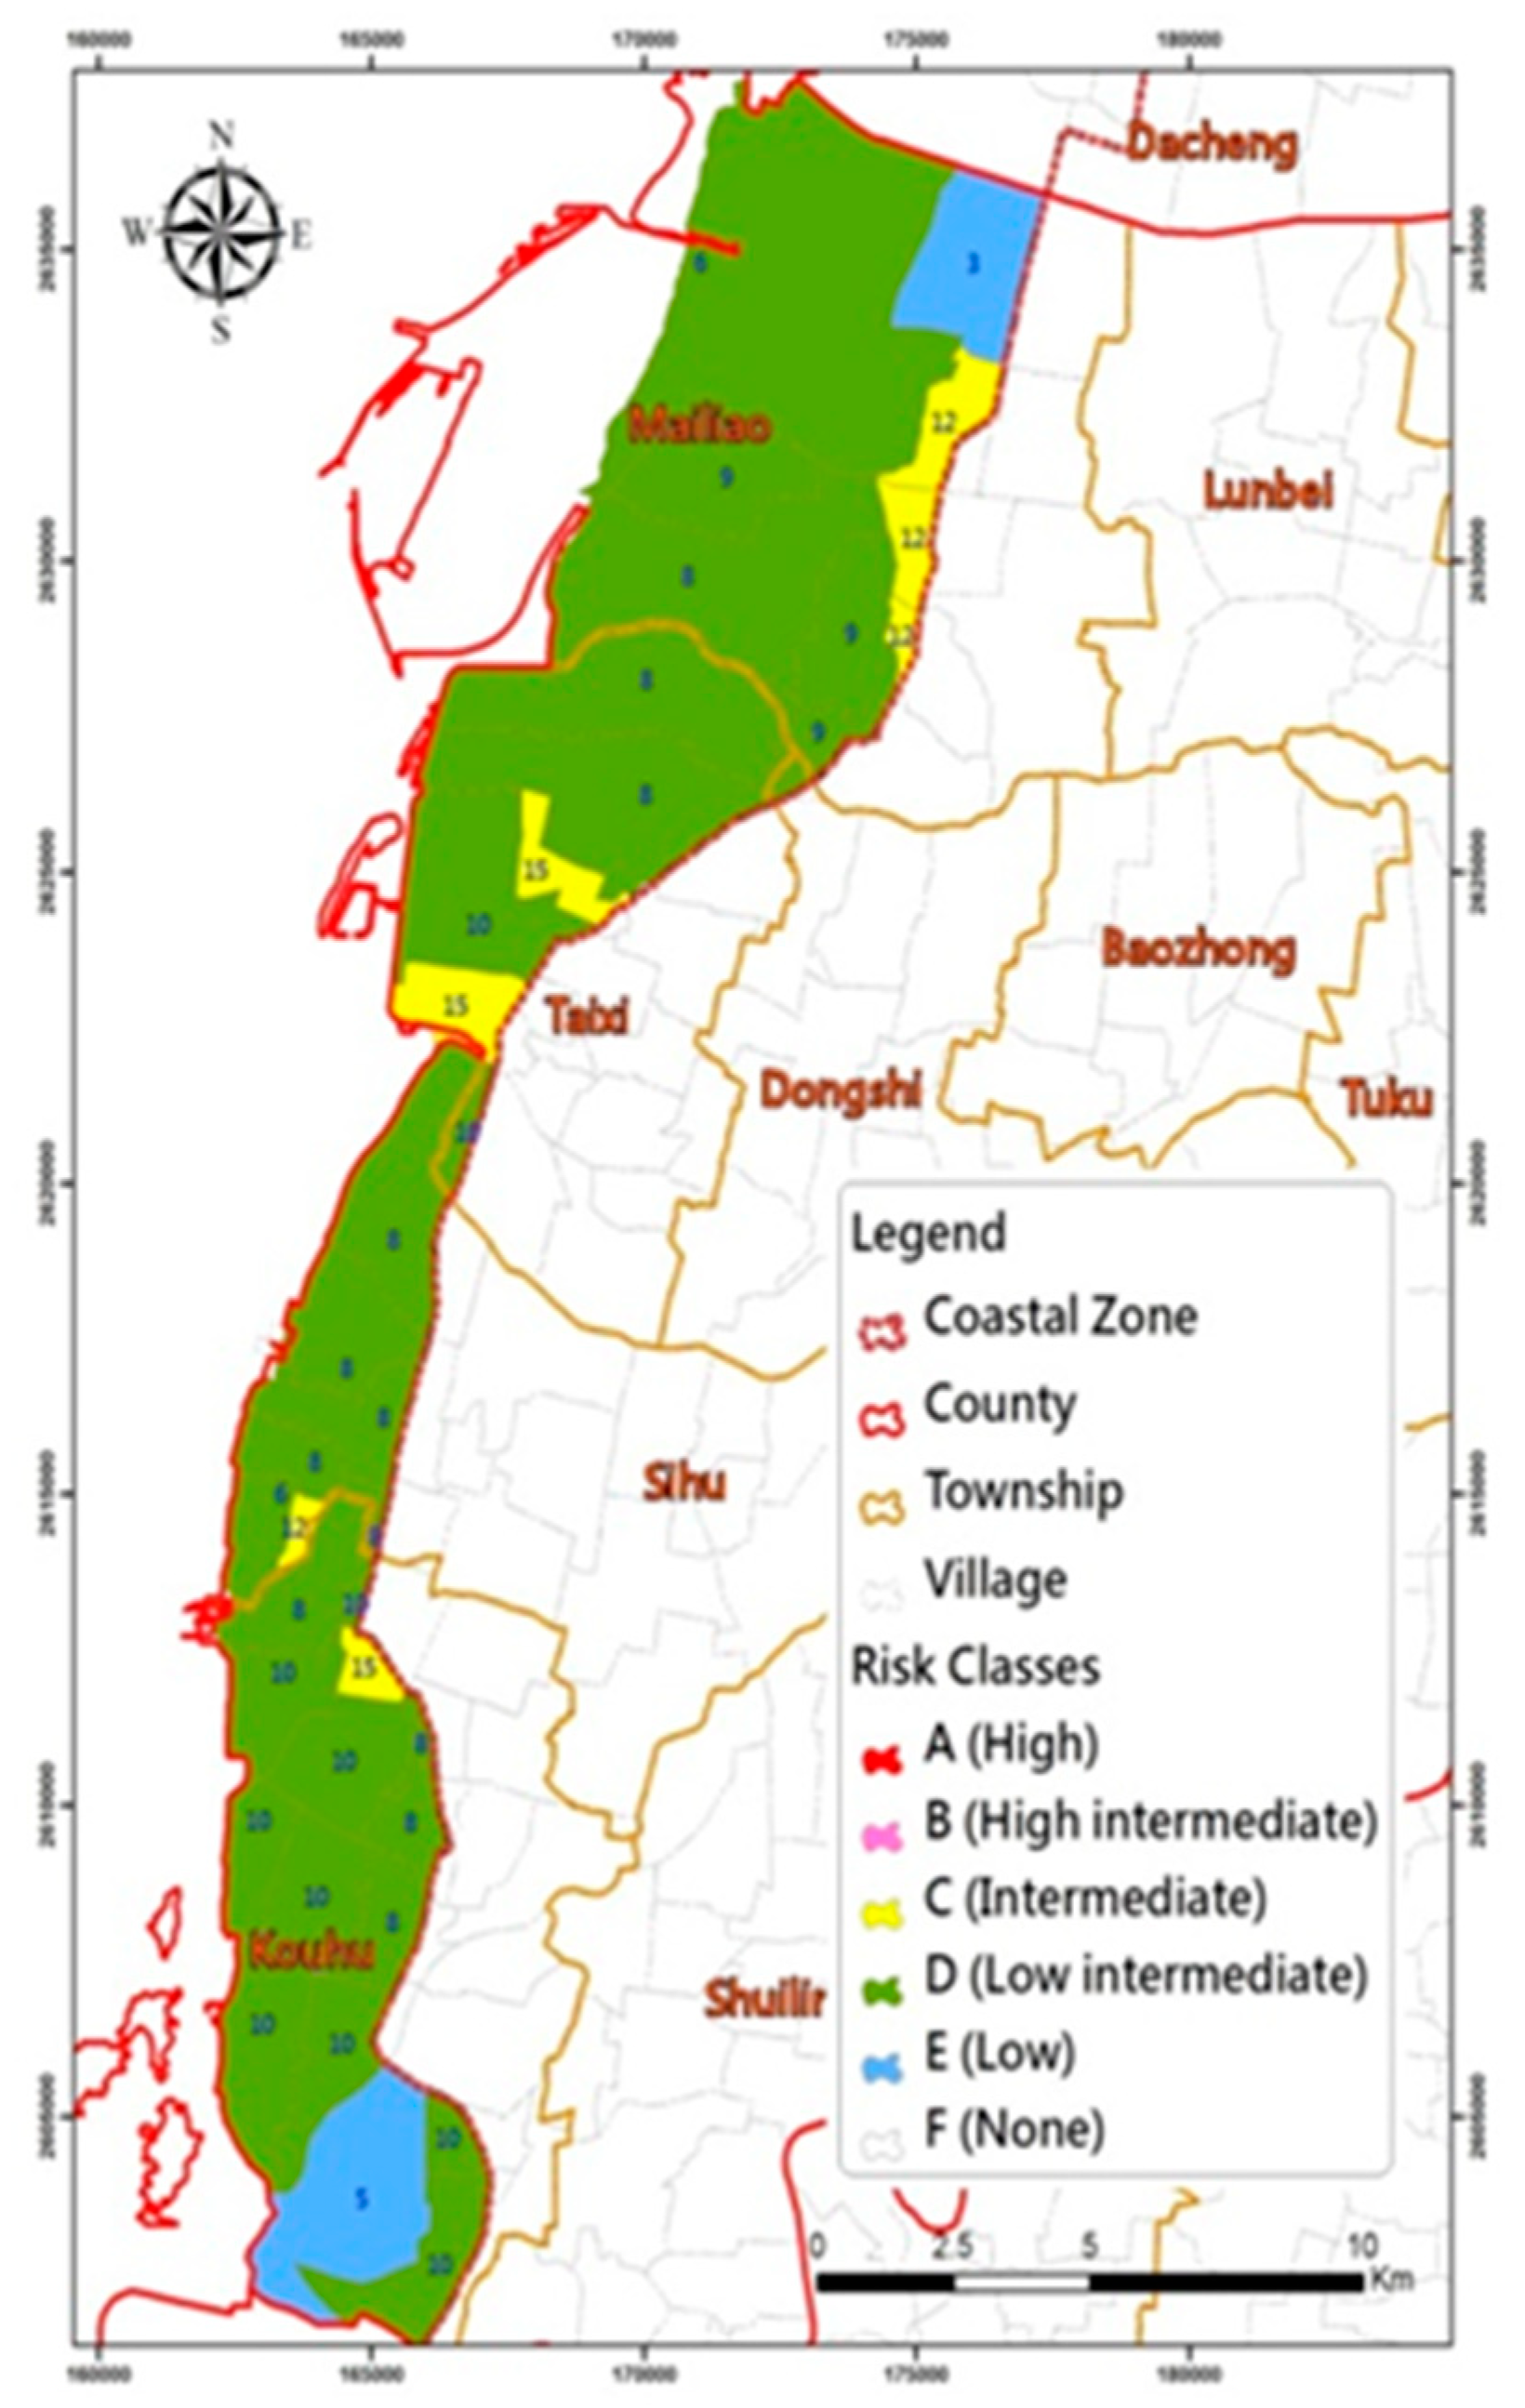
Risk maps for each village (Figure 7) were constructed by multiplying their respective hazard (Figure 5) and vulnerability (Figure 6) scores. The results show that most villages were classified as Level D (low-intermediate risk). Level C (moderate risk) was the highest risk class reached, and among these villages, only Yongfeng (in the Taixi Township) was adjacent to the shore.
Coastal areas that are adjacent to others with similar natural and anthropogenic environmental characteristics can be incorporated into a single protection area unit, and assigned an appropriate protection level. Table 4 presents the assessment of the coastal defense of Yunlin’s coastal areas. The results show an overall coastal protection level of D (low-intermediate risk). The run-up heights of waves with a 25- and 50-year return period were adopted as the coastal protection structural design criterion.
The designed and surveyed height of the coastal defenses is shown in Table 5. The height is referred to mean sea water level. Waves reaching a run-up height equal to the expected 25- and 50-year return period events are also listed in the two columns to the far right for comparison. These data were estimated using DHI MIKE 21 numerical models, including the effects of waves and tides. It is apparent that all the existing coastal defenses in Yunlin met the safety standards.
However, it should be noted that ground subsidence is still active in the coastal areas of Yunlin, with subsidence rates around coastal defenses in the order of 0.03–0.11 m/year. In addition, global sea level rise rates were estimated at 0.0028–0.0036 m/year between 1993 and 2010 (Church et al., 2013) [47]. Lan et al. (2013) simulated sea-level-rise scenarios in the range of 0.10 to 0.15 m during the time period ranging from 2020 to 2039 for the case of the southwest coast of Taiwan [35]. Thus, the level of protection offered by the breakwater/revetment is likely to be downgraded in the near future, given the influence that sea level rise and ground subsidence have on the long-term stability of structure. The data also shows that the coastal facilities located in Taixi Township are experiencing a higher subsidence rate than the others, and are thus categorized as having the highest risk level. We suggest that periodical monitoring projects be conducted for further assessment. According to our risk assessment, once the protection level of the existing breakwater/revetment goes below the standard 25-year return period, modification of the defense measures should be conducted immediately.
5.1. Non-Engineering Measures
Considering Yunlin’s relatively high hazard score, both engineering and non-engineering measures should be conducted simultaneously, as part of ICZM. We suggest the following non-engineering measures.
• Delimiting the buffer zone
The buffer zone in Yunlin took into consideration the dominant coastal hazards of storm surges, ground subsidence and tsunamis. Areas with intermittent or even frequent flooding were given special attention. The townships of Taixi and Kouhu have the highest hazard scores and delimiting the buffer zones is suggested as their first priority. However, regulations in the buffer zone may hinder coastal development; two levels of buffer zones were therefore suggested. The first one was delimited based on the more frequent hazards, such as storm surges and ground subsidence, with strict limitations. The second one considers the very rare hazard, such as tsunami, and the regulations there are more flexible. The first level is marked 50 m further landward of the 25-year return period storm surge water level. No further exploitation within this buffer zone should be permitted. The latter one is delimited based on the tsunami potential risk area which was shown in Figure 4e. A restrictions and permissions system should be implemented where the tsunami potential inundation depths are more than 1 m. Any activity that may lead to explosion or toxic pollution should be forbidden. The development of residential communities in highly populated areas is to be regulated. Low density developments are to be encouraged.
• Construction of the hazard maps
A hazard database should be established and maintained, and a risk management and economic analysis should be carried out to develop a coastal protection policy and regime.
• Land-use modification
The overuse of groundwater is the main factor causing ground subsidence in this region. A large amount of groundwater is being extracted and used for aquaculture; therefore, the use of land for new aquaculture applications should be restricted. Local government agencies should be given a portion of grant funds intended to reduce the development of fish farms. For maintaining groundwater balance, river water and rainwater can be used, and wastewater from industrial plants may be treated and then discharged into the rivers or artificial lake to increase the infiltration.
It is suggested that land-use changes into detention basins or is used for building solar power systems. These regions have suffered constant inundation and consequently yielded below-average production benefits. The proposed change of land use is a win-win solution to reduce the impact of inundation and provide new resources.
• Building renovations
Due to the threat of flooding, buildings should be modified to prepare for flood hazards. Some suggested facilities or modifications include waterproof gates, foundations on stilts, and temporary polder dykes. The entire coastal area in Yunlin is affected by ground subsidence, which resulted in low-lying lands. Buildings with low foundations experienced frequent inundation on the lower floors, including the basement and first floor. Hence, limiting the use of low floors to decrease the loss of assets is another option. Following such limitations, reductions in housing and land taxes can be used to encourage residency. The Taixi and Kouhu townships are especially encouraged to deploy these measures. The foundation elevation of any new buildings should be higher than the 25-year design criterion. It can also reduce potential losses induced by tsunamis.
Any changes in land use patterns that fall under scores 4 and 5 in Table 2 should be made tsunami resistant. This would typically require buildings to be made using concrete, and preferably allow vertical evacuation under the worst case scenario high-return tsunami events. Evacuation shelters should be designated in the regions where the tsunami potential inundation depths exceed more than 1 m. The public should be made aware of emergency evacuation routes through the use of mass media and public address systems.
• Improvement of forecasting and warning
The main purposes of the defense system are the improvement of forecasting and warning for storm surge, flood, and tsunami. Disaster prevention training and education to make people aware of coastal hazards and what to do in case of hazards should be conducted on community basis. These exercises and education on precautions and preparedness against hazards will reduce potential losses.
5.2. Public Participation
Responsible authorities are now preparing drafts of coastal protection plans with respect to different regions in Taiwan, and should be announced in 2020 following the Act. During this period, public participations in establishing coastal defense and management policies are to be encouraged. Three-stage of public participations, including opinion polls, public hearings, and consensus conferences, should be carried out before the draft of coastal protection area planning are to be completed. Risk maps generated by this study can be a useful tool to show the public that the threats of flooding are both realistic and imminent, demonstrating possible coastal risks and their effects. At the same time, non-engineering measures proposed in our study can be used to offer alternative measures for mitigation, improving acceptance and understanding by the public. Furthermore, when necessary, factors and weights proposed in this study can be easily adjusted in future studies in accordance with public interests.
6. Conclusions
Decision of adaptation or mitigation strategies for coastal defenses is made on a national scale in Taiwan. For this, policy makers should be provided with as much information as possible. On the other hand, too much information at one time often causes confusion, leaving it hard to make correct decisions. Furthermore, the dynamic coastal processes are complicated, often with severe socio-economic consequences, making the correct decision is therefore of vital importance. As the authorities are formulating costal protection plans in Taiwan at the moment, coastal risks each region are facing should be clearly identified in the first place. Coastal protection sectors have been announced by CPAMI based on the severity level of coastal hazards, but the risks to coastal residents have yet to be assessed [31]. In this paper, we propose a scheme for a quick but informative risk assessment. It is based on the method of the United Nations Disaster Relief Organization [3], which uses both hazard and vulnerability indicators. It can be readily to be applied since the graded coastal hazard severities are used. In the process of formulating a coastal protection plan, if necessary, the vulnerability factors or weights can be altered according to the public interests. In this way, coastal management criteria will be formulated according to coastal risks. Both residents and authorities can be made aware of the risks of the area, and the officials can draw a prioritized list based on the criteria and make defense plans accordingly. Rational use of resources for adaptation or mitigation measures can be also be achieved.
Yunlin County, with its existing coastal defenses and the present status of land use, was used for the case study to test the proposed assessment principles of coastal management criteria. It was found that the risk class of the coastal areas in Yunlin County can be categorized as low-intermediate. The coastal hazards are comprised mainly of storm surge and ground subsidence. We then proposed implementation of both engineering and non-engineering measures to promote sustainable management of coastal zones, and to reduce the impact of coastal hazards.
Author Contributions
W.-P.H. designed the study and developed the methodology. J.-C.H. and C.-S.C. collected the data and analyzed the results. C.-J.Y. primarily made figures and tables of the manuscript.
Acknowledgments
This paper is partly aided by a project of the Ministry of Science and Technology, Taiwan, Project No. MOST 106-2621-M-019-003-MY2. Their support is deeply appreciated.
Conflicts of Interest
The authors declare no conflict of interest.
References
- Huang, W.P.; Chien, L.K.; Lee, L.H. Risk Maps and Coastal Defense Criteria in Taiwan. J. Mar. Sci. Technol. 2016, 24, 1105–1114. [Google Scholar]
- Chien, L.K.; Hsu, C.H.; Huang, W.P.; Wang, I.C. The Study of Designation of Coastal Protection Zone and Management in Taiwan. In Proceedings of the Twenty-Sixth International Ocean and Polar Engineering Conference, Rhodes, Greece, 26 June–2 July 2016; pp. 1287–1293. [Google Scholar]
- United Nations Disaster Relief Organization (UNDRO). Natural Disasters and Vulnerability Analysis; Report of Experts Group Meeting; UNDRO: Geneva, Switzerland, 1980. [Google Scholar]
- Chien, L.K.; Chiu, S.Y.; Tseng, W.C.; Hsu, C.H. The Study of Coastal Risk Assessment of Planning and Management for Coastal Area in Taiwan. In Proceedings of the Twenty-Second International Offshore and Polar Engineering Conference, Rhodes, Greece, 17–22 June 2012; pp. 17–22. [Google Scholar]
- McCarthy, M.A.; Possingham, H.P.; Day, J.R.; Tyre, A.J. Testing the accuracy of population viability analysis. Conserv. Biol. 2001, 15, 1030–1038. [Google Scholar] [CrossRef]
- Van der Veen, A.; Logtmeijer, C. Economic hotspots: Visualizing vulnerability to flooding. Natl. Hazards 2005, 36, 65–80. [Google Scholar] [CrossRef]
- Parkinson, R.W.; McCue, T. Assessing municipal vulnerability to predicted sea level rise: City of Satellite Beach, Florida. Clim. Chang. 2011, 107, 203–223. [Google Scholar] [CrossRef]
- Cutter, S.L. Vulnerability to environmental hazards, Progress in Human. Geography 1996, 20, 529–539. [Google Scholar]
- Khouakhi, A.; Snoussi, M.; Niazi, S.; Raji, O. Vulnerability assessment of Al Hoceima bay (Moroccan Mediterranean coast): A coastal management tool to reduce potential impacts of sea-level rise and storm surges. J. Coast. Res. 2013, 65, 968–973. [Google Scholar] [CrossRef]
- Özyurt, G.; Ergin, A. Improving coastal vulnerability assessments to sea-level rise: A new indicator based methodology for decision makers. J. Coast. Res. 2010, 26, 265–273. [Google Scholar] [CrossRef]
- Fitton, J.M.; Hansom, J.D.; Rennie, A.M. A national coastal erosion susceptibility model for Scotland. Ocean Coast. Manag. 2016, 132, 80–89. [Google Scholar] [CrossRef]
- Merlotto, A.; Bértola, G.R.; Poccolo, M.C. Hazard, vulnerability and coastal erosion risk assessment in Necochea Municipality, Buenos Aires Province, Argentina. J. Coast. Conserv. 2016, 20, 351–362. [Google Scholar] [CrossRef]
- Tarragoni, C.; Bellotti, P.; Davoli, L.; Raffi, R.; Palmieri, E.L. Assessment of coastal vulnerability to erosion: The case of Tiber River Delta (Tyrrhenian Sea, Central Italy), Italian. J. Eng. Geol. Environ. 2014, 14, 5–16. [Google Scholar]
- Schernewski, G.; Schönwald, S.; Kataržytė, M. Application and evaluation of an indicator set to measure and promote sustainable development in coastal areas. Ocean Coast. Manag. 2014, 101, 2–13. [Google Scholar] [CrossRef]
- Zanetti, V.B.; De Sousa Junior, W.C.; De Freitas, D.M. A Climate Change Vulnerability Index and Case Study in a Brazilian Coastal City. Sustainability 2016, 8, 811. [Google Scholar] [CrossRef]
- Hammar-Klose, E.S.; Thieler, E.R. Coastal Vulnerability to Sea Level Rise: A Preliminary Database for the U.S. Atlantic, Pacific, and Gulfof Mexico Coasts; U.S. Geological Survey Digital Data Series DDS-68 1CD-ROM; U.S. Geological Survey: Reston, VA, USA, 2001.
- Gornitz, V.M.; Daniels, R.C.; White, T.W.; Birdwell, K.R. The development of a coastal risk assessment database: Vulnerability to sea-level rise in the U.S. southeast. J. Coast. Res. 1994, 327–338. [Google Scholar]
- Shaw, J.; Taylor, R.B.; Forbes, D.L.; Ruz, M.H.; Solomon, S. Sensitivity of the Canadian Coast to Sea-Level Rise; Geological Survey of Canada Bulletin; Geological Survey of Canada Offices: Ottawa, ON, Canada, 1998.
- Cutter, S.L.; Boruff, B.J.; Shirley, W.L. Social Vulnerability to Environmental Hazards. Soc. Sci. 2003, 84, 242–261. [Google Scholar] [CrossRef]
- Wang, G.G.; Liu, Y.J.; Wang, H.B.; Wang, X.Y. A comprehensive risk analysis of coastal zones in China Estuarine. Coast. Shelf Sci. 2014, 140, 22–31. [Google Scholar] [CrossRef]
- United Nations Office for Disaster Risk Reduction (UNISDR). Living with Risk: A Global Review of Disaster Reduction Initiatives; United Nations Publication: Geneva, Switzerland, 2004. [Google Scholar]
- Chien, L.K.; Lei, R.J.; Chiu, S.Y.; Hung, L.J.; Lee, B.C. Coastal Vulnerability and Risk Assessment in Complex Disasters and Adaptation Strategies Exploration. In Proceedings of the Twenty-Third International Offshore and Polar Engineering Conference, Anchorage, AK, USA, 30 June–5 July 2013; pp. 617–624. [Google Scholar]
- Carrasco, A.R.; Ferreira, Ó.; Matias, A.; Freire, P. Flood hazard assessment and management of fetch-limited coastal environments. Ocean Coast. Manag. 2012, 65, 15–25. [Google Scholar] [CrossRef]
- Ward, T.J. The condition of Australia’s marine environment is good but in declined—An integrated evidence based national assessment by expert elicitation. Ocean Coast. Manag. 2014, 100, 86–100. [Google Scholar] [CrossRef]
- Van Vuren, S.; Kok, M.; Jorissen, R.E. Coastal Defence and Societal Activities in the Coastal Zone: Compatible or Conflicting Interests? J. Coast. Res. 2004, 20, 550–561. [Google Scholar] [CrossRef]
- Penning-Rowsell, E.C.; De Vries, W.S.; Parker, D.J.; Zanuttigh, B.; Simmonds, D.; Trifonova, E.; Hissel, F.; Monbaliu, J.; Lendzion, J.; Ohle, N.; et al. Innovation in coastal risk management: An exploratory analysis of risk governance issues at eight THESEUS study sites. Coast. Eng. 2014, 87, 210–217. [Google Scholar] [CrossRef]
- Dinh, Q.; Balica, S.; Popescu, I.; Jonoski, A. Climate change impact on flood hazard, vulnerability and risk of the Long Xuyen Quadrangle in the Mekong Delta. Int. J. River Basin Manag. 2012, 10, 103–120. [Google Scholar] [CrossRef]
- ESCAP/UNISDR. Reducing Vulnerability and Exposure to Disasters. The Asia-Pacific Disaster Report. 2012. Available online: http://www.unisdr.org/ (accessed on 1 June 2018).
- Luo, S.; Feng, C.; Liu, H.; Lei, G.; Qi, H.; Su, X. Adaptive measures adopted for risk reduction of coastal erosion in the People’s Republic of China. Ocean Coast. Manag. 2015, 103, 134–145. [Google Scholar] [CrossRef]
- Salik, K.M.; Jahangir, S.; Wu, Z.; Su, H. Climate change vulnerability and adaptation options for the coastal communities of Pakistan. Ocean Coast. Manag. 2015, 112, 61–73. [Google Scholar] [CrossRef]
- Construction and Planning Agency of the Ministry of the Interior (CPAMI). Integrated Coastal Zone Management Plan. 2017. Available online: https://www.cpami.gov.tw/%E6%9C%80%E6%96%B0%E6%B6%88%E6%81%AF/%E6%A5%AD%E5%8B%99%E6%96%B0%E8%A8%8A/18529-%E6%95%B4%E9%AB%94%E6%B5%B7%E5%B2%B8%E7%AE%A1%E7%90%86%E8%A8%88%E7%95%AB.html (accessed on 1 June 2018).
- Webster, P.J.; Holland, G.J.; Curry, J.A.; Chang, H.R. Changes in tropical cyclone number, duration, and Intensity in a warming environment. Science 2005, 309, 1844–1846. [Google Scholar] [CrossRef] [PubMed]
- Landsea, C.W.; Harper, B.A.; Hoarau, K.; Knaff, J.A. Can We Detect Trends in Extreme Tropical Cyclones? Science 2006, 313, 452–454. [Google Scholar] [CrossRef] [PubMed]
- Elsner, J.B.; Kossin, J.P.; Jagger, T.H. The increasing intensity of the strongest tropical cyclones. Nature 2008, 455, 92–95. [Google Scholar] [CrossRef] [PubMed]
- Lan, Y.J.; Hsu, T.W.; Lin, Y.C.; Huang, C.J. An Adaptation Due to Climate Change in Southwest Coast of Taiwan. Coast. Manag. 2013, 41, 172–189. [Google Scholar] [CrossRef]
- Central Weather Bureau (CWB). Available online: http://scweb.cwb.gov.tw/Twenty.aspx?ItemId=4&loc=tw (accessed on 1 June 2018).
- Chen, G.Y.; Chen, Y.Y. Tsunami Affected Area and Flooding Possibility on the Coast of Taiwan; Institute of Transportation Ministry of Transportation and Communications: Taichung, Taiwan, 2011.
- Kontar, Y.A.; Korotenko, K.A.; Santiago-Fandiño, V. Chapter 2 in Tsunami events and lessons learned: Environmental and societal significance. In Assessment and Modeling of Dispersal Contamination Incoming with Submarine Groundwater Discharge (SGD) in Tsunami Affected Coastal Areas; Springer: Dordrecht, The Netherlands, 2014; pp. 55–88. [Google Scholar]
- Lin, S.C.; Wu, T.R.; Yen, E.; Chen, H.Y.; Hsu, J.; Tsai, Y.L.; Lee, C.J.; Liu, P.L.F. Development of a tsunami early warning system for the South China Sea. Ocean Eng. 2015, 100, 1–18. [Google Scholar] [CrossRef]
- Wu, T.R.; Huang, H.C. Modeling Tsunami Hazards from Manila Trench to Taiwan. J. Asia Earth Sci. 2009, 36, 21–28. [Google Scholar] [CrossRef]
- Wu, B.R.; Ke, S.S.; Wu, T.R.; Liu, K.S. Tsunami Inundation Map and its Application on Evacuation Planning in Taiwan. J. Earthq. Tsunami 2015, 9, 1540004-1–1540004-8. [Google Scholar] [CrossRef]
- Chien, L.K.; Tseng, W.C.; Chiu, S.Y.; Hsu, C.H.; Huang, W.P. Coastal vulnerability applied on prevention and management under climate change impact. Adv. Mater. Res. 2012, 356–360, 791–800. [Google Scholar] [CrossRef]
- National Science and Technology Center for Disaster Reduction (NCDR). 2015. Available online: http://satis.ncdr.nat.gov.tw/Dmap/102Catalog-Map.aspx (accessed on 1 June 2018).
- Water Resources Planning Institute. The Assessment on Coastal Protection of Sea Dikes; Water Resources Agency, Ministry of Economic Affairs: Taichung, Taiwan, 2014. (In Chinese)
- Water Hazard Mitigation Center. Flood Disaster Prevention Plan. 2014. Available online: http://www.dprc.ncku.edu.tw/download/index2.html (accessed on 1 June 2018).
- Water Resource Agency. Severe Land Subsidence Area in Taiwan. 2014. Available online: http://gic.wra.gov.tw/gic/HomePage/Index.aspx (accessed on 1 June 2018).
- Church, J.A.; Clark, P.U.; Cazenave, A.; Gregory, J.M.; Jevrejeva, S.; Levermann, A.; Merrifield, M.A.; Milne, G.A.; Nerem, R.S.; Nunn, P.D.; et al. Sea Level Change. In Climate Change 2013: The Physical Science Basis. Contribution of Working Group I to the Fifth Assessment Report of the Intergovernmental Panel on Climate Change; Cambridge University Press: Cambridge, UK; New York, NY, USA, 2013. [Google Scholar]
Figure 1.
Distribution of hazard prone areas, and first- and second-level coastal protection areas.

Figure 2.
Population density and comprehensive income within coastal areas.

Figure 3.
Procedure and framework for coastal risk assessment.

Figure 4.
GIS layers of the coastal hazard-prone areas in Yunlin County, consisting of (a) surge, (b) flood, (c) erosion, (d) ground subsidence, and (e) tsunami prone area layers.
Figure 4.
GIS layers of the coastal hazard-prone areas in Yunlin County, consisting of (a) surge, (b) flood, (c) erosion, (d) ground subsidence, and (e) tsunami prone area layers.

Figure 5.
Hazard grading of the coastal villages in Yunlin County.

Figure 6.
Vulnerability grading of the coastal villages in Yunlin County.

Figure 7.
Risk classes of the coastal areas in Yunlin County.


Table 1.
Grading of coastal protection areas.
| Coastal Hazard | High Potential | Medium Potential | Zoning Principle | |
|---|---|---|---|---|
| First-Grade | Second-Grade | |||
| Storm surge | Shore land areas with an elevation lower than the level of a 50-year storm surge height, and a flooding depth of 1 m or more | Shore land areas with an elevation lower than the level of a 50-year storm surge height, and a flooding depth of less than 1 m |
| Coastal sectors with one or more medium potential compound hazards. |
| Coastal erosion | Shore land areas identified as susceptible to coastal erosion and its possible effects within 10 years | Shore land areas identified as susceptible to coastal erosion and its possible effects within 10–30 years | ||
| Flood | Shore land areas within the range of a 50-year flood, and with a flooding depth of 1 m or more | Shore land areas within the range of a 50-year flood, and with a flooding depth between 0.5–1 m | ||
| Ground subsidence | Areas that encounter severe ground subsidence, as determined by the Water Resources Agency | - | ||
Table 2.
Classification of hazard factors and CVI.
| Hazard Factor Grading | Cvi Grading | ||||
|---|---|---|---|---|---|
| Score | Hazard Type | Hazard Potential 1 | Population Density | Comprehensive Income | Land Use |
| 5 | 5 types of hazards | 66–100% | 80–100% | 80–100% | Residential, commercial, educational, and medical areas |
| 4 | 4 types of hazards | - | 60–80% | 60–80% | Industry, port activity, and public infrastructure areas |
| 3 | 3 types of hazards | 33–66% | 40–60% | 40–60% | Productive area (agriculture, aquaculture, and livestock breeding) |
| 2 | 2 types of hazards | - | 20–40% | 20–40% | Non-productive areas (mining, salt, sandstone, funerary, artificial lakes and channels) |
| 1 | Single hazard | 0–33% | 0–20% | 0–20% | Natural areas |
| 0 | No hazard | - | - | - | - |
1 Hazard potential is defined as ratio of the hazard-prone area to shore land area.
Table 3.
Grading of risk levels and coastal protection design criteria.
| Risk Levels | Coastal Protection Structural Design Criteria | Protection Design Criteria for Land Use Management | |||||
|---|---|---|---|---|---|---|---|
| Coastal Structural Protection Facilities | Residential Areas or Crucial Social and Economic Areas | Industrial Land | Public Evacuation Facilities | Agriculture, Fishery, and Animal Husbandry | Nonproductive Land | ||
| High | Level A | 100-year return period | ≤25 | - | |||
| High intermediate | Level B | 50–100 year return period. | |||||
| Moderate | Level C | 50-year return period | |||||
| Low intermediate | Level D | 25–50 year return period. | |||||
| Low | Level E | 25-year return period | |||||
| Minimal | Level F | - | |||||
| Considering factor | Wave and storm surge level | Storm surge level and regional flood potential | |||||
Table 4.
Risk level assessment and suggested design criteria in Yunlin County.
| Coastal Administrative Division | Risk Assessment | Suggested Design Criteria (Return Period) | Protection Facility |
|---|---|---|---|
| Mailiao Township: | C, D | 25–50 | Hoanliao seawall |
| Houan Village | |||
| Haifeng Village | |||
| Taixi Township: | C, D | 25–50 | Xinxing Tidal Land seawall Taisi Tidal Land seawall Haikou seawall Haixin seawall |
| Wengang Village | |||
| Hefeng Village | |||
| Wugang Village | |||
| Haikou Village | |||
| Xiding Village | |||
| Sihu Township: | C, D | 25–50 | Lincuoliao seawall Santiaolun seawall Boziliao seawall |
| Lincuo Village | |||
| Lunbei Village | |||
| Guanggou Village | |||
| Bozi Village | |||
| Kouhu Township: | C, D, E | 25–50 | Xialun seawall Yanchoucuo seawall Qinghan seawall Xingang seawall Taizi Village seawall |
| Xialun Village | |||
| Qinghan Village | |||
| Gangxi Village | |||
| Taizi Village |
Table 5.
Assessment of coastal defenses in Yunlin County.
| Protection Facility | Constructed Year | Design Height (m) | Surveyed Height (m) (2012) | Subsidence Rate (m/year) 3 | Run-Up Height (m) | |
|---|---|---|---|---|---|---|
| 25-Year Return Period | 50-Year Return Period | |||||
| Hoanliao seawall | 2000 | 6.50 | 6.16 | 0.03 | 1 | |
| Taixi tide barrier | 2004 | 5.00 | 4.68 | 0.05 | 2.98 | 3.59 |
| Haikou seawall | 1994 | 6.00 | 4.42 | 0.10 | 2.55 | 2.64 2 |
| Xinxing tide barrier | 1996 | 6.00 | 4.39 | 0.11 | 2.55 | 2.64 2 |
| Lincuoliao sea-wall | 1997 | 6.50 | 5.85 | 0.41 | 2.55 | 2.64 2 |
| Santiaolun seawall | 2010 | 5.50 | 5.41 | 0.04 | 3.25 | 3.70 |
| Boziliao seawall | 1998 | 6.50 | 5.89 | 0.05 | 3.51 | 4.00 |
| Xialun seawall | 2000 | 6.50 | 5.78 | 0.07 | 3.28 | 3.75 |
| Yanchoucuo seawall | 1996 | 6.50 | 5.58 | 0.07 | 2.55 | 2.64 2 |
| Qinghan seawall | 1993 | 5.00 | 4.06 | 0.05 | 2.55 | 2.64 2 |
| Xingang seawall | 1998 | 6.50 | 6.00 | 0.04 | 2.55 | 2.64 2 |
| Taizi Village seawall | 1999 | 6.50 | 5.99 | 0.05 | 3.58 | 4.00 |
1 Due to land reclamation, this seawall was located inland and was not subjected to any marine force. 2 The seawall did not face the sea directly; the effect of waves can be neglected and assessed by the design surge height. 3 It was estimated from the elevation change of the control points that set on the crest of sea wall. The subsidence rates are the average values from 2007 to 2012 except Santiaolun seawall from 2010 to 2012 [44].
© 2018 by the authors. Licensee MDPI, Basel, Switzerland. This article is an open access article distributed under the terms and conditions of the Creative Commons Attribution (CC BY) license (http://creativecommons.org/licenses/by/4.0/).
Share and Cite
MDPI and ACS Style
Huang, W.-P.; Hsu, J.-C.; Chen, C.-S.; Ye, C.-J. The Study of the Coastal Management Criteria Based on Risk Assessmeant: A Case Study on Yunlin Coast, Taiwan. Water 2018, 10, 988. https://doi.org/10.3390/w10080988
AMA Style
Huang W-P, Hsu J-C, Chen C-S, Ye C-J. The Study of the Coastal Management Criteria Based on Risk Assessmeant: A Case Study on Yunlin Coast, Taiwan. Water. 2018; 10(8):988. https://doi.org/10.3390/w10080988
Chicago/Turabian StyleHuang, Wei-Po, Jui-Chan Hsu, Chun-Shen Chen, and Chun-Jhen Ye. 2018. "The Study of the Coastal Management Criteria Based on Risk Assessmeant: A Case Study on Yunlin Coast, Taiwan" Water 10, no. 8: 988. https://doi.org/10.3390/w10080988
Note that from the first issue of 2016, this journal uses article numbers instead of page numbers. See further details here.