Spatiotemporal Variability in Extreme Precipitation in China from Observations and Projections
by
 , , ,
, , ,
Yifeng Peng
1,2 ,
,
Xiang Zhao
1,2,*,
Donghai Wu
3,
Bijian Tang
4,
Peipei Xu
5,
Xiaozheng Du
1,2 and
Haoyu Wang
1,2 1
State Key Laboratory of Remote Sensing Science, Jointly Sponsored by Beijing Normal University and Institute of Remote Sensing and Digital Earth of Chinese Academy of Sciences, Beijing 100875, China
2
Beijing Engineering Research Center for Global Land Remote Sensing Products, Institute of Remote Sensing Science and Engineering, Faculty of Geographical Science, Beijing Normal University, Beijing 100875, China
3
College of Urban and Environmental Sciences, Peking University, Beijing 100871, China
4
Division of Environment and Sustainability, The Hong Kong University of Science and Technology, Kowloon 999077, Hong Kong, China
5
State Key Laboratory of Earth Surface Processes and Resource Ecology, Faculty of Geographical Science, Beijing Normal University, Beijing 100875, China
*
Author to whom correspondence should be addressed.
Water 2018, 10(8), 1089; https://doi.org/10.3390/w10081089
Submission received: 9 July 2018
/
Revised: 12 August 2018
/
Accepted: 13 August 2018
/
Published: 16 August 2018
(This article belongs to the Section Hydrology)
Abstract
:Extreme precipitation events, which have intensified with global warming over the past several decades, will become more intense in the future according to model projections. Although many studies have been performed, the occurrence patterns for extreme precipitation events in past and future periods in China remain unresolved. Additionally, few studies have explained how extreme precipitation events developed over the past 58 years and how they will evolve in the next 90 years as global warming becomes much more serious. In this paper, we evaluated the spatiotemporal characteristics of extreme precipitation events using indices for the frequency, quantity, intensity, and proportion of extreme precipitation, which were proposed by the World Meteorological Organization. We simultaneously analyzed the spatiotemporal characteristics of extreme precipitation in China from 2011 to 2100 using data obtained from the Coupled Model Intercomparison Project Phase 5 (CMIP5) models. Despite the fixed threshold, 95th percentile precipitation values were also used as the extreme precipitation threshold to reduce the influence of various rainfall events caused by different geographic locations; then, eight extreme precipitation indices (EPIs) were calculated to evaluate extreme precipitation in China. We found that the spatial characteristics of the eight EPIs exhibited downward trends from south to north. In the periods 1960–2017 and 2011–2100, trends in the EPIs were positive, but there were differences between different regions. In the past 58 years, the extreme precipitation increased in the northwest, southeast, and the Tibet Plateau of China, while decreased in northern China. Almost all the trends of EPIs are positive in the next two periods (2011–2055 and 2056–2100) except for some EPIs, such as intensity of extreme precipitation, which decrease in southeastern China in the second period (2056–2100). This study suggests that the frequency of extreme precipitation events in China will progressively increase, which implies that a substantial burden will be placed on social economies and terrestrial ecological processes.
1. Introduction
In the context of global warming, the occurrences of extreme weather events and their trends have become the focus of most climate change studies. The probability of heavy rainfall throughout most areas of the world has increased [1], and the total amount of extreme precipitation has increased significantly since the 1950s [2,3], with the largest changes occurring in the tropics [4]. The frequency and intensity of extreme precipitation will show similar upward trends as the global climate continues to warm [5,6,7], the changes in precipitation will enhance differences between arid and humid areas [8,9], and the effects of extreme precipitation may further increase this discrepancy. At the intercontinental scale, the variation characteristics of extreme precipitation are also different. Since the late 1960s, heavy precipitation in North America has shown an upward trend [10]. The trend for extreme precipitation in South American regions is consistent with the overall precipitation trend [11], and heavy precipitation in African regions has shown a downward trend since the middle of the last century [12]. Similarly, extreme precipitation events in the western Indian region have also shown a downward trend [13]. Compared to the background of past climate change, future global warming will likely cause the frequency and intensity of regional extreme precipitation to continue to increase. Although it has been generally accepted that precipitation in subtropical regions will decrease due to future climate change [14], global extreme precipitation will increase in the current warming climate [15].
China is a typical area that has been seriously affected by extreme precipitation. From the 1960s to 1980s, the total precipitation in China exhibited an upward trend and a downward trend after the 1980s; the frequency and intensity of extreme precipitation events have shown upward trends with an increase in heavy rain events across the country [16,17]. At the regional scale, the amount and frequency of annual extreme precipitation have shown downward spatial variation trends from southeast to northwest [18]; both the frequency and the amount have increased in southwestern, northwestern, and eastern China and decreased in central, northern, and northeastern China [16], while no significant trends occurred during 1960–2013 in Loess Plateau [19]. The patterns of extreme precipitation are associated with the enhanced water vapor supply related to the strengthened monsoon flow over southeastern China and the anomalous easterlies over northwestern China [18]. Changes in extreme precipitation will have a significant impact on the economy and ecology of China, and their uncertainties will increase with future climate change scenarios; thus, assessing the spatial and temporal patterns of extreme precipitation in China is important.
Due to the intermittent nature of precipitation events and their discontinuity over time and space, most studies have analyzed extreme precipitation over a small scale, and few studies have expanded their study regions to a national scale (i.e., China). Over the last 30 years, the temperature in China has increased significantly; the current rate of warming, which has induced the fastest heating period over the last 100 years, is twice as fast as the rate of warming 30 years ago [20]. Additionally, the patterns of extreme precipitation over the past 58 years and for the future in China are still unclear under rapid global warming scenarios. Most studies prefer to use climate modeling to analyze extreme precipitation, but there are several uncertainties in climate modeling such as coarse spatial resolution, simple physical processes, and parameterization.
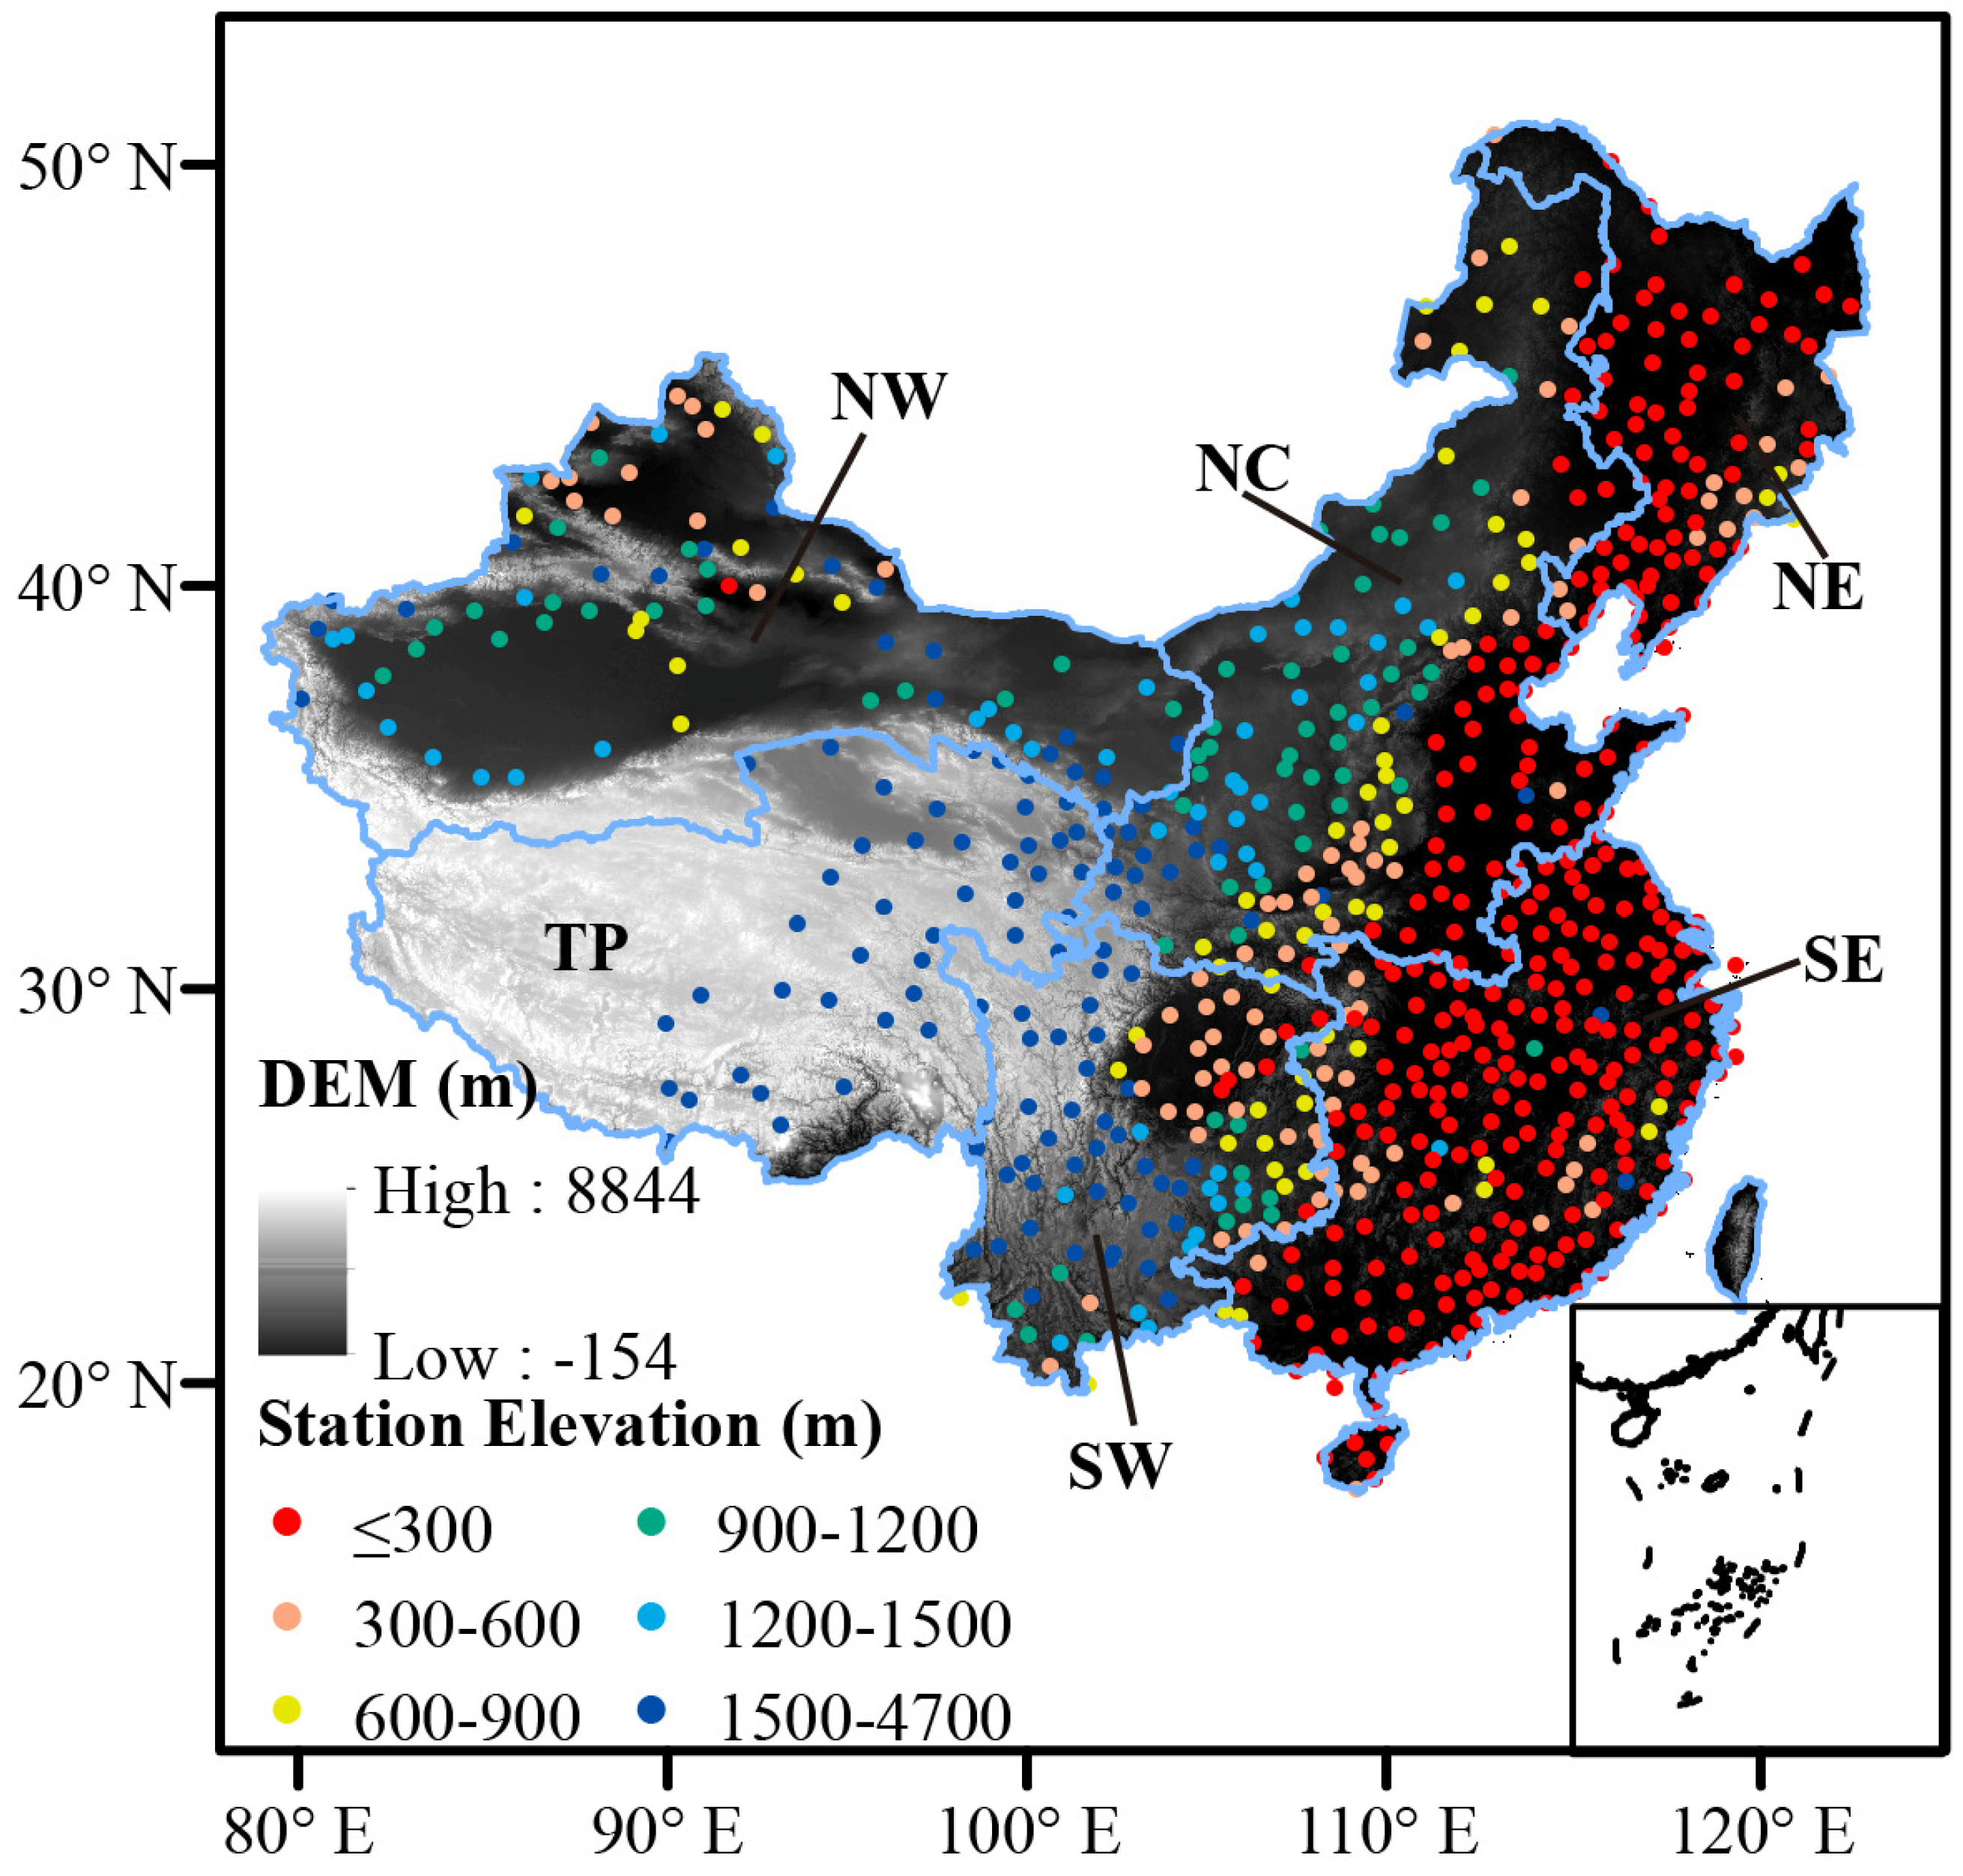
To understand how extreme precipitation changed in the past six decades and to predict how it will change in the next nine decades more accurately, we used observations dataset and projection datasets to evaluate the temporal and spatial patterns of extreme precipitation during two periods (1960–2017 and 2011–2100). Then, zonal statistics were preformed to further analyze the regional variations in extreme precipitation in the six regions in China (Figure 1). Finally, the temporal and spatial variations in extreme precipitation in China over the past 58 years and for the next 90 years were discussed.
2. Materials and Methodology
2.1. Study Area
In this study, China was chosen as the study area. There are big differences in annual precipitation from the southeast to the northwest in China, along with big changes in elevation. Plateaus, basins, plains, and hills are distributed all over China due to the big changes of elevations. The precipitation in China is easily affected by the winter and summer monsoon and topography, which result in the remarkable change in annual precipitation, from less than 25 mm in the remote northwestern China to more than 2000 mm in southeast China [21]. For these differences, six regions were classified according to the annual precipitation and the provincial administrative boundary in our study (Figure 1).
2.2. Data
The observed daily precipitation data used in this paper were in situ observations provided by the China Meteorological Administration (CMA) meteorological stations, which were used to analyze the phenomenon of extreme precipitation in China from 1960 to 2017. The site data were derived from a ground climate dataset from the China Meteorological Administration Meteorological Data Center (http://data.cma.cn/site/index.html). The CMA dataset is the best daily dataset currently available for studying climate change in the country [21], which contains historical observations that have been collected from 824 sites in China since 1951 with a daily temporal resolution [22].
The simulation precipitation datasets from five models (Table 1).of the Intergovernmental Panel on Climate Change (IPCC) Fifth Assessment Report (AR5) CMIP5 [23] were used to analyze the changes in extreme precipitation in China from 2011 to 2100 The data we used included historical simulation results (1960–2005) and future climate projections (2006–2100) in the Representative Concentration Pathway (RCP) 8.5 scenario; for the convenience of comparison and statistics, all the models data were interpolated onto a common 1.5° × 2.5° grid using the nearest neighbor method. The RCP scenario that are usually utilized are RCP 2.6, RCP 4.5, and RCP 8.5 [24,25,26,27]. Each RCP scenario makes a different assumption for greenhouse gas concentrations and other factors that affect the Earth’s climate system [28]. Extensive details on the RCPs can be found in Moss et al. [29] and Van Vuuren et al. [30], and the RCP 8.5 we utilized in our study served as a high emission scenario, which can better present the climatic conditions in the future in the context of global warming. Considering the uncertainties in the simulation data, the period from 1960 to 2005 was selected as the contrast group to build a correction model to correct the systematic deviation.
2.3. Methodology
To ensure the continuity and validity of these meteorological station data, we first checked and retained stations where the sum of the missing observation days and the observation anomalies, such as negative value and outliers [31,32], were less than 10% of the total observation days in a year [21,33]. It was important to detect the outliers in the observations because the incorrect values due to erroneous transcriptions of the daily data could be identified by the relationship between the outliers and the maximum values of the daily precipitation in the observations [31,34]. Then, to control the quality of the data strictly, we removed the stations missing observations for more than 10 consecutive days in the rainy season (i.e., April to September) [35,36]. Finally, 743 valid sites were used in this study. For each selected site, the missing values were replaced by the average valid precipitation of two days before and after the missing values. For simulated data, we extracted the regions of China with the boundary of China and calculated EPIs using grids during the periods 1960–2005 and 2006–2100.
In this study, eight extreme precipitation indices (Table 2) were calculated using both fixed and percentile thresholds. These indicators have been widely used for extreme precipitation studies and were developed by the World Meteorological Organization, the Climatological Commission, and the Climate Change and Forecasting Program Recommendations [37,38,39,40,41]. The method for defining percentile thresholds in our paper was as follows: first, we sorted the precipitation values that were greater than 1 mm from smallest to largest; then, the 75%, 95%, and 99% quantiles for precipitation were used to calculate the thresholds for extreme precipitation. To select the most suitable threshold to evaluate the extreme precipitation events in China, a comparison between the three quantiles and fixed threshold of moderate rain, heavy rain, and rainstorm was applied. Finally, the 95th percentile was used. The R10, R20, and R50 were defined as the number of rainy days when the precipitation was greater than 10 mm, 20 mm, and 50 mm, respectively; the R95d was defined as the number of rainy days when the precipitation was greater than the threshold; the R95p was defined as the total rainfall during extreme days; and the R95pT was calculated as the ratio of the R95p to the total precipitation on rainy days. We defined the AEPI to describe the absolute intensity of extreme precipitation, which is the ratio of R95p to R95d.
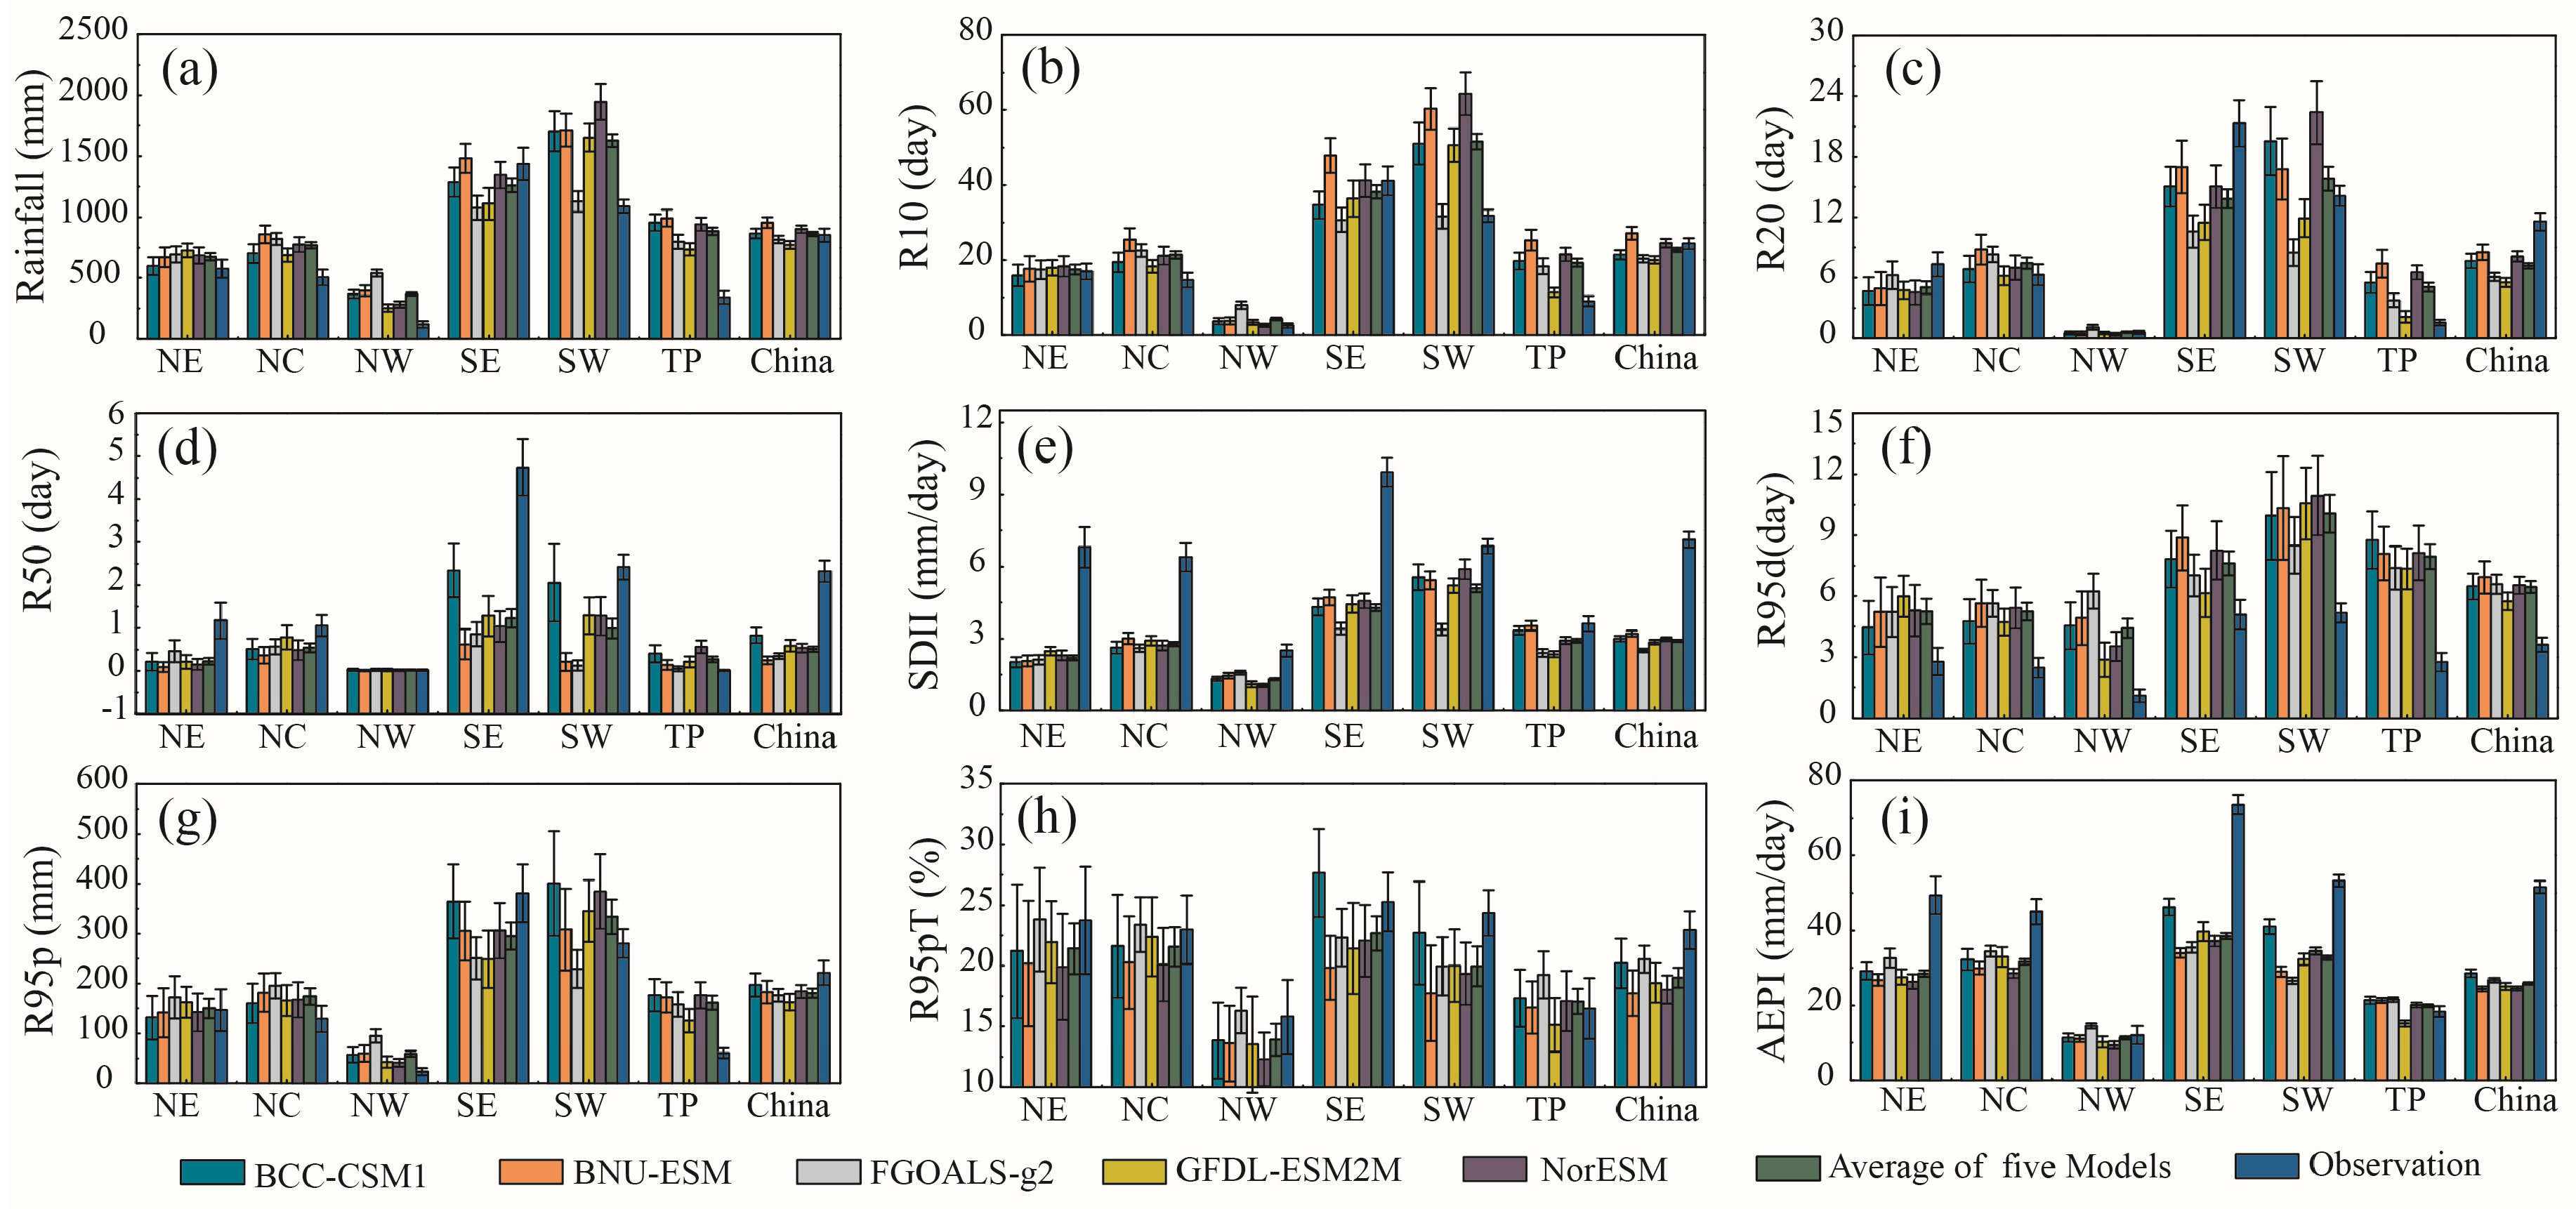
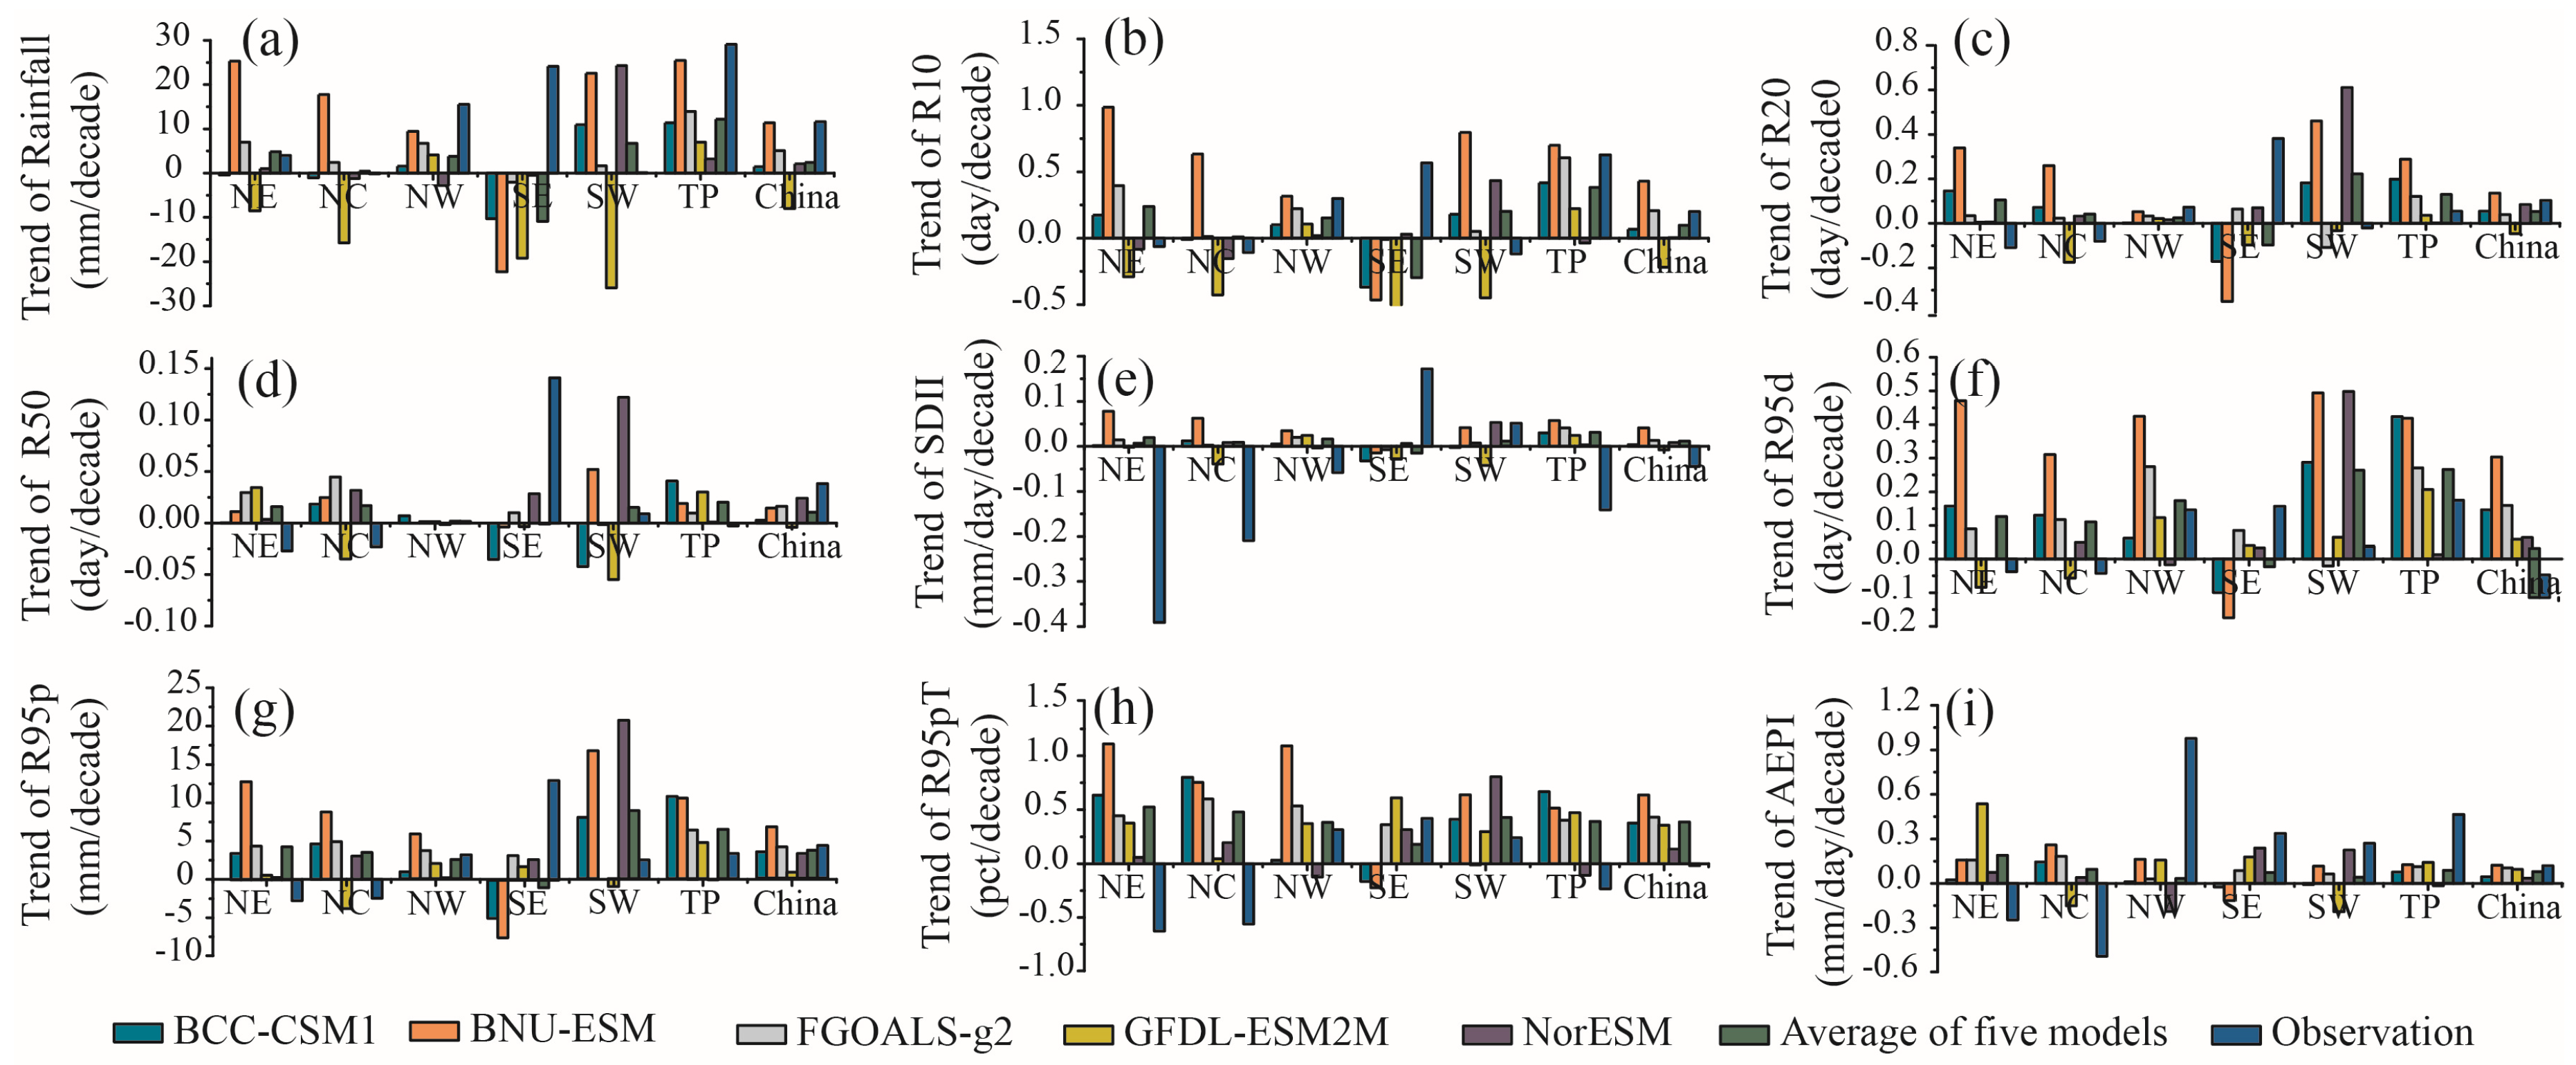
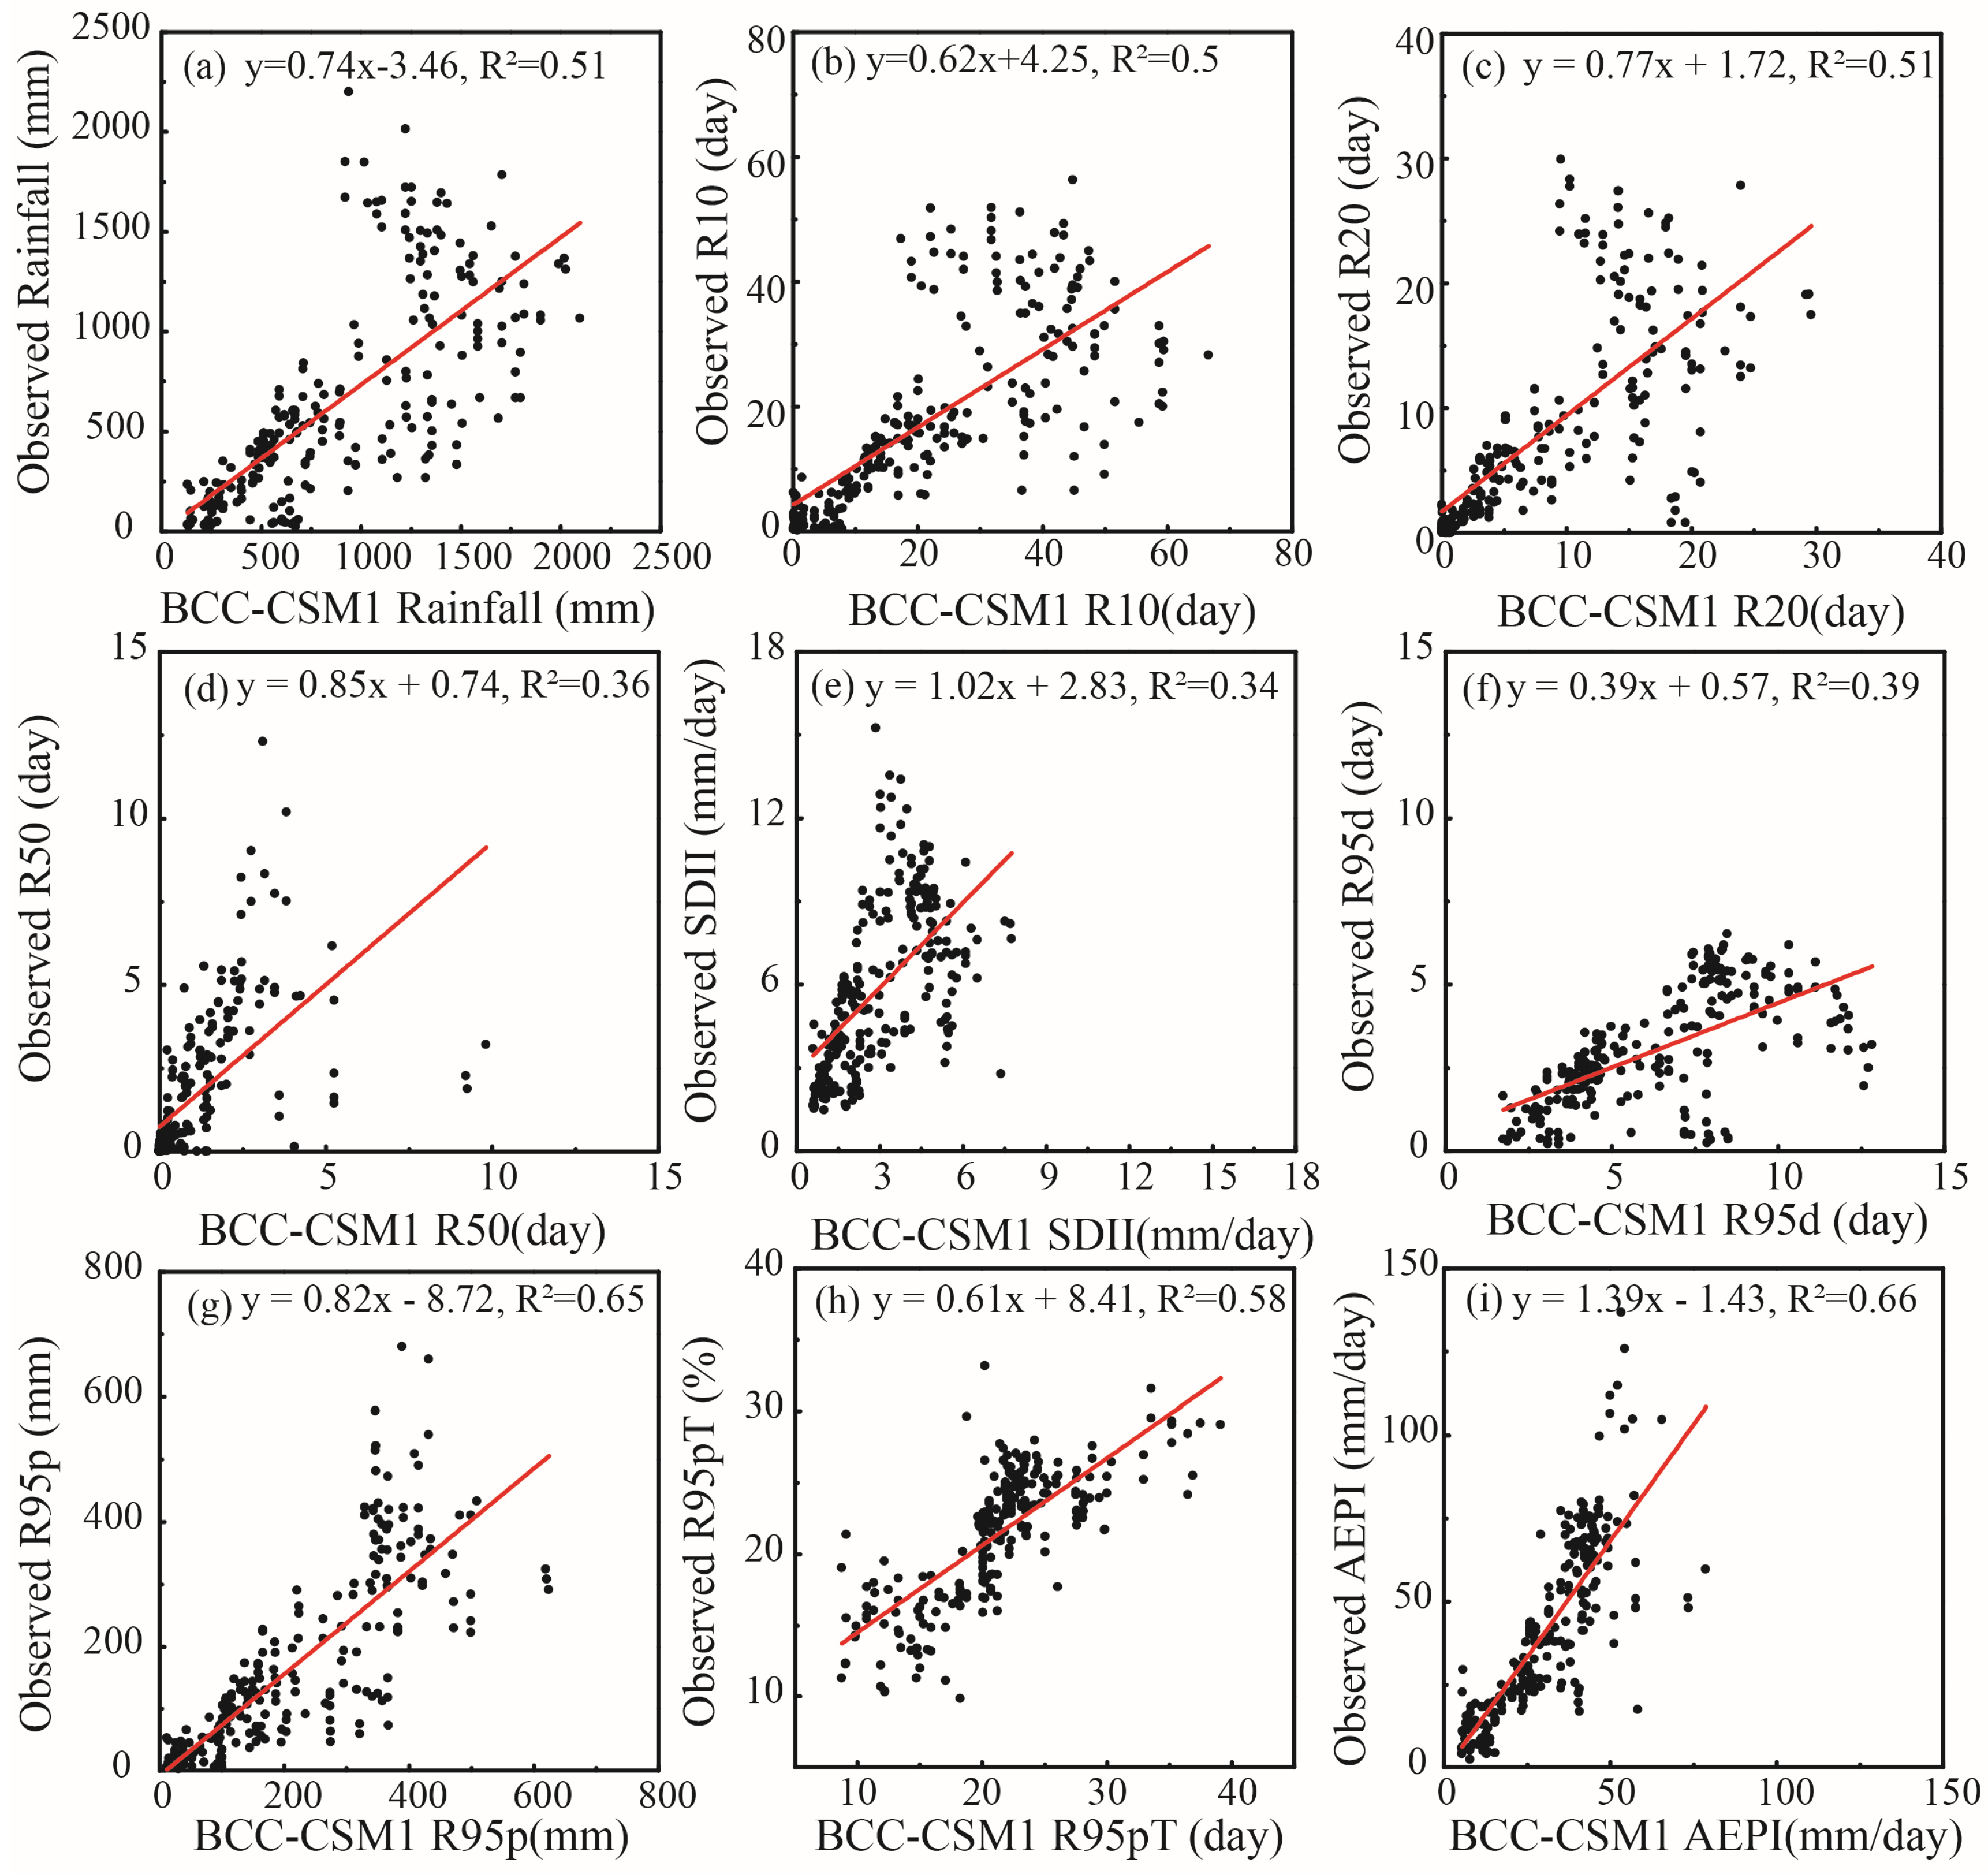
Because the CMIP5 simulation dataset could not estimate the rainy days and precipitation accurately in China [42], and there were some differences in the representations of the EPIs in China calculated by the six simulations (five CMIP5 models and the average of five model) and observations from 1960 to 2005 (Figure A1 and Figure A2), it is necessary to select an optimal model to evaluate the extreme precipitation in China. Figure A1 shows that there were slight differences among the projections in the EPIs across the whole region of China, and they were underestimated by R20, R50, SDII, and AEPI. Larger differences existed among the trends of the EPIs between the projections and observations (Figure A2). In terms of the six regions, the differences in the indices among the six models in the NE, NC, SW, and SE regions were larger than those in the other regions. To analyze future extreme precipitation in China accurately, we calculated the Pearson correlation coefficient (Table A1) and the RMSE (Table A2) between the simulations and observations from 1960 to 2005, and selected the optimal model with the largest R and smallest RMSE to evaluate future extreme precipitation in China. Then the BCC-ESM1-1 model was chosen to evaluate the extreme precipitation in China in the next 90 years. Finally, a systematic correction was performed for each of the EPIs using the comparison expression between the CMA and the model extreme precipitation indices (Figure A3). In addition, to be consistent with the observation time scale, we divided the projected dataset into two even 45-year periods (i.e., 2011 to 2055 and 2056 to 2100).
To analyze the trends in extreme precipitation in China during the periods from 1960–2017 and 2011–2100, ordinary least squares regression was used to linearly fit the eight EPIs. A Mann–Kendall test [43,44] was performed to detect whether the linear trends were significant at the 90% significance level. Although there has always been controversy regarding the significance test [45,46], it is still widely used in atmospheric and hydrologic research [47,48]. What is more, the Mann–Kendall (M–K) test has been widely used in detecting the trends in hydrologic data [49,50], due to its advantage in assessing the significance of variables that do not have normal distribution characteristics [51,52]. Thus, the M–K test was utilized here to study the inter-annual trends in extreme precipitation for each station and grid and if the p-value of the trend was lower than 0.1, then we thought it was statistically significant.
3. Results
3.1. Spatial Patterns for Extreme Precipitation
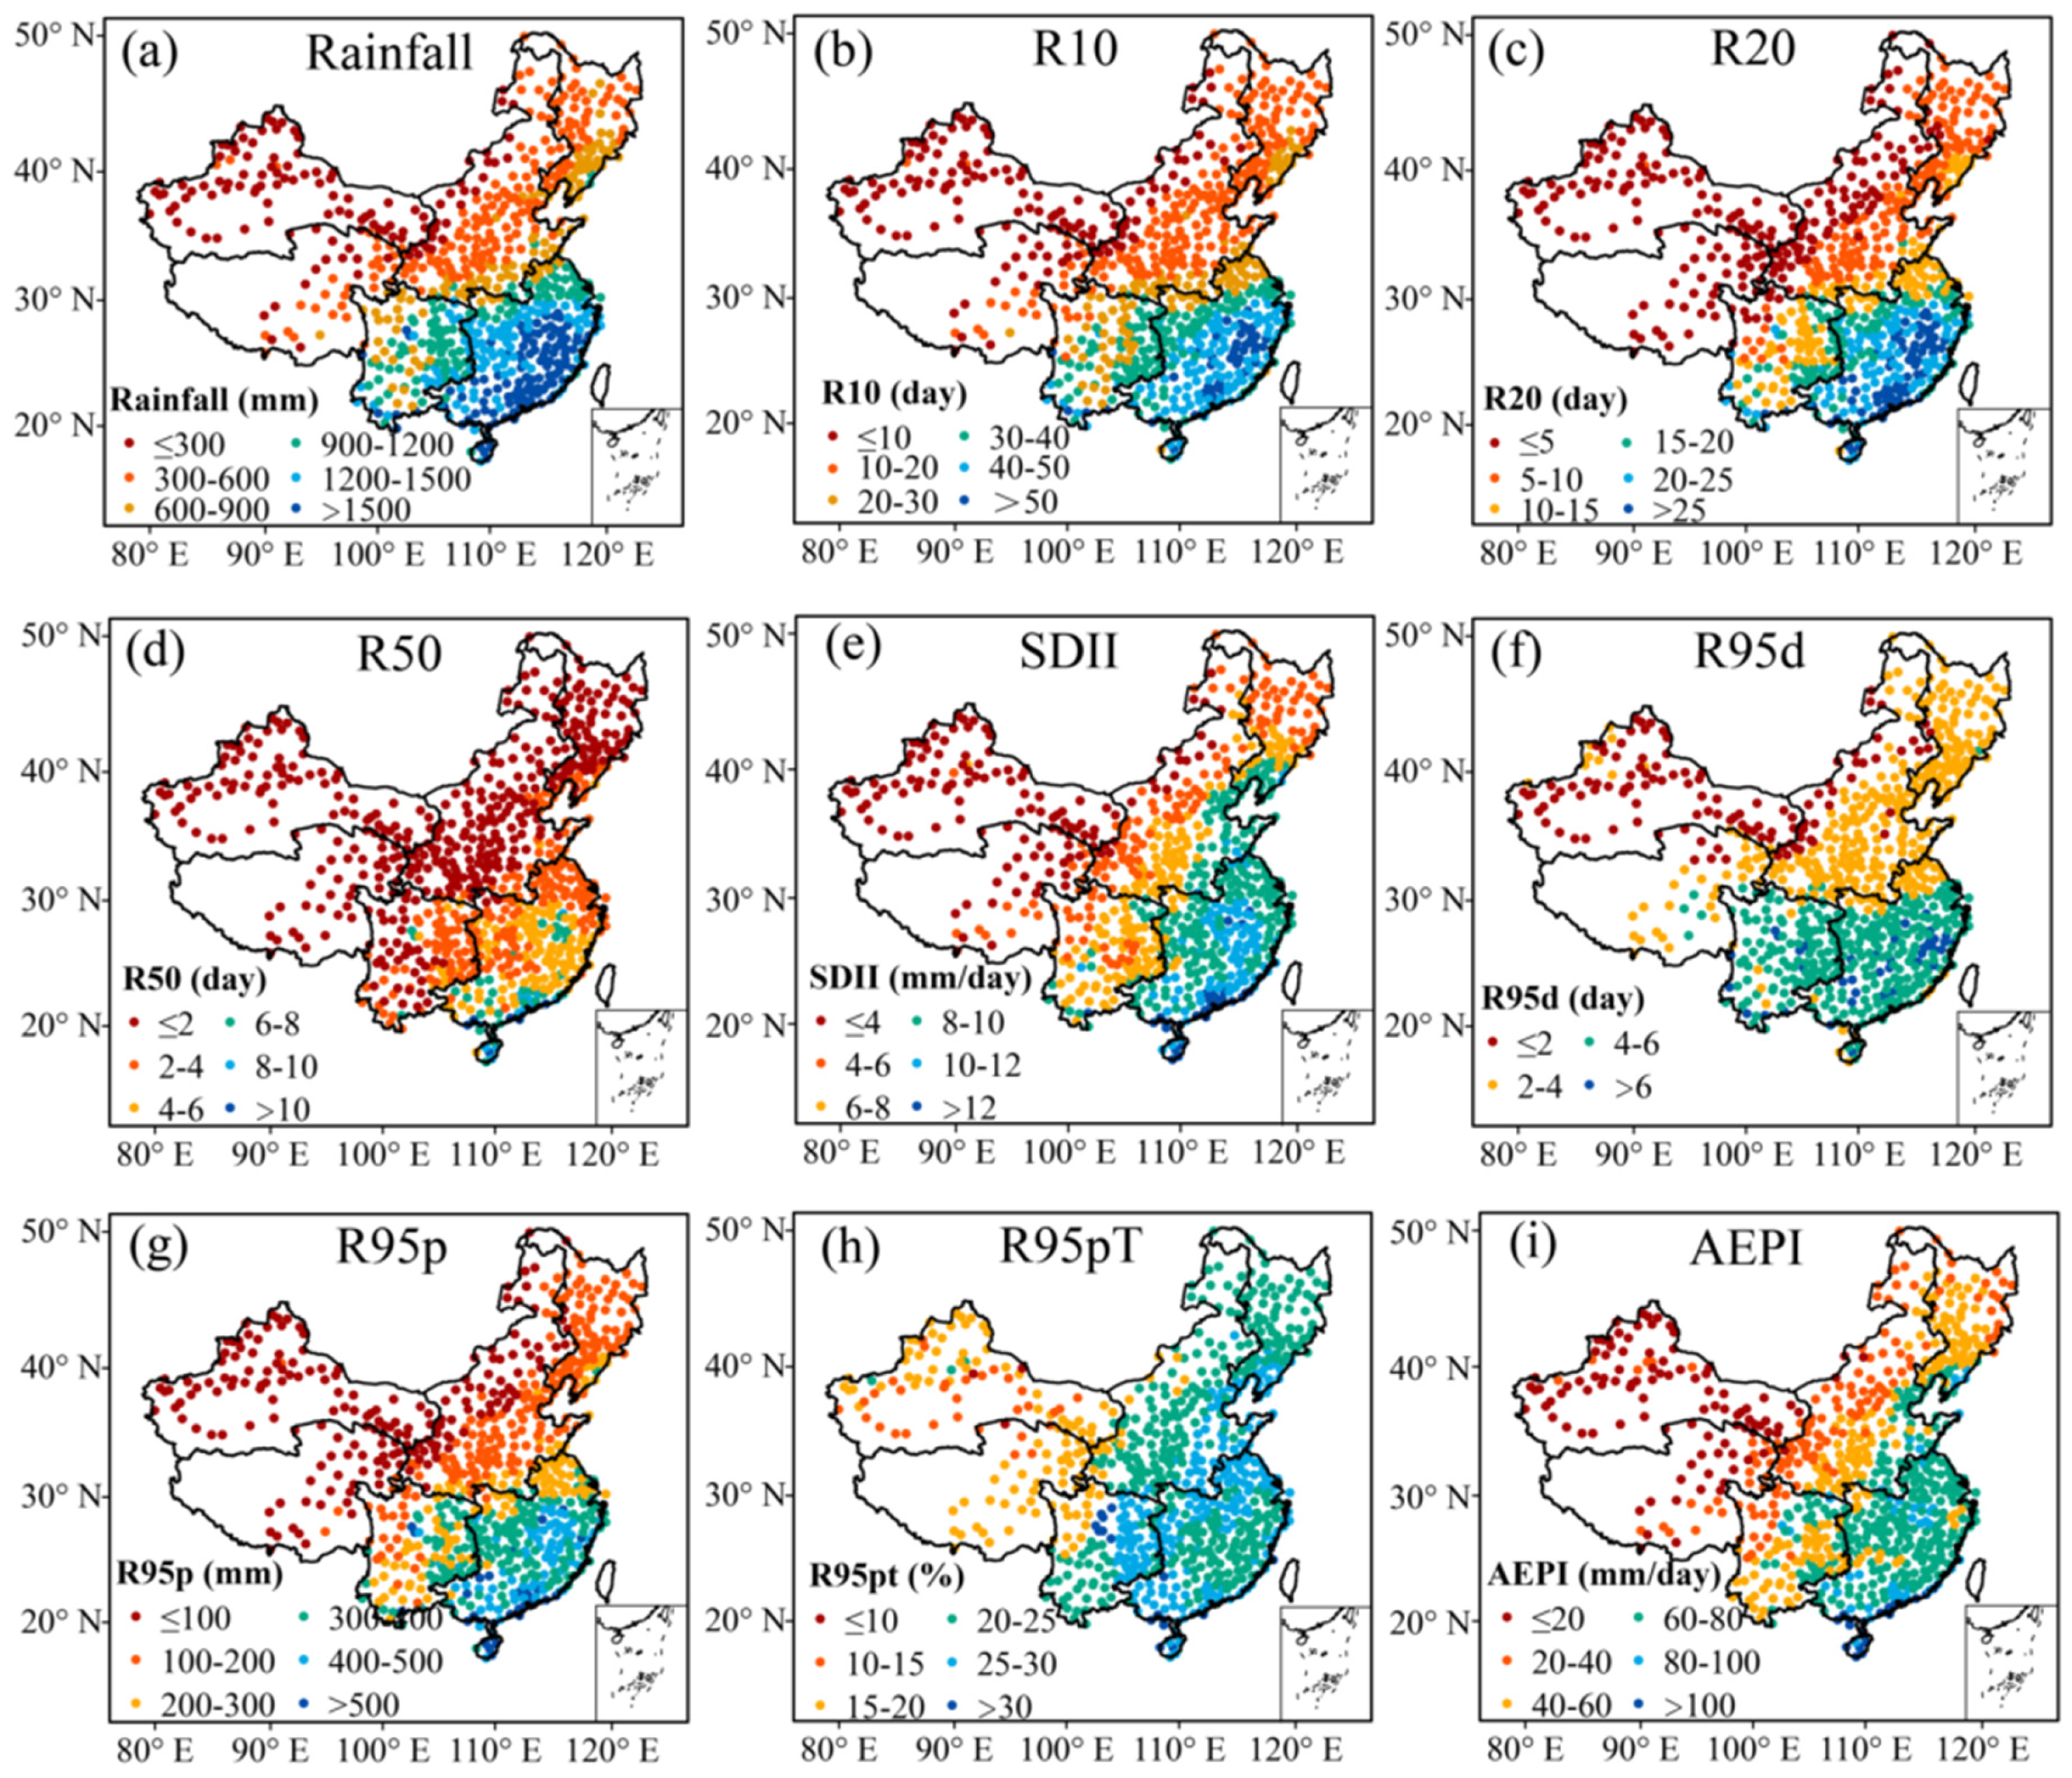
Figure 2 shows the spatial distribution of eight average EPIs and average rainfall in China from 1960 to 2017. EPIs and rainfall in China can be seen to decrease from south to north. Rainfall (Figure 2a) in the SE and SW regions were mainly more than 900 mm, while less than 600 mm in the NC, NW, and TP regions. The values of R10 and R20 (Figure 2b,c) had similar distributions; that is, the events with daily precipitation greater than 10 mm and 20 mm were concentrated in the SE region, with more than 30 and 15 days per year, respectively. Meanwhile, the R50 values (Figure 2d) lay mainly in the south of the SE region. R95d values (Figure 2f) in the SE and SW regions were primarily greater than 4 days, while those in the NC, NE and TP regions were mainly less than 4 days. The R95p index (Figure 2g) also varied greatly from south to north; extreme rainfall in most of the SE and SW were greater than 200 mm, while that in the NC and TP were less than 200 mm; the R95pT index values (Figure 2h) in the NE, SE, SW, and eastern NC regions were greater than 20%, among which the R95pT was greater than 30% in the southernmost part of the SE region and the middle of the SW region. Our results indicate that the AEPI (Figure 2i) in China exhibited obvious geographic differences similar to those of the normal intensity of the precipitation index SDII (Figure 2e), but the values of AEPI were much greater than the values of SDII. The average values of the AEPI were primarily greater than 60 mm/day in the SE, northeastern SW, southeastern NC, and the southern NE regions, while the values in other areas were less than 60 mm/day.
In general, the spatial pattern of extreme precipitation in China showed obvious north-south differentiation, which is similar to the distribution of topography of China (Figure 1). Furthermore, the values of almost all EPIs, except for AEPI, were highest in the SE region and lowest in NW region (Table 3), meaning that extreme precipitation events in the SE region were the most serious events and the NW region had the least serious events in the past 58 years; that said, it should not be ignored that the AEPI was the highest in the NC region (AEPI = 44.89 mm/day). However, there are other differences among the eight EPIs calculated here, in addition to this north-south differentiation. The greater number of extreme precipitation events were observed with larger R95p in the SE region, but the AEPI was smaller than that in the southernmost SE means that although the number of extreme precipitation events observed in the southernmost SE was relatively small, the AEPI was very high when extreme precipitation appeared (i.e., greater than 100 mm/day), and the R95pT was relatively high (more than 25%). For the northeastern part of the SE region and the eastern part of the SW region, although the extreme precipitation days and extreme precipitation amounts were relatively small, more than 25% of the rainfall in these regions occurred during extreme precipitation.
3.2. Temporal Changes in Extreme Precipitation
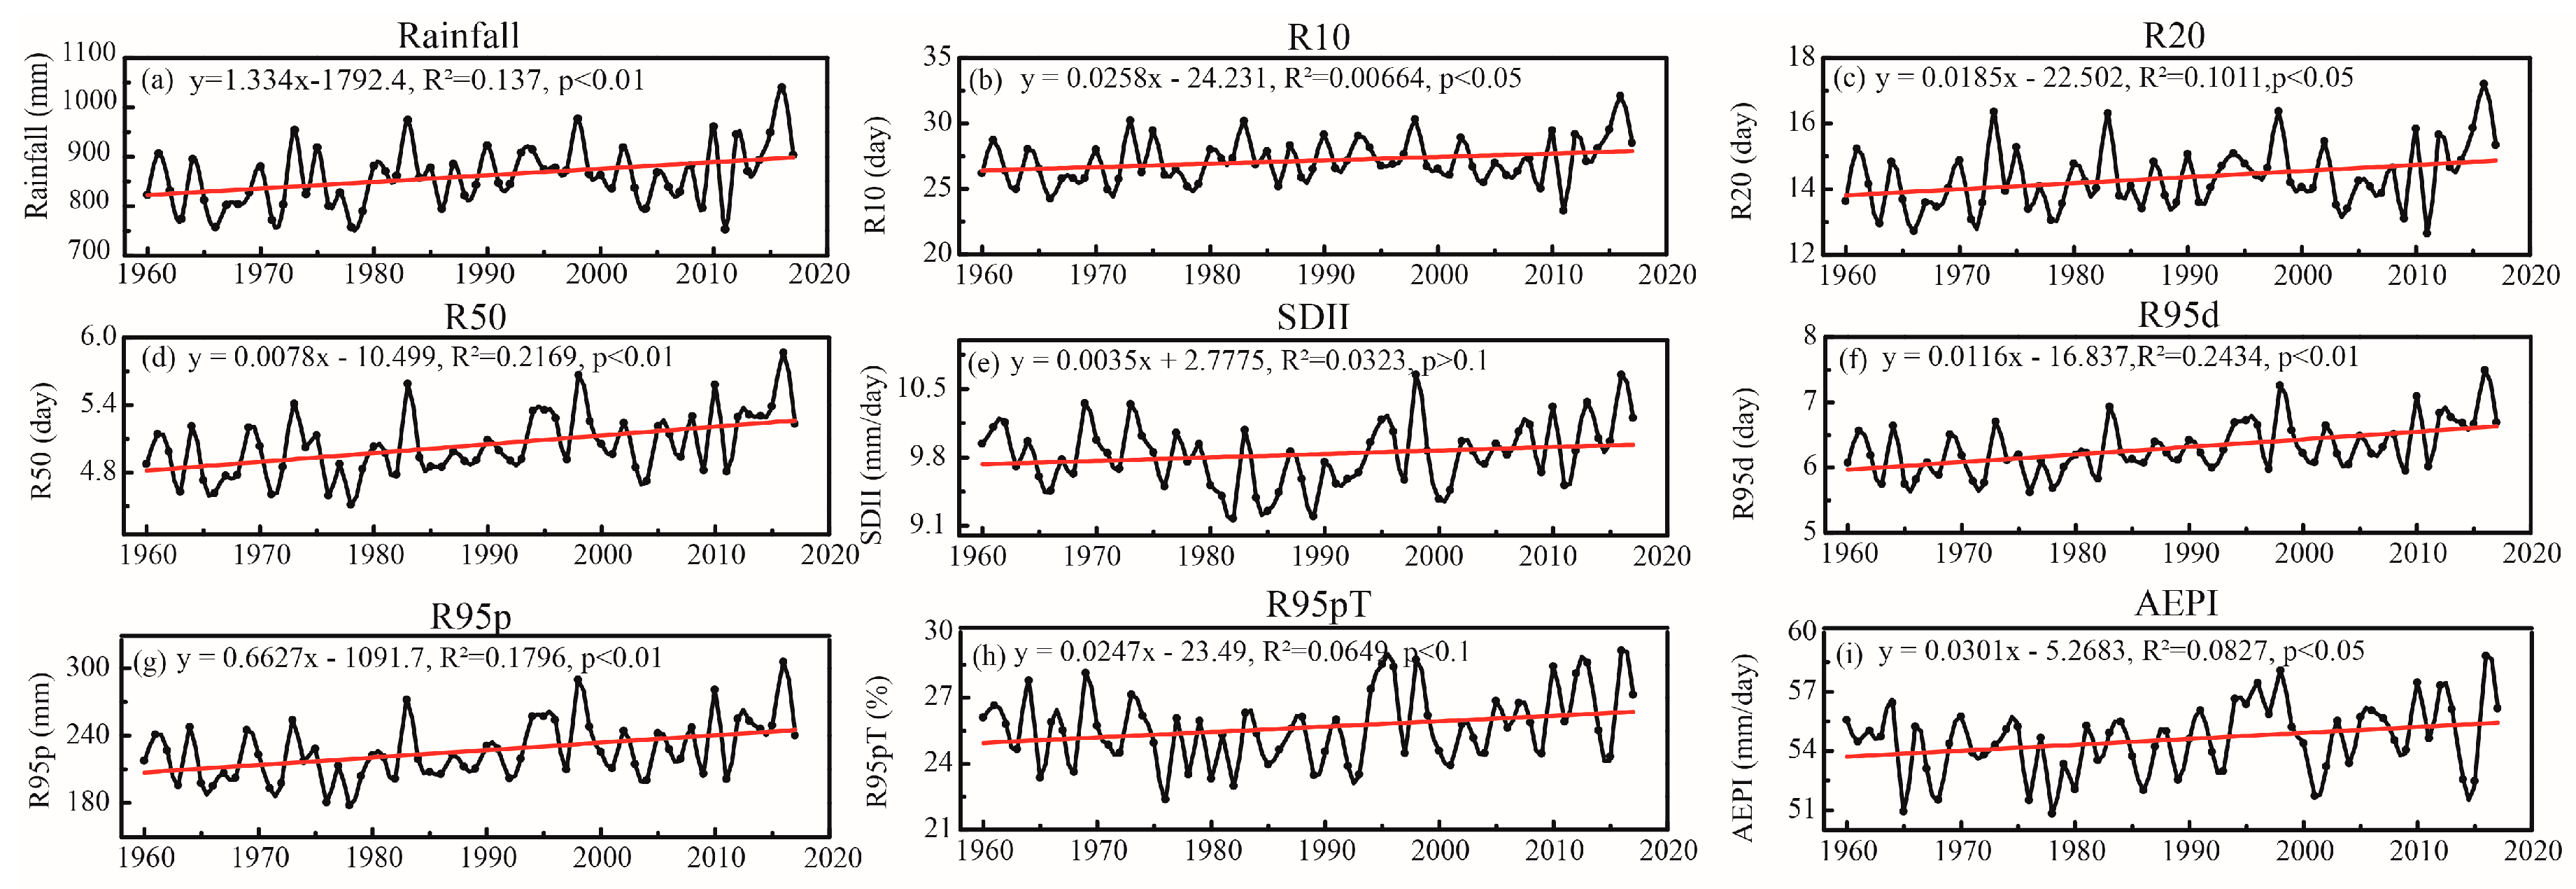
The rainfall in China has been increasing since 1950, and there was a turning point in approximately 1980, before which the precipitation in China exhibited an upward trend and after which, a downward trend [16]. Though all EPIs calculated in our study have shown some fluctuations since 1960, they all exhibit weak upward trends (Figure 3). Among them, R10, R20, R50, and R95d significantly increased by 0.026 day/year (p < 0.05), 0.018 day/year (p < 0.05), 0.008 day/year (p < 0.01), and 0.012 day/year (p < 0.01), respectively. The average R95p in a year was greater than 150 mm, accounting for more than 21% of the annual rainfall, and increased with a trend of 0.66 mm/year (p < 0.01); the R95pT increased with a trend of 0.025% per year. Although the SDII basically remained unchanged between 9 and 10 mm/year, the AEPI increased with an annual trend of 0.03 mm/day/year (p < 0.05).
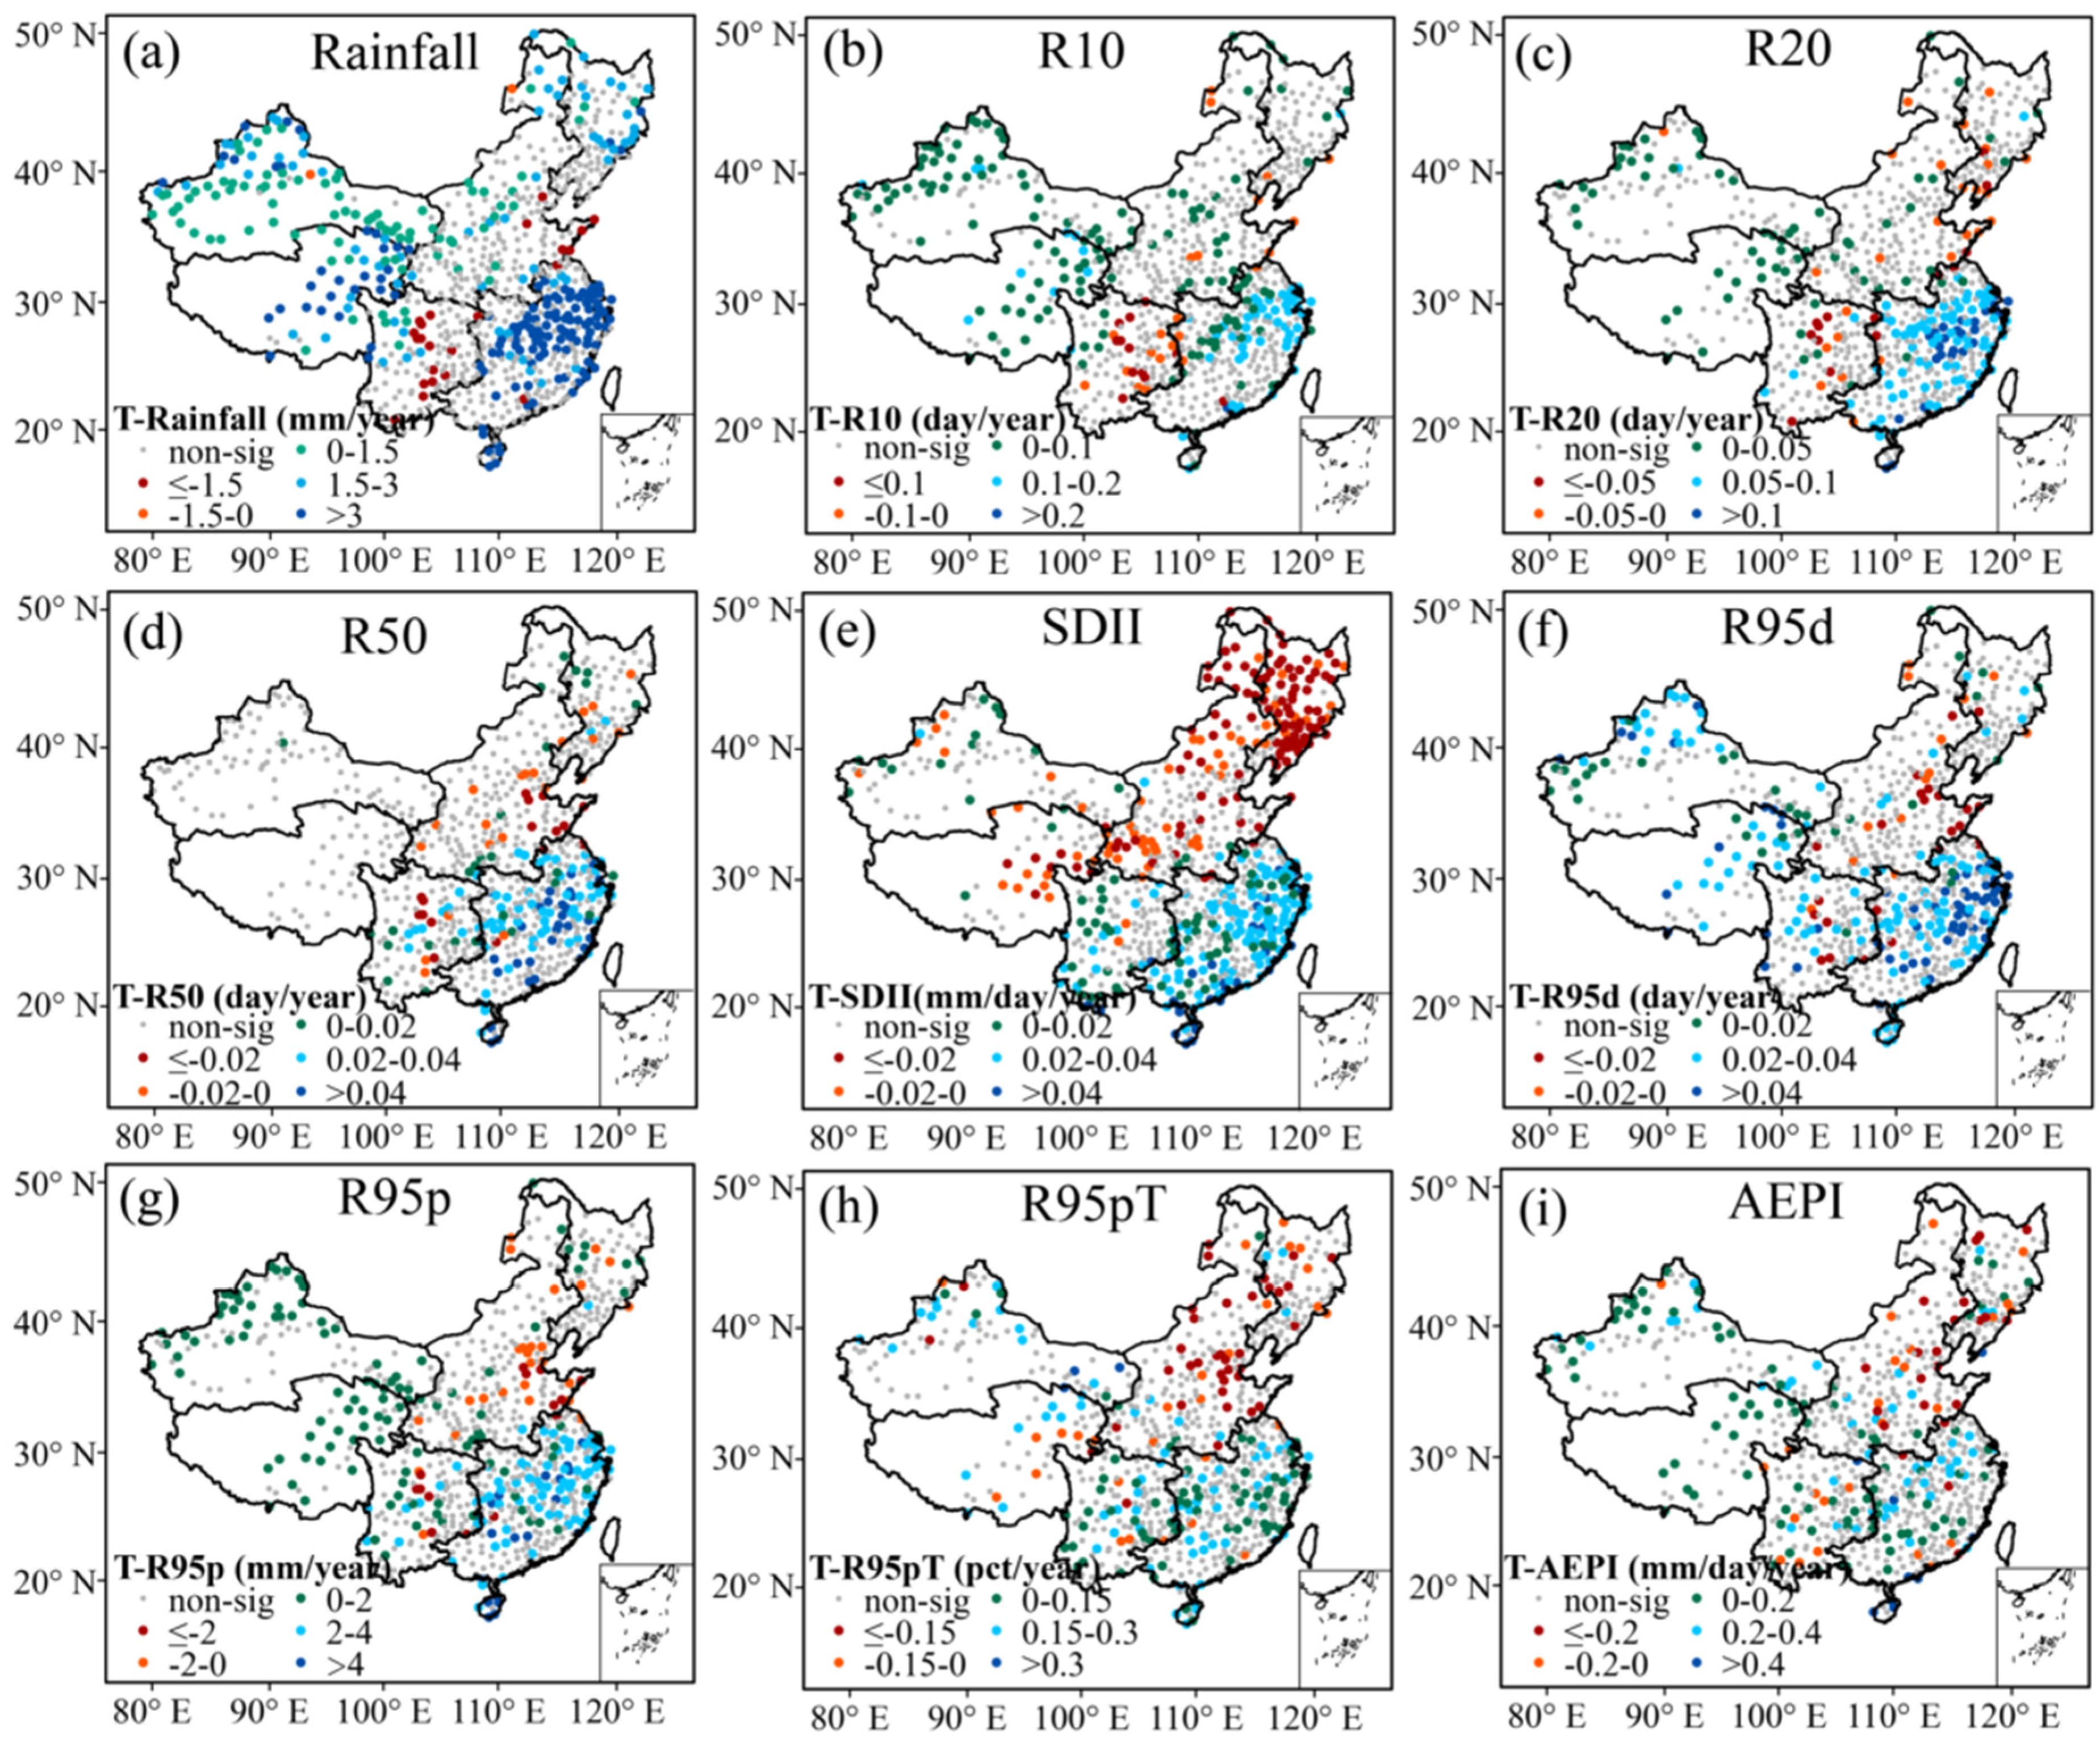
Though the EPIs increased in the whole region of China during the past 58 years, there were differences vary amongst different regions over the past six decades. It can be seen from Figure 4 that the spatial pattern of trends in rainfall and eight EPIs were similar in spatial distribution in the six regions, and the trends in majority of stations were positive in SE, NW, and TP regions, while there were some differences in the NE, NC, and SW regions. For the rainfall, R10 and R20, these three EPIs significantly decreased in the SW region, while they increased in the SE, NW, NC, and TP regions (Table 3), and the proportion for significant negative stations to all stations were 1.88%, 2.56%, and 1.48% (Table A3), respectively. For the SDII, it decreased in almost all northern and western regions (i.e., NE, NC, NW, and TP) and with a more obviously decreasing trend in the NE region, which were less than −0.02 mm/day/year. The proportion of the significant negative stations in the NE, NC, and NW were 5.25%, 3.63%, and 0.27% respectively. The trends of R95d, R95p, R95pT, and AEPI in the majority sites in the TP and NW regions were positive, while they were negative in the NC region. The stations with significant trends of R50 mainly located in the SE, SW, NC, and NE regions, and the significant trends in the SE and SW regions were mainly positive, and increased by more than 0.02 day/year, while the significant trends were negative in the NE and NC regions.
In general, although the average EPIs for the whole China region have showed an upward trend in the past 58 years, there are different increasing and decreasing trends in the six major regions of China (Table 4). Rainfall, R10, and R20 showed downward trends in the SW region, while the other six EPIs show a significant positive trend; although SDII decreased in the NE, NC, NW, and TP regions, the trends were non-significant, but it was significant and positive in the SE and SW regions. The trends of R50 were significant only in the SE and SW regions. The trends of R95d, R95p, R95pT, and AEPI decreased in the NC region, while they only had significant trends in the SE, SW, and TP regions. From these results, it can be found that there were wide differences between the trends of EPIs calculated with the fixed threshold (i.e., 10 mm, 20 mm, and 50 mm) and that were calculated by the percentile thresholds at the regional scale.
3.3. Projection of Extreme Precipitation Changes from 2011 to 2100
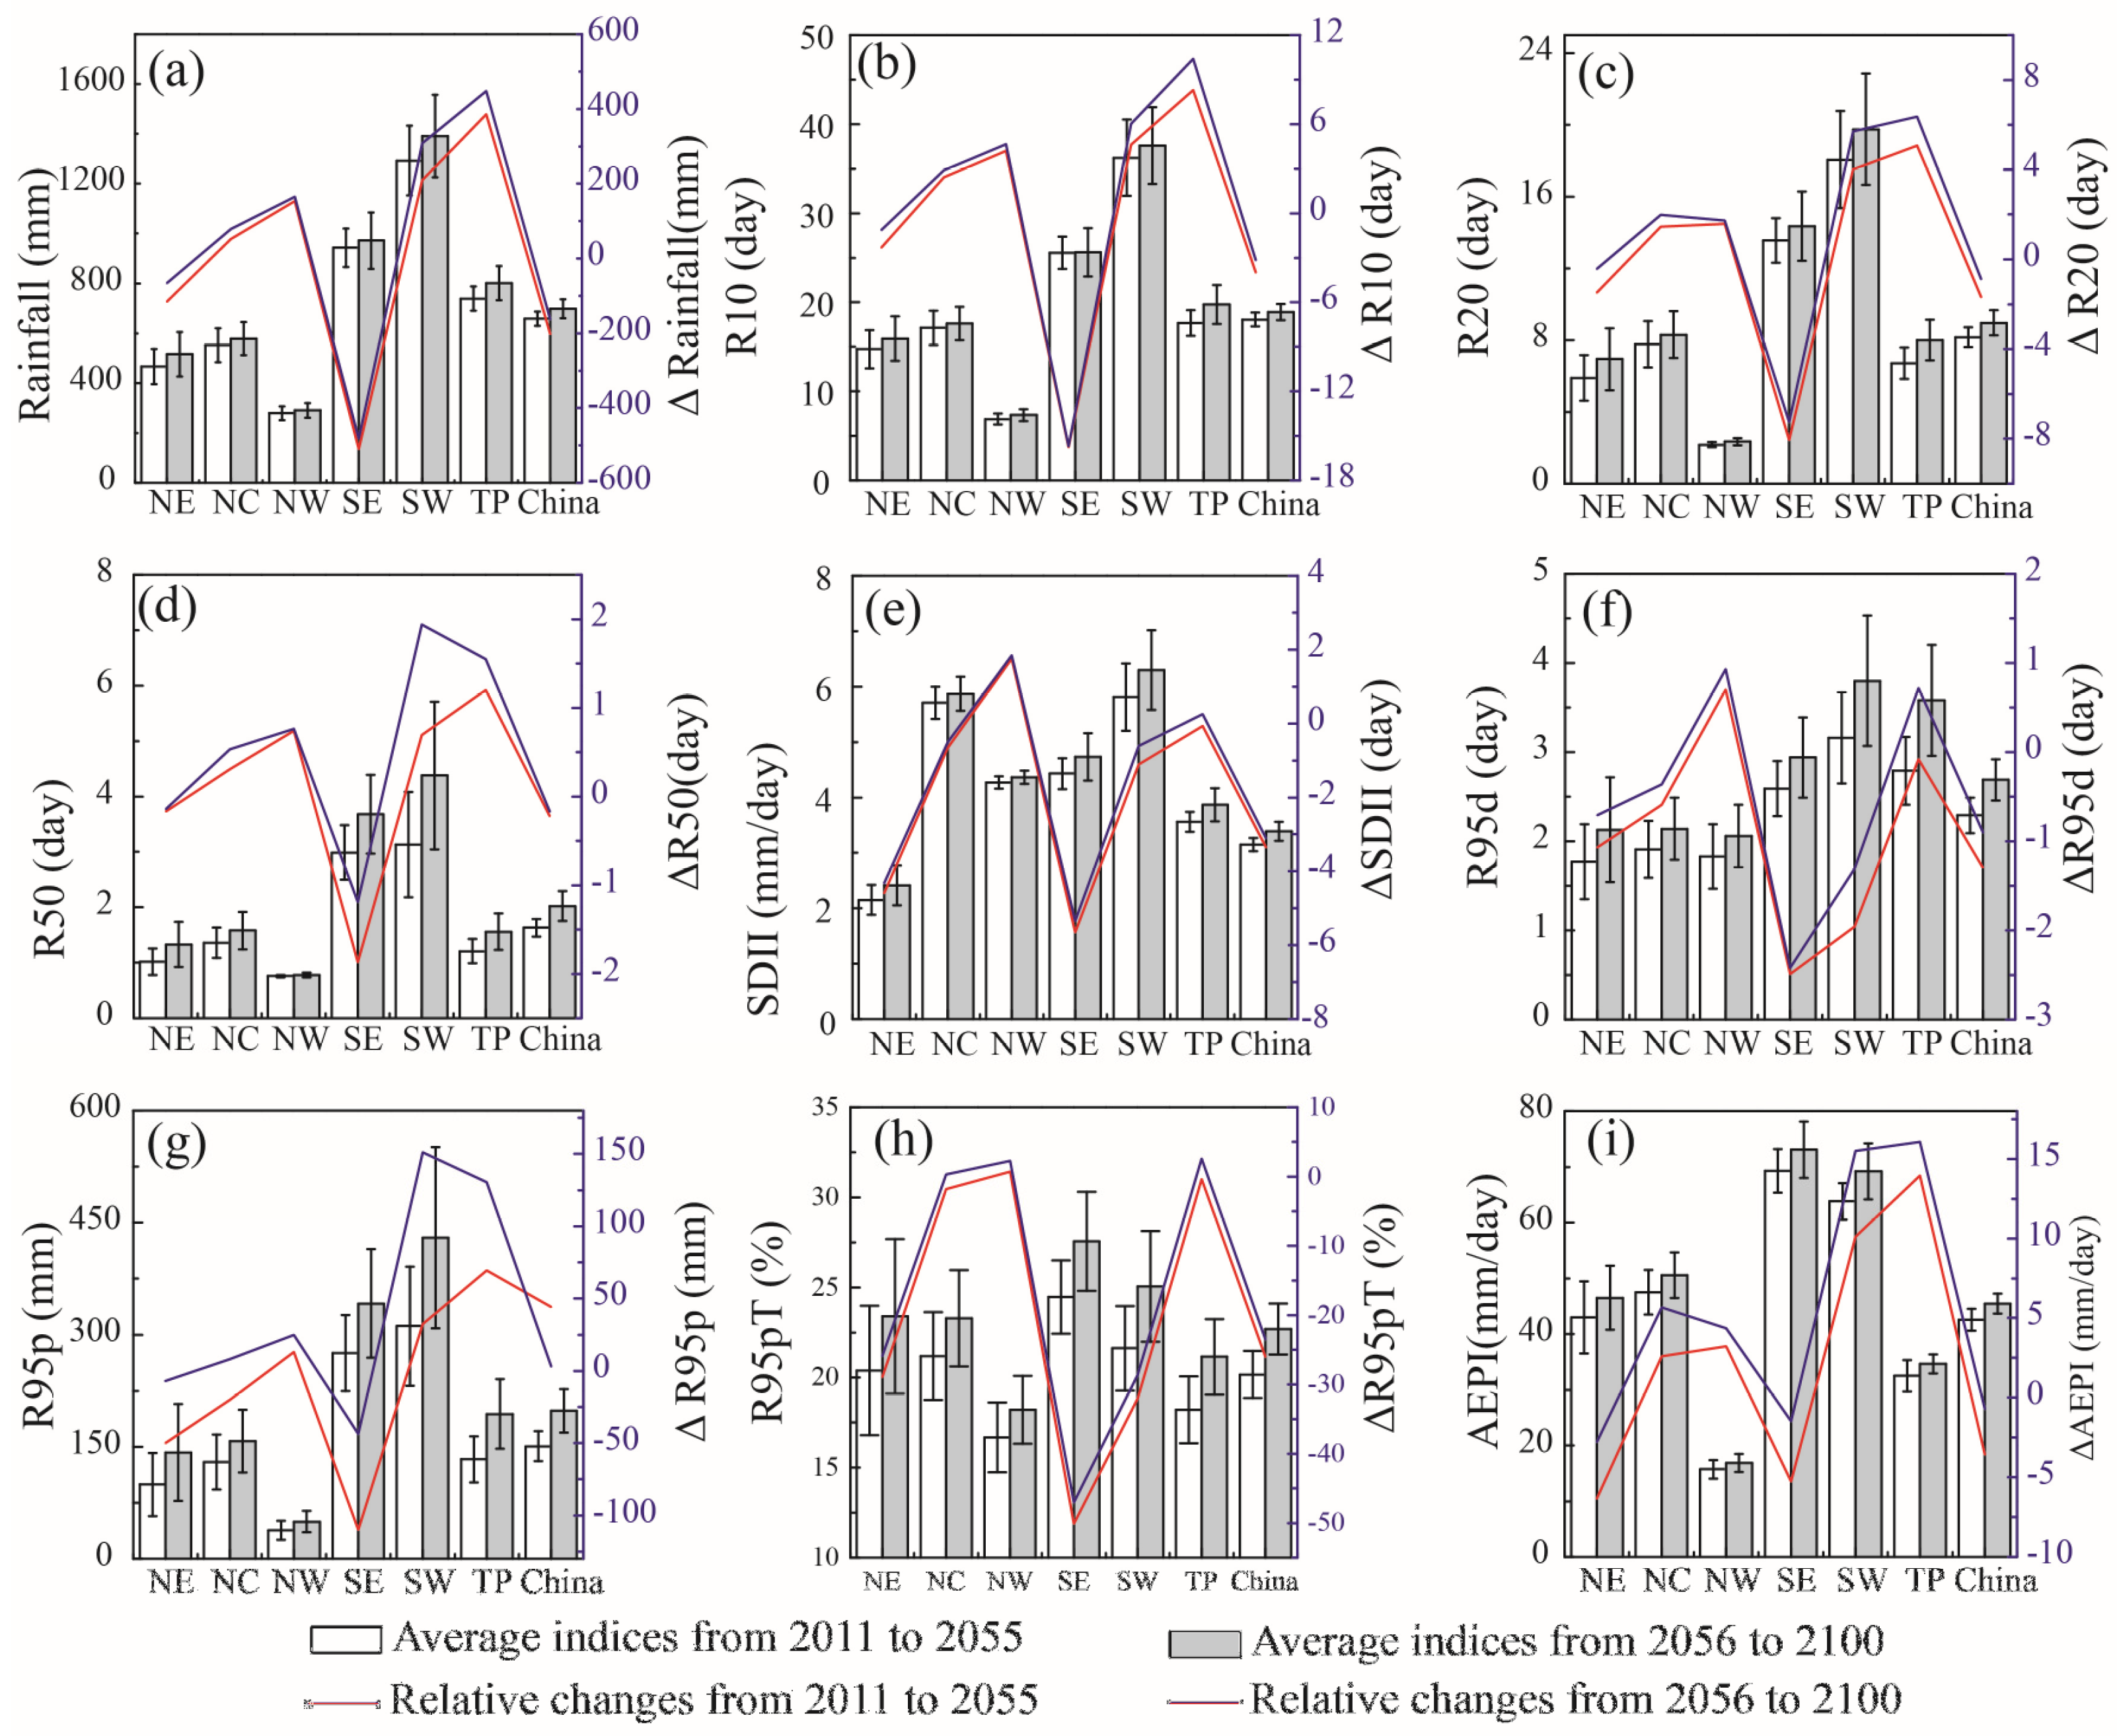
Zonal statistics were performed for the EPIs after system correction; the results (Figure 5) show that the average annual index values in the second 45-year period (2056–2100) are expected to be higher than those in the first 45-year period (2011–2055), and the trends of the EPIs are expected to be positive in both periods. Therefore, extreme precipitation will increase in the future across the whole area of China, while the average values of the indices will be relatively lower than those in the past 58 years. In the next 90 years, the average values of the eight EPIs and rainfall, except for AEPI in the SW region, are expected to be the highest among the six regions. Rainfall, R10, R20, R50, R95d, R95p, and AEPI in the SE and SW regions are expected to be higher than the national average, while the average values for these EPIs in the NE, NC, NW, and TP regions are expected to be lower than the national average. All the EPIs are expected to relatively decrease, while rainfall and the EPIs of R10, R20, R50, R95p, and AEPI in the SW and TP regions are expected to increase in the next two 45-years periods in the SE region, which means that the extreme precipitation in the SW and TP regions are expected to be more serious.
The EPIs will increase in the next 90 years in the whole of China, while there are differences between each region (Figure 6). The trends in EPIs for the second period (2056–2100) are generally expected to be smaller than that in the first period (2011–2055), which means that the EPIs are expected to increase slower in the second period, while all the trends of rainfall—R10, R20, R50, SDII, and R95p in the SW region—are obvious expected to be larger in the second period, reaching 60 mm/decade, 1.5 day/decade, 0.9 day/decade, 0.4 mm/day/decade, and 36 mm/decade, respectively. For R95d, R95pT, and AEPI, the difference of the trends in EPIs between different regions are expected to be smaller. The trends of R50, R95p, and R95T in the NE, NC, and SW regions in the second period is expected to be larger than that in the first period, while they are expected to be smaller than that in the NW, SE, and TP regions. All the results imply that the extreme precipitation is expected to become more and more serious in the NE, NC, and SW regions, and be alleviated in the SE region in the second period.
4. Discussion
This study evaluated extreme precipitation events in China over the past 58 years (1960–2017) and for the future (2011–2100) based on observations and CMIP5 projections. Rainfall and eight EPIs (R10, R20, R50, SDII, R95d, R95p, R95pT, and AEPI) were chosen to evaluate the extreme precipitation in China. The historical extreme precipitation was assessed using the observations, while the future extreme precipitation were evaluated using the BCC-ESM1-1 model.
The results show that all the eight EPIs and rainfall increased for the whole China region in the past 58 years, and is expected to increase in the next two 45-year periods (2011–2055 and 2056–2100). The results are similar to the existing conclusions [16,21,40,53], and the trends in the future for all of China is also expected to increase in the RCP 8.5 scenarios [42]. However, there were some differences in different regions. The R10, R20 R95d, and AEPI increase in the TP and SW regions, and the patterns of extreme precipitation days were similar to the results obtained by Wang et al. [54] in some regions. The R10, R20, R50, and R95d increased in the SE and western NW regions and decreased in the eastern and northern SW, NC, and NE regions, while the values were not very similar in the other regions. These differences may be attributed to the methods used to evaluate extreme precipitation and the time series of datasets. The missing values were filled with the two days before and after the missing values, which may have had an effect on the results, but the effects may not be obvious. Furthermore, though the process of a significant test of trends might ignore the non-significant trends (p > 0.1) of some sites [45], the significant trends can represent the basic situations of extreme precipitation in various regions of China. Therefore, it is necessary pay more attention to the non-significant trends in our future analysis.
Five CMIP5 models and the average of five models were used to simulate the extreme precipitation in China over the past 58 years, but none of them could repeat the EPIs perfectly due to the model uncertainties [42,55]. The projections overestimated the rainfall, R10, and R95d, while they underestimated the R50, R95pT, and AEPI in almost all the regions (Figure A1). Although we select the optimal model with a maximum R and minimum RMSE, the results of the EPIs in the future also have much uncertainties under the RCP 8.5, which is a scenario with comparatively high greenhouse gas emissions [56]. Additionally, the one RCP scenario that was used may enhance the uncertainties of the results.
It is known that extreme precipitation patterns are affected by the complex topography [42,53], monsoons [36], and human activities [57,58]. In our work, simple statistical analysis of the spatial and temporal patterns of extreme precipitation were carried out in China. Although eight EPIs were used in this paper and can clearly characterize the basic features of extreme precipitation to a degree, they cannot characterize the duration of extreme precipitation events. Nevertheless, this work can provide materials for further research on the impacts of extreme precipitation on ecosystems [59] and human life [60].
5. Conclusions
Based on observations and simulation data, this paper analyzed the variations and distributions of extreme precipitation in China. The results showed that the trend in extreme precipitation in China was consistent with the overall global trend during the last 58 years (1960–2017), but there were large differences in the spatial distribution of extreme precipitation, which generally decreased from south to north. During the next two 45-year periods (2011–2055 and 2056–2100), the average extreme precipitation in China is expected to continue to increase, but the averages are expected to be smaller than those during the last 58 years.
Extreme precipitation increased in China over the past 58 years and exhibited great spatial heterogeneity. The annual averages of all extreme precipitation indices showed spatial patterns with smaller values in the north and west and larger values in the south and east. Regarding the distribution patterns for annual average extreme precipitation, almost all the EPIs exhibited weak upward trends in the NW, SE, and TP regions, while they decreased in the NC region. The trends were larger in the SE region and relatively smaller in the NE, NC, and SW regions. In addition, the trends in extreme precipitation days calculated by the percentile threshold and fixed threshold showed different spatial patterns in the NE, NC, NW, TP, and SW regions.
For the results of extreme precipitation in China in the future, although the average EPIs in the whole China region are expected to be lower than that in the past 58 years, almost all EPIs are expected to still increase in the next 90 years except for some EPIs, such as AEPI, which is expected to decrease in the SE region in the second period (2056–2100). The upward trends of R10, R20, SDII, and R95d in the second period (2056–2100) in the SW region is expected to be obviously larger than that in the first period (2011–2055), and is expected to be smaller than that in the first 45 years in the NE and NC regions; the trends of each EPIs during the two periods in other regions (i.e., except for SW) are expected to be very small. These results imply that the extreme precipitation is expected to become more serious in the NE, NC, and SW regions, and is expected to subside in the SE region in the second period.
Author Contributions
In this article, Y.P., X.Z. and D.W. designed the framework of the study. Y.P. processed and analyzed the data, and wrote the manuscript; D.W., B.T. and P.X. contributed to the methodology and discussion, X.D. and H.W. contributed to the writing and review. All authors discussed the results and commented on the manuscript.
Funding
This study was supported by the National Key Research and Development Program of China (NO. 2016YFA0600103).
Acknowledgments
The authors thank Jia Chen, Rongyun Tang, and Hong Wei for their help in communicating the ideas in this paper. We also thank Tao Zhou for the helpful comments that improved this manuscript.
Conflicts of Interest
The authors declare no conflict of interest.
Appendix A
Figure A1.
Averages of EPIs in China calculated from five CMIP5 models, average of the five models and the observations from 1960 to 2005: (a) annual average rainfall, (b) annual average R10, (c) annual average R20, (d) annual average R50, (e) annual average SDII, (f) annual average R95d, (g) annual average R95p, (h) annual average R95pT, and (i) annual average in AEPI.

Figure A2.
Averages of EPIs in China calculated from five CMIP5 models, average of the five models and the observations from 1960 to 2005: (a) annual average rainfall, (b) annual average R10, (c) annual average R20, (d) annual average R50, (e) annual average SDII, (f) annual average R95d, (g) annual average R95p, (h) annual average R95pT, and (i) annual average in AEPI.

Figure A3.
Scatterplot of the annual extreme precipitation indices calculated with CMA data and BCC-ESM 1-1 data: (a) scatterplot of rainfall, (b) scatterplot of R10, (c) scatterplot of R20, (d) scatterplot of R50, (e) scatterplot of SDII, (f) scatterplot of R95d, (g) scatterplot of R95p, (h) scatterplot of R95pT, and (i) scatterplot of in AEPI.


Table A1.
The Pearson correlation coefficients for extreme precipitation indices between CMIP5 models and CMA observations.
Table A1.
The Pearson correlation coefficients for extreme precipitation indices between CMIP5 models and CMA observations.
| Index | BCC-CSM1 | BNU-ESM | FGOALS-g2 | GFDL-ESM2M | NorESM | Average of the Five Models |
|---|---|---|---|---|---|---|
| Rainfall | 0.71 | 0.64 | 0.58 | 0.60 | 0.63 | 0.68 |
| R10 | 0.71 | 0.67 | 0.62 | 0.73 | 0.66 | 0.73 |
| R20 | 0.72 | 0.56 | 0.55 | 0.54 | 0.51 | 0.64 |
| R50 | 0.60 | 0.34 | 0.56 | 0.24 | 0.20 | 0.49 |
| SDII | 0.58 | 0.52 | 0.60 | 0.58 | 0.54 | 0.60 |
| R95d | 0.63 | 0.69 | 0.39 | 0.64 | 0.79 | 0.71 |
| R95p | 0.81 | 0.65 | 0.61 | 0.53 | 0.67 | 0.73 |
| R95pt | 0.76 | 0.67 | 0.63 | 0.71 | 0.81 | 0.81 |
| AEPI | 0.81 | 0.67 | 0.71 | 0.67 | 0.73 | 0.79 |
Table A2.
RMSE of extreme precipitation indices between CMIP5 models and CMA observations.
| Index | BCC-CSM1 | BNU-ESM | FGOALS-g2 | GFDL-ESM2M | NorESM | Average of the Five Models |
|---|---|---|---|---|---|---|
| Rainfall | 589.47 | 738.52 | 601.61 | 641.43 | 754.14 | 602.67 |
| R10 | 16.71 | 25.88 | 15.91 | 17.10 | 24.35 | 17.36 |
| R20 | 7.70 | 10.29 | 9.05 | 9.70 | 12.16 | 8.32 |
| R50 | 2.38 | 3.18 | 2.89 | 3.11 | 3.49 | 2.78 |
| SDII | 4.86 | 4.79 | 5.42 | 4.86 | 4.92 | 4.88 |
| R95d | 5.04 | 5.56 | 5.12 | 4.55 | 5.01 | 4.83 |
| R95p | 130.93 | 150.02 | 152.36 | 174.48 | 153.20 | 134.06 |
| R95pt | 4.84 | 6.02 | 4.76 | 5.29 | 4.98 | 4.14 |
| AEPI | 25.71 | 34.27 | 31.84 | 31.69 | 31.82 | 30.24 |
Table A3.
The percentage of sites with significant trend (p < 0.1) in six regions of China.
| Index | Trend | NE | NC | NW | SE | SW | TP | China |
|---|---|---|---|---|---|---|---|---|
| Rainfall | positive | 1.62 | 1.35 | 8.34 | 10.77 | 1.35 | 4.04 | 27.46 |
| negative | 0.00 | 0.54 | 0.00 | 0.13 | 1.88 | 0.00 | 2.56 | |
| R10 | positive | 1.21 | 1.08 | 6.33 | 9.02 | 0.67 | 3.63 | 21.94 |
| negative | 0.27 | 1.08 | 0.13 | 0.00 | 2.56 | 0.00 | 4.04 | |
| R20 | positive | 0.67 | 1.08 | 3.50 | 10.90 | 1.62 | 2.02 | 19.78 |
| negative | 0.94 | 1.62 | 0.40 | 0.13 | 1.48 | 0.13 | 4.71 | |
| R50 | positive | 0.40 | 1.48 | 0.13 | 7.00 | 3.23 | 0.00 | 12.25 |
| negative | 0.40 | 1.48 | 0.00 | 0.40 | 1.21 | 0.00 | 3.50 | |
| SDII | positive | 0.00 | 0.54 | 1.08 | 13.19 | 3.63 | 0.13 | 18.57 |
| negative | 5.25 | 3.63 | 0.27 | 0.40 | 0.27 | 0.40 | 10.23 | |
| R95d | positive | 0.67 | 0.94 | 4.04 | 8.48 | 2.29 | 2.56 | 18.98 |
| negative | 0.13 | 2.15 | 0.13 | 0.40 | 1.35 | 0.13 | 4.31 | |
| R95p | positive | 0.94 | 0.54 | 4.31 | 7.54 | 2.69 | 2.29 | 18.30 |
| negative | 0.13 | 1.75 | 0.13 | 0.13 | 0.81 | 0.13 | 3.10 | |
| R95pT | positive | 0.54 | 1.48 | 1.75 | 5.38 | 3.23 | 0.94 | 13.32 |
| negative | 0.54 | 2.56 | 0.13 | 0.00 | 0.54 | 0.13 | 3.90 | |
| AEPI | positive | 1.21 | 1.35 | 3.77 | 4.85 | 2.15 | 1.35 | 14.67 |
| negative | 1.08 | 1.62 | 0.13 | 0.94 | 0.27 | 0.13 | 4.17 |
References
- Hartmann, D.L.; Klein Tank, A.M.; Rusticucci, M.; Alexander, L.V.; Brönnimann, S.; Charabi, Y.A.R.; Dentener, F.J.; Dlugokencky, E.J.; Easterling, D.R.; Kaplan, A.; et al. Observations: Atmosphere and Surface. Climate Change 2013: The Physical Science Basis. In Contribution of Working Group I to the Fifth Assessment Report of the Intergovernmental Panel on Climate Change; Stocker, T.F., Qin, D., Plattner, G.K., Tignor, M.M., Allen, S.K., Boschung, J., Nauels, A., Xia, Y., Bex, V., Midgley, P.M., Eds.; Cambridge University Press: Cambridge, UK, 2013; pp. 159–254. [Google Scholar]
- Frich, P.; Alexander, L.; Della-Marta, P.; Gleason, B.; Haylock, M.; Klein Tank, A.; Peterson, T. Observed coherent changes in climatic extremes during the second half of the twentieth century. Clim. Res. 2002, 19, 193–212. [Google Scholar] [CrossRef] [Green Version]
- Trenberth, K.E.; Stepaniak, D.P. Covariability of components of poleward atmospheric energy transports on seasonal and interannual timescales. J. Clim. 2003, 16, 3691–3705. [Google Scholar] [CrossRef]
- Asadieh, B.; Krakauer, N. Global trends in extreme precipitation: Climate models versus observations. Hydrol. Earth. Syst. Sci. 2015, 19, 877–891. [Google Scholar] [CrossRef]
- Kirtman, B.; Power, S.B.; Adedoyin, J.A.; Boer, G.J.; Bojariu, R.; Camilloni, I.; Doblas-Reyes, F.J.; Fiore, A.M.; Kimoto, M.; Meehl, G.A.; et al. Near-term climate change: Projections and predictability. In Climate Change 2013: The Physical Science Basis. Contribution of Working Group I to the Fifth Assessment Report of the Intergovernmental Panel on Climate Change; Cambridge University Press: Cambridge, UK; New York, NY, USA, 2013; pp. 953–1028. [Google Scholar]
- Collins, M.; Knutti, R.; Arblaster, J.; Dufresne, J.L.; Fichefet, T.; Friedlingstein, P.; Gao, X.; Gutowski, W.; Johns, T.; Krinner, G. Long-term climate change: Projections, commitments and irreversibility. In Climate Change 2013: The Physical Science Basis. IPCC Working Group I Contribution to AR5; Cambridge University Press: Cambridge, UK; New York, NY, USA, 2013; pp. 1029–1136. [Google Scholar]
- Prein, A.F.; Rasmussen, R.M.; Ikeda, K.; Liu, C.; Clark, M.P.; Holland, G.J. The future intensification of hourly precipitation extremes. Nat. Clim. Chang. 2016, 7, 48–52. [Google Scholar] [CrossRef]
- Donat, M.G.; Lowry, A.L.; Alexander, L.V.; O’Gorman, P.A.; Maher, N. Addendum: More extreme precipitation in the world’s dry and wet regions. Nat. Clim. Chang. 2017, 7, 154–158. [Google Scholar] [CrossRef]
- Held, I.M.; Soden, B.J. Robust responses of the hydrological cycle to global warming. J. Clim. 2006, 19, 5686–5699. [Google Scholar] [CrossRef]
- Peterson, T.C.; Zhang, X.; Brunet-India, M.; Vázquez-Aguirre, J.L. Changes in North American extremes derived from daily weather data. J. Geophys. Res. 2008, 113, 1829–1836. [Google Scholar] [CrossRef]
- Haylock, M.R.; Peterson, T.C.; Alves, L.M.; Ambrizzi, T.; Anunciação, Y.M.T.; Baez, J.; Barros, V.R.; Berlato, M.A.; Bidegain, M.; Coronel, G.; et al. Trends in total and extreme South American rainfall in 1960–2000 and links with sea surface temperature. J. Clim. 2006, 19, 1490–1512. [Google Scholar] [CrossRef]
- Aguilar, E.; Barry, A.A.; Brunet, M.; Ekang, L.; Fernandes, A.; Massoukina, M.; Mbah, J.; Mhanda, A.; Nascimento, D.J.D.; Peterson, T.C. Changes in temperature and precipitation extremes in Western Central Africa, Guinea Conakry, and Zimbabwe, 1955–2006. J. Geophys. Res. 2009, 114, 356–360. [Google Scholar] [CrossRef]
- Vincent, L.A.; Aguilar, E.; Saindou, M.; Hassane, A.F.; Jumaux, G.; Roy, D.; Booneeady, P.; Virasami, R.; Randriamarolaza, L.Y.A.; Faniriantsoa, F.R. Observed trends in indices of daily and extreme temperature and precipitation for the countries of the Western Indian Ocean, 1961–2008. J. Geophys. Res. 2011, 116, 521–541. [Google Scholar] [CrossRef]
- He, J.; Soden, B.J. A re-examination of the projected subtropical precipitation decline. Nat. Clim. Chang. 2017, 7, 53–57. [Google Scholar] [CrossRef]
- Bao, J.; Sherwood, S.C.; Alexander, L.V.; Evans, J.P. Future increases in extreme precipitation exceed observed scaling rates. Nat. Clim. Chang. 2017, 7, 128–132. [Google Scholar] [CrossRef]
- Shi, P.; Kong, F.; Fang, J. Spatio-temporal patterns of China decadal storm rainfall. Sci. Geogr. Sin. 2014, 34, 1281–1290. [Google Scholar]
- Jiang, C.Y.; Wei, N.; Cheng, X.X.; Fang, J.G.; Sun, X. Analysis of inter-annual temperature and precipitation regional change during 1961–2008 in Shaanxi Province. Res. Soil. Water. Conser. 2011, 18, 197–186. [Google Scholar]
- Yao, C.; Yang, S.; Qian, W.; Lin, Z.; Wen, M. Regional summer precipitation events in Asia and their changes in the past decades. J. Geophys. Res. 2008, 113, 487–497. [Google Scholar] [CrossRef]
- Sun, W.; Mu, X.; Song, X.; Wu, D.; Cheng, A.; Qiu, B. Changes in extreme temperature and precipitation events in the Loess Plateau (China) during 1960–2013 under global warming. Atmos. Res. 2016, 168, 33–48. [Google Scholar] [CrossRef]
- Hallett, J. Climate change 2001: The scientific basis. Edited by J. T. Houghton, Y. Ding, D. J. Griggs, N. Noguer, P. J. van der Linden, D. Xiaosu, K. Maskell and C. A. Johnson. Contribution of Working Group I to the Third Assessment Report of the Intergovernmental Panel on Climate Change, Cambridge University Press, Cambridge. 2001. 881 pp. ISBN 0521 01495 6. Q. J. Meteorol. Soc. 2007, 128, 1038–1039. [Google Scholar]
- Zhai, P.; Zhang, X.; Wan, H.; Pan, X. Trends in total precipitation and frequency of daily precipitation extremes over China. J. Clim. 2005, 18, 1096–1108. [Google Scholar] [CrossRef]
- Cao, Y.Q.; Cao, Y.; Xu, D. Temporal and spatial variation in drought and floods in the Huang–Huai–Hai River Basin from 1961 to 2010. Res. Sci. 2015, 10, 2068–2077. [Google Scholar]
- Taylor, K.E.; Stouffer, R.J.; Meehl, G.A. An overview of CMIP5 and the experiment design. Bull. Amer. Meteorol. Soc. 2012, 93, 485–498. [Google Scholar] [CrossRef]
- Tan, M.L.; Yusop, Z.; Chua, V.P.; Chan, N.W. Climate change impacts under CMIP5 RCP scenarios on water resources of the Kelantan River Basin, Malaysia. Atmos. Res. 2017, 189, 1–10. [Google Scholar] [CrossRef]
- Wen, X.; Fang, G.; Qi, H.; Zhou, L.; Gao, Y. Changes of temperature and precipitation extremes in China: Past and future. Theor. Appl. Climatol. 2016, 126, 369–383. [Google Scholar] [CrossRef]
- Alexander, L.V.; Arblaster, J.M. Historical and projected trends in temperature and precipitation extremes in Australia in observations and CMIP5. Weather Clim. Extremes 2017, 15, 34–56. [Google Scholar] [CrossRef]
- Wu, Z.; Chen, X.; Lu, G.; Xiao, H.; He, H.; Zhang, J. Regional response of runoff in CMIP5 multi-model climate projections of Jiangsu Province, China. Stoch. Environ. Res. Risk Assess. 2017, 31, 2627–2643. [Google Scholar] [CrossRef]
- Janssen, E.; Sriver, R.; Wuebbles, D.; Kunkel, K. Seasonal and regional variations in extreme precipitation event frequency using CMIP5. Geophys. Res. Lett. 2016, 43, 5385–5393. [Google Scholar] [CrossRef]
- Moss, R.H.; Edmonds, J.A.; Hibbard, K.A.; Manning, M.R.; Rose, S.K.; Van Vuuren, D.P.; Carter, T.R.; Emori, S.; Kainuma, M.; Kram, T. The next generation of scenarios for climate change research and assessment. Nature 2010, 463, 747–756. [Google Scholar] [CrossRef] [PubMed]
- Van Vuuren, D.P.; Edmonds, J.; Kainuma, M.; Riahi, K.; Thomson, A.; Hibbard, K.; Hurtt, G.C.; Kram, T.; Krey, V.; Lamarque, J.F. The representative concentration pathways: An overview. Clim. Change 2011, 109, 5–31. [Google Scholar] [CrossRef]
- Acquaotta, F.; Fratianni, S.; Venema, V. Assessment of parallel precipitation measurements networks in Piedmont, Italy. Int. J. Climatol. 2016, 36, 3963–3974. [Google Scholar] [CrossRef]
- Aguilar, E.; Peterson, T.C.; Obando, P.R.; Frutos, R.; Retana, J.A.; Solera, M.; Soley, J.; García, I.G.; Araujo, R.M.; Santos, A.R. Changes in precipitation and temperature extremes in Central America and Northern South America, 1961–2003. J. Geophys. Res. 2005, 110, 3233–3250. [Google Scholar] [CrossRef]
- Kunkel, K.E.; Easterling, D.R.; Redmond, K.; Hubbard, K. Temporal variations of extreme precipitation events in the United States: 1895–2000. Geophys. Res. Lett. 2003, 30, 51–54. [Google Scholar] [CrossRef]
- Zandonadi, L.; Acquaotta, F.; Fratianni, S.; Zavattini, J.A. Changes in precipitation extremes in Brazil (Paraná River Basin). Theor. Appl. Climatol. 2016, 123, 741–756. [Google Scholar] [CrossRef]
- Liping, D.; Qianqian, W. On the relationship between precipitation anomalies in the first raining season (April–June) in Southern China and SST over offshore waters in China. J. Trop. Meteorol. 2002, 18, 45–55. [Google Scholar]
- Wang, B.; LinHo. Rainy season of the Asian–Pacific summer monsoon. J. Clim. 2002, 15, 386–398. [Google Scholar] [CrossRef]
- Choi, G.; Collins, D.; Ren, G.; Trewin, B.; Baldi, M.; Fukuda, Y.; Afzaal, M.; Pianmana, T.; Gomboluudev, P.; Huong, P.T.T.; et al. Changes in means and extreme events of temperature and precipitation in the Asia–Pacific network region, 1955–2007. Int. J. Climatol. 2009, 29, 1906–1925. [Google Scholar] [CrossRef]
- Tank, A.M.G.K.; Können, G.P. Trends in indices of daily temperature and precipitation extremes in Europe, 1946–99. J. Clim. 2003, 16, 3665–3680. [Google Scholar] [CrossRef]
- Fatichi, S.; Caporali, E. A comprehensive analysis of changes in precipitation regime in Tuscany. Int. J. Climatol. 2009, 29, 1883–1893. [Google Scholar] [CrossRef] [Green Version]
- Yang, J.H.; Jiang, Z.H.; Wang, P.X.; Chen, Y.S. Temporal and spatial characteristic of extreme precipitation event in China. Clim. Environ. Res. 2008, 13, 75–83. [Google Scholar]
- Zhang, X.; Alexander, L.; Hegerl, G.C.; Jones, P.; Tank, A.K.; Peterson, T.C.; Trewin, B.; Zwiers, F.W. Indices for monitoring changes in extremes based on daily temperature and precipitation data. WIREs Clim. Chang. 2011, 2, 851–870. [Google Scholar] [CrossRef]
- Sun, Q.; Miao, C.; Duan, Q. Extreme climate events and agricultural climate indices in China: CMIP5 model evaluation and projections. Int. J. Climatol. 2016, 36, 43–61. [Google Scholar] [CrossRef]
- Mann, H.B. Nonparametric tests against trend. Econometrica 1945, 13, 245–259. [Google Scholar] [CrossRef]
- Kendall, M.G. Rank correlation methods. Econometrica 1957, 25, 181–183. [Google Scholar] [CrossRef]
- Nicholls, N. The insignificance of significance testing. Bull. Amer. Meteorol. Soc. 2001, 82, 981–986. [Google Scholar] [CrossRef]
- Clarke, R.T. On the (mis)use of statistical methods in hydro-climatological research. Hydrol. Sci. J. 2010, 55, 139–144. [Google Scholar] [CrossRef] [Green Version]
- Turner, J.; Lu, H.; White, I.; King, J.C.; Phillips, T.; Hosking, J.S.; Bracegirdle, T.J.; Marshall, G.J.; Mulvaney, R.; Deb, P. Absence of 21st century warming on Antarctic Peninsula consistent with natural variability. Nature 2016, 535, 411–415. [Google Scholar] [CrossRef] [PubMed] [Green Version]
- Asoka, A.; Gleeson, T.; Wada, Y.; Mishra, V. Relative contribution of monsoon precipitation and pumping to changes in groundwater storage in India. Nat. Geosci. 2017, 10, 109–117. [Google Scholar] [CrossRef] [Green Version]
- Hamed, K.H. Trend detection in hydrologic data: The Mann–Kendall trend test under the scaling hypothesis. J. Hydrol. 2008, 349, 350–363. [Google Scholar] [CrossRef]
- Yue, S.; Pilon, P.; Cavadias, G. Power of the Mann–Kendall and Spearman’s rho tests for detecting monotonic trends in hydrological series. J. Hydrol. 2002, 259, 254–271. [Google Scholar] [CrossRef]
- Kang, S.; Zhang, B.; Liu, J.; Yang, M. Analysis of the spatiotemporal distribution of precipitation in Zhangye City using Mann–Kendall method. Res. Sci. 2009, 31, 501–508. [Google Scholar]
- Brunetti, M.; Buffoni, L.; Mangianti, F.; Maugeri, M.; Nanni, T. Temperature, precipitation and extreme events during the last century in Italy. Glob. Planet. Chang. 2004, 40, 141–149. [Google Scholar] [CrossRef] [Green Version]
- Jiang, P.; Wang, D.; Cao, Y. Spatiotemporal characteristics of precipitation concentration and their possible links to urban extent in China. Theor. Appl. Climatol. 2016, 123, 757–768. [Google Scholar] [CrossRef]
- Wang, Y.; Zhou, L. Observed trends in extreme precipitation events in China during 1961–2001 and the associated changes in large-scale circulation. Geophys. Res. Lett. 2005, 32, L09707. [Google Scholar] [CrossRef]
- Li, J.; Zhu, Z.; Dong, W. Assessing the uncertainty of CESM-LE in simulating the trends of mean and extreme temperature and precipitation over China. Int. J. Climatol. 2017, 37, 2101–2110. [Google Scholar] [CrossRef]
- Riahi, K.; Rao, S.; Krey, V.; Cho, C.; Chirkov, V.; Fischer, G.; Kindermann, G.; Nakicenovic, N.; Rafaj, P. RCP 8.5—A scenario of comparatively high greenhouse gas emissions. Clim. Chang. 2011, 109, 33–57. [Google Scholar] [CrossRef] [Green Version]
- Kadari, A.; Mekala, S.R.; Wagner, N.; Malan, D.; Köth, J.; Doll, K.; Stappert, L.; Eckert, D.; Peitz, M.; Matthes, J. Human contribution to more-intense precipitation extremes. Nature 2011, 470, 378–381. [Google Scholar]
- Zhang, X.; Wan, H.; Zwiers, F.W.; Hegerl, G.C.; Min, S.K. Attributing intensification of precipitation extremes to human influence. Geophys. Res. Lett. 2013, 40, 5252–5257. [Google Scholar] [CrossRef] [Green Version]
- Wu, D.; Ciais, P.; Viovy, N.; Knapp, A.K.; Wilcox, K.; Bahn, M.; Smith, M.D.; Vicca, S.; Fatichi, S.; Zscheischler, J.; et al. Asymmetric responses of primary productivity to altered precipitation simulated by ecosystem models across three long-term grassland sites. Biogeosciences 2018, 15, 3421–3437. [Google Scholar] [CrossRef]
- Easterling, D.R.; Meehl, G.A.; Parmesan, C.; Changnon, S.A.; Karl, T.R.; Mearns, L.O. Climate extremes: Observations, modeling, and impacts. Science 2000, 289, 2068–2074. [Google Scholar] [CrossRef] [PubMed]
Figure 1.
Regions, elevations, and locations of stations in China. The boundaries with blue are the six regions of China, where NE represents the region of northeastern China, NC represents the region of northern China, NW represents the region of northwestern China, SE represents the region of southeastern China, SW represents the region of southwestern China, and TP represents the region of the Tibetan Plateau; the sites are the locations and elevations of the China Meteorological Administration (CMA) stations used in our study.

Figure 2.
Spatial distribution of the average annual rainfall and EPIs from 1960 to 2017: (a) annual average rainfall, (b) annual average R10, (c) annual average R20, (d) annual average R50, (e) annual average SDII, (f) annual average R95d, (g) annual average R95p, (h) annual average R95pT, and (i) annual average AEPI.

Figure 3.
Trends in the EPIs in China from 1960 to 2017: (a) the trend in rainfall, (b) the trend in R10, (c) the trend in R20, (d) the trend in R50, (e) the trend in SDII, (f) the trend in R95d, (g) the trend in R95p, (h) the trend in R95pT, and (i) the trend in AEPI.
Figure 3.
Trends in the EPIs in China from 1960 to 2017: (a) the trend in rainfall, (b) the trend in R10, (c) the trend in R20, (d) the trend in R50, (e) the trend in SDII, (f) the trend in R95d, (g) the trend in R95p, (h) the trend in R95pT, and (i) the trend in AEPI.

Figure 4.
Trends of extreme precipitation in China in sites from 1960 to 2017: (a) the trend in rainfall, the “T-Rainfall” represents the trend in Rainfall; (b) the trend in R10, “T-R10” represents the trend in R10; (c) the trend in R20, “T-R20” represents the trend in R20; (d) the trend in R50, “T-R50” represents the trend in R50; (e) the trend in SDII, “T-SDII” represents the trend in SDII; (f) the trend in R95d, “T-R95d” represents the trend in R95d; (g) the trend in R95p; “T-R95p” represents the trend in R95p; (h) the trend in R95pT, “T-R95pT” represents the trend in R95pT; and (i) the trend in AEPI, “T-AEPI” represents the trend in AEPI.

Figure 5.
Annual average extreme precipitation indices in the next 90 years and the relative changes respect to the past 58 years (1960–2017) in China: (a) annual average rainfall, (b) annual average R10, (c) annual average R20, (d) annual average R50, (e) annual average SDII, (f) annual average R95d, (g) annual average R95p, (h) annual average R95pT, and (i) annual average in AEPI. The white bars represent the average indices from 2011 to 2055, and the gray bars indicate the average indices from 2056 to 2100. The red lines are the relative changes during the period 2011–2055 with respect to 1960–2017, and the blue lines are the relative changes in the period 2056–2100 with respect to 1960–2017.

Figure 6.
Trends of decade in regional extreme precipitation indices in the next 90 years in China: (a) trends in rainfall, (b) trends in R10, (c) trends in R20, (d) trends in R50, (e) trends in SDII, (f) trends in R95d, (g) trends in R95p, (h) trends in R95pT, and (i) trends in AEPI. The white bars represent the trends from 2011 to 2055, and the gray bars indicate the trends from 2056 to 2100.

Table 1.
List of global climate models in this study.
| ID | Model | Source | Temporal Resolution | Number of Pixels |
|---|---|---|---|---|
| 1 | BCC-CSM-1-1 | Beijing Climate Center, China Meteorological Administration, China | Daily | 64 × 128 |
| 2 | BNU-ESM | Beijing Normal University, China | Daily | 64 × 128 |
| 3 | FGOALS-g2 | Institute of Atmospheric Physics, Chinese Academy of Sciences, China | Daily | 60 × 128 |
| 4 | GFDL-ESM2M | Geophysical Fluid Dynamics Laboratory, USA | Daily | 90 × 144 |
| 5 | NorESM1-M | Bjerknes Centre for Climate Research, Norwegian Meteorological Institute, Norway | Daily | 96 × 144 |
Table 2.
Definitions of the extreme precipitation indices.
| Indices | Description | Units |
|---|---|---|
| R10 | Number of days per year with precipitation amount ≥ 10 mm | day |
| R20 | Number of days per year with precipitation amount ≥ 20 mm | day |
| R50 | Number of days per year with precipitation amount ≥ 50 mm | day |
| SDII | Average daily precipitation amount on wet days with RR ≥ 1 mm where RR is the daily precipitation amount on a wet day. | mm/day |
| R95d | Number of days with P > 95th percentile during the whole year | day |
| R95p | Fraction of annual total precipitation due to events exceeding the 95th percentile | mm |
| R95pT | Ratio of extreme precipitation total to rainfall in rainy days (daily precipitation > 1 mm) | % |
| AEPI | Absolute intensity of extreme precipitation | mm/day |
Table 3.
Averages of extreme precipitation indices in six regions in China.
| Index (Units) | Region | ||||||
|---|---|---|---|---|---|---|---|
| NE | NC | NW | SE | SW | TP | China | |
| Rainfall (mm) | 581.98 | 500.19 | 125.19 | 1453.02 | 1082.64 | 353.51 | 860.41 |
| R10 (day) | 17.05 | 4.71 | 2.68 | 41.33 | 31.59 | 9.37 | 22.05 |
| R20 (day) | 7.36 | 6.32 | 0.6 | 21.61 | 14.04 | 1.63 | 9.83 |
| R50 (day) | 1.19 | 1.05 | 0.02 | 4.86 | 2.44 | 0.01 | 1.85 |
| SDII (mm/day) | 6.73 | 6.37 | 2.52 | 10.08 | 6.92 | 3.62 | 6.5 |
| R95d (day) | 2.84 | 2.5 | 1.13 | 5.08 | 5.12 | 2.86 | 3.6 |
| R95p (mm) | 149.51 | 149.51 | 25.04 | 385.63 | 279.07 | 63.45 | 194.85 |
| R95pT (%) | 49.29 | 22.99 | 15.96 | 74.57 | 53.68 | 18.58 | 46.17 |
| AEPI (mm/day) | 23.83 | 44.89 | 12.48 | 25.31 | 24.41 | 16.61 | 22.19 |
Table 4.
Trends in extreme precipitation indices in the six regions of China.
| Index (units) | Region | ||||||
|---|---|---|---|---|---|---|---|
| NE | NC | NW | SE | SW | TP | China | |
| Rainfall (mm/decade) | 11.58 | 3.23 | 13.86 * | 31.11 * | −3.12 | 25.66 * | 14.86 * |
| R10 (day/decade) | 0.18 | 0.06 | 0.31 * | 0.66 * | −0.21 | 0.6 * | 0.29 * |
| R20 (day/decade) | 0.04 | 0.01 | 0.07 * | 0.55 * | −0.05 | 0.09 * | 0.2 * |
| R50 (day/decade) | 0.02 | −0.01 | 0.003 * | 0.2 * | 0.03 | 0.003 | 0.07 * |
| SDII (mm/day/decade) | −0.25 | −0.12 | −0.01 | 0.21 * | 0.08 * | −0.07 | 0.02 |
| R95d (day/decade) | 0.04 | −0.01 | 0.15 * | 0.21 * | 0.06 * | 0.22 * | 0.11 * |
| R95p (mm/decade) | 1.99 | −0.93 | 3.30 * | 17.58 * | 4.22 * | 4.79 * | 7.03 * |
| R95pT (pct/decade) | −0.20 | −0.34 | 0.58 * | 0.63 * | 0.45 * | 0.29 | 0.25 |
| AEPI (mm/day/decade) | 0.00 | −0.27 | 0.90 * | 0.59 * | 0.33 * | 0.54 * | 0.31 |
Note: Values marked with * indicate statistical significance at the 0.1 significance level.
© 2018 by the authors. Licensee MDPI, Basel, Switzerland. This article is an open access article distributed under the terms and conditions of the Creative Commons Attribution (CC BY) license (http://creativecommons.org/licenses/by/4.0/).
Share and Cite
MDPI and ACS Style
Peng, Y.; Zhao, X.; Wu, D.; Tang, B.; Xu, P.; Du, X.; Wang, H. Spatiotemporal Variability in Extreme Precipitation in China from Observations and Projections. Water 2018, 10, 1089. https://doi.org/10.3390/w10081089
AMA Style
Peng Y, Zhao X, Wu D, Tang B, Xu P, Du X, Wang H. Spatiotemporal Variability in Extreme Precipitation in China from Observations and Projections. Water. 2018; 10(8):1089. https://doi.org/10.3390/w10081089
Chicago/Turabian StylePeng, Yifeng, Xiang Zhao, Donghai Wu, Bijian Tang, Peipei Xu, Xiaozheng Du, and Haoyu Wang. 2018. "Spatiotemporal Variability in Extreme Precipitation in China from Observations and Projections" Water 10, no. 8: 1089. https://doi.org/10.3390/w10081089
Note that from the first issue of 2016, this journal uses article numbers instead of page numbers. See further details here.