Combined Effects of Experimental Warming and Eutrophication on Phytoplankton Dynamics and Nitrogen Uptake

1
College of Fisheries, Huazhong Agricultural University, Freshwater Aquaculture Collaborative Innovation Center of Hubei Province, Hubei Provincial Engineering Laboratory for Pond Aquaculture, Wuhan 430070, China
2
Institute of Hydrobiology, Chinese Academy of Science, Wuhan 430072, China
*
Authors to whom correspondence should be addressed.
Water 2018, 10(8), 1057; https://doi.org/10.3390/w10081057
Submission received: 21 May 2018
/
Revised: 21 July 2018
/
Accepted: 7 August 2018
/
Published: 9 August 2018
(This article belongs to the Special Issue Trophic Interactions in Warm Freshwater Ecosystems)
Abstract
:Shallow lakes are highly vulnerable to damages caused by human activities and warming trends. To assess whether and how community structures of phytoplankton and nitrogen uptake respond to the combined effects of elevated temperature and eutrophication, we performed a mesocosm experiment in field by combining a 4.5 °C increase in temperature and the addition of phosphorus. Our results demonstrated that the combination of rising temperatures and phosphorus loading stimulated the maximum biomass built up by the phytoplankton community, and changed the phytoplankton community by significantly increasing the number of Chlorophyta and Cyanophyta, and decreasing that of Cryptophyta. We also examined the effects of climate warming and eutrophication on phytoplankton nitrogen uptake and dynamics using 15N tracer techniques. The addition of phosphorus slightly increased the phytoplankton nitrate uptake velocity and relative preference index, but decreased the nitrate uptake turnover time. Warming relatively increased the ammonium uptake velocity and the relative preference index, but decreased the ammonium turnover time. In kinetic studies, NH4+ exhibited a higher maximum uptake rate (Vmax) and a lower half-saturation constant (Ks) than NO3− substrates due to temperature elevation and the addition of phosphorus. Hence, warming and eutrophication increased the capacity of phytoplankton for NH4+ uptake and their affinity at low substrate concentrations. Thus, the combined effects of climate warming and phosphorus nutrient availability may increase the prevalence of Chlorophyta and Cyanophyta, and change the nitrogen cycling of aquatic ecosystems.
1. Introduction
Climate change has been one of the most distinct threats to ecosystems for decades [1]. According to the synthesis report summarized by the Intergovernmental Panel on Climate Change (IPCC) in 2014, global temperatures have been rising for decades, and are predicted to rise further by an additional 3–5 °C over the next century [2]. Shallow lakes are important productive areas that dominate inland waters and are easily and strongly affected by climate change, particularly by increases in temperature [3] and by the supply of nutrients [1] as lake ontogeny from oligotrophic–mesotrophic–eutrophic–hypereutrophic states either in the short or long term. Anthropogenically driven increases in temperature can also disrupt the aquatic environment. These alterations might ultimately lead to shifts in the food web structure and productivity [4,5]. Thus, to resist such changes, some biological stabilizing mechanisms should be preserved. Generally, phytoplankton growth is directly affected by water quality and the lake food web through chemical, biological, and physical factors [6]. Simply put, climate change could lead to high phytoplankton biomass [7] and earlier spring phytoplankton bloom [8]. Climate change potentially alters the structure and dynamics of phytoplankton communities [9], and also influences the nitrogen dynamics of phytoplankton and N transport during the eutrophication of lakes [10,11].
Despite efforts to reduce anthropogenic input, one of the most ominous pressures on the lake ecosystem functioning consistently is eutrophication [12,13,14]. Climate change projections indicate that N losses from catchments under different land uses and N retention, as well as nutrient input in surface waters, impact the succession of freshwater phytoplankton communities in response to global warming combined with eutrophication [12,15,16]. Furthermore, temperature-driven shifts in phytoplankton community composition toward more cyanobacteria seem nutrient dependent [17]. Obviously, global climatic change and eutrophication both affect the communities of phytoplankton [12].
Phytoplankton responses to dynamic physical factors are characterized to determine adaptation indices, which represent the ability of phytoplankton to utilize available energy to reach the nutritional requirements of growth [18]. Ammonium, as an available energy source that represents more than 80% of nitrogenous nutrients, is preferentially considered during nitrogen uptake [19]. Nitrogen uptake kinetics also demonstrate a strong preference for ammonium over nitrate [20]. However, many factors affect phytoplankton nutrient uptake. For example, bacterial activities with inorganic nutrients influence the total phytoplankton uptake rate [21]. The temperature dependence of nitrogen preference in microbial plankton, especially in marine phytoplankton, could have far-reaching implications for biogeochemical nutrient cycling on a global scale [22]. The uptake of oxidized and reduced forms of nitrogen can be separated in time and space due to their association with distinct phytoplankton groups [23]. However, the combined effects of warming and eutrophication on phytoplankton nitrogen uptake and the nitrogen cycle require further investigation.
To obtain a more mechanistic understanding of the combined effect of warming and eutrophication on the phytoplankton community and nitrogen utilization, we employed a temperature-controlled outdoor mesocosm experiment during the summer to investigate the combined effects of gradually increasing temperatures and eutrophication perturbations on the phytoplankton community structure and nitrogen uptake dynamics. A major aim of this study was to elucidate the change pattern of the phytoplankton community and nitrogen uptake dynamics in response to increasing levels of both warming and eutrophication. We hypothesized that warming and eutrophication strengthen competitive interaction among different phytoplankton taxa, thereby increasing overall phytoplankton biomass. Therefore, we predicted that both warming and eutrophication may, in different ways, increase the nitrogen uptake dynamics of phytoplankton, and the combined effects may be greater than the sum of the individual effects, but not multiplicative as other studies found [20,24].
2. Methods
2.1. Mesocosm Establishment
The climate-change mesocosm experiment was carried out at the Huazhong Agricultural University in Wuhan City, Central China (30°29′ N, 114°22′ E). It consisted of 24 outdoor polyethylene-insulated mesocosms (diameter = 1.5 m, height = 1.4 m). Each mesocosm had a total capacity of approximately 2500 L. In late December 2013, sediments were collected with a Peterson grab sampler at the top few centimeters of a pelagic area in Lake Liangzihu (30°11′3″ N, 114°37′59″ E). This area had low amounts of nutrients (concentrations of total nitrogen (TN) and total phosphorus (TP) were about 0.432 and 0.023 mg L−1, respectively) in lake water, and was rich with macrophytes. The sediments were loaded into pre-cleaned containers and immediately transported to the experimental mesocosms after sufficient mixing. All experimental mesocosms were filled with mixed lake sediments up to 10 cm high and water up to 1 m high. The mesocosm water consisted of water collected from Lake Nanhu (12.5%) and tap water (87.5%) to simulate mesotrophic lake (the concentrations of TN and TP were 3.250 and 0.198 mg L−1, respectively, in Lake Nanhu). The average TN and TP concentrations in control mesocosms were 0.464 and 0.059 mg L−1, respectively, during the experiment period (Table 1). Prior to the addition of water, water collected from Lake Nanhu was flushed through a 20-μm plankton mesh to eliminate phytoplankton, i.e., to make sure that all phytoplankton originated from the sediment. Aquarium heaters (1000 W) were used to increase the water temperature in the temperature investigations. The temperature inside each mesocosm (both heated and unheated) was controlled by a computer system equipped with temperature sensors located at a water depth of 0.5 m. The system controlled and adjusted each temperature-elevated enclosure individually based on the mean of the control temperature, which was sensed every 1 s. During this period, evaporation losses from the mesocosms were replaced with tap water when not compensated for by rainfall.
Four assigned treatments, replicated six times, were randomly placed in a 10 m × 20 m outdoor area, and consisted of: (C) controls mimicking the concurrent state in Lake Liangzihu with respect to temperature and nutrient level; (T) an increase in temperature of 4.5 °C compared with the control; (P) the addition of 50 μg L−1 phosphate (KH2PO4) every 2 weeks, mimicking the eutrophication process of Lake Liangzihu; and (T + P) a combination of both factors, which constituted a future scenario with respect to temperature and phosphorus content.
2.2. Sampling and Analysis
All phytoplankton and zooplankton samples were collected and nitrogen uptake experiments were conducted in July and August 2014 (Figure 1). Water samples were obtained from each tank using a 1-m-long Plexiglas tube with a 70-mm diameter. The samples were mixed in a bucket. Three tube samples were collected along the diameter of each enclosure; this pooled water sample was used for analysis of nutrients, chlorophyll-a, phytoplankton abundance, and zooplankton abundance. Dissolved oxygen (DO), pH, and conductivity were measured with HACH HQD Portable Meters (HQ60d, HACH, Loveland, CO, USA). Total phosphorus (TP) and total nitrogen (TN) were measured using the methods proposed by Reference [25]. Chlorophyll-a (Chl-a) was determined by water filtration on Whatman GF/C filters and spectrophotometric analysis after acetone extraction [26]. The water for phytoplankton and rotifer analysis was subsampled from the mixed sample, placed into a 100-mL glass bottle, and preserved in Lugol’s acid solution for further analysis in the laboratory. Phytoplankton were counted (at least up to 200 cells) and identified at the genus level [27] using tubular chambers and an inverted microscope (Olympus SZ-40, Olympus Corporation, Tokyo, Japan). Zooplankton (cladocerans and copepods) samples were collected by filtering 10 L of initial water through a 112-μm plankton mesh and preserved with 4% Lugol’s acid solution (v/v) for later enumeration at 10× magnification (Olympus SZ-40). The abundances and genus of rotifers were determined using an inverted microscope (Olympus SZ-40) at 100× magnification.
2.3. Nitrogen Uptake Experiments
The collected water was dispensed in 3-L polyvinyl bottles and used to prepare the following three treatments for C, T, P, and T + P: Control (no addition), nitrate (addition of 98% atom 15N-NaNO3), and ammonium (addition of 98% atom 15N-NH4Cl). The bottle was added with 15N-labeled sodium nitrate or 15N-labeled ammonium chloride (10% of the nitrate or ammonium concentration in each tank). Procedures in the tracer technique were then performed.
2.4. Kinetics of Nitrogen Uptake
The treatment set-up and collected water samples were the same for the nitrogen uptake experiment. The bottle for each treatment was supplemented with 15N-labeled sodium nitrate or 15N-labelled ammonium chloride at the following final concentrations: 0.05, 0.1, 0.5, 1.0, 2.0, 5.0, and 10.0 μmol/L. Procedures in the tracer technique were then performed.
The relative uptake rate (V h−1) was determined by the equation used by Dugdale and Goering (1967) and Dugdale and Wilkerson (1986) [28,29]:
where 15Ns is the atom % of 15N in the sample, 15Nn is the natural abundance of 15N, 15Nenr is the initially labeled atom % of 15N, and T is the incubation time.
The absolute uptake rate (ρ; μmol L−1 h−1) [28,29] was determined as follows:
where PN is the particulate nitrogen in the sample.
ρ = V × PN,
The relative preference index (RPI) was calculated as follows [29]:
where ρ (A) is the cellular ammonium or nitrate uptake rate, ρ (N) is the sum of cellular ammonium and nitrate uptake rates, A is the ambient concentration of ammonium or nitrate, and N is the sum of ambient concentrations of ammonium and nitrate.
The turnover time (TT) was determined with the equation used by Gu and Alexander (1993) [30]:
The Michaelis–Menten equation is described by [31]
where Vmax is the maximum uptake rate, Ks is the half-saturation constant and acts as an index of the affinity to the substrate (nitrate, ammonium, etc.), and S is the equilibrium concentration.
2.5. Tracer Techniques
The 15N tracer techniques were applied in our experimental mesocosms to simultaneously examine the effects of summer warming and eutrophication on phytoplankton nitrogen uptake and dynamics during the growing season. We employed the tracer method described by Dugdale and Goering (1967) [28]. Mixed water was collected by flushing through a net (mesh size: 20 μm) to avoid uncontrolled introduction of vertebrates and fish. The water was placed in a 1-L polyvinyl bottle and supplemented with 15N-labeled nitrogen compounds, such as 15N-NaNO3 (98% atom 15N) and 15N-NH4Cl (98% atom 15N). The sample was incubated around the depth of 0.5 m in our mesocosm systems for 4 h using saturated HgCl solution to terminate the reaction. The incubated water sample was filtered through Whatman GF/C glass filters to obtain particulate matter (phytoplankton in the mesocosm system). The Whatman GF/C filter was dried at 60 °C for 48 h and scraped using a scalpel to obtain particulate matter. Dried filters were loaded into tin capsules and analyzed for 15N content with a Delta Plus (Finnigan, Palo Alto, CA, USA) continuous flow isotope ratio mass spectrometer (CF-IRMS) directly coupled to an NC2500 elemental analyzer (Carlo Erba, Italy). The reproducibility of several samples and standards (NH4CI) was within 0.03%.
3. Results
3.1. Water Chemistry in Mesocosms
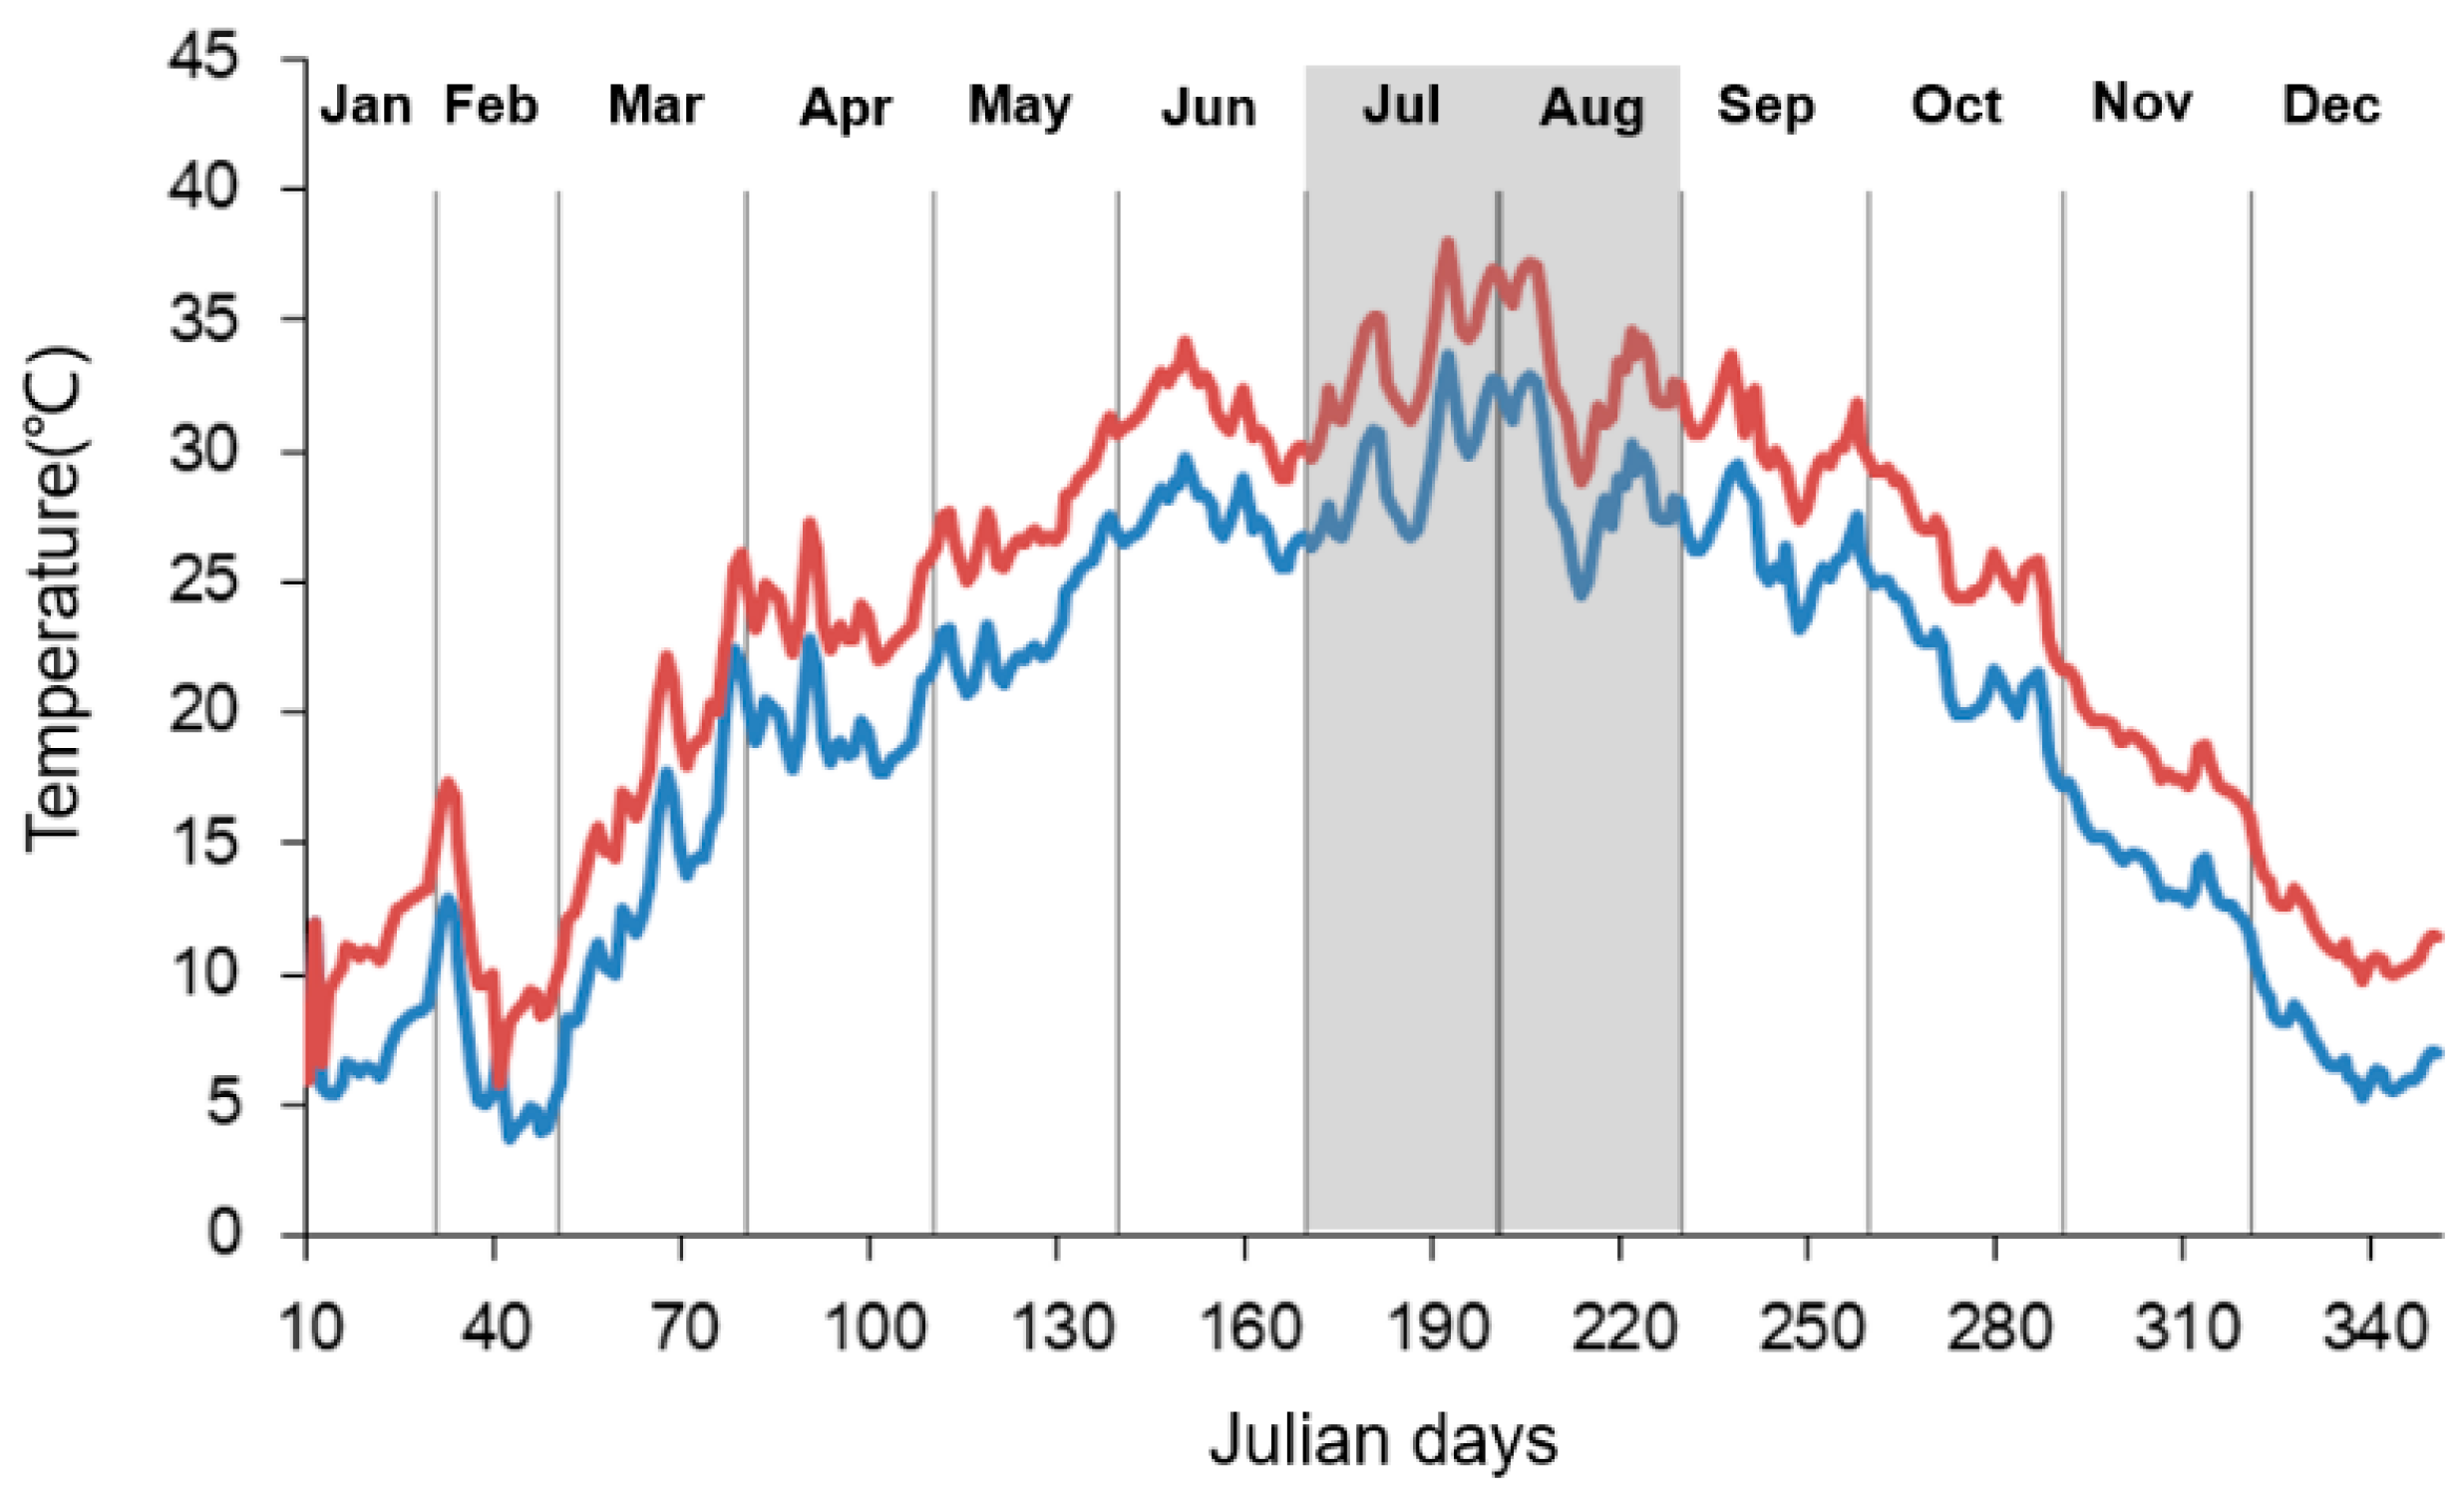
The annual mean water temperature was 19.4 °C in the ambient temperature mesocosms. The daily mean temperature ranged from 3.8 to 33.6 °C, and the heated mesocosms remained 4.5 °C higher than ambient temperature mesocosms (Figure 1). In the period of water sampling, the temperature in the ambient mesocosms increased from 24.5 to 33.6 °C between 1 July 2014 and 31 August 2014 (Figure 1). The temperature in the heated mesocosms ranged from 28.9 to 37.9 °C during the same period.
After the addition of phosphorus, the enriched mesocosms exhibited higher weekly mean concentrations of TP and orthophosphate (SRP) than the unenriched mesocosms (Table 1 and Table 2). Warming only influenced conductivity. Nutrient enrichment and warming did not affect weekly mean values of DO, pH, TN, NO3−-N, NH4+-N, and Rotifera (Table 1 and Table 2). Furthermore, our results indicated that elevated temperature and nutrient addition had an augmenting effect on the average number of Cladocera, while Copepoda densities were significantly affected by nutrient addition (Table 1 and Table 2).
3.2. Phytoplankton Community Structure
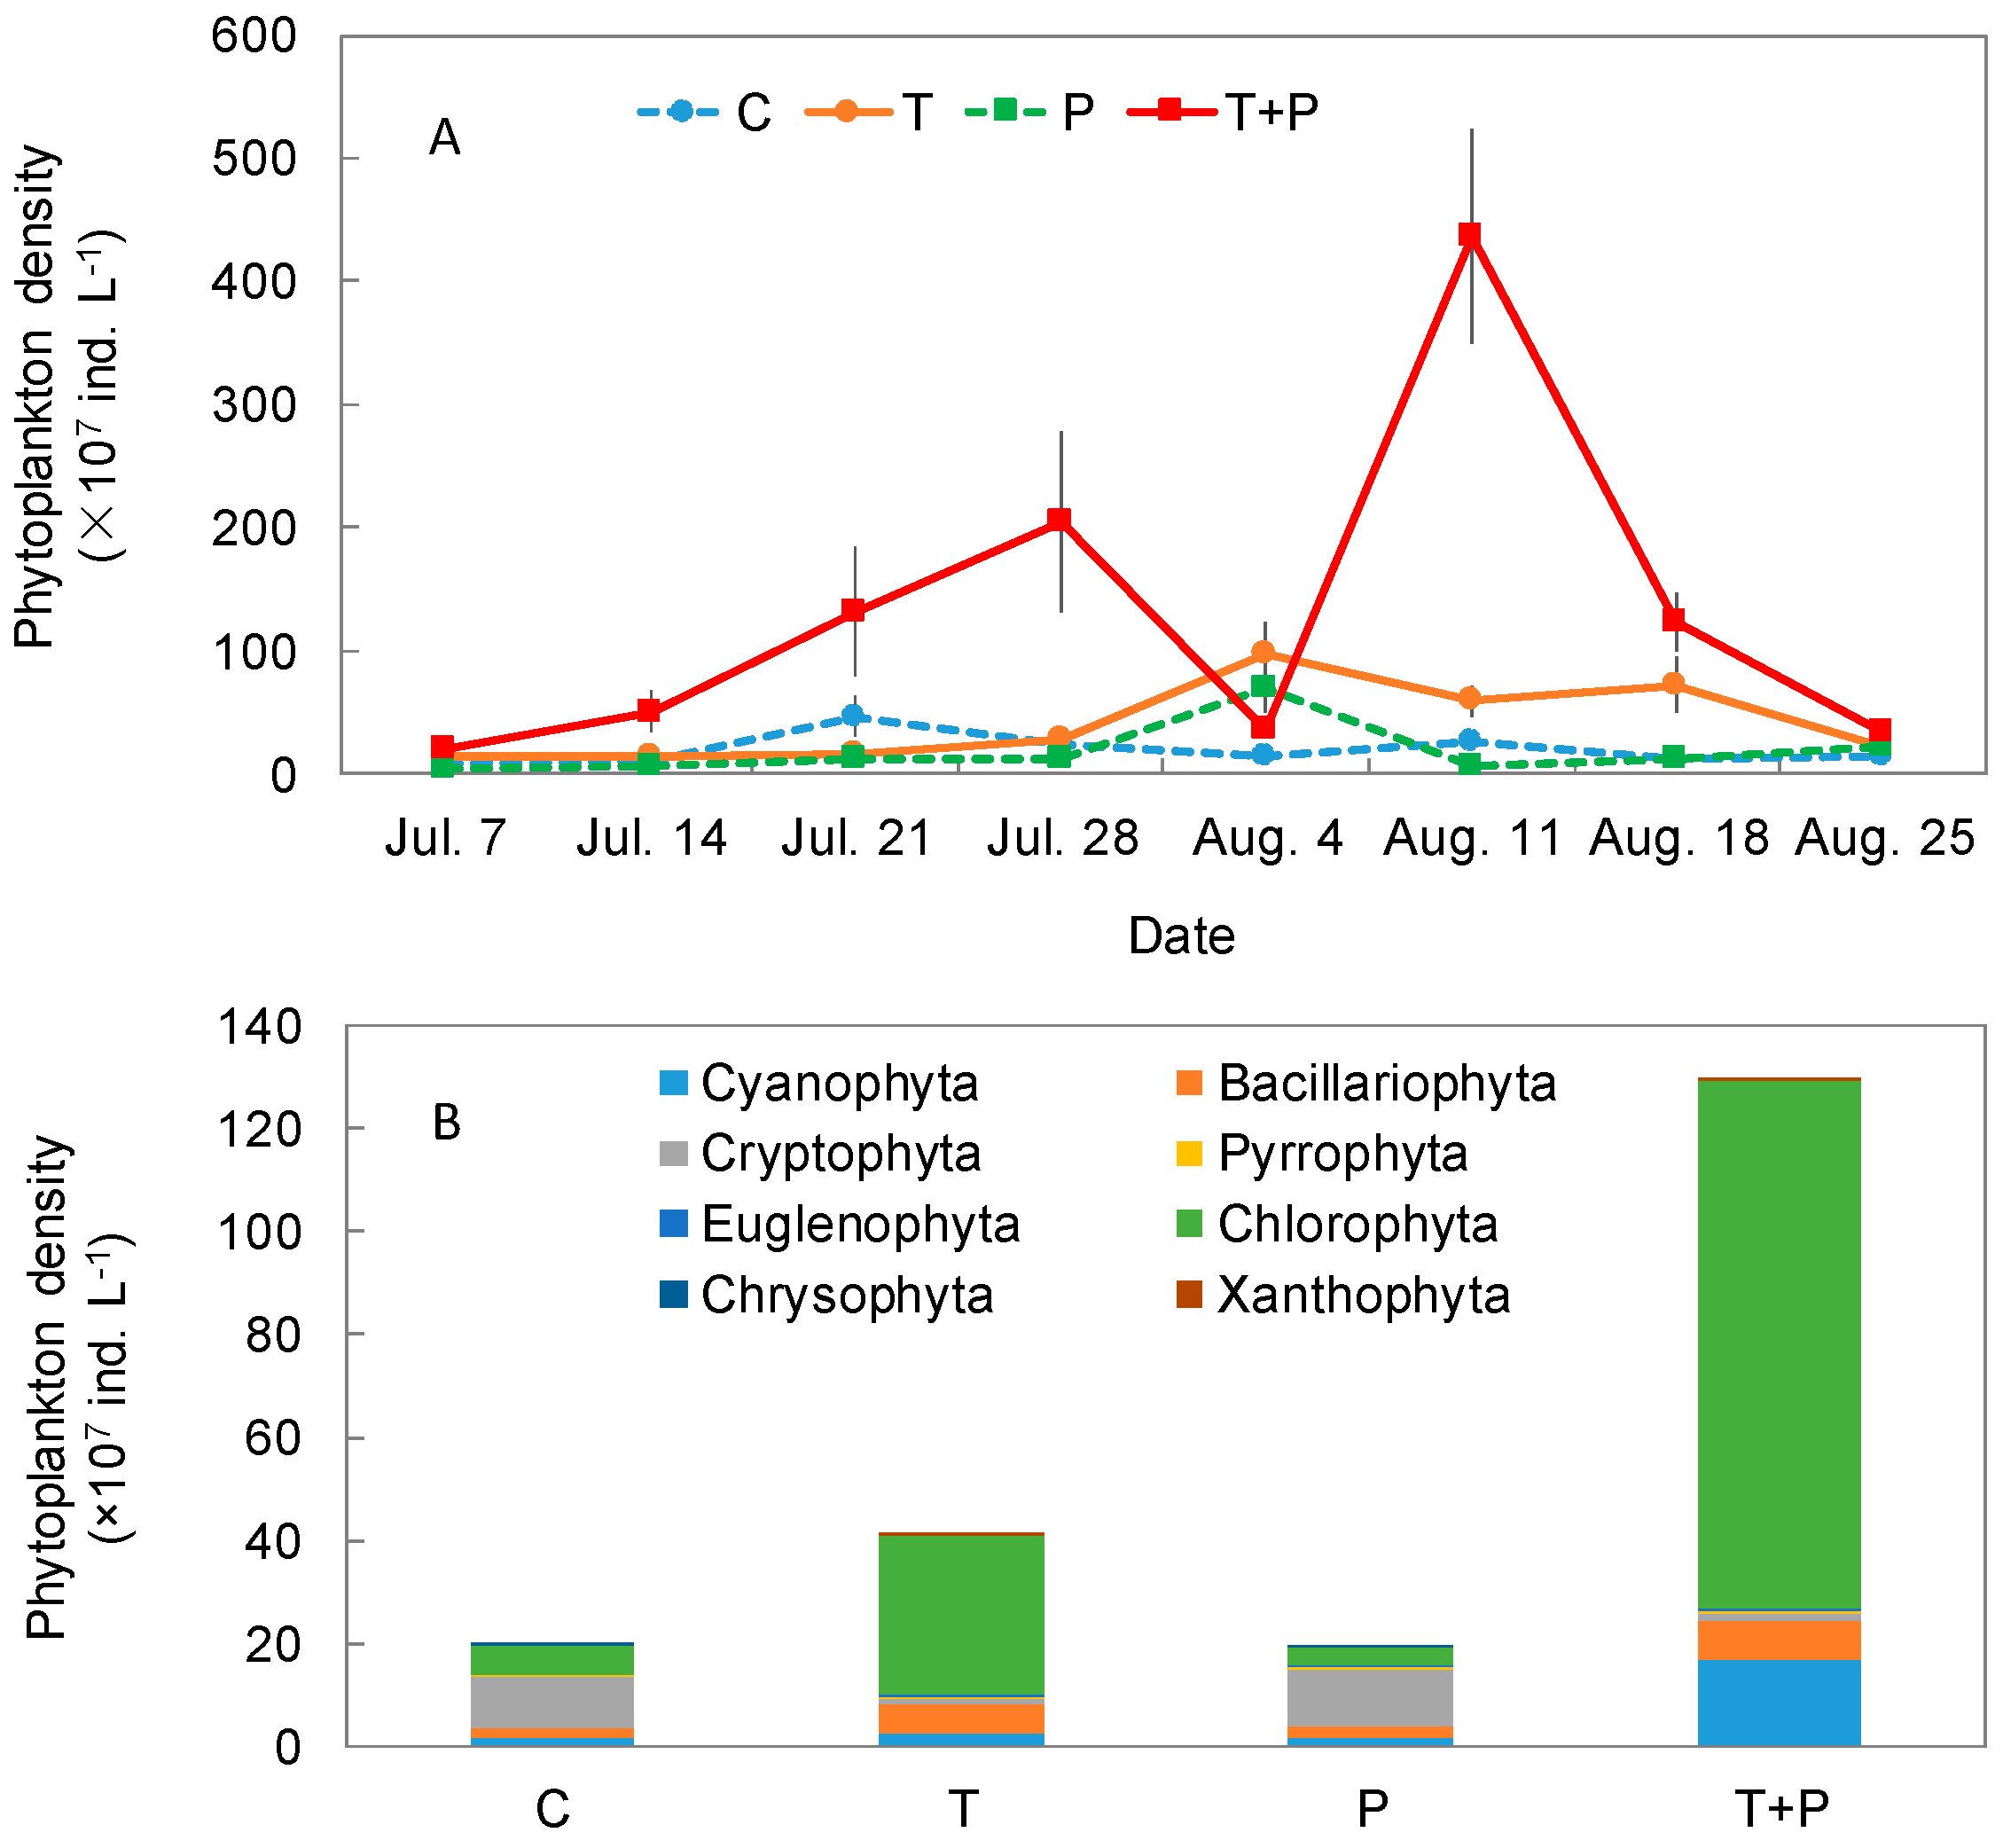
The highest total phytoplankton density was detected for the T + P treatment on 11 August, and sharply decreased during the experimental period (Figure 2A). The maximum phytoplankton density of the T + P treatment was 4.36 × 10⁹ ind. L−1. In the T and P treatments, the phytoplankton density increased from the beginning of the experiment and reached the maximum value on 4 August. The maximum phytoplankton density of the T and P treatments were 9.80 × 10⁸ and 7.02 × 10⁸ ind. L−1, respectively. In the control, the total phytoplankton density remained at a low level during the experiment period and peaked on 21 July (Figure 2A).
Phytoplankton density was co-dominated by Cryptophyta (C 51.2% and P 59.4%) and Chlorophyta (C 28.2% and P 17.7%) in the C and P treatments. Average Cryptophyta densities were 9.96 × 10⁷ ind. L−1 in the control and 1.12 × 10⁸ ind. L−1 in the P treatment. Average Chlorophyta densities of the C and P treatments were 5.48 × 10⁷ ind. L−1 and 3.34 × 10⁷ ind. L−1, respectively. However, the phytoplankton community mainly comprised Chlorophyta (T 75.4% and T + P 79.5%), followed by Cyanophyta (T 5.5% and T + P 13.0%), and Bacillariophyta (T 14.5% and T + P 5.8%) in the T and T + P treatments (Figure 2B). Average Chlorophyta densities in the T and T + P treatments were 3.10 × 10⁷ ind. L−1 and 1.03 × 10⁹ ind. L−1, respectively. The average Cyanophyta density in the T + P treatment (1.68 × 10⁸ ind. L−1) was obviously higher than others. Furthermore, Cyanophyta mainly consisted of Dolichospermum and Chroococcus, and Chlorophyta mostly comprised Chlamydomonas, Closterium, and Cosmarium. Bacillariophyta consisted of Melosira, Navicula, and Cyclotella. Cryptophyta consisted of Cryptomonas and Chroomonas in our mesocosms.
3.3. Effects on Dynamics of Phytoplankton Nitrogen Uptake
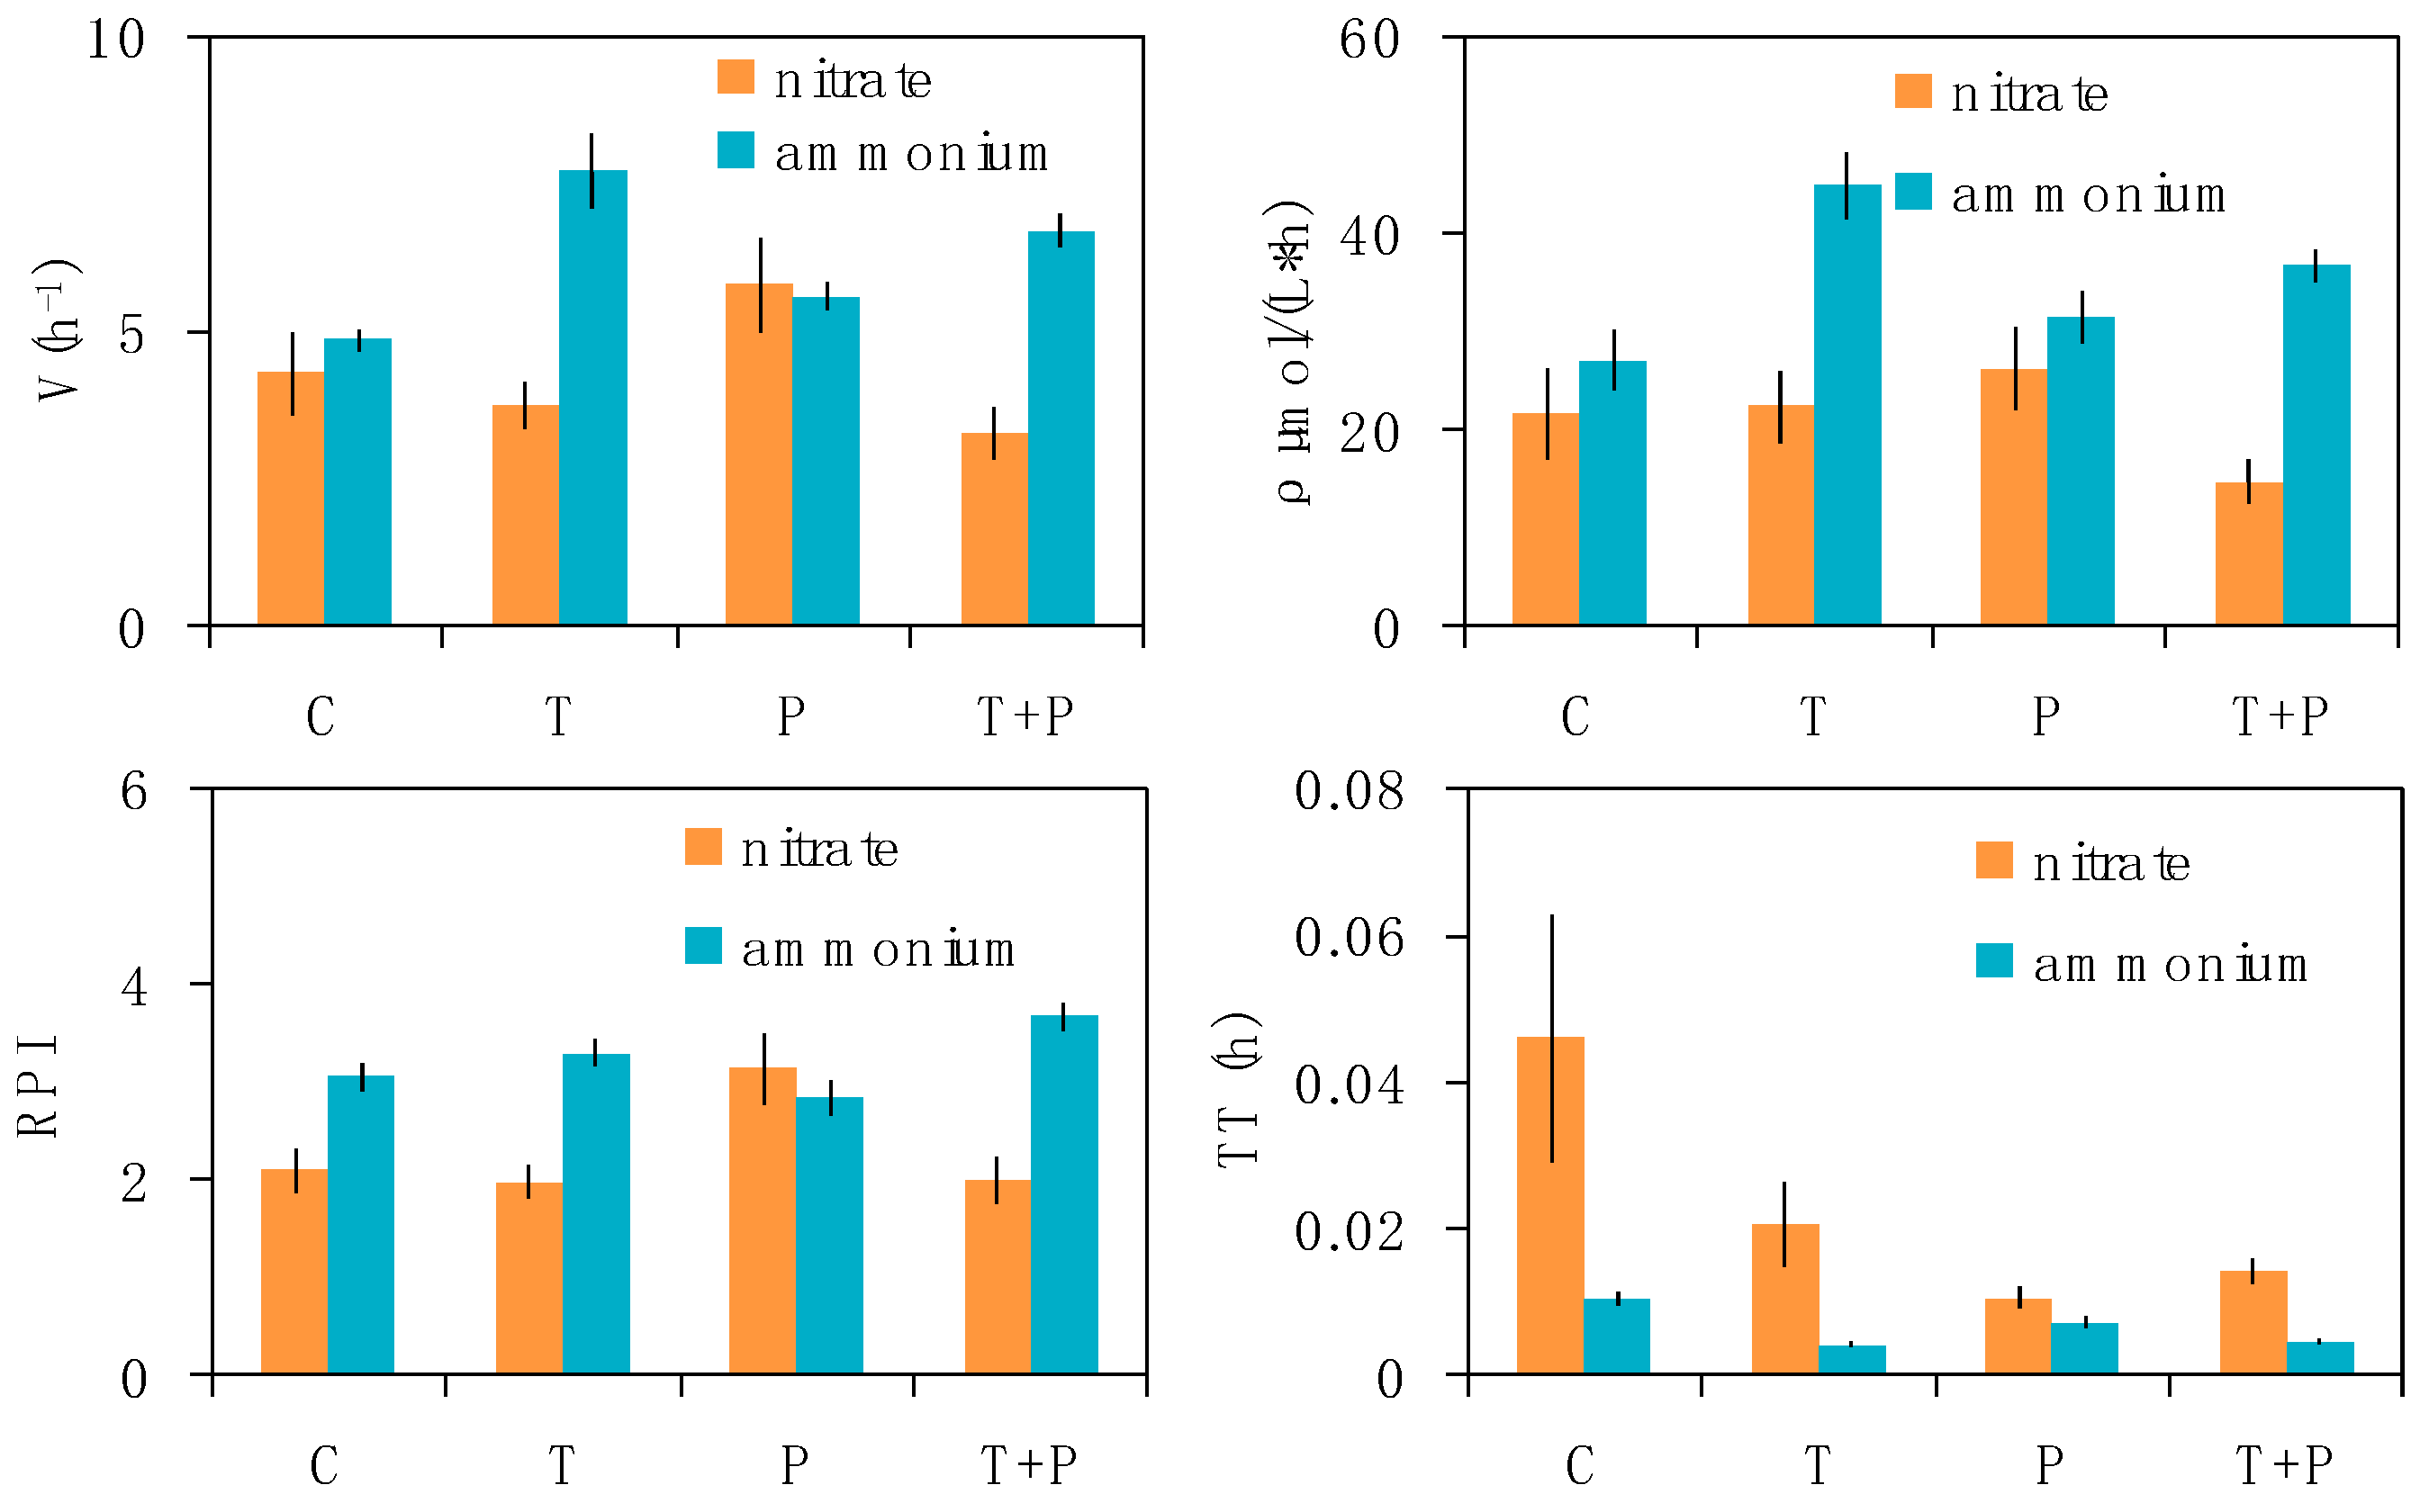
The estimated phytoplankton nitrogen uptake parameters in the four treatments are summarized in Figure 3. The relative uptake velocity (V) of nitrate was slightly higher in the P treatment (VP = 5.79 ± 0.81 h−1) than that in the other treatments (P > 0.05). Phosphorus addition may increase the relative uptake velocity of nitrate. The relative uptake velocity of ammonium was higher in the T treatment (P < 0.05) than that in the control. Warming significantly increased the phytoplankton ammonium uptake velocity. The relative uptake velocity of ammonium in the T and T + P treatments was twice as high as that of nitrate. The absolute uptake velocity (ρ) values of nitrate were highest in the P treatment (26.26 ± 4.17 μmol L−1 h−1) and lowest in the T + P treatment (14.67 ± 2.21 μmol L−1 h−1). The absolute uptake velocities of ammonium were ρC = 27.14 ± 2.97, ρT = 44.95 ± 3.37, ρP = 31.61 ± 2.66, and ρTP = 36.82 ± 1.69 μmol L−1 h−1 (ρT > ρTP > ρP > ρC). The phytoplankton absolute uptake velocity of ammonium was 1.20–2.51 times higher than that of nitrate. The maximum RPI values of nitrate were 3.14 ± 0.36 in the P treatment, while the maximum RPI values of ammonium were 3.68 ± 0.14 in the T + P treatment. The RPI of ammonium was higher than that of nitrate in all treatments except in the P treatment. The TT of ammonium was relatively lower than that of nitrate in all treatments. Therefore, the addition of phosphorus slightly increased the phytoplankton nitrate uptake velocity and the relative preference index, but decreased the nitrate TT. Warming relatively increased the ammonium uptake velocity and RPI, but decreased the ammonium TT, thereby inhibiting phytoplankton nitrate uptake.
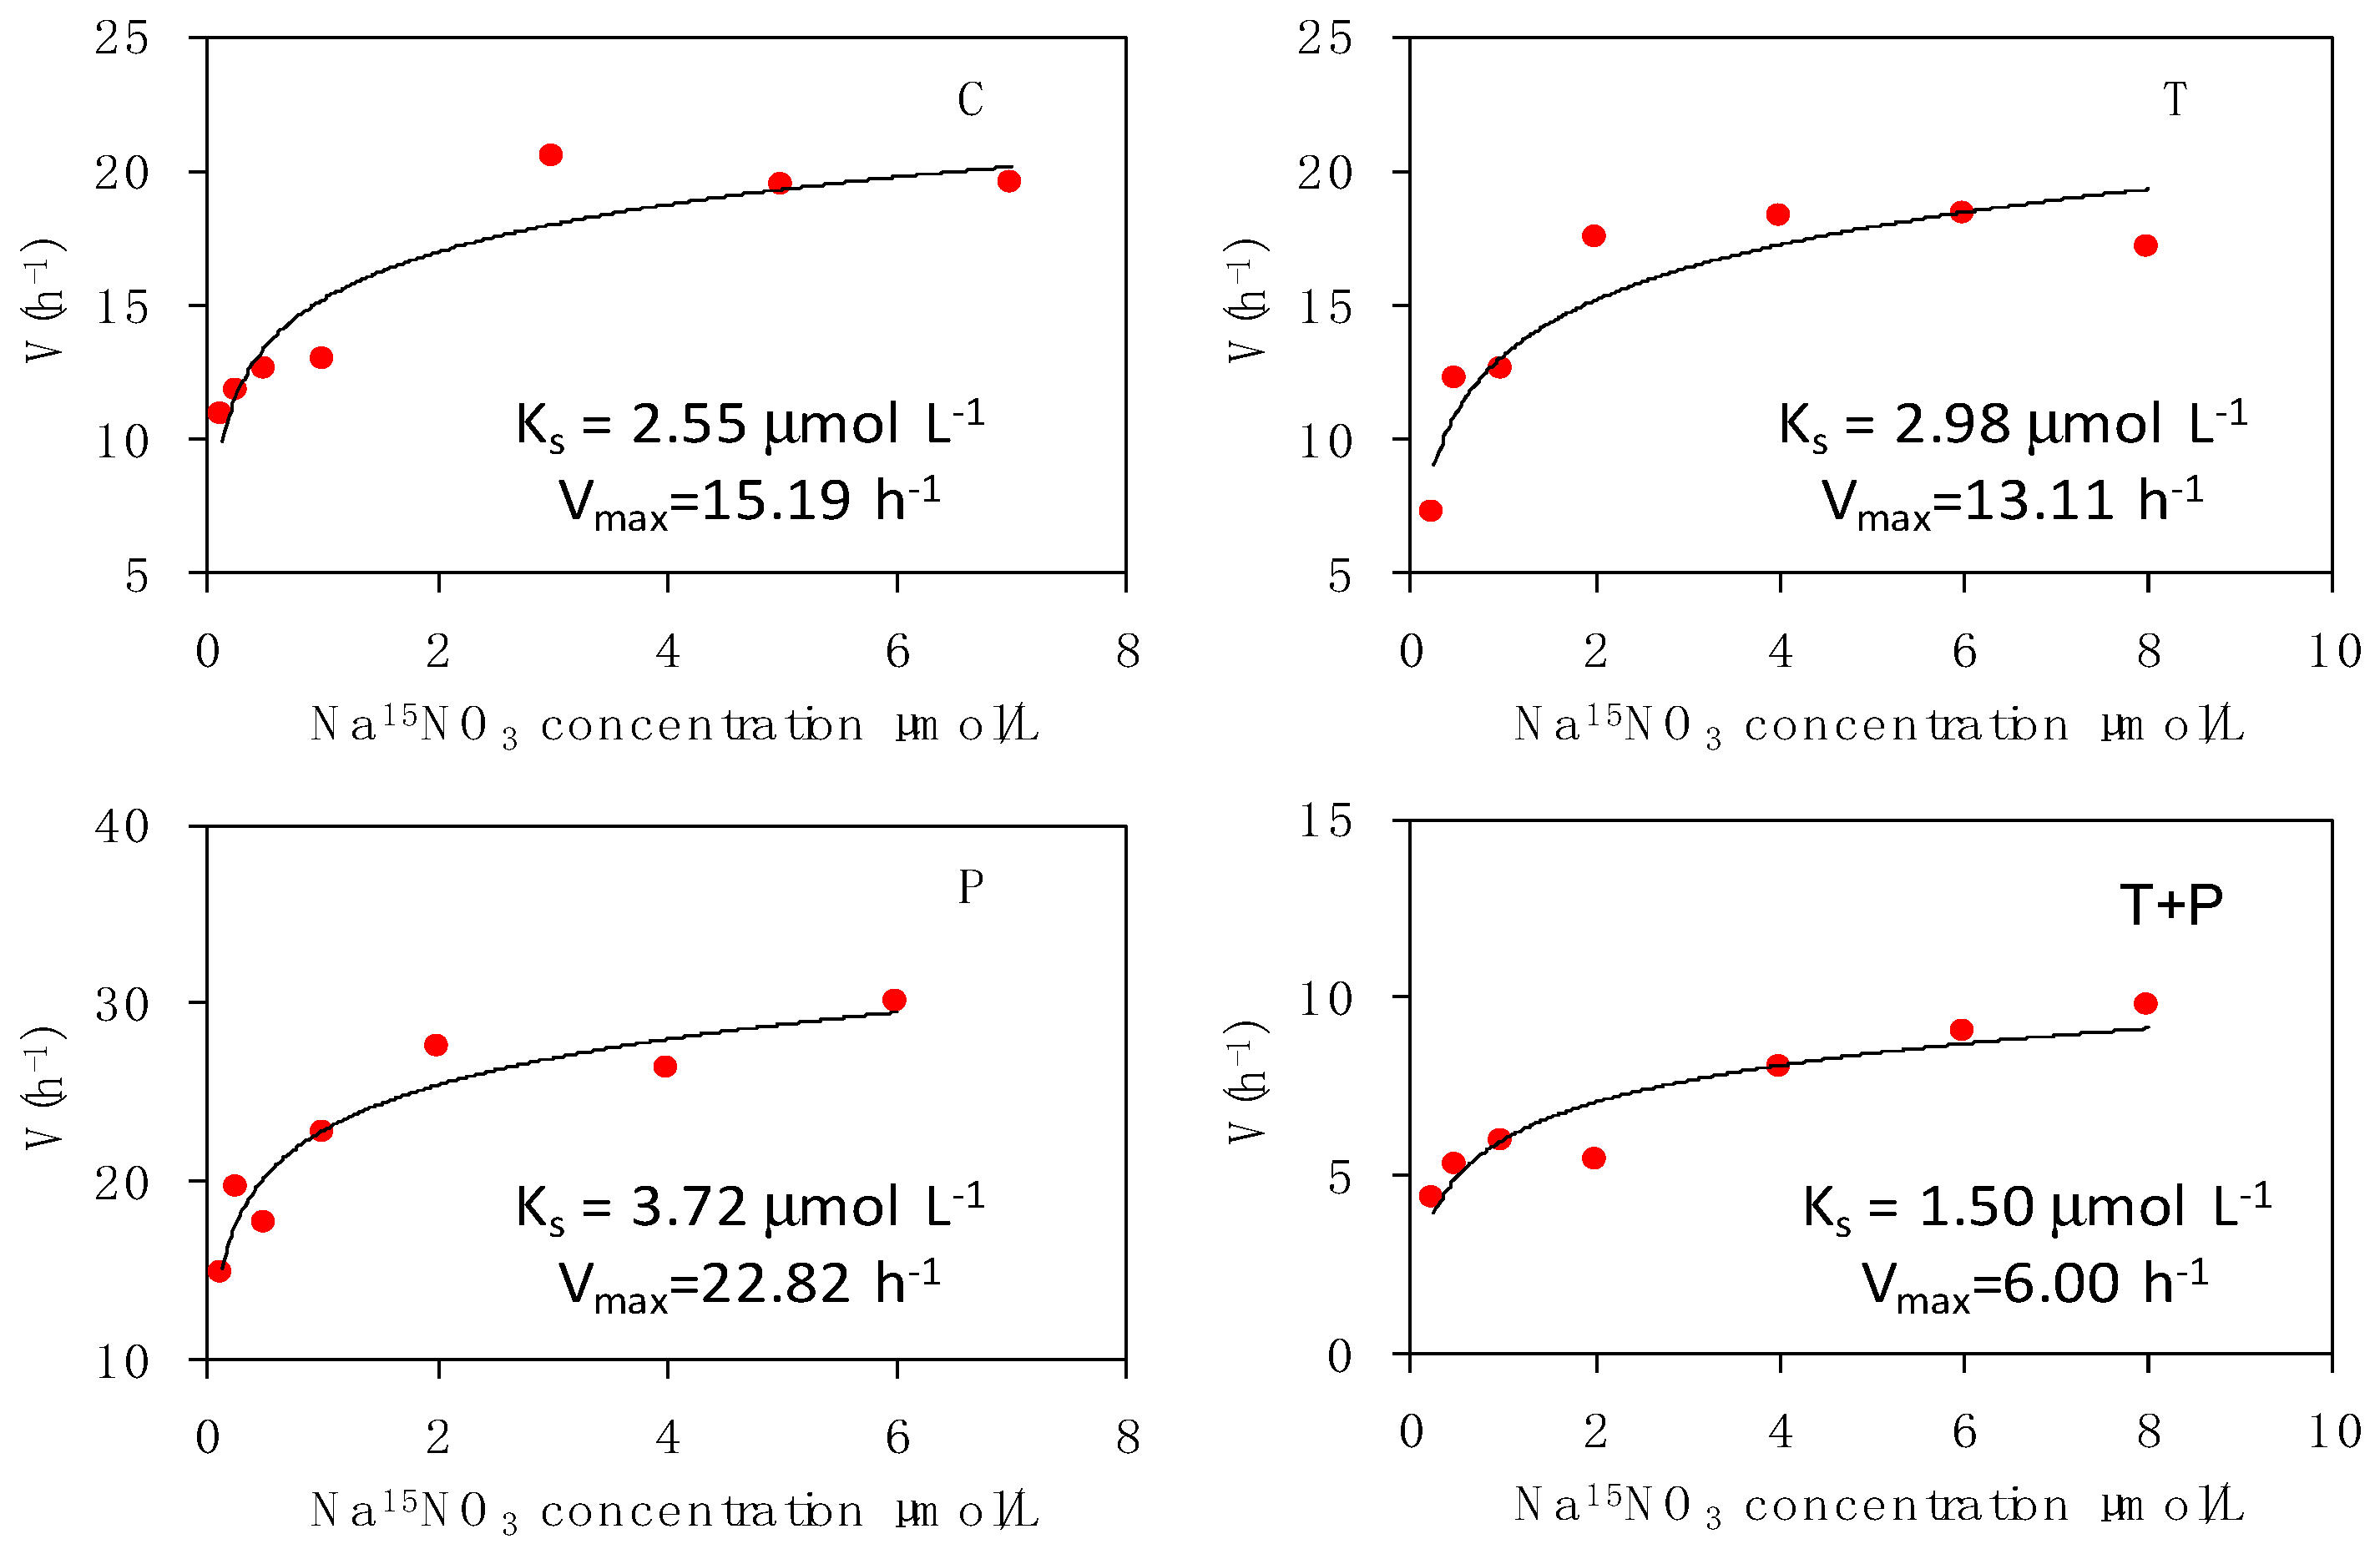
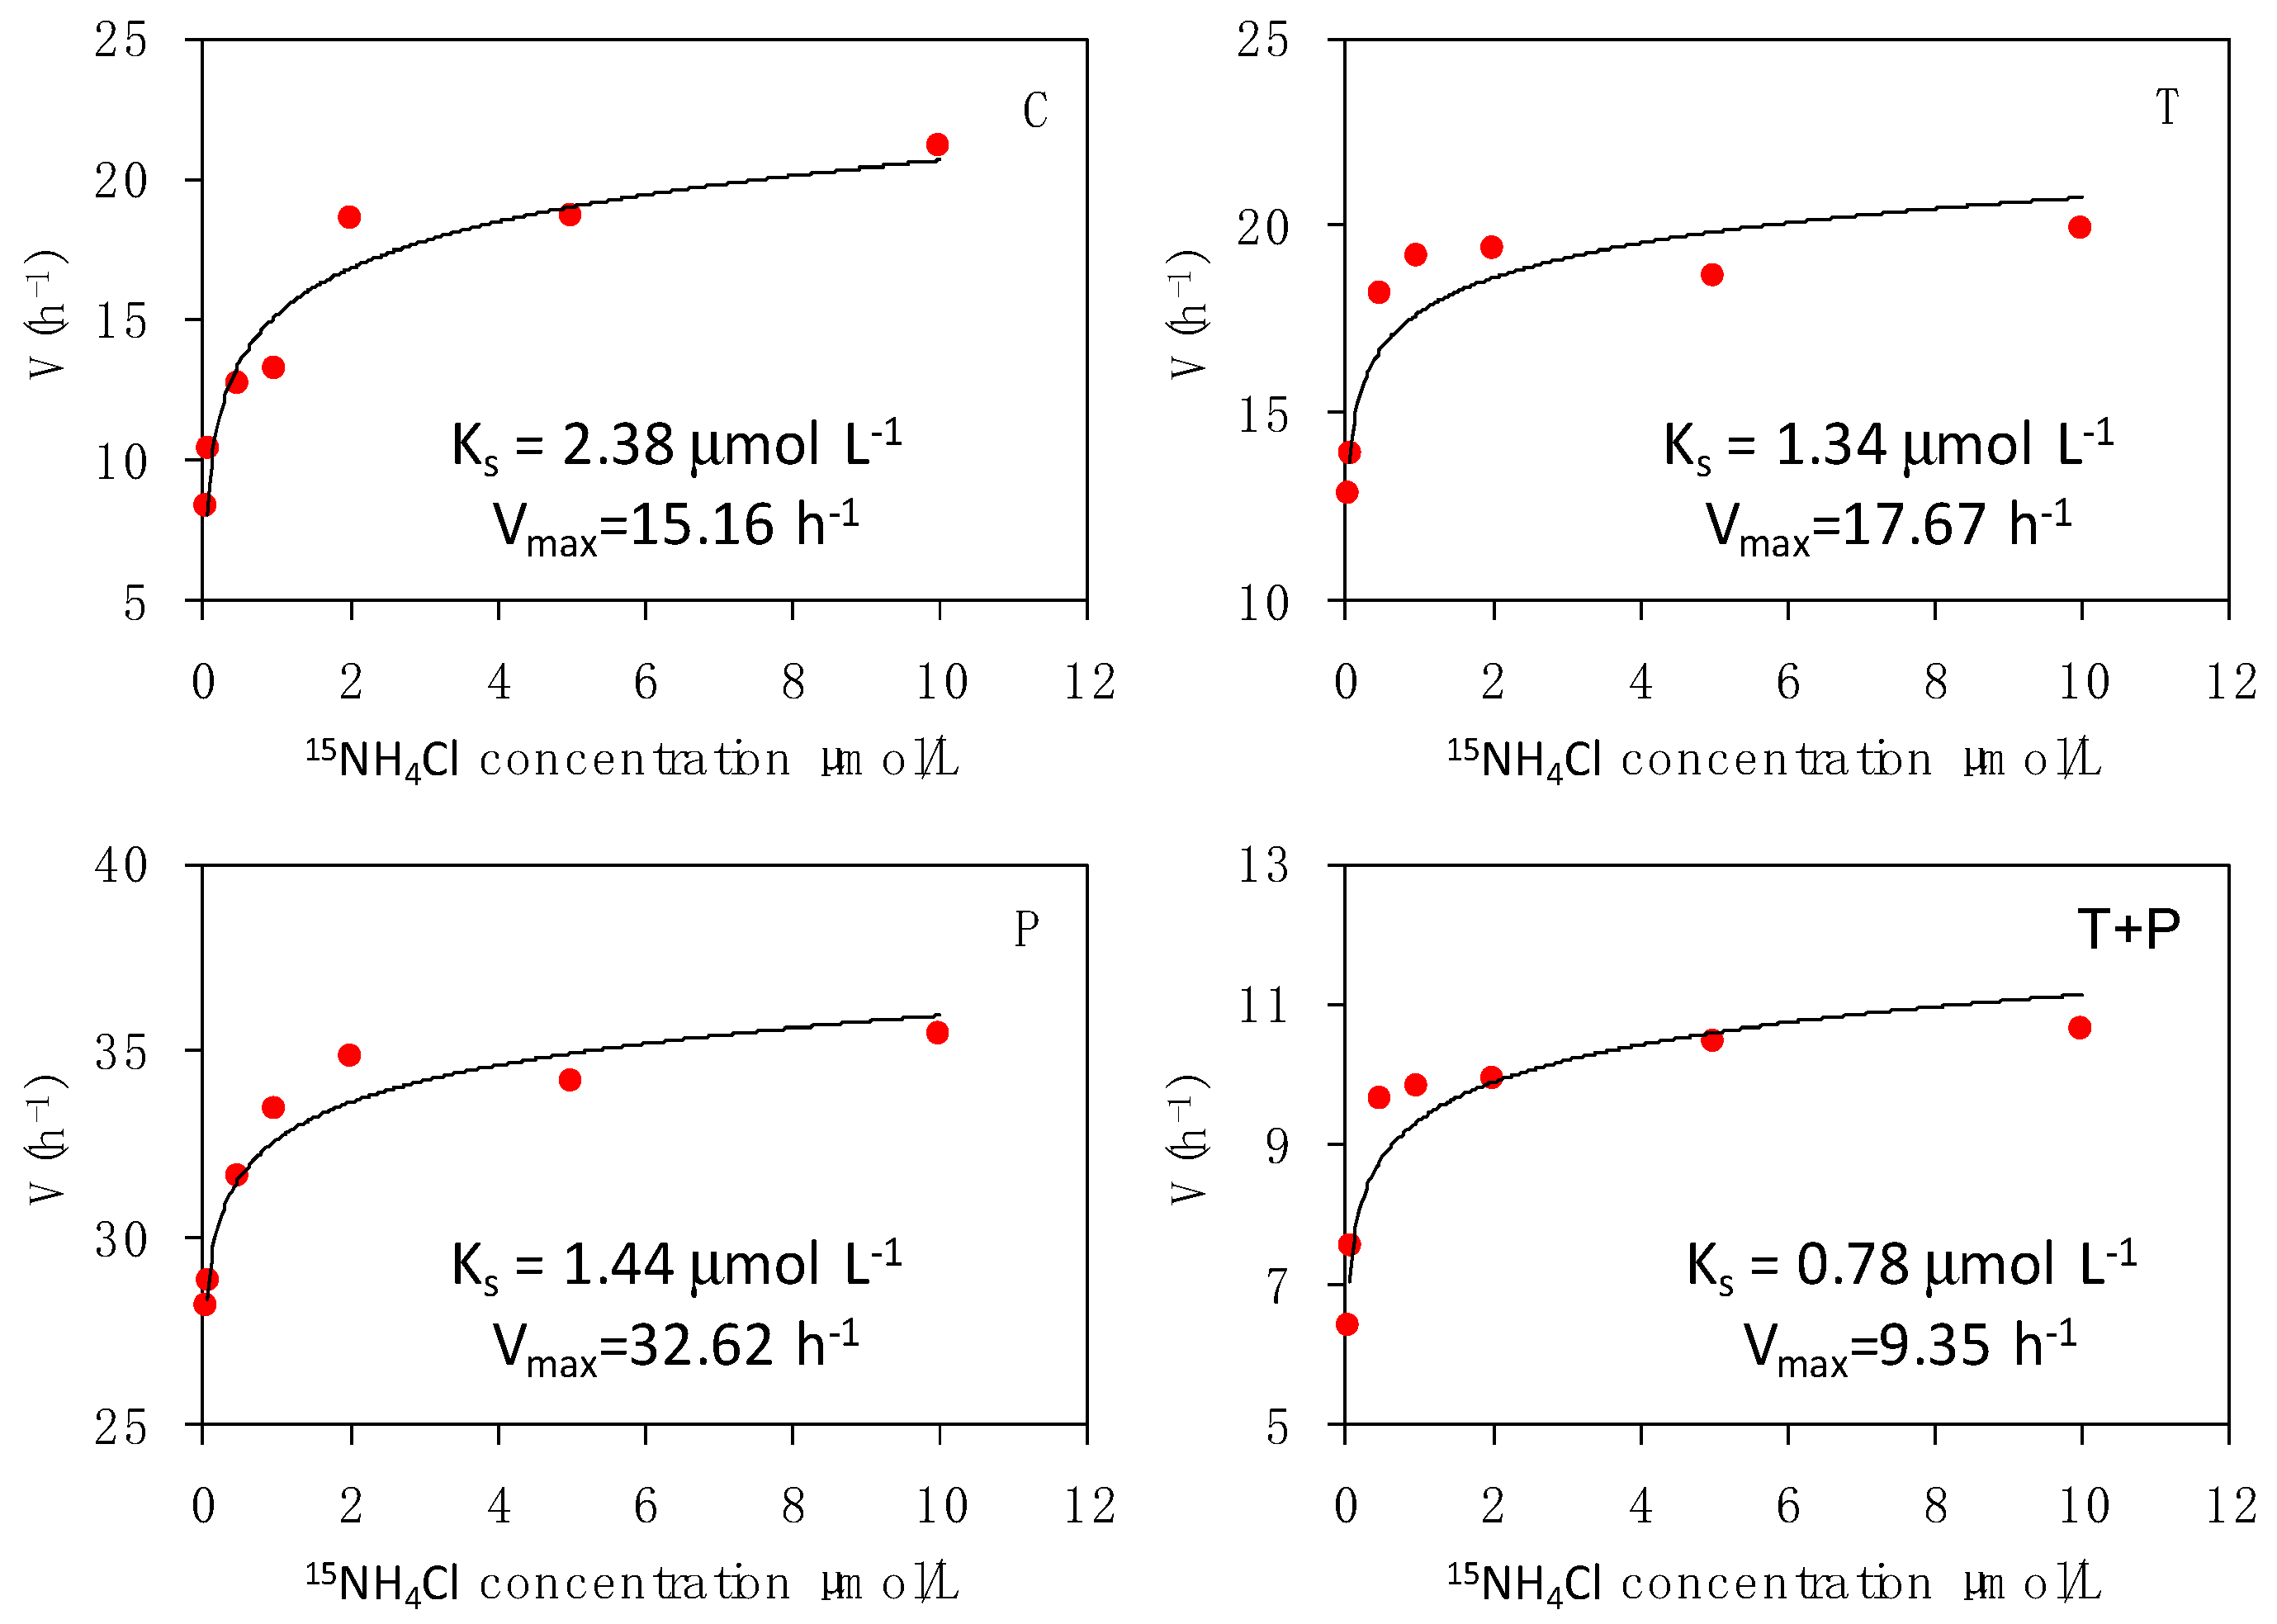
The relationship of phytoplankton uptake rates of nitrate and ammonium with the substrate concentrations followed the Mickaelis–Menten kinetics. The estimated kinetic parameters for nitrate and ammonium uptakes are presented in Figure 4 and Figure 5, respectively. The maximum uptake rate (Vmax) of nitrate was higher in the P treatment (Vmax-P = 22.82 h−1) than that in the other treatments. The maximum uptake velocity of nitrate decreased with warming. The nitrate–substrate curves demonstrated pronounced maximum uptake velocity in the T and T + P treatments; the velocity was 1.16–2.53 times lower than that in the C treatment. The maximum uptake velocity of ammonium was similar to nitrate in different treatments; the maximum and minimum values appeared in the P (Vmax-P = 32.62 h−1) and T + P (Vmax-TP = 9.35 h−1) treatments. The half-saturation constant (Ks) of nitrate and ammonium were the lowest in the T + P treatment (Ks-TP = 1.50 and Ks-TP = 0.78 μmol L−1). Warming may result in a high affinity for inorganic nitrogen, as indicated by the low half-saturation constant (Ks) for the uptake of nitrogen, especially that of ammonium.
4. Discussion
4.1. Effects of Nutrients and Temperature on Phytoplankton Community Structure
In this study, the effects of temperature and the addition of phosphorus on the total density of phytoplankton were related to species composition. Warming changed the phytoplankton community by significantly decreasing the relative number of Cryptophyta, and increasing that of Chlorophyta; in particular, the former was the most abundant taxa in the C and P treatments in the summer. Field studies in freshwater and marine systems suggested that phytoplankton appearance varies in response to increases in water temperature [4,5,32,33]. However, the appearance of species succession in the natural habitat under the influence of climate warming is inconsistent among all functional groups [34,35]. The general trend in nature indicates that warming avails small-sized algae [34,36,37]. Studies reported the superiority of Cyanophyta increases during the summer resulting in their almost monospecific occurrence in many lakes [11,33,38,39], and the abundance of these species increases with warming [33]. In contrast, Moss et al. [40] reported that warming did not increase cyanobacteria abundance, but altered the community composition. Some researchers generally proposed that nutrients or trophic interactions are more influential on the structure of phytoplankton communities than temperature changes [41]. For example, due to their capacity for N-fixing in low N:P lakes, cyanobacteria could dominate in a low N-loading environment [11]. Meanwhile, environmental conditions (catchment area, surrounding soils, slopes, depth of the water body, hydrological regime, etc.) are also critical factors influencing phytoplankton communities [34,40,42]. Some phytoplankton species that are isolated from inland water areas exhibit endurance to high temperatures. In particular, Scenedesmus can proliferate at 40 °C and rapidly adjust its cellular physiology, metabolism, and growth in response to large increases in growth temperature [43,44]. In the same way, the cosmopolitan Dyctiosphaerium can also tolerate a wide range of temperatures, and thus, exhibits rapid genetic adaptation [45,46]. Therefore, eutrophication could be exacerbated by warming, which, when combined with the addition of phosphorus, could promote the growth and biomass of phytoplankton [12,17].
In addition to the bottom-up process controlling phytoplankton composition and succession, zooplankton can also affect phytoplankton population dynamics known as the top-down process [47]. A higher biomass of phytoplankton is usually consistent with a lower mean biomass of zooplankton, particularly herbivorous Cladocera, which grazes algal biomass [47,48]. As expected, elevated temperatures and the addition of phosphorus had an amplifying effect on Cladocera abundance during our experimental period, which may contribute significantly to grazing pressure on phytoplankton. However, since Cryptophyta was the best food for all cladocerans [49], the shift of phytoplankton species composition toward Cyanophyta and Chlorophyta reduced the strength of trophic cascade in the T and T + P treatments. Therefore, our data suggest that the combined effects of rising temperatures and eutrophication may boost Cyanophyta and Chlorophyta dominance in shallow lakes.
4.2. Effects on Dynamics of Phytoplankton Nitrogen Uptake
The addition of phosphorus slightly increased the phytoplankton nitrate uptake velocity (V and ρ) and RPI, but decreased the nitrate uptake TT. Warming relatively increased the ammonium uptake velocity and RPI, but decreased the ammonium TT, thereby inhibiting phytoplankton nitrate uptake. Theoretically, regenerated ammonium-based production dominates the nitrogenous nutrition of phytoplankton [42]. Ammonium uptake accounts for about 60% of the total nitrate and ammonium utilization; as such, the uptake of inorganic nitrogen is mostly based on ammonium. The specific uptake rate and transport rate of ammonium in the present mesocosm system were twice as high as those of nitrate. Previous experiments confirmed that the uptake rate of nitrate would be suppressed by the ammonium concentration [50]. Ammonium exhibits an affinity for phytoplankton and needs low energy for uptake and assimilation [51]. In our mesocosm system, the ammonium concentration was higher than the nitrate concentration, leading to a lower uptake rate of nitrate. A positive relationship exists between nitrate reductase and nitrate uptake in phytoplankton [52]; when dissolved oxygen in the environment cannot sustain nitrification, the nitrate uptake decreases. The high ρ values for competitive selection in algae provide a growth advantage in eutrophic waters [53], thereby increasing the ammonium uptake.
In phytoplankton kinetic studies, the typical parameters are Vmax and Ks. An organism with high Vmax can absorb a particular nutrient at high rates. For Ks, a low substrate concentration for a given transport rate enhances the uptake of that nutrient at low concentrations. Therefore, a competitive advantage originates from a high Vmax or low Ks [30,40,54,55,56,57]. In general, NH4+ had a lower Ks than NO3−, which could be an important adaptation mechanism for the uptake of these substrates; the uptakes of these nutrients are usually low in most water columns [58]. In the present mesocosms, the response of phytoplankton uptake rates for N substrate (NH4+ and NO3−) followed the Michaelis–Menten kinetics. The Vmax for ammonium and nitrate were the highest in the P treatment. The Ks values were relatively lower for ammonium than that for nitrate in different treatments. The synergistic effect of warming and eutrophication may confer an affinity strategy for phytoplankton species, resulting in low Ks and favoring nutrients with low concentrations, especially ammonium.
The change in nitrogen uptake predilection by bloom-forming phytoplankton is related to variations in ambient nitrogen concentrations [58]. For example, the Ks-NO3− values are high in the presence of numerous diatoms in the water column [59]. The results of taxon-specific nitrogen uptake indicated that diatoms were the only planktonic algae group prominently associated with the uptake of oxidized nitrogen (nitrate) [23]. Cryptophyta, filamentous Cyanophyta, and dinoflagellates were distinctly associated with the uptake of reduced nitrogen species, including ammonium, urea, dissolved free amino acids, and adenine [23]. NH4+ and urea were beneficial to non-heterocystous cyanobacteria and Chlorophyta, while NO3− and urea facilitated chlorophytes, some cyanobacteria, and transient blooms of diatoms [60]. Chlorophytes may grow well in various nitrogen sources because of diverse efficient membrane transporters for NO3− and NH4+ [61]. Moreover, fast-growing chlorophytes can efficiently acquire N through diverse N uptake mechanisms [61]. Therefore, the uptake of oxidized and reduced forms of nitrogen can be separated in temporal and spatial changes because of their connection to distinguishing phytoplankton communities [23]. Other environmental variables, such as temperature, light, and availability of trace metals and other macro- and micronutrients, can change the phytoplankton uptake kinetics of nitrogen. Positive relationships were found between the affinity for NH4+ and global warming, whereas an adverse impact was discovered for NO3− [62]. Yin et al. [63] showed that NH4+ suppression of NO3− uptake was light-dependent. Significant negative correlations between NH4+ uptake and TN:TP indicate that nitrogen assimilation in the estuary relies more on the relative balance of nitrogen and phosphorus than on nitrogen or phosphorus alone [64].
This mesocosm experiment, as a conceptual model, presented the integrating effects of temperature and nutrient factors on plankton, and examined the most significant factors that influence plankton in the context of this model [6]. We demonstrated changes in the community structure and nitrogen uptake of the phytoplankton population induced by temperature elevation combined with increasing phosphorus concentration. The combined effect of climate warming and phosphorus nutrient availability on phytoplankton communities should be considered. This study provides evidence for the increasing prevalence of Cyanophyta and Chlorophyta and changing nitrogen cycling in sub-trophic aquatic systems caused by the combined effects of human activities, including unbalanced nutrient enrichment and climate warming. The overall response of lake ecosystems to climatic variation and change is powerful, linking basic research to future challenges and supporting theories for improving lake management [1].
In conclusion, climate change and eutrophication may have a profound impact on the nitrogen circulation and phytoplankton community succession, aggravating the risk of phytoplankton bloom. This research provides experimental evidence that warming and eutrophication could increase the capacity of phytoplankton for NH4+ uptake and their affinity at low substrate concentrations. Thus, the combined effects of climate warming and phosphorus nutrient availability may change the nitrogen cycling of aquatic ecosystems.
Author Contributions
Conceptualization, M.Z. and J.X.; Methodology, M.Z. and J.X.; Software, M.Z. and C.Y.; Validation, M.Z., J.X. and C.Y.; Formal Analysis, M.Z., J.X. and C.Y.; Investigation, C.Y., C.L. and T.W.; Resources, M.Z.; Data Curation, M.Z., C.Y.; Writing-Original Draft Preparation, C.Y.; Writing-Review & Editing, M.Z., J.X. and C.Y.; Visualization, M.Z. and C.Y.; Supervision, M.Z. and J.X.; Project Administration, M.Z.; Funding Acquisition, M.Z. and J.X.
Funding
The study was funded by the National Natural Science Foundation of China (31200359 and 31370473).
Acknowledgments
We would like to thank Jinyu Huang for constructing and maintaining the temperature regulatory system.
Conflicts of Interest
The authors declare no conflict of interest.
References
- Blenckner, T. A conceptual model of climate-related effects on lake ecosystems. Hydrobiologia 2005, 533, 1–14. [Google Scholar] [CrossRef]
- Intergovernmental Panel on Climate Change (IPCC). Climate Change (IPCC). Climate Change 2014: Synthesis Report. In Contribution of Working Groups I, II and III to the Fifth Assessment Report of the Intergovernmental Panel on Climate Change; Cambridge University Press: Cambridge, UK, 2014; p. 8. [Google Scholar]
- Meerhoff, M.; Clemente, J.M.; Mello, F.T.D.; Iglesias, C.; Pedersen, A.R.; Jeppesen, E. Can warm climate-related structure of littoral predator assemblies weaken the clear water state in shallow lakes? J. Glob. Chang. Biol. 2007, 13, 1888–1897. [Google Scholar] [CrossRef]
- Müren, U.; Berglund, J.; Samuelsson, K.; Andersson, A. Potential Effects of Elevated Sea-Water Temperature on Pelagic Food Webs. Hydrobiologia 2005, 545, 153–166. [Google Scholar] [CrossRef]
- O’Connor, M.I.; Piehler, M.F.; Leech, D.M.; Anton, A.; Bruno, J.F. Warming and Resource Availability Shift Food Web Structure and Metabolism. J. PLoS Biol. 2009, 7. [Google Scholar] [CrossRef]
- Markensten, H. Climate Effects on Early Phytoplankton Biomass Over Three Decades Modified by the Morphometry in Connected Lake Basins. Hydrobiologia 2006, 559, 319–329. [Google Scholar] [CrossRef]
- Blenckner, T.; Chen, D.L. Comparison of the impact of regional and North Atlantic atmospheric circulation on an aquatic ecosystem. J. Clim. Res. 2003, 23, 131–136. [Google Scholar] [CrossRef] [Green Version]
- Sommer, U.; Lengfellner, K. Climate change and the timing, magnitude, and composition of the phytoplankton spring bloom. J. Glob. Chang. Biol. 2008, 14, 1199–1208. [Google Scholar] [CrossRef]
- Klauschies, T.; Bauer, B.; Aberle-Malzahn, N.; Sommer, U.; Gaedke, U. Climate change effects on phytoplankton depend on cell size and food web structure. J. Mar. Biol. 2012, 159, 2455–2478. [Google Scholar] [CrossRef] [Green Version]
- Domine, L.M.; Vanni, M.J.; Renwick, W.H. New and regenerated primary production in a productive reservoir ecosystem. J. Can. J. Fish. Aquat. Sci. 2010, 67, 278–287. [Google Scholar] [CrossRef]
- Jeppesen, E.; Kronvang, B.; Olesen, J.E.; Audet, J.; Søndergaard, M.; Hoffmann, C.C.; Andersen, H.E.; Lauridsen, T.L.; Liboriussen, L.; Larsen, S.E.; et al. Climate change effects on nitrogen loading from cultivated catchments in Europe: Implications for nitrogen retention, ecological state of lakes and adaptation. Hydrobiologia 2011, 663, 1–21. [Google Scholar] [CrossRef]
- Domis, L.N.; Van de Waal, D.B.; Helmsing, N.R.; Van Donk, D.E.; Mooij, W.M. Community stoichiometry in a changing world: Combined effects of warming and eutrophication on phytoplankton dynamics. Ecology 2014, 95, 1485–1495. [Google Scholar] [CrossRef] [PubMed]
- Schindler, D.W. Recent advances in the understanding and management of eutrophication. J. Limnol. Oceanogr. 2006, 51, 356–363. [Google Scholar] [CrossRef] [Green Version]
- Smith, V.H.; Joye, S.B.; Howarth, R.W. Eutrophication of Freshwater and Marine Ecosystems. J. Limnol. Oceanogr. 2006, 51, 351–355. [Google Scholar] [CrossRef]
- Hsieh, C.H.; Ishikawa, K.; Sakai, Y.; Ishikawa, T.; Ichise, S.; Yamamoto, Y.; Kuo, T.C.; Park, H.D.; Yamamura, N.; Kumagai, M. Phytoplankton community reorganization driven by eutrophication and warming in Lake Biwa. J. Aquat. Sci. 2010, 72, 467–483. [Google Scholar] [CrossRef]
- Winder, M.; Hunter, D.A. Temporal organization of phytoplankton communities linked to physical forcing. Oecologia 2008, 156, 179–192. [Google Scholar] [CrossRef] [PubMed]
- Elliott, J.A.; Jones, I.D.; Thackeray, S.J. Testing the sensitivity of phytoplankton communities to changes in water temperature and nutrient load, in a temperate lake. Hydrobiologia 2006, 559, 401–411. [Google Scholar] [CrossRef]
- Kudela, R.M.; Cochlan, W.P.; Dugdale, R.C. Carbon and nitrogen uptake response to light by phytoplankton during an upwelling event. J. Plankton Res. 1997, 19, 609–630. [Google Scholar] [CrossRef] [Green Version]
- Elskens, M.; Baeyens, W.; Goeyens, L. Contribution of nitrate to the uptake of nitrogen by phytoplankton in an ocean margin environment. Hydrobiologia 1997, 353, 139–152. [Google Scholar] [CrossRef]
- Seeyave, S.; Probyn, T.; Álvarez-Salgado, X.A.; Figueiras, F.G.; Purdie, D.A.; Barton, E.D.; Lucas, M. Nitrogen uptake of phytoplankton assemblages under contrasting upwelling and downwelling conditions: The Ría de Vigo, NW Iberia. J. Estuarine Coast. Shelf Sci. 2013, 124, 1–12. [Google Scholar] [CrossRef] [Green Version]
- Tungaraza, C.; Brion, N.; Rousseau, V.; Baeyens, W.; Goeyens, L. Influence of bacterial activities on nitrogen uptake rates determined by the application of antibiotics. Oceanologia 2003, 45, 473–489. [Google Scholar]
- Reay, D.S.; Nedwell, D.B.; Priddle, J.; Ellisevans, J.C. Temperature Dependence of Inorganic Nitrogen Uptake: Reduced Affinity for Nitrate at Suboptimal Temperatures in Both Algae and Bacteria. J. Appl. Environ. Microbiol. 1999, 65, 2577–2584. [Google Scholar]
- Berg, G.M.; Balode, M.; Purina, I.; Bekere, S.; Christian, B.; Serge, M. Plankton community composition in relation to availability and uptake of oxidized and reduced nitrogen. J. Aquat. Microb. Ecol. 2003, 30, 263–274. [Google Scholar] [CrossRef] [Green Version]
- Rhee, G.-Y.; Gotham, I.J. The effect of environmental factors on phytoplankton growth: Temperature and the interactions of temperature with nutrient limitation. J. Limnol. Oceanogr. 1981, 26, 635–648. [Google Scholar] [CrossRef] [Green Version]
- Jin, X.C.; Tu, Q.Y. Investigation Specifications for Lake Eutrophication, 2nd ed.; China Environmental Science Press: Beijing, China, 1990; pp. 114–132. [Google Scholar]
- Wilhelm, S.W.; Carberry, M.J.; Eldridge, M.L.; Poorvin, L.; Saxton, M.A.; Doblin, M.A. Marine and freshwater cyanophages in a Laurentian Great Lake: Evidence from infectivity assays and molecular analyses of g20 genes. J. Appl. Environ. Microbiol. 2006, 72, 4957–4963. [Google Scholar] [CrossRef] [PubMed]
- John, D.M.; Whitton, B.A.; Brook, A.J. Freshwater Algal Flora of the British Isles. An. Identification Guide to Freshwater and Terrestrial Algae, 2nd ed.; Cambridge University Press: Cambridge, UK, 2011. [Google Scholar]
- Dugdale, R.C.; Goering, J.J. Uptake of new and regenerated forms of nitrogen in primary productivity. J. Limnol. Oceanogr. 1967, 12, 196–206. [Google Scholar] [CrossRef] [Green Version]
- Dugdale, R.C.; Wilkerson, F.P. The Use of 15N to Measure Nitrogen Uptake in Eutrophic Oceans; Experimental Considerations. J. Limnol. Oceanogr. 1986, 31, 673–689. [Google Scholar] [CrossRef]
- Gu, B.; Alexander, V. Dissolved Nitrogen Uptake by a Cyanobacterial Bloom (Anabaena flos-aquae) in a Subarctic Lake. J. Appl. Environ. Microbiol. 1993, 59, 422–430. [Google Scholar] [CrossRef]
- Gavis, J.; Ferguson, J.F. Kinetics of Carbon Dioxide Uptake by Phytoplankton at High pH. J. Limnol. Oceanogr. 1975, 20, 211–221. [Google Scholar] [CrossRef]
- Cermeño, P.; Dutkiewicz, S.; Harris, R.P.; Follows, M.; Schofield, O.; Falkowski, P.G. The role of nutricline depth in regulating the ocean carbon cycle. Proc. Natl. Acad. Sci. USA 2008, 105, 20344–20349. [Google Scholar] [CrossRef] [PubMed] [Green Version]
- Jöhnk, K.D.; Huisman, J.; Sharples, J.; Sommeijer, B.; Visser, P.M.; Stroom, J.M. Summer heatwaves promote blooms of harmful cyanobacteria. J. Glob. Chang. Biol. 2008, 14, 495–512. [Google Scholar] [CrossRef] [Green Version]
- Finkel, Z.V.; Beardall, J.; Flynn, K.J.; Quigg, A.; Rees, T.A.V.; Raven, J.A. Phytoplankton in a changing world: Cell size and elemental stoichiometry. J. Plankton Res. 2010, 32, 119–137. [Google Scholar] [CrossRef]
- Hays, G.C.; Richardson, A.J.; Robinson, C. Climate change and marine plankton. J. Trends Ecol. Evol. 2005, 20, 337–344. [Google Scholar] [CrossRef] [PubMed]
- Daufresne, M.; Lengfellner, K.; Sommer, U. Global warming benefits the small aquatic ecosystems. Proc. Natl. Acad. Sci. USA 2009, 106, 12788–12793. [Google Scholar] [CrossRef] [PubMed] [Green Version]
- Morán, X.A.G.; Lopez-Urrutia, A.; Calvo-Diaz, A.; Li, W.K.W. Increasing importance of small phytoplankton in a warmer ocean. J. Glob. Chang. Biol. 2010, 16, 1137–1144. [Google Scholar] [CrossRef] [Green Version]
- Dokulil, M.T.; Teubner, K. Cyanobacterial dominance in lakes. Hydrobiologia 2000, 438, 1–12. [Google Scholar] [CrossRef]
- Mooij, W.M.; Hülsmann, S.; Domis, L.N.D.S.; Nolet, B.A.; Bodelier, P.L.E.; Boers, P.C.M.; Pires, L.M.D.; Gons, H.J.; Ibelings, B.W.; Noordhuis, R.; et al. The impact of climate change on lakes in The Netherlands: A review. J. Aquat. Ecol. 2005, 39, 381–400. [Google Scholar] [CrossRef]
- Moss, B.; Mckee, D.; Atkinson, D.; Collings, S.E.; Eaton, J.W.; Gill, A.B.; Harvey, I.; Hatton, K.; Heyes, T.; Wilson, D. How important is climate? Effects of warming, nutrient addition and fish on phytoplankton in shallow lake microcosms. J. Appl. Ecol. 2003, 40, 782–792. [Google Scholar] [CrossRef] [Green Version]
- Mckee, D.; Atkinson, D.; Collings, S.E.; Eaton, J.W.; Gill, A.B.; Harvey, I.; Hatton, K.; Heyes, T.; Wilson, D.; Moss, B. Response of freshwater microcosm communities to nutrients, fish, and elevated temperature during winter and summer. J. Limnol. Oceanogr. 2003, 48, 707–722. [Google Scholar] [CrossRef] [Green Version]
- Hanson, C.E.; Waite, A.M.; Thompson, P.A.; Pattiaratchi, C.B. Phytoplankton community structure and nitrogen nutrition in Leeuwin Current and coastal waters off the Gascoyne region of Western Australia. Deep Sea Res. Part II Top. Stud. Oceanogr. 2007, 54, 902–924. [Google Scholar] [CrossRef]
- Sánchez, J.; Fernández-Sevilla, J.M.; Acién, F.G.; Cerón, M.C.; Pérez-Parra, J.; Molina-Grima, E. Biomass and lutein productivity of Scenedesmus almeriensis: Influence of irradiance, dilution rate and temperature. J. Appl. Microbiol. Biotechnol. 2008, 79, 719–729. [Google Scholar] [CrossRef] [PubMed]
- Staehr, P.; Birkeland, M. Temperature acclimation of growth, photosynthesis and respiration in two mesophilic phytoplankton species. Phycologia 2006, 45, 648–656. [Google Scholar] [CrossRef]
- Costas, E.; Floresmoya, A.; Lópezrodas, V. Rapid adaptation of phytoplankters to geothermal waters is achieved by single mutations: Were extreme environments ‘Noah’s Arks’ for photosynthesizers during the Neoproterozoic ‘snowball Earth’? J. New Phytol. 2008, 180, 922–932. [Google Scholar] [CrossRef] [PubMed]
- Huertas, I.E.; Rouco, M.; Lópezrodas, V.; Costas, E. Warming will affect phytoplankton differently: Evidence through a mechanistic approach. J. Proc. R. Soc. B Biol. 2011, 278, 3534–3543. [Google Scholar] [CrossRef] [PubMed] [Green Version]
- Scheffer, M.; Rinaldi, S.; Kuznetsov, Y.A.; Van Nes, E.H. Seasonal dynamics of Daphnia and algae explained as a periodically forced predator-prey system. Oikos 1997, 80, 519–532. [Google Scholar] [CrossRef]
- Post, D.M.; Palkovacs, E.P.; Schielke, E.G.; Dodson, S.I. Intraspecific variation in a predator affects community structure and cascading trophic interactions. Ecology 2008, 89, 2019–2032. [Google Scholar] [CrossRef] [PubMed]
- Ahlgren, G.; Lundstedt, L.; Brett, M.; Forsberg, C. Lipid composition and food quality of some freshwater phytoplankton for cladoceran zooplankters. J. Plankton Res. 1990, 12, 809–818. [Google Scholar] [CrossRef] [Green Version]
- Parker, A.E.; Hogue, V.E.; Wilkerson, F.P.; Dugdale, R.C. The effect of inorganic nitrogen speciation on primary production in the San Francisco Estuary. Estuarine Coast. Shelf Sci. 2012, 104–105, 91–101. [Google Scholar] [CrossRef]
- Jampeetong, A.; Brix, H.; Kantawanichkul, S. Effects of inorganic nitrogen forms on growth, morphology, nitrogen uptake capacity and nutrient allocation of four tropical aquatic macrophytes (Salvinia cucullata, Ipomoea aquatica, Cyperus involucratus and Vetiveria zizanioides). J. Aquat. Bot. 2012, 97, 10–16. [Google Scholar] [CrossRef]
- Blasco, D.; Maclsaac, J.J.; Packard, T.T.; Dugdale, R.C. Relationship between nitrate reductase and nitrate uptake in phytoplankton in the Peru upwelling region. J. Limnol. Oceanogr. 1984, 29, 275–286. [Google Scholar] [CrossRef] [Green Version]
- Doyle, R.W. Upwelling, clone selection, and the characteristic shape of nutrient uptake curves. J. Limnol. Oceanogr. 1975, 20, 487–489. [Google Scholar] [CrossRef] [Green Version]
- Button, D.K. On the theory of control of microbial growth kinetics by limiting nutrient concentrations. J. Deep Sea Res. 1978, 25, 1163–1177. [Google Scholar] [CrossRef]
- Cochlan, W.P.; Harrison, P.J. Kinetics of nitrogen (nitrate, ammonium and urea) uptake by the picoflagellate Micromonas pusilla (Prasinophyceae). J. Exp. Mar. Biol. Ecol. 1991, 153, 129–141. [Google Scholar] [CrossRef]
- Gu, B.; Havens, K.E.; Schelske, C.L.; Rosen, B.H. Uptake of dissolved nitrogen by phytoplankton in a eutrophic subtropical lake. J. Plankton Res. 1997, 19, 759–770. [Google Scholar] [CrossRef] [Green Version]
- Healey, F.P. Slope of the Monod equation as an indicator of advantage in nutrient competition. J. Microb. Ecol. 1980, 5, 281–286. [Google Scholar] [CrossRef] [PubMed]
- Li, J.; Glibert, P.M.; Zhou, M.J. Temporal and spatial variability in nitrogen uptake kinetics during harmful dinoflagellate blooms in the East China Sea. J. Harmful Algae 2010, 9, 531–539. [Google Scholar] [CrossRef]
- Li, J.; Glibert, P.M.; Zhou, M.J.; Lu, S.H.; Lu, D.D. Relationships between nitrogen and phosphorus forms and ratios and the development of dinoflagellate blooms in the East China Sea. J. Mar. Ecol. Prog. Ser. 2009, 383, 11–26. [Google Scholar] [CrossRef] [Green Version]
- Donald, D.B.; Bogard, M.J.; Kerri, F.; Leavitt, P.R. Comparative effects of urea, ammonium, and nitrate on phytoplankton abundance, community composition, and toxicity in hypereutrophic freshwaters. J. Limnol. Oceanogr. 2011, 56, 2161–2175. [Google Scholar] [CrossRef] [Green Version]
- Fernandez, E.; Galvan, A. Inorganic nitrogen assimilation in Chlamydomonas. J. Exp. Bot. 2007, 58, 2279–2287. [Google Scholar] [CrossRef] [PubMed] [Green Version]
- Fan, C.; Glibert, P.M.; Burkholder, J.A.M. Characterization of the affinity for nitrogen, uptake kinetics, and environmental relationships for Prorocentrum minimum in natural blooms and laboratory cultures. J. Harmful Algae 2003, 2, 283–299. [Google Scholar] [CrossRef]
- Yin, K.; Harrison, P.J.; Dortch, Q. Lack of ammonium inhibition of nitrate uptake for a diatom grown under low light conditions. J. Exp. Mar. Biol. Ecol. 1998, 228, 151–165. [Google Scholar] [CrossRef]
- Bhavya, P.S.; Kumar, S.; Gupta, G.V.M.; Sudheesh, V.; Sudharma, K.V.; Varrier, D.S.; Dhanya, K.R.; Saravanane, N. Nitrogen Uptake Dynamics in a Tropical Eutrophic Estuary (Cochin, India) and Adjacent Coastal Waters. J. Estuaries Coasts 2016, 39, 54–67. [Google Scholar] [CrossRef]
Figure 1.
Mean daily water temperature in the ambient (blue line) and heated (red line) tanks. Shaded area shows the period of this study.
Figure 1.
Mean daily water temperature in the ambient (blue line) and heated (red line) tanks. Shaded area shows the period of this study.

Figure 2.
Total phytoplankton density (A) and phytoplankton community structure (B) variation in the C, T, P, and T + P treatments during the summer in the mesocosms. Abbreviations used: Control, C; water temperature was increased 4.5 °C compared with the control, T; addition of 50 μg L−1 phosphate every 2 weeks, P; addition of 50 μg L−1 phosphate every 2 weeks and temperature increase of 4.5 °C, T + P. Error bars indicate ±standard error (SE).

Figure 3.
Relative nitrogen uptake rate (V), absolute uptake rate (ρ), relative preference index (RPI), and turnover time (TT) for phytoplankton in the four treatments (n = 6). For abbreviations used, see Figure 1. Error bars indicate ± standard error (SE).
Figure 3.
Relative nitrogen uptake rate (V), absolute uptake rate (ρ), relative preference index (RPI), and turnover time (TT) for phytoplankton in the four treatments (n = 6). For abbreviations used, see Figure 1. Error bars indicate ± standard error (SE).

Figure 4.
Nitrate uptake kinetic curves for phytoplankton in the four treatments. For abbreviations used, see Figure 1.
Figure 4.
Nitrate uptake kinetic curves for phytoplankton in the four treatments. For abbreviations used, see Figure 1.

Figure 5.
Ammonium uptake kinetic curves for phytoplankton in the four treatments. For abbreviations used, see Figure 1.
Figure 5.
Ammonium uptake kinetic curves for phytoplankton in the four treatments. For abbreviations used, see Figure 1.


Table 1.
Mean water chemistry and zooplankton abundance from mesocosms under the C, T, P, and T + P treatments. Values were calculated from weekly measurements of six replicate (n = 6) mesocosms in July and August 2014. Values are means ± SD (standard deviation). Abbreviations used: Control, C; water temperature increased 4.5 °C compared with the control, T; addition of 50 μg L−1 phosphate every 2 weeks, P; addition of 50 μg L−1 phosphate every 2 weeks and temperature increase of 4.5 °C, T + P; dissolved oxygen, DO; orthophosphate, SRP; total phosphorus, TP; total nitrogen, TN; chlorophyll-a, Chl-a. (Note: ind. L−1 is the abbreviation of individual/litre).
| C | T | P | T + P | |
|---|---|---|---|---|
| DO (mg L−1) | 7.61 ± 1.67 | 7.34 ± 1.85 | 7.84 ± 1.95 | 7.11 ± 2.36 |
| pH | 8.48 ± 0.55 | 8.56 ± 0.36 | 8.54 ± 0.56 | 8.56 ± 0.54 |
| Conductivity (µS cm−1) | 233.9 ± 14.7 | 308.2 ± 11.4 | 225.3 ± 15.7 | 303.4 ± 14.0 |
| TP (mg L−1) | 0.059 ± 0.018 | 0.076 ± 0.031 | 0.155 ± 0.041 | 0.275 ± 0.074 |
| SRP (mg L−1) | 0.029 ± 0.009 | 0.028 ± 0.015 | 0.115 ± 0.034 | 0.227 ± 0.059 |
| TN (mg L−1) | 0.464 ± 0.077 | 0.508 ± 0.156 | 0.470 ± 0.093 | 0.586 ± 0.099 |
| NO3−-N (mg L−1) | 0.114 ± 0.042 | 0.142 ± 0.046 | 0.112 ± 0.037 | 0.124 ± 0.033 |
| NH4+-N (mg L−1) | 0.150 ± 0.071 | 0.164 ± 0.081 | 0.198 ± 0.083 | 0.208 ± 0.098 |
| Chl-a (mg L−1) | 2.75 ± 1.21 | 5.31 ± 2.59 | 2.84 ± 1.66 | 6.53 ± 4.37 |
| Cladocera (ind. L−1) | 15.45 ± 5.10 | 23.68 ± 4.24 | 61.27 ± 21.39 | 45.18 ± 9.97 |
| Copepoda (ind. L−1) | 46.96 ± 9.46 | 31.58 ± 7.03 | 83.08 ± 14.57 | 28.13 ± 4.61 |
| Rotifera (ind. L−1) | 26.25 ± 10.02 | 49.35 ± 11.51 | 17.23 ± 3.56 | 43.83 ± 9.71 |
Table 2.
Summary of ANOVA tests (one-way analysis of variance, repeated measures) and analysis of the effect of phosphorus addition and warming on water chemistry, chlorophyll-a, and zooplankton abundance.
Table 2.
Summary of ANOVA tests (one-way analysis of variance, repeated measures) and analysis of the effect of phosphorus addition and warming on water chemistry, chlorophyll-a, and zooplankton abundance.
| N | p | Warming | P + Warming | |
|---|---|---|---|---|
| DO (mg L−1) | 48 | 0.823 | 0.784 | 0.613 |
| pH | 48 | 0.803 | 0.759 | 0.741 |
| Conductivity (µS cm−1) | 48 | 0.229 | <0.001 | <0.001 |
| TP (mg L−1) | 48 | <0.001 | 0.475 | <0.001 |
| SRP (mg L−1) | 48 | <0.001 | 0.985 | <0.001 |
| TN (mg L−1) | 48 | 0.911 | 0.427 | <0.05 |
| NO3−-N (mg L−1) | 48 | 0.927 | 0.167 | 0.620 |
| NH4+-N (mg L−1) | 48 | 0.263 | 0.745 | 0.179 |
| Chl. a (mg L−1) | 48 | 0.951 | 0.072 | <0.01 |
| Cladocera (ind. L−1) | 48 | <0.001 | <0.05 | <0.001 |
| Copepoda (ind. L−1) | 48 | <0.05 | 0.119 | 0.140 |
| Rotifera (ind. L−1) | 48 | 1.000 | 0.226 | 0.254 |
© 2018 by the authors. Licensee MDPI, Basel, Switzerland. This article is an open access article distributed under the terms and conditions of the Creative Commons Attribution (CC BY) license (http://creativecommons.org/licenses/by/4.0/).
Share and Cite
MDPI and ACS Style
Yu, C.; Li, C.; Wang, T.; Zhang, M.; Xu, J. Combined Effects of Experimental Warming and Eutrophication on Phytoplankton Dynamics and Nitrogen Uptake. Water 2018, 10, 1057. https://doi.org/10.3390/w10081057
AMA Style
Yu C, Li C, Wang T, Zhang M, Xu J. Combined Effects of Experimental Warming and Eutrophication on Phytoplankton Dynamics and Nitrogen Uptake. Water. 2018; 10(8):1057. https://doi.org/10.3390/w10081057
Chicago/Turabian StyleYu, Chen, Chao Li, Tao Wang, Min Zhang, and Jun Xu. 2018. "Combined Effects of Experimental Warming and Eutrophication on Phytoplankton Dynamics and Nitrogen Uptake" Water 10, no. 8: 1057. https://doi.org/10.3390/w10081057
Note that from the first issue of 2016, this journal uses article numbers instead of page numbers. See further details here.