Article

Assessing Decadal Trends of a Nitrate-Contaminated Shallow Aquifer in Western Nebraska Using Groundwater Isotopes, Age-Dating, and Monitoring

1
Department of Biological Systems Engineering, University of Nebraska-Lincoln, Lincoln, NE 68583, USA
2
Conservation and Survey Division, School of Natural Resources, University of Nebraska-Lincoln, Lincoln, NE 68583, USA
3
Nebraska Water Sciences Laboratory, Nebraska Water Center, Lincoln, NE 68583, USA
*
Author to whom correspondence should be addressed.
Water 2018, 10(8), 1047; https://doi.org/10.3390/w10081047
Submission received: 20 June 2018 / Revised: 17 July 2018 / Accepted: 2 August 2018 / Published: 7 August 2018
(This article belongs to the Special Issue Groundwater Contamination and Remediation)

Abstract

:
Shallow aquifers are prone to nitrate contamination worldwide. In western Nebraska, high groundwater nitrate concentrations ([NO3]) have resulted in the exploration of new groundwater and nitrogen management regulations in the North Platte Natural Resources District (NPNRD). A small region of NPNRD (“Dutch Flats”) was the focus of intensive groundwater sampling by the United States Geological Survey from 1995 to 1999. Nearly two decades later, notable shifts have occurred in variables related to groundwater recharge and [NO3], including irrigation methods. The objective of this study was to evaluate how changes in these variables, in part due to regulatory changes, have impacted nitrate-contaminated groundwater in the Dutch Flats area. Groundwater samples were collected to assess changes in: (1) recharge rates; (2) biogeochemical processes; and (3) [NO3]. Groundwater age increased in 63% of wells and estimated recharge rates were lower for 88% of wells sampled (n = 8). However, mean age and recharge rate estimated in 2016 (19.3 years; R = 0.35 m/year) did not differ significantly from mean values determined in 1998 (15.6 years; R = 0.50 m/year). δ15N-NO3 (n = 14) and dissolved oxygen data indicate no major changes in biogeochemical processes. Available long-term data suggest a downward trend in normalized [NO3] from 1998 to 2016, and lower [NO3] was observed in 60% of wells sampled in both years (n = 87), but median values were not significantly different. Collectively, results suggest the groundwater system is responding to environmental variables to a degree that is detectable (e.g., trends in [NO3]), although more time and/or substantial changes may be required before it is possible to detect significantly different mean recharge.

1. Introduction

Elevated groundwater nitrate concentrations ([NO3]) in shallow aquifers are often linked to a combination of high groundwater recharge rates and intensive agricultural land use [1,2,3,4,5,6]. Greater recharge rates in areas with intense nitrogen fertilizer loading generally lead to higher [NO3] in groundwater. For example, the central Wisconsin sand-plains region requires additional water and fertilizer inputs to sustain healthy crop yields, with irrigated agriculture having a governing influence on groundwater [NO3] [7,8]. Similarly, high [NO3] have been observed in groundwater in Nebraska, especially beneath areas with sandy soils and/or sand and gravel aquifers [9,10,11,12,13].
Growing concerns over changes in the state’s water quality and quantity led to the creation of what are now 23 Natural Resources Districts (NRD) across Nebraska. Established in 1972, NRDs develop management plans and regulations to protect groundwater [14,15,16]. Regulations aimed at decreasing [NO3] in groundwater have shown some potential for success [4,17], though the exact impacts are not always clear [13,18]. Due to the tendency of nitrate to be transported with recharge water, agricultural water management (i.e., irrigation technology and practices) and groundwater [NO3] are likely to have a direct relationship. In some areas, water allocations and/or moratoriums on new well drilling can incentivize greater irrigation efficiency, which has been found to decrease groundwater [NO3] [12,19,20,21]. For instance, replacing furrow irrigated fields with sprinkler systems (i.e., center pivot) is one method believed to reduce [NO3] leaching to groundwater [12,19]. Such changes in irrigation practice, driven in part by regulatory changes and economic drivers, have occurred in the Dutch Flats area of western Nebraska.
Groundwater age-dating has been used widely to determine historical trends in groundwater [NO3] [17,18,22,23,24,25]. The United States Geological Survey’s (USGS) National Water-Quality Assessment (NAWQA) program has emphasized the importance of implementing groundwater age-dating to evaluate long-term trends in groundwater characteristics and its contaminants [24]. Relatively few studies, however, have used groundwater age-dating to directly evaluate the impact of water and/or nutrient management regulations, or major shifts in irrigation management, on groundwater recharge rates and nitrate contamination. Visser et al. [17] used 3H/3He age-dating in the Netherlands to examine impacts of legislation aimed at decreasing groundwater [NO3] in areas characterized by alluvial sand and gravel deposits. Groundwater age-dating showed trend reversal in groundwater nitrate, with old groundwater increasing in [NO3], and young groundwater decreasing in [NO3]. Further, groundwater age-dating provides a method for evaluating impacts of land use change on groundwater quality [26,27,28]. As a result, coupling groundwater [NO3] trends with apparent age may be useful in assessing how changing groundwater recharge and quality respond to irrigation management changes, in the context of other environmental variables (e.g., precipitation).
Within North Platte Natural Resources District (NPNRD) in western Nebraska, irrigation canals provide a source of artificial recharge [11,29,30,31,32,33]. Locations of highest and lowest recharge potential in canals were captured using capacitively coupled and direct-current resistivity methods to profile lithology of two major canals in NPNRD [32]. Estimates suggest canals leak between 40% and 50% of their water within this region [34]. The Interstate Canal, with a water right of 44.5 m3/s, operates during irrigation season and is the largest canal delivering water to the region [35]. Other large canals in the region include the Mitchell-Gering and Tri-State Canals. An extensive analysis of the relationship between surface irrigation and groundwater quantity and quality in this area was provided by Böhlke et al. [11].
Böhlke et al. [11] also summarized USGS reports from a five-year study beginning in the mid-1990s [30,31]. The investigation was conducted from 1995 to 1999 (referred to in this text as the 1990s study) in the Dutch Flats area, a region comprising roughly four percent of NPNRD. Crop production in this area historically depends on surface water with low [NO3] (e.g., [NO3] < 0.06 mg N L−1 in 1997) delivered via canals for irrigation supply. Groundwater age estimates (3H/3He), isotopes, nitrate, and other analytes were used to evaluate trends in groundwater recharge and nitrate contamination. For example, groundwater recharge rates and temporal changes in [NO3] demonstrated the influence of canal seepage on nearby wells. Wells far from canals were more influenced by local irrigation practices. Relatively young groundwater ages (mean = 8.8 years) indicated that recharge was occurring from more than just regional precipitation (i.e., groundwater would be expected to reside in the aquifer much longer if recharge rates based on precipitation were assumed). As a result, Böhlke et al. [11] theorized that groundwater residence times and [NO3] may be impacted if recharge from canals and/or irrigation were significantly reduced. Further, if groundwater residence times were to increase, then potential for biogeochemical activity such as denitrification might also increase, resulting in a decrease in groundwater [NO3].
Since the 1990s USGS study, several variables related to groundwater recharge have changed in the extensively sampled Dutch Flats area. For example, a shift in irrigation practice and canal management have been noted in the region [36], with the largest changes in irrigation practice occurring during approximately 2000–2003. The timing of these changes relative to the USGS study, combined with the relatively young groundwater ages in the aquifer, provides a unique opportunity to evaluate the potential impact of changing water management on the overall timescale of groundwater movement through the aquifer, and subsequent impacts on groundwater quantity (recharge rate) and quality ([NO3]). Other variables we considered were annual precipitation, volume of water diverted into the Interstate Canal, planted corn area, and fertilizer loads.
In this study, we evaluated how changes to water resources management, with respect to numerous underlying variables, have affected leaching and groundwater transport of nitrate nitrogen. More specifically, the objective of this study was to compare the composition of recently collected groundwater samples to those reported by Böhlke et al. [11] for changes in: (1) groundwater recharge rates; (2) biogeochemical processes (i.e., denitrification) affecting [NO3]; and (3) groundwater [NO3] in the Dutch Flats area.

2. Materials and Methods

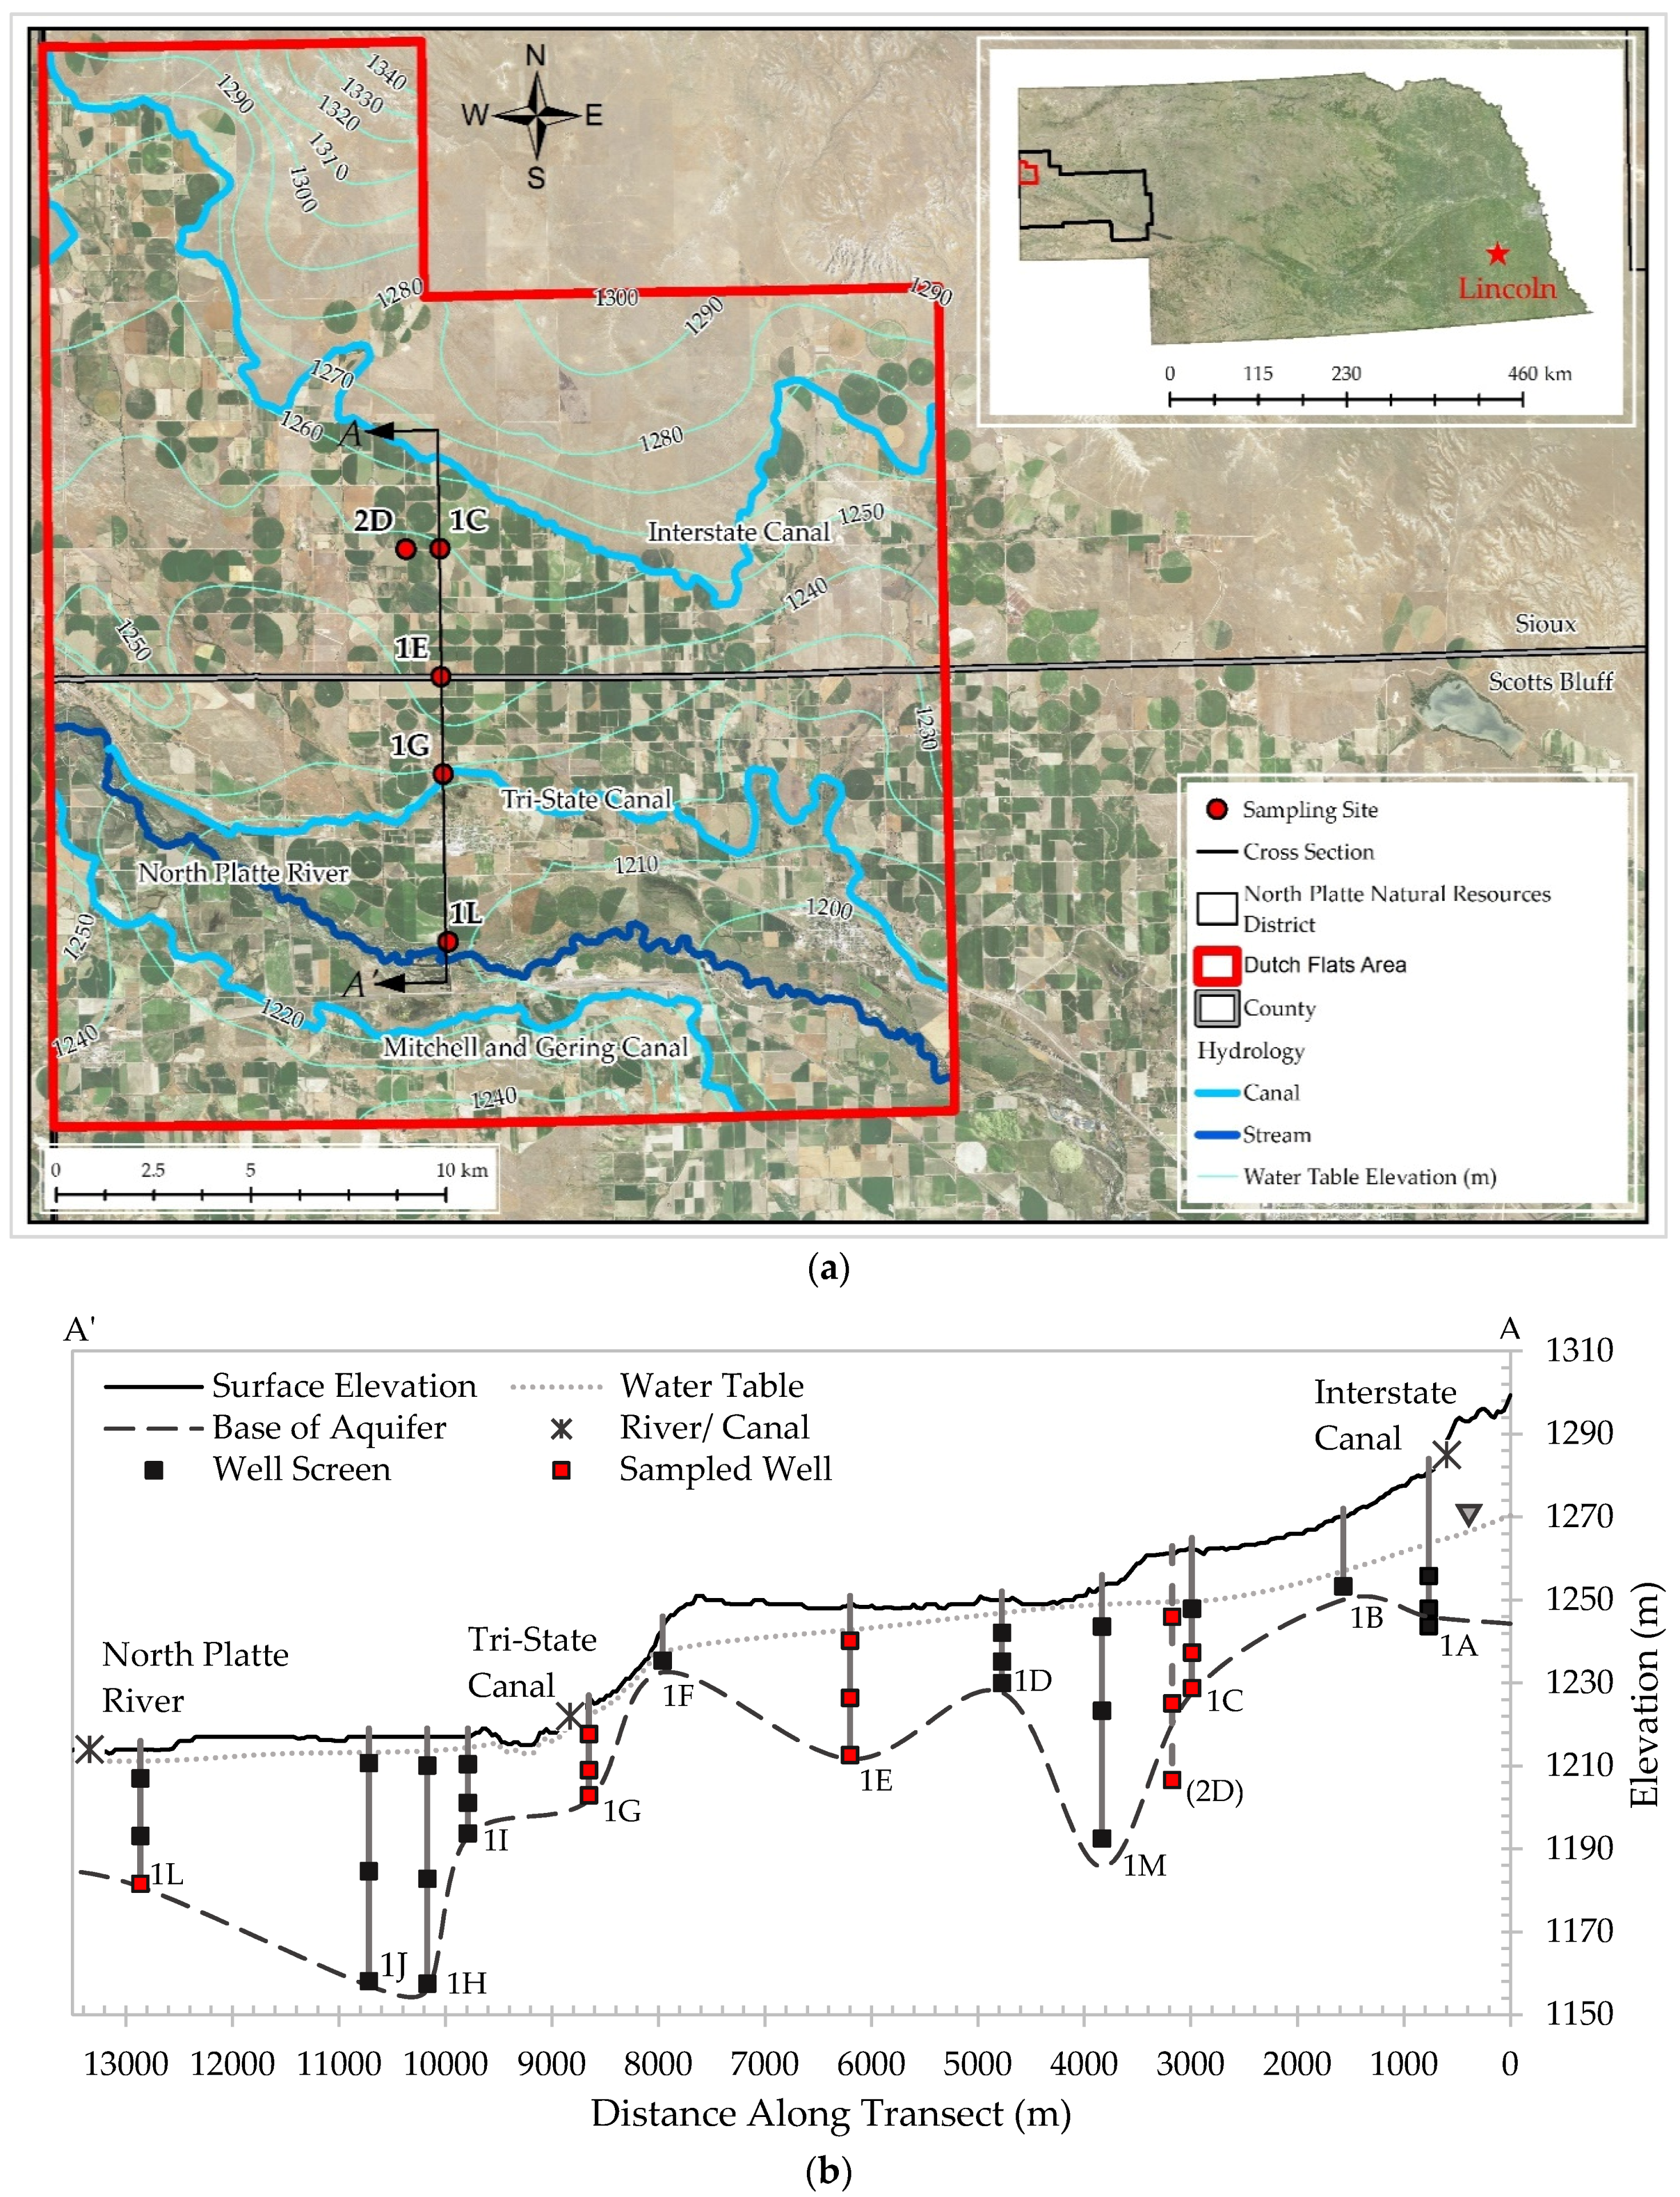
2.1. Site Description

The study area is within NPNRD in western Nebraska (Figure 1), where climate is classified as semi-arid [37]. Climate data retrieved from Western Regional Airport in Scottsbluff, Nebraska display long-term average annual rainfall and snow of 390 mm and 1021 mm, respectively (1908–2016) [38]. The average annual maximum and minimum temperatures from 1908 to 2016 were 17.6 °C and 1.1 °C, respectively. Growing season rainfall is typically insufficient to support high crop yields; therefore, irrigation is used extensively with 86% previously estimated to originate from surface water [39]. In 2002, a moratorium was implemented to restrict drilling of additional irrigation wells in NPNRD. The state legislature passed Legislative Bill 962 in 2004, allowing the district to declare areas either fully or over-appropriated and led to development of an integrated management plan intended to protect both groundwater and surface water. Regulations on water and soil include groundwater allocations and flow meters on wells in over-appropriated areas, requirements for irrigators using chemigation systems, well registration, and irrigation runoff controls.
This study is focused within the Dutch Flats area in NPNRD [11,30,31,40]. The study area is in the North Platte River Valley, along the Nebraska-Wyoming border [39]. The Dutch Flats area is about 540 km2 and located in Scotts Bluff and Sioux Counties (Figure 1). Approximately 48% of the study area is in Scotts Bluff County, while 52% is in Sioux County. Based on the 2011 National Land Cover Database (NLCD), 53.5% of the Dutch Flats area is agriculture, while Scotts Bluff and Sioux Counties are 47.0 and 4.3, respectively [41]. Due to similarities in land use between Dutch Flats area and Scotts Bluff County, Scotts Bluff County was used as a proxy when data could not be determined directly for the study area. While surface water is the most common source for irrigation in this region, accessible groundwater offers alternative methods. Irrigation withdrawal estimates in Scotts Bluff County suggest surface water has remained the dominant source of irrigation water, ranging from 84.4% to 98.6% from 1985 to 2010 [42].
An extensive monitoring well network in NPNRD has been used to measure and record changing groundwater levels and [NO3] over several decades. The Dutch Flats area varies in both vadose and saturated zone thickness, and is characterized as a sand and gravel alluvial aquifer, with limited areas of silt and clay [39] (Figure 1). The alluvial aquifer is underlain by the Brule Formation, made up of siltstone, mudstone, volcanic ash beds, gravel, and fine-grained sand. Groundwater for irrigation is typically pumped from Quaternary-aged alluvial deposits or water-bearing units of the Brule Formation. The direction of groundwater flow is generally southeast from canals toward the North Platte River, though flow in some locations is redirected by what is referred to as the Brule High [30].

2.2. Sample Sites

Within the Dutch Flats area, five well nests were selected for sampling in 2016. Wells were selected based on completeness of data from the previous study [11], so direct comparisons could be made to our results. Samples for noble gases, tritium, nitrogen and oxygen isotopes of nitrate, nitrate nitrogen, ammonium nitrogen, and dissolved organic carbon (DOC) analysis were collected following standard sampling procedures. Groundwater parameters logged and recorded at these five well nests were pH, temperature (°C), dissolved oxygen (mg O2 L−1), percent saturation of dissolved oxygen, specific conductivity (µS cm−1), and total dissolved gas (g L−1). Each well was measured for depth to groundwater and depth to well bottom relative to surface elevation. At least one well bore volume was pumped from each well prior to sampling (Geotech SS Geosub Controller and Pump). Groundwater parameters were monitored by a Hydrolab MS5 Multiparameter Sonde. After parameters stabilized, pump speed was decreased, and samples were collected. Sampling occurred three times over the course of 2016: spring, summer, and fall. Spring sampling included collection of groundwater from shallow, intermediate, and deep wells from nest 1G (Figure 1). Groundwater beneath irrigated fields, and away from major canals, was collected in summer for assessing spatial patterns in groundwater. Shallow, intermediate, and deep samples were collected from Well Nests 2D and 1E, intermediate and deep samples from nest 1C, and deep samples at Well 1L. To capture temporal influences, Well Nest 1G (Figure 1) was sampled again at a shallow and intermediate depth during fall.

2.3. 3H/3He Sampling and Noble Gas Modeling

After rinsing with sample water, 0.9 m copper refrigeration tubes for noble gas analysis were filled and crimped [44]. Samples for analysis of tritium was collected in 0.5-liter HDPE plastic bottles. Noble gases (Ar, He, Kr, Ne, and Xe) were analyzed via mass spectrometry at the University of Utah’s Dissolved Gas Service Center in Salt Lake City, UT. Tritium activities were determined using the helium ingrowth method [45].
Excess air and recharge temperatures were modeled using iNoble Version 2.2 workbook developed by the International Atomic Energy Agency (IAEA). We assumed a terrigenic 4He/3He (Rterr) of 2.88 × 10⁻⁸, and 3H half-life of 12.32 years [46]. Apparent groundwater age was calculated from
  τ = λ 1 ln ( 1 +   H e t r i t 3 H 3 )  
where τ is the apparent groundwater age in years, 3Hetrit is the modeled tritiogenic helium, and 3H is tritium at the time of sampling, determined from helium ingrowth. The decay constant, λ , is a function of the half-life of tritium and is determined as   λ   =   ln 2 12.32   years .

2.4. Recharge Estimates

Groundwater recharge, defined as the rate at which water moves vertically across the water table, was calculated for each well. Shallow wells typically have screen lengths of 6.1 m with the midpoint originally designed to be located at the water table. Intermediate and deep wells both have screens of approximately 1.5 m. To maintain consistency, calculations were performed using methods and assumptions made by Böhlke et al. [11]. Groundwater age was assumed to follow a linear gradient as a slug of water traveling from the water table to the midpoint between the upper and lower well screen (Equation (2)). For shallow wells, recharge was determined at the midpoint between the bottom screen and water table. Recharge was calculated as follows:
R = z θ τ  
where R is recharge in m/year, θ is porosity, z is depth below water table to the screen midpoint (m), and τ is the groundwater age, in years, determined via apparent 3H/3He ages. Porosity was assumed to be 0.35. Intermediate and deep wells are screened below the water table. Therefore, z for these calculations was the distance from the water table to the midpoint of the screen. Again, recharge was estimated using Equation (2). Böhlke et al. [11] also used an exponential equation [47] to estimate recharge rates of intermediate wells, though this equation was not applied to shallow or deep wells (Equation (3)).
R = z θ τ ln ( L L z )  
where L is unconfined aquifer saturated thickness (m), and z is the distance from the water table to the screened midpoint (m). Applying this equation near the water table (shallow wells) or bottom of the aquifer (deep wells) may lead to uncertainties associated with groundwater mixing. While the simplistic modeling of Equations (2) and (3) fit the data reasonably well, it is acknowledged uncertainties related to 3H/3He age-dating and aquifer heterogeneity could affect calculated recharge rates. For instance, uncertainty in 3H/3He ages can be relatively large on a percentage basis [48]. Further, aquifer heterogeneity, namely porosity, directly influence Equations (2) and (3) calculations. However, assumptions by Böhlke et al. [11] were maintained in both studies, yielding similar calculated recharge uncertainties. The appropriate applications and limitations of these equations have been addressed in previous literature [49,50].

2.5. Nitrate Isotopes, Nitrate, Ammonium, and DOC Concentrations

Samples for isotope analysis were collected in 1-liter HDPE plastic bottles, placed on ice immediately after collection, frozen within 48 h, and analyzed at the University of Nebraska’s Water Science Laboratory. The oxygen isotope composition of nitrate was measured according to methods described in Chang et al. [51] and Silva et al. [52]. A measured volume of sample containing 0.25 mg NO3-N was then treated with 1 M barium chloride to precipitate sulfate and phosphate. The solution was filtered, passed through a cation exchange column to remove excess Ba2+, and then through an anion exchange column to concentrate nitrate. Nitrate was eluted using 3 M hydrochloric acid, neutralized with Ag2O, filtered to remove the AgCl precipitate, and then dried to produce purified AgNO3. The AgNO3 was dissolved in 1 mL of reagent water and 100 µL (25 µg N) aliquots were transferred to three silver cups and dried for analysis of oxygen isotope composition using high temperature pyrolysis on nickelized graphite in a closed tube to produce carbon monoxide (CO) on a Eurovector EA coupled to an Isoprime continuous flow isotope ratio mass spectrometer. The final result was averaged from the triplicate instrumental results and converted to the standard oxygen isotope reference (VSMOW = 0.00‰).
A reagent grade potassium nitrate (KNO3) was used as a working standard, and reference sucrose oxygen isotope standards were analyzed with every sample batch (up to 20 samples) both for calibration and for drift correction. USGS 34 and USGS 35 reference standards are analyzed at least monthly to compare and convert working standards to a δ18O isotope value with respect to Vienna Standard Mean Ocean Water (VSMOW). The 1σ measured analytical precision of δ18O-NO3 is ±0.5‰ for solutions of KNO3 standard processed through the entire procedure. In addition to triplicate instrumental average measurement, laboratory duplicates were carried through the preparation process and analyzed at a rate of 5%.
The nitrogen isotope composition of nitrate (δ15N-NO3) was measured according to methods previously described [53,54]. Ammonia-N was quantified after addition of MgO on a steam distillation line and titrated with standardized sulfuric acid [55]. Nitrate was then reduced to ammonia with Devarda’s alloy, distilled separately into a boric acid indicator solution, and then quantified titrimetrically with standardized sulfuric acid. Distillates were acidified with sulfuric acid immediately after titration and evaporated to 1 to 2 mL on a hot plate. They were then reacted with lithium hypobromite on a high-vacuum preparation line and the ammonium quantitatively reduced to nitrogen gas, purified by passage through two liquid nitrogen cryotraps and a 400 °C copper oven, and collected in a gas sample bulb. Atmospheric nitrogen standards were prepared on the same high-vacuum preparation line. Ultrapure tank nitrogen was used as the working standard and was calibrated against the atmospheric nitrogen standard. All nitrogen isotope measurements were performed on either a Micromass OPTIMA or a GVI Isoprime dual inlet stable isotope ratio mass spectrometer (IRMS). The δ15N-NO3 of the sample was measured and expressed relative to the atmospheric standard expressed in parts per thousand (‰). Quality control was monitored through the analysis of replicate standards to determine the accuracy and repeatability of the method.
The nitrogen (15N/14N) and oxygen isotope (18O/16O) composition of nitrate was expressed as the difference (‰) of the sample ratio relative to each international standard ratio using Equation (4).
δ ( ) = ( R a t i o ) S a m p l e ( R a t i o ) S t a n d a r d ( R a t i o ) S t a n d a r d   × 1000  
Nitrate concentration was determined for the five well nests selected for detailed sampling in 2016 using the Cd-reduction method [56] on a Seal AQ2 autoanalyzer. Dissolved organic carbon (DOC) samples were collected in 40 mL glass vials and preserved with sulfuric acid. Each sample was field filtered through a 0.45-micron filter attached to a syringe. Samples were analyzed following heated persulfate SM 5310 protocol using an OI Analytical model 1010 TOC Analyzer [56].

2.6. Evaluating Long-Term Trends in Nitrate Concentrations

In addition to nitrate evaluated in 1998 and this current study, long-term data collected and/or maintained by the NPNRD and Nebraska Agricultural Contaminant Database [57] were used for further analysis. These samples were collected with a low-volume pump after monitored parameters (temperature, pH, specific conductivity, DO, and total dissolved solids) stabilized. Samples were placed on ice and preserved with sulfuric acid prior to analysis at Midwest Laboratories, Inc in Omaha, NE, USA [58]. Sporadically sampled data from 1998 to 2016 were normalized about the maximum and minimum nitrate value over the sampling period, as
x = x min ( x ) max ( x ) min ( x )  
where x is the normalized nitrate value, x is the observed (or average if multiple samples were collected from a well within the same year) [NO3] for a specific year, and max ( x ) and min ( x ) are the maximum and minimum respective [NO3] over all the sample years for each well.

3. Results and Discussion

Groundwater samples analyzed for 3H/3He, NO3, δ15N-NO3, and δ18O-NO3, among other groundwater parameters, were used to evaluate the hypothesis that changes in environmental variables since the previous study would: (1) decrease recharge rates; (2) increase biogeochemical activity; and (3) result in lower groundwater [NO3]. Unless otherwise noted, data collected in 2016 were analyzed and compared to 1998 groundwater data collected by the USGS [31] in August 1998 and limited to the five well nests sampled in 2016.

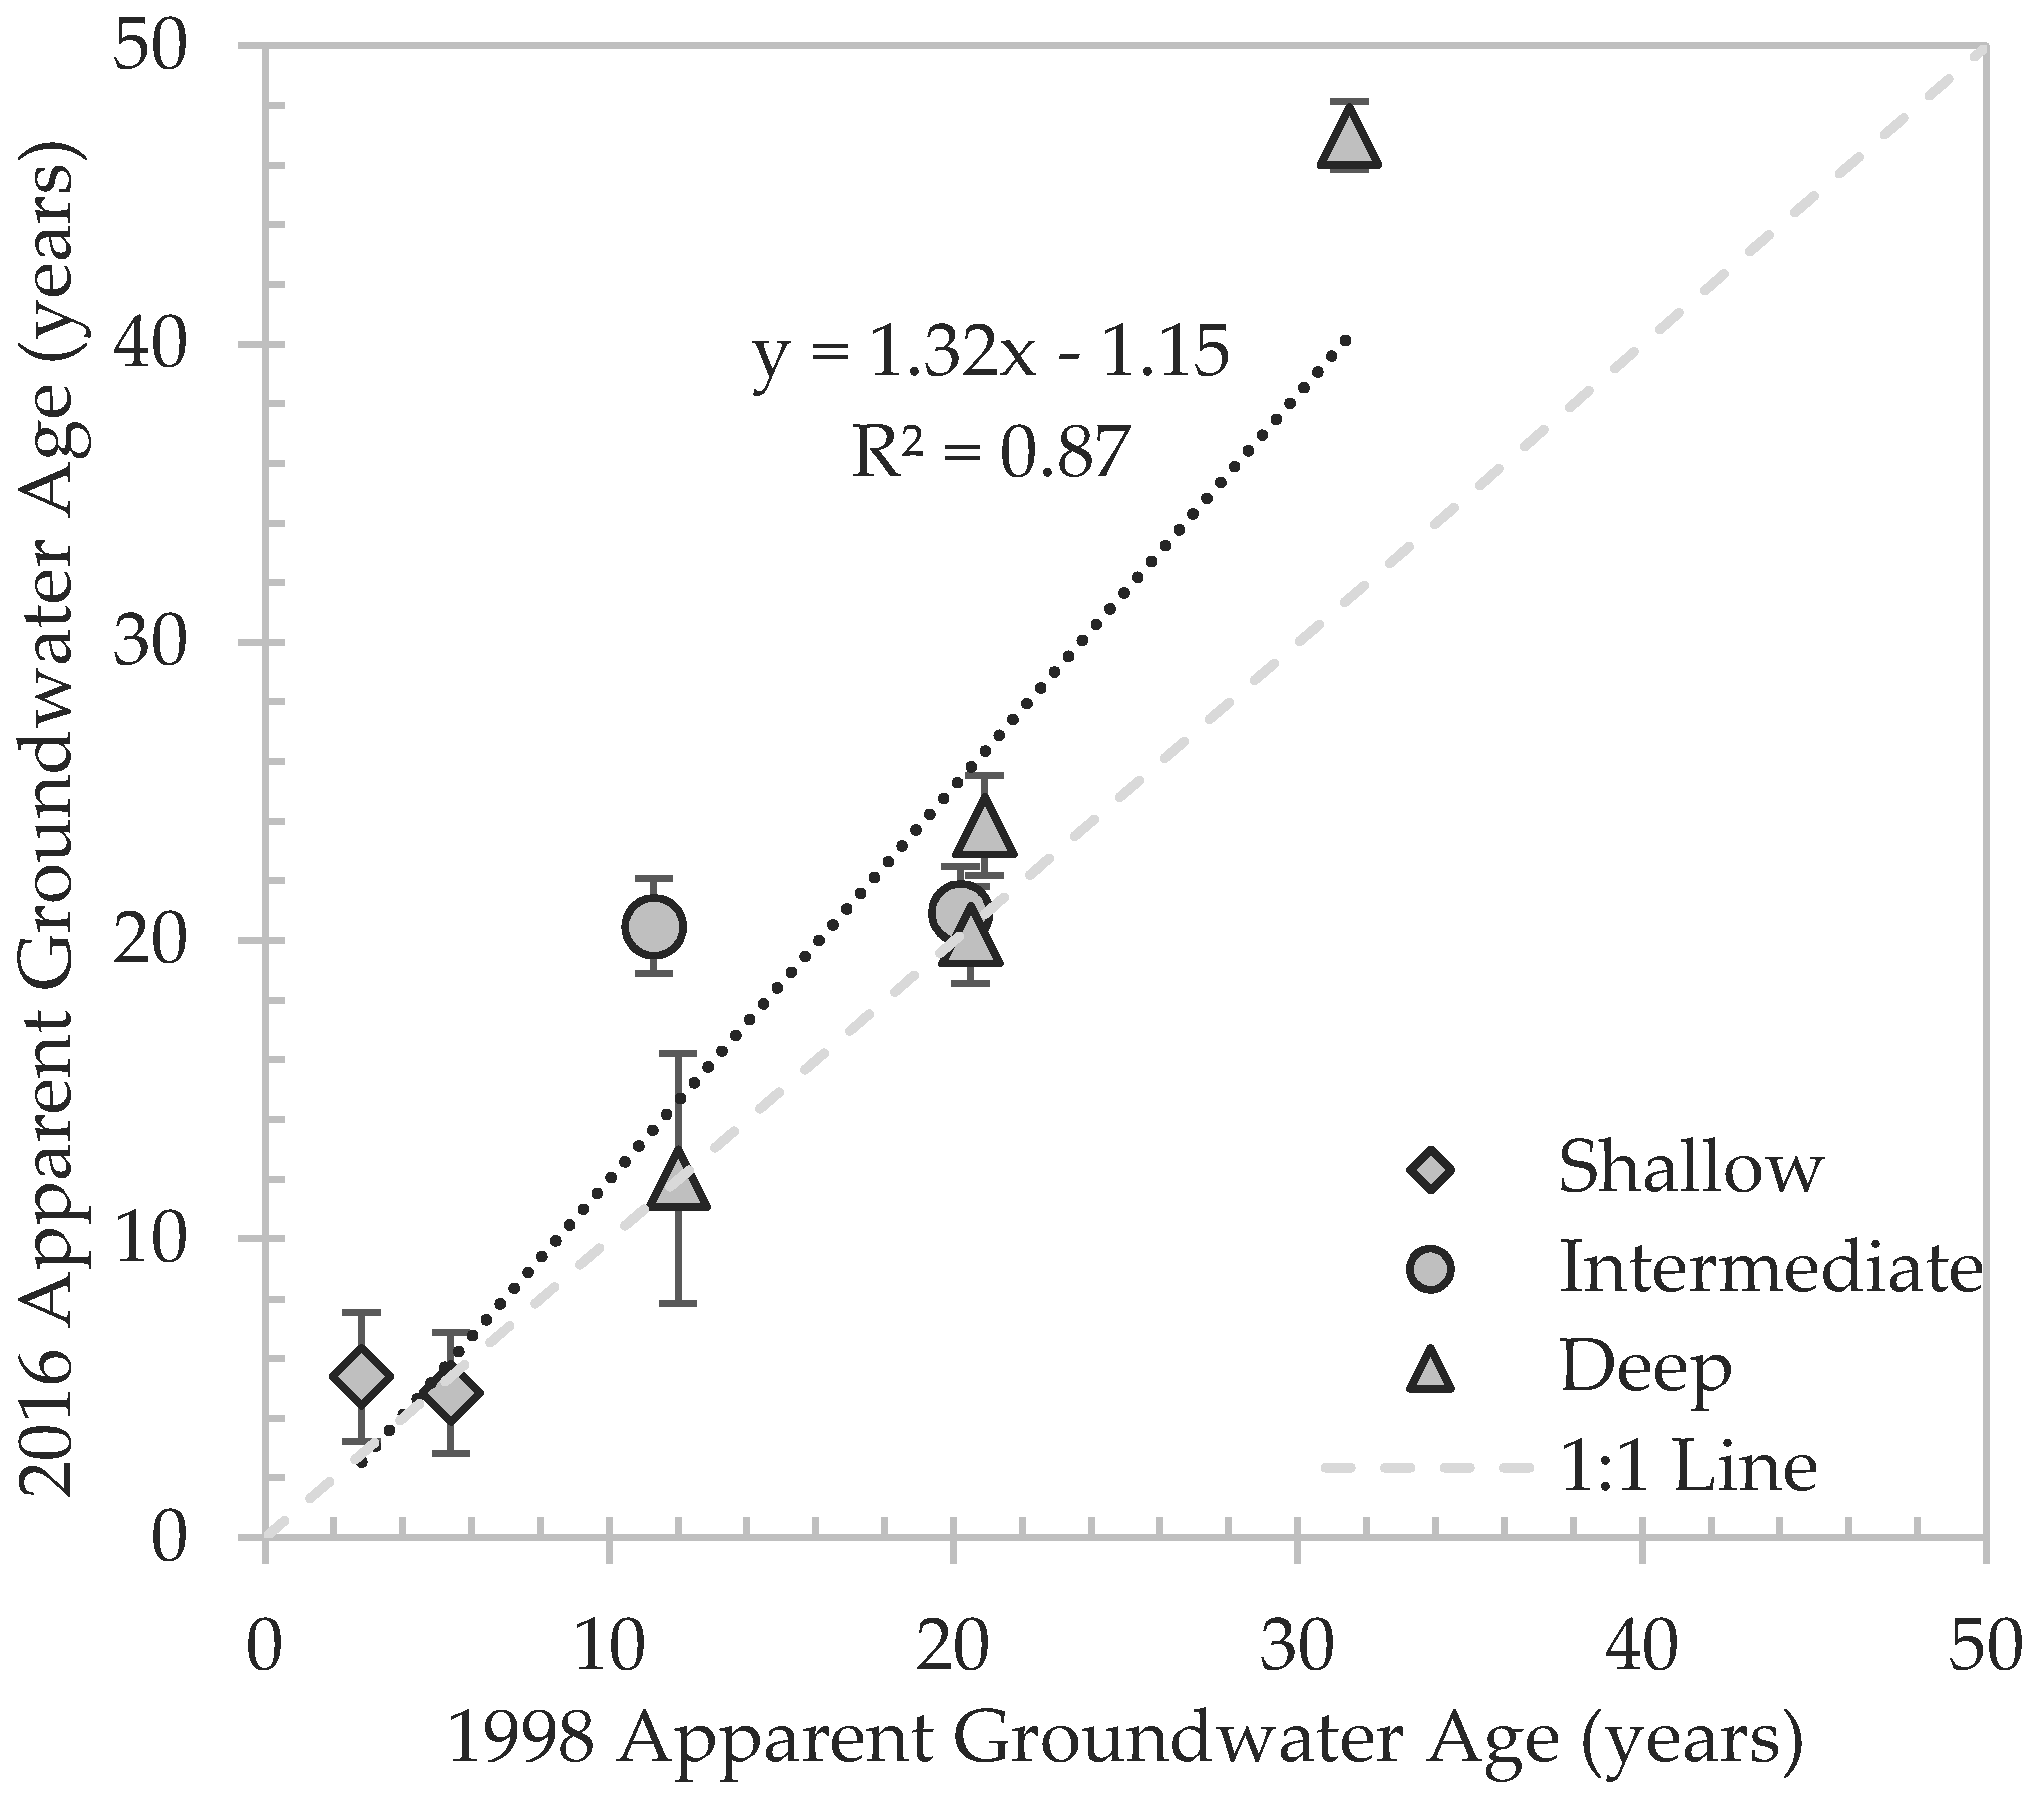
3.1. Groundwater Age-Dating
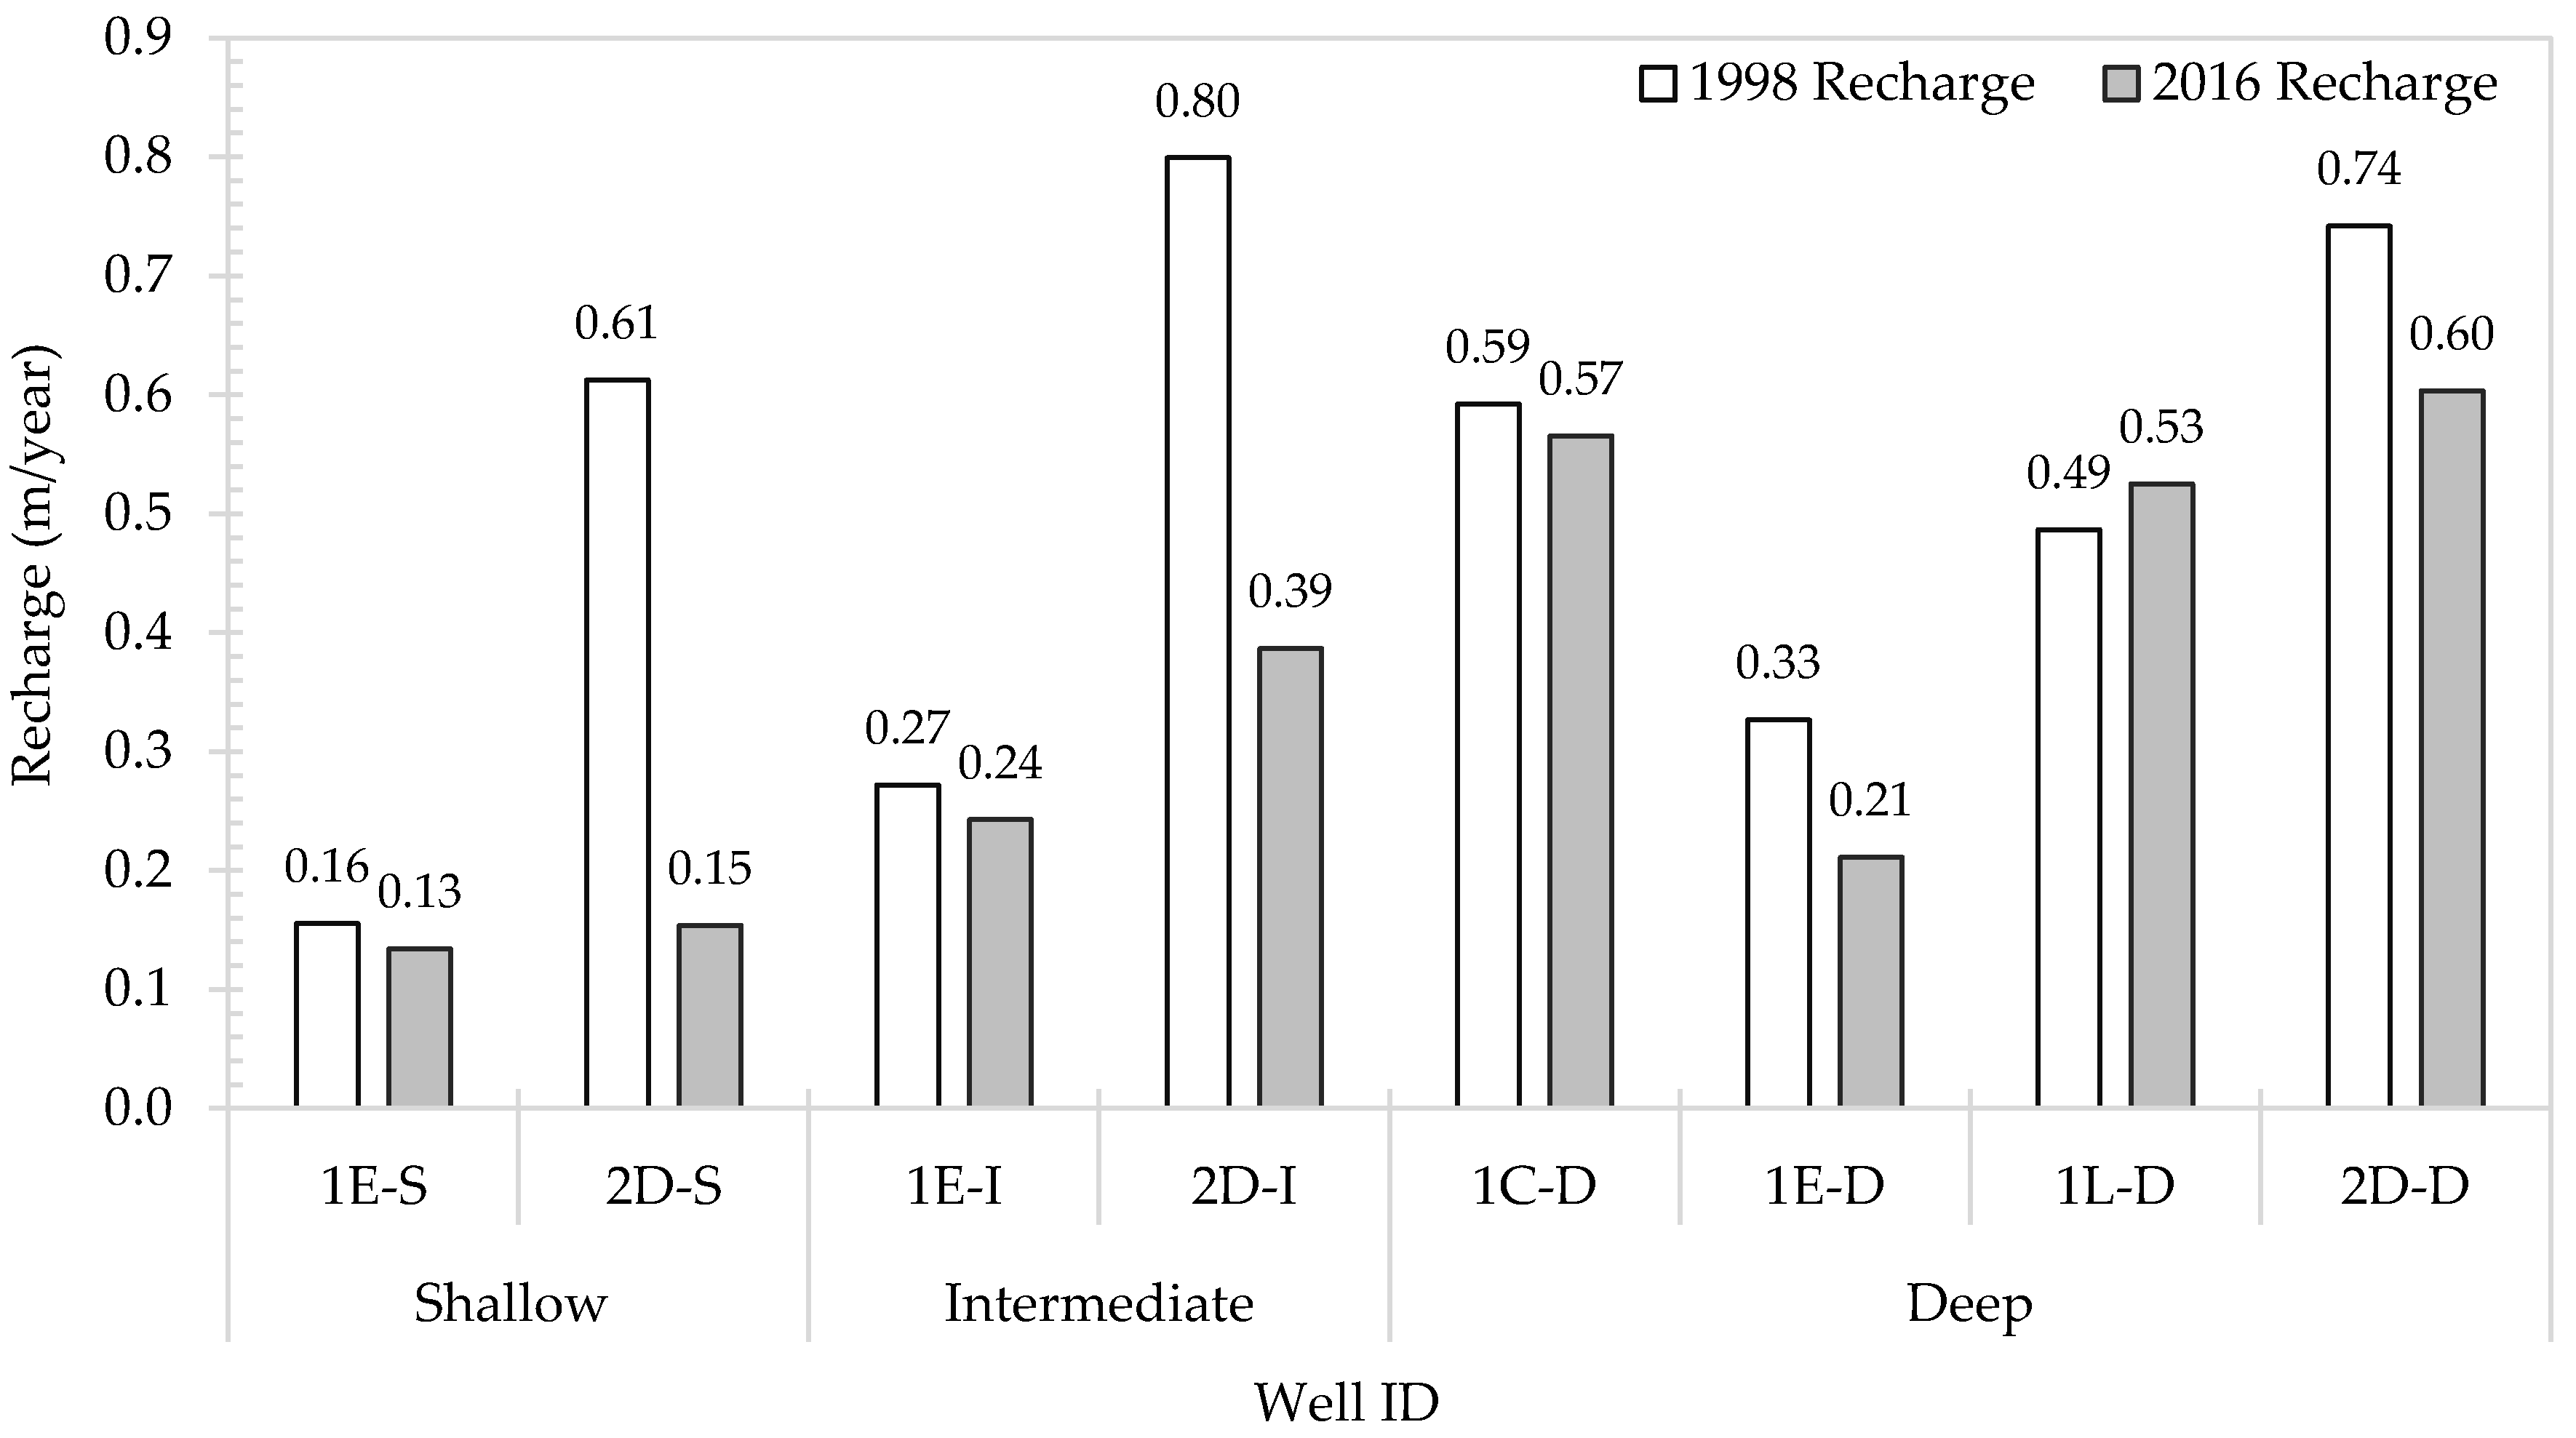
An increase in groundwater age between the 1998 and 2016 studies would indicate reduced rates of water movement through the aquifer over that period. Apparent groundwater ages from five of eight samples (63%) collected in 2016 were greater than groundwater ages estimated from samples collected in 1998 (Table 1; Figure 2). Mean groundwater age in the sampled wells increased from 15.6 years in 1998 to 19.3 years in 2016, but the difference was not statistically significant (p = 0.53; two-sample t-test assuming unequal variances).
Recent depth to groundwater data (2017; n = 162) vary throughout Dutch Flats, ranging from less than 1 m to over 30 m, with a mean of 10.6 m (±10.3 m) and median of 7.7 m. Vadose zone thickness of wells sampled in August 2016 were between 1.2 and 13.3 m. Well nests constructed for the 1990s study (and re-sampled in this study) had screen intervals designed to intercept groundwater at the water table, mid-aquifer, and at or near the base of the unconfined aquifer. In Dutch Flats, shallow wells typically have 6.1 m screens and were designed originally with roughly 3 m above and below the water table. Long well screens across the water table can increase error in groundwater age, due to mixing of a range of groundwater ages, and because fluctuations in the water table can lead to a loss of tritium-derived 3Hetrit escaping to the atmosphere. Among samples from shallow wells, apparent groundwater age sampled from Well 2D-S increased by approximately 2.5 years, or 93%, while 1E-S decreased by 0.5 years, or 9.3%.
Because of shorter (1.5 m) screened intervals, intermediate and deep wells may provide a better estimate of groundwater age and are subject to fewer uncertainties impacting shallow wells. Wells 1E-I and 2D-I had comparable groundwater ages of 20.9 and 20.5 years, respectively, in 2016. Well 1E-I groundwater age stayed similar between the two sampling periods (1998 = 20.2 years), while 2D-I increased by 81% (1998 = 11.3 years). Groundwater samples from 1G-I were collected in both the spring and fall of 2016 to explore temporal trends in groundwater age at a site near a canal. Although there is no direct comparison with the previous study, apparent groundwater age at the well found little variation in groundwater age, with spring and fall ages of just 5.9 and 5.3 years, respectively. Results from Well 1C-I displayed nearly modern groundwater age (i.e., age ≈ 0 years). Results from this well appear erroneous, and were excluded from the comparisons in Table 1, since it is unlikely modern groundwater would be observed 11 m below the water table.
Groundwater age of samples collected in 1998 from deep wells ranged from 12.0 to 31.5 years, while in 2016 apparent groundwater ages were between 12.0 to 47.0 years. The largest change in groundwater age was for groundwater sampled from Well 1E-D. While apparent groundwater age stayed similar in Well 1E shallow and intermediate depths, groundwater age from the deep well increased from 31.5 to 47.0 years, or 49%. This increase would suggest groundwater was nearly unaffected by recharge and water sampled in 1998 was essentially the same water collected in 2016. The groundwater age trend in Well Nests 2D and 1E is consistent with non-uniform recharge in the region, where screens at different depths in the aquifer are influenced by different recharge sources (i.e., localized irrigation and/or canals).

3.2. Recharge Rates

Recharge rates (R) were estimated as a function of the vertical distance water travels below the water table, porosity, and apparent groundwater age (see Equations (2) and (3)). Figure 3 and Table 1 compare 1998 and 2016 recharge rates. Over nearly two decades, recharge rates decreased in each well, with exception to Well 1L, which had a minor increase. Recharge rates ranged from 0.16 to 0.80 m/year in 1998, with a mean rate of 0.50 m/year (±0.23). Rates in 2016 were not significantly different (p = 0.19; two-sample t-test assuming unequal variances) and varied between 0.13 and 0.60 m/year, averaging 0.35 m/year (±0.19). From 1998 to 2016, mean water depth increased from 7.9 m to 9.4 m.
Shallow wells far from canals are believed to reflect localized recharge, while intermediate and deep wells are more likely to represent recharge sources from both localized irrigation and canal leakage [11]. Shallow wells had varying results, with a comparable recharge rate in Well 1E-S in both studies, and Well 2D-S less than 25% the 1998 recharge rate. The recharge rate in 1E-I, again, was similar between the two studies, while the 2016 recharge rate in 2D-I was less than half that of 1998. The 2016 mean recharge rate in deep wells was nearly double the mean from shallow wells. Deep wells, typically associated with greater groundwater ages, may take time before they reflect changes to environmental variables related to groundwater quantity. The lowest 1998 (R = 0.33 m/year) and 2016 (R = 0.21 m/year) recharge rates from deep wells were both in 1E-D, which is located far from the larger regional canals. The largest 1998 (R = 0.74 m/year) and 2016 (R = 0.60 m/year) deep well recharge rates were in Well 2D-D.

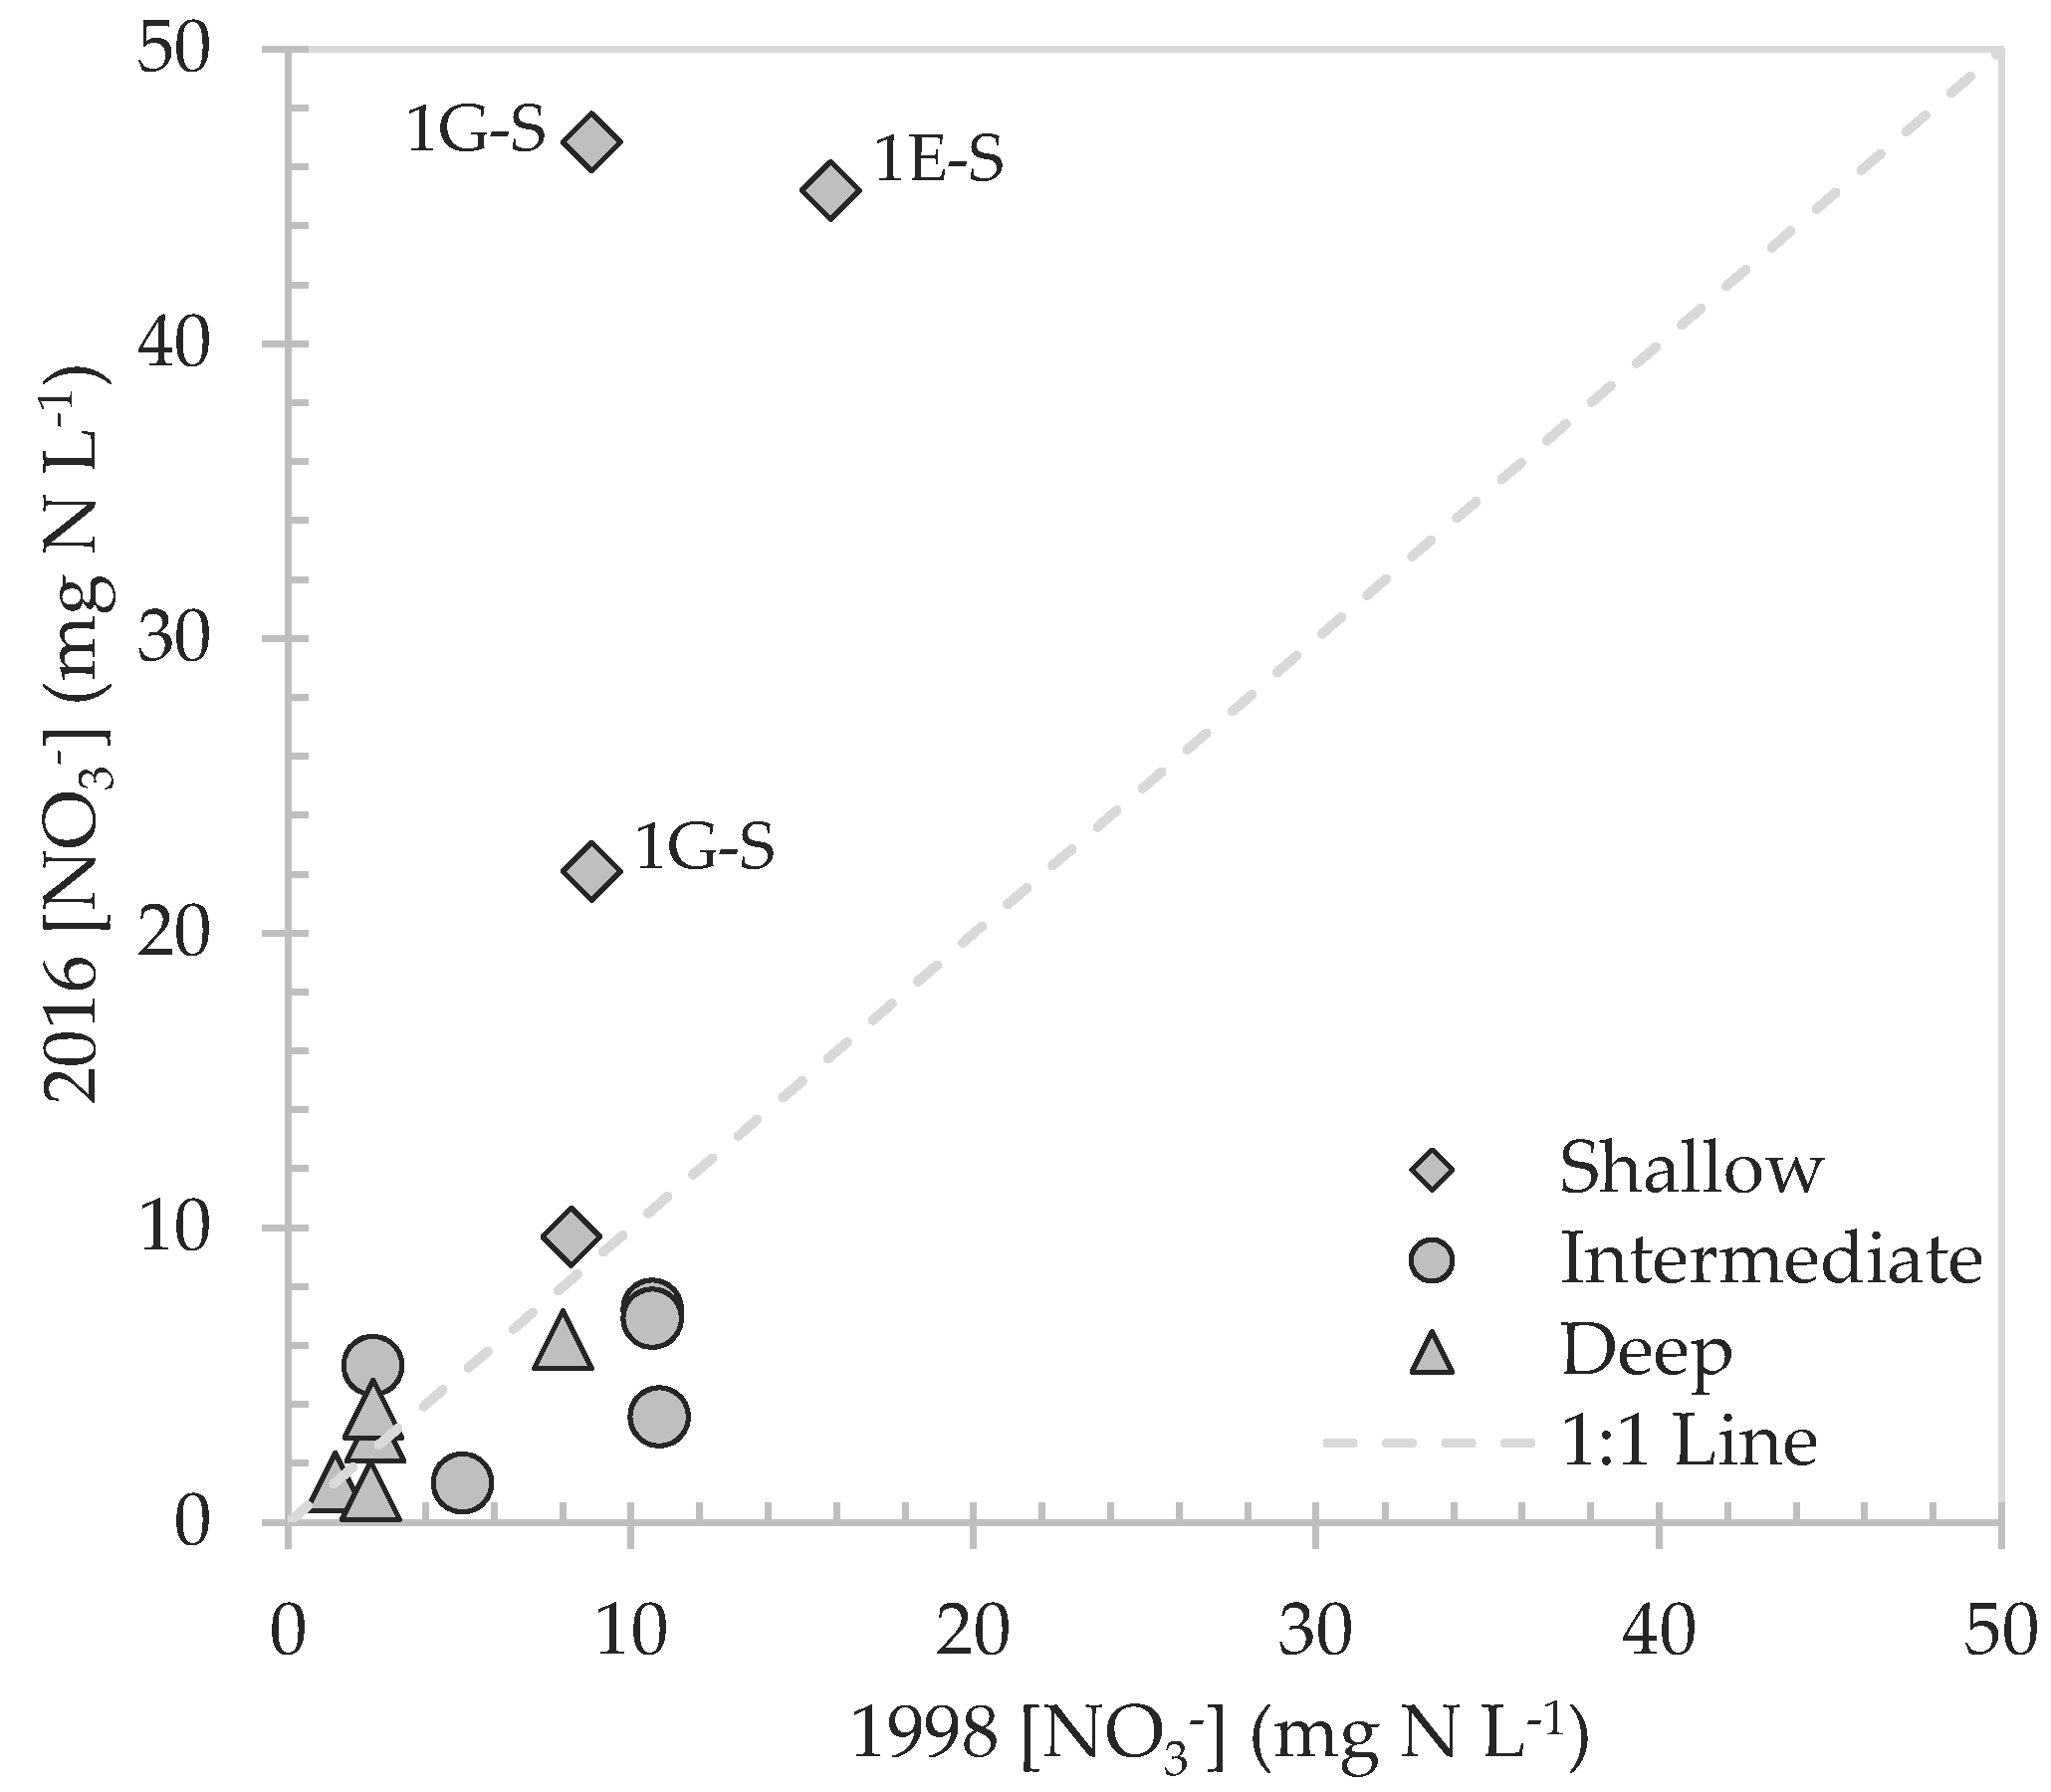
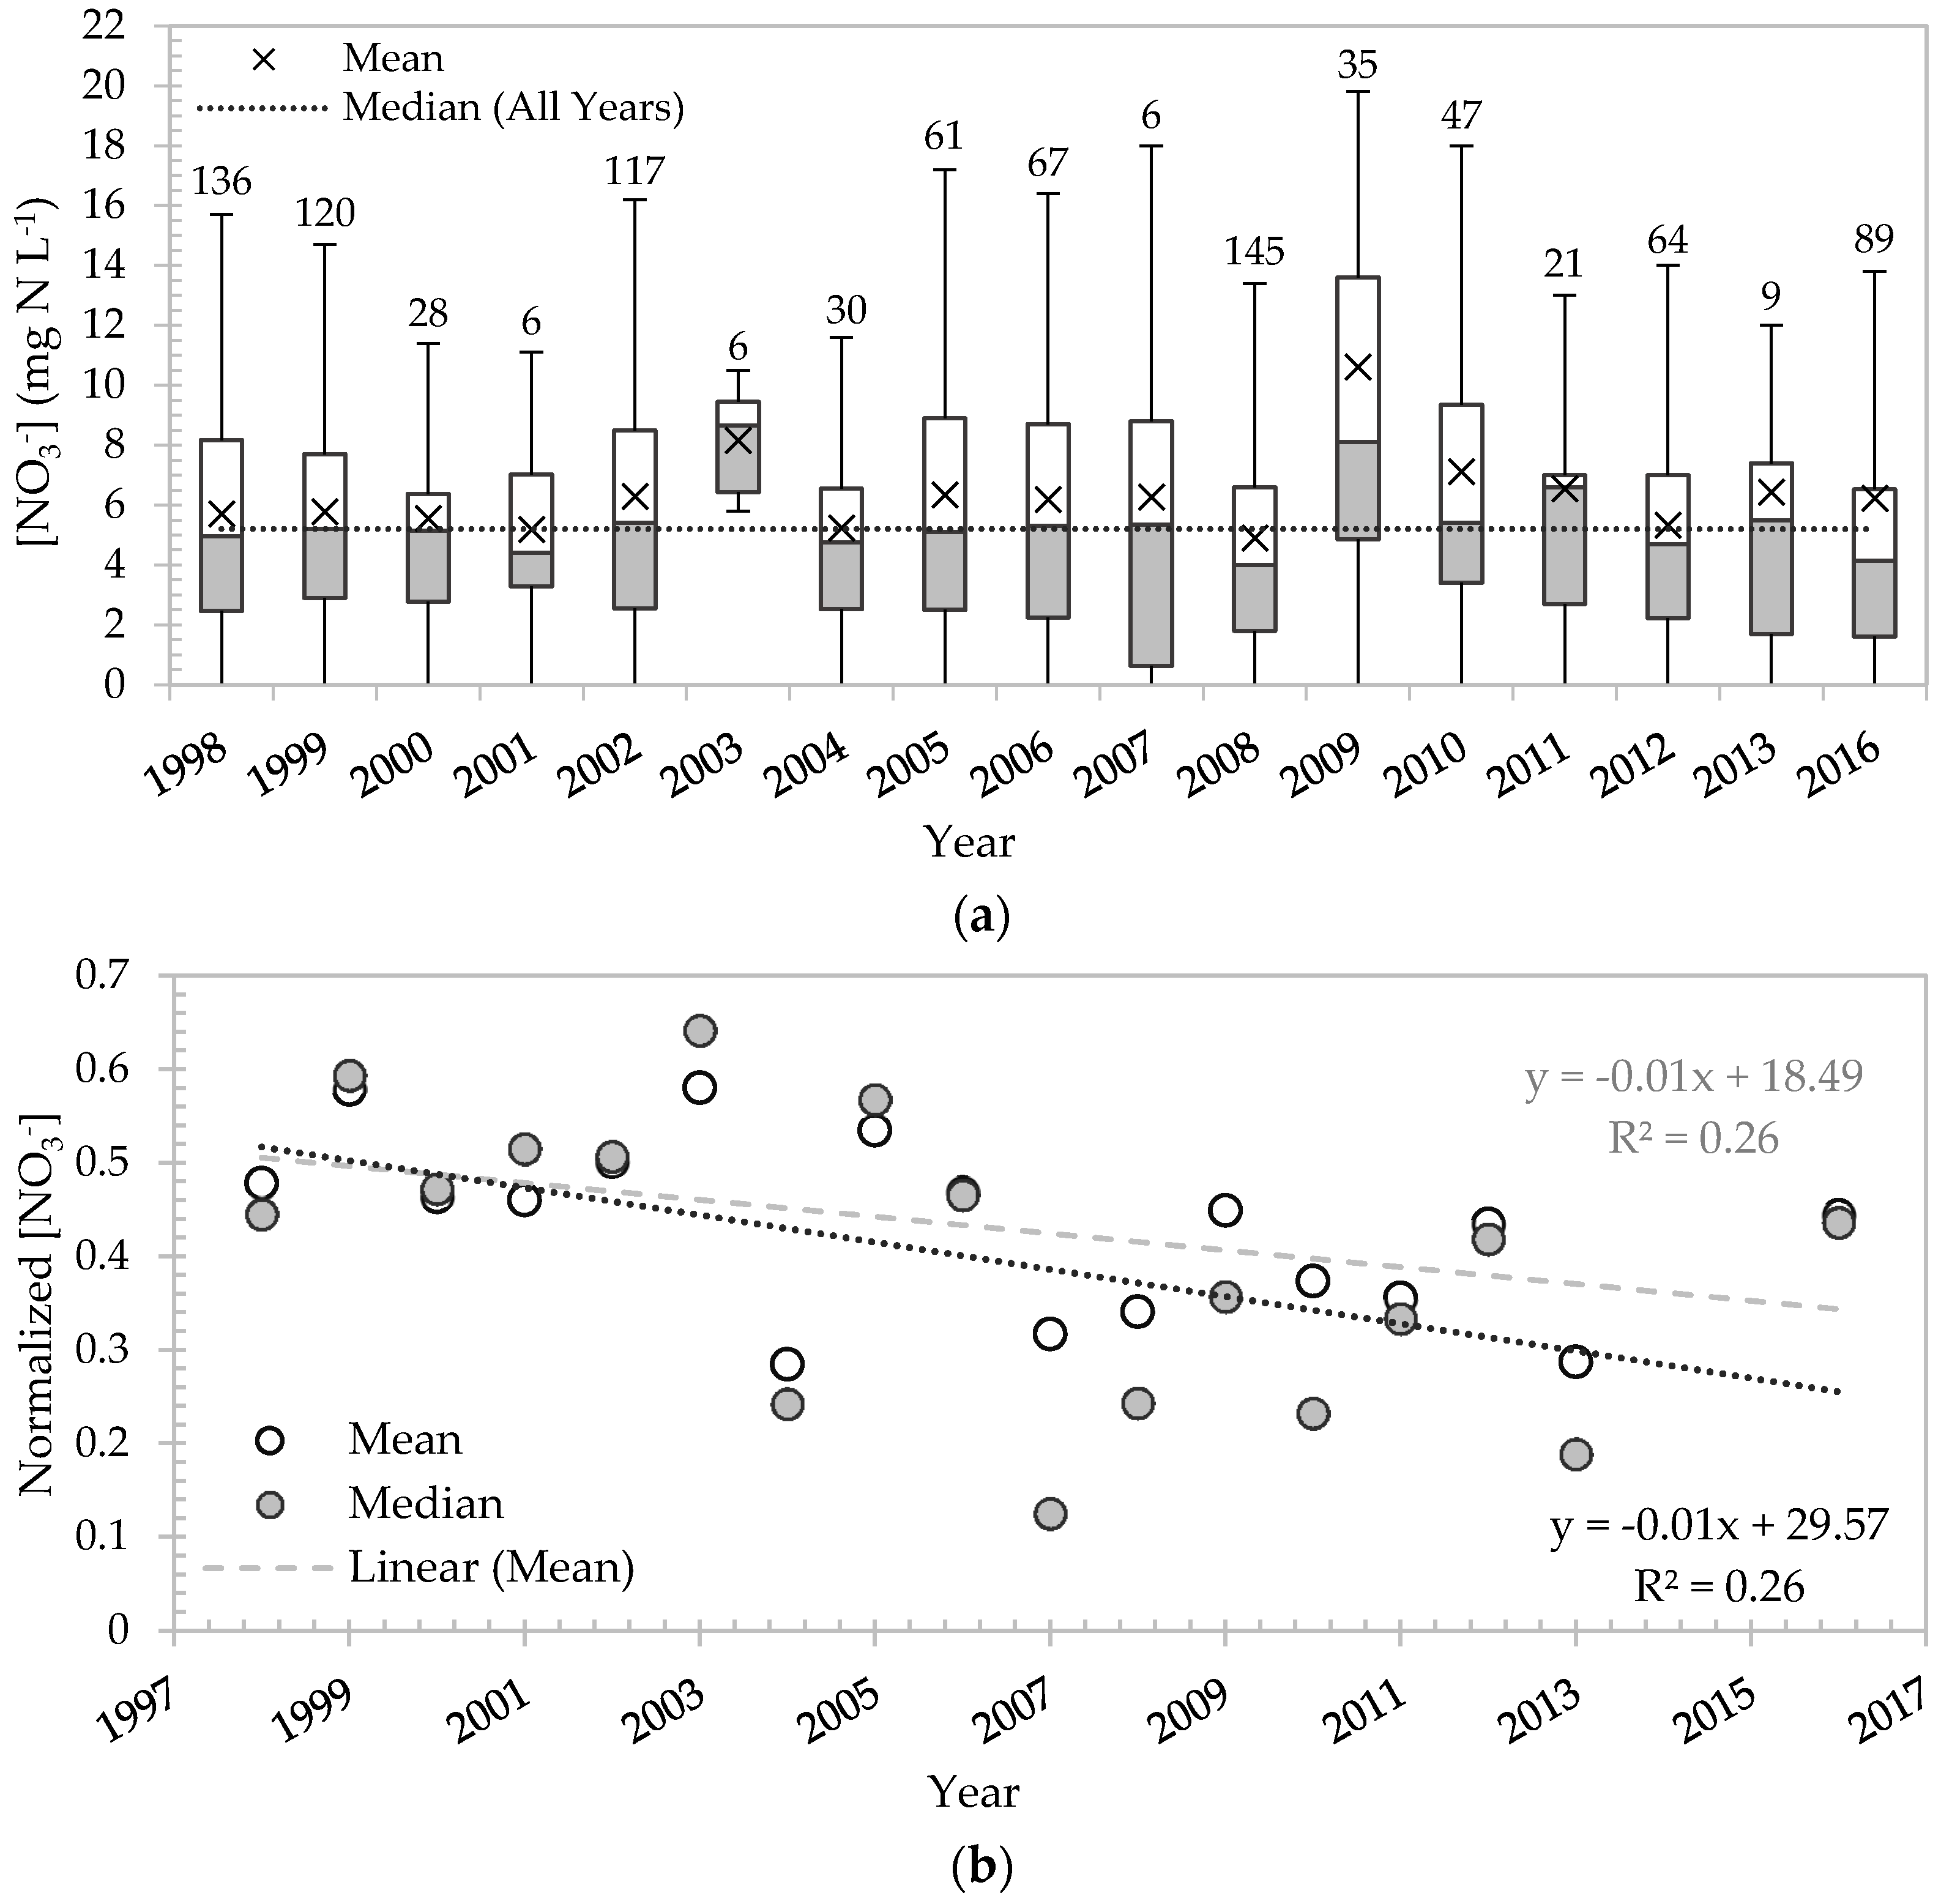
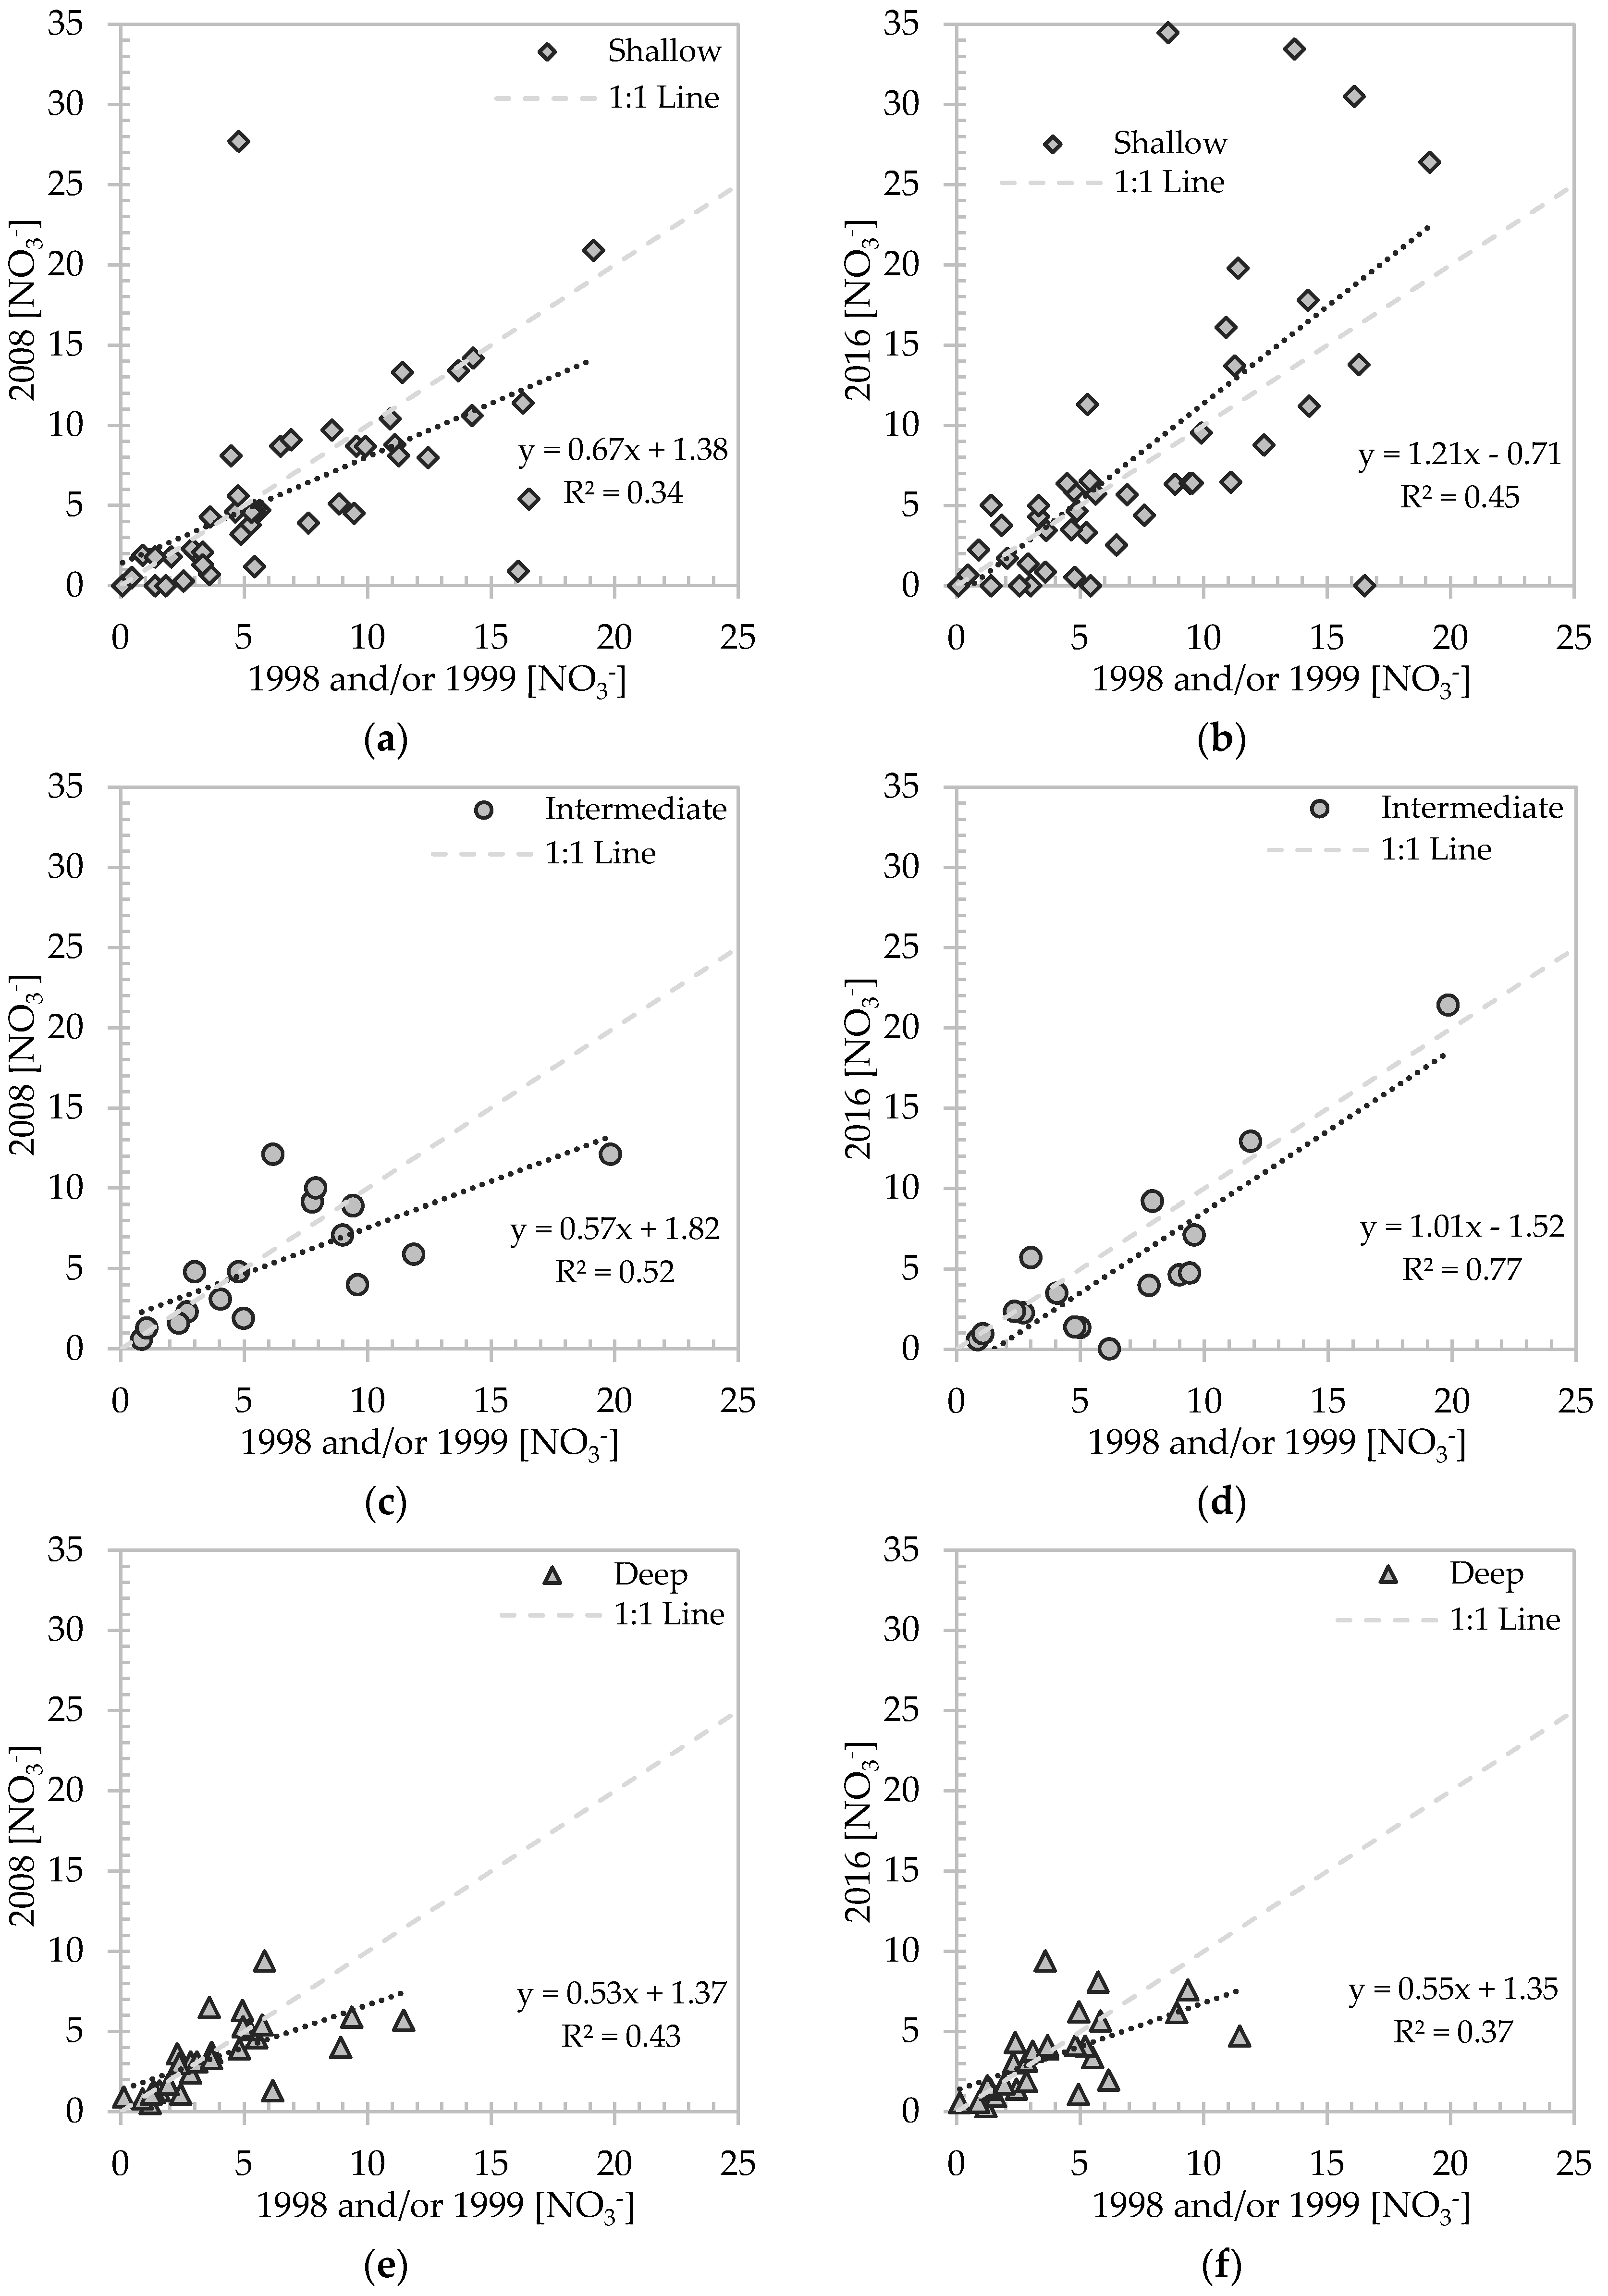
3.3. Nitrate Analysis

A combination of data collected in the 1990 and 2016 studies, in addition to long-term groundwater monitoring, provided two approaches to analyze nitrate concentration trends:
  • Comparison of data collected in 1998 [11,31] to data collected in 2016 at the same well nests where groundwater age-dating was conducted (Table 2 and Figure 4); and
  • Analysis of a long-term dataset from much broader groundwater collection efforts in the Dutch Flats area, including sporadic sampling between 1998 and 2016, and intensive sampling in 1998, 1999, 2008, and 2016 (Table 3, Figure 5 and Figure 6, and Appendix A (Table A1)).
Focusing first on comparisons from Approach (1), nitrate samples collected in 1998 varied from 1.4 mg N L−1 to 15.8 mg N L−1, while 2016 ranged from 1.1 mg N L−1 to 46.8 mg N L−1 (Table 2), and 6 out of 14 samples collected in 2016 had lower [NO3] compared to samples collected in 1998 (Figure 4). Apart from Well 2D-I (1.3 mg N L1) and 2D-D (1.4 mg N L−1), groundwater from well nests sampled in 2016 had lower [NO3] with greater depth in the aquifer. Concentrations of ammonium in groundwater were below detection (<0.1 NH4-N mg L−1) in samples from the eleven wells where δ18O-NO3 was also determined (see wells listed in Table 2).
Prior to irrigation season, the 2016 Well 1G-S spring nitrate was 46.8 mg N L−1, while post-irrigation season was 22.1 mg N L−1. This trend is consistent with canal leakage diluting concentrations near canals, as suggested by Böhlke et al. [11]. The August 1998 [NO3] was 8.8 mg N L−1. Proximity to a nearby cattle feedlot could be influencing the high 2016 [NO3] observed in 1G-S. It is unknown the exact date operations began at this feedlot, though it is believed between 1998 and 1999, and has increased over the past two decades.
Nitrate concentrations from Well 1E-S were high in both studies (1998 = 15.8 mg N L−1; 2016 = 45.2 mg N L−1), though 2016 was uncharacteristically high. Well 1E-I (3.6 mg N L−1) and 1E-D (3.1 mg N L−1), which had screens approximately 12.7 m and 26.5 m below 1E-S, respectively, had much lower [NO3]. In addition to the 1998 and 2016 values reported above, data collected by NPNRD during 1996–1998 (n = 26) were used for supplementary analysis of Well 1E-S. Monthly averages over this period display increasing [NO3] starting in June, peaking in August, and declining thereafter. If fertilizer is applied around growing season, Well 1E-S displays a very short transport rate through the vadose and saturated zones, in that groundwater [NO3] quickly reflect surface activities. This is supported by a young groundwater age, and possibly suggests there is a preferential pathway to this well screen.
Well 1G-I was sampled twice in 2016 to evaluate temporal trends in both groundwater age and [NO3] near a canal. Apparent groundwater age was similar (spring = 5.9 years; fall = 5.3 years). Interestingly, [NO3] in this well decreased from 46.8 to 22.1 mg N L−1 in 2016. Similarity in groundwater ages between spring and fall sampling suggest groundwater [NO3] in this well are not diluted from a large percentage of 2016 canal water. That is, a seasonal pattern in [NO3] was observed, but if a significant fraction of canal water that infiltrated during the 2016 growing season was arriving at the well screen by fall 2016, then the groundwater age from fall sampling should be much less than groundwater age from spring sampling. Apparently, the mass flux of water leaking from canals drives groundwater deeper into the aquifer during irrigation season and dilutes groundwater nitrate with older (pre-2016) canal water with low [NO3].
Based on two relatively small datasets (Table 2 and Figure 4), it is difficult to identify trends in groundwater nitrate due to large variations in concentrations, and additional sources of nitrogen influencing Well 1G. As a result, additional long-term nitrate data collected by NPNRD were analyzed, as described in Approach (2) at the beginning of this section. In total, 2918 nitrate samples were collected in the Dutch Flats area between 1979 and 2016. However, wells are not consistently sampled, making it difficult to compare overall annual medians from one year to the next. Thus, only data from wells with two or more samples collected between 1998 and 2016 were used (n = 987 samples from a total of 160 wells; Figure 5a). If multiple samples were collected from a well within the same year, annual concentrations were averaged. The annual median and mean normalized values (Equation (5)) were then used to evaluate groundwater [NO3] trends in Dutch Flats (Figure 5b). Both mean and median of normalized annual nitrate concentrations suggest a decrease in groundwater [NO3] from 1998 to 2016, with statistically significant regression slopes (p-values of 0.04 in both cases).
Given the suggested decrease in [NO3] from the normalized data, we further explored trends in nitrate by evaluating three time periods. Time periods were selected based on the number of samples collected during a given year, as well as with respect to the time elapsed since the previous study. To characterize groundwater [NO3] during the 1990s study, data from 1998 and 1999 were used as a base comparison. Two additional years, 2008 and 2016, were compared directly to [NO3] in the late 1990s. These two years were selected because many samples were collected during 2008 and 2016. A total of 87 wells were sampled during all three time periods, and samples were further split based on screen depth (i.e., shallow, intermediate, and deep wells had n = 44, 16, and 27, respectively).
Overall, 52 out of 87 wells (60%) showed a decrease between 1998 and/or 1999 and 2016. The mean and median [NO3] are reported in Table 3 for each well depth, and results from individual samples are shown in Appendix A and Figure 6. Since the data were not normally distributed and data transformation did not help, the Mann–Whitney test was used to determine if the median [NO3] were different between the three periods (Table 3).
The median [NO3] for the 44 shallow wells decreased by 13% from 1998 to 2008, but increased by 13% from 2008 to 2016. These fluctuations may be attributed to the variation in precipitation, with high precipitation resulting in increased leaching rates. From 1996 to 1998 the average precipitation was 459 mm, compared to 303 mm and 497 mm from 2006 to 2008 and 2014 to 2016, respectively.
Though median concentrations were not significantly different (p-value 0.17; 5.6 versus 3.7 mg N L−1 for 1998 and 2016, respectively), 69% of the intermediate wells sampled had a reduction in [NO3] from 1998 to 2008 and 75% had a reduction from 1998 to 2016. The median [NO3] also decreased in the deep wells, but only by 8% from 1998 to 2008 and 6% from 1998 to 2016, and the differences were not statistically significant.
Although overall [NO3] trends are decreasing in many individual wells, there is substantial variability and uncertainty in overall results, and a lack of statistical significance in median values. Other variables such as vadose zone depth, fertilizer application rates, percent cropland (specifically corn) should be considered. To develop a better understanding of the complexities of the system, a statistical model coupled with an increase in predictor variables may help explain the large fluctuations in nitrate trends. Continued long-term monitoring of groundwater [NO3], perhaps with a sampling scheduled optimized by well characteristics and/or apparent vulnerability to groundwater nitrate contamination, will be critical for future studies.

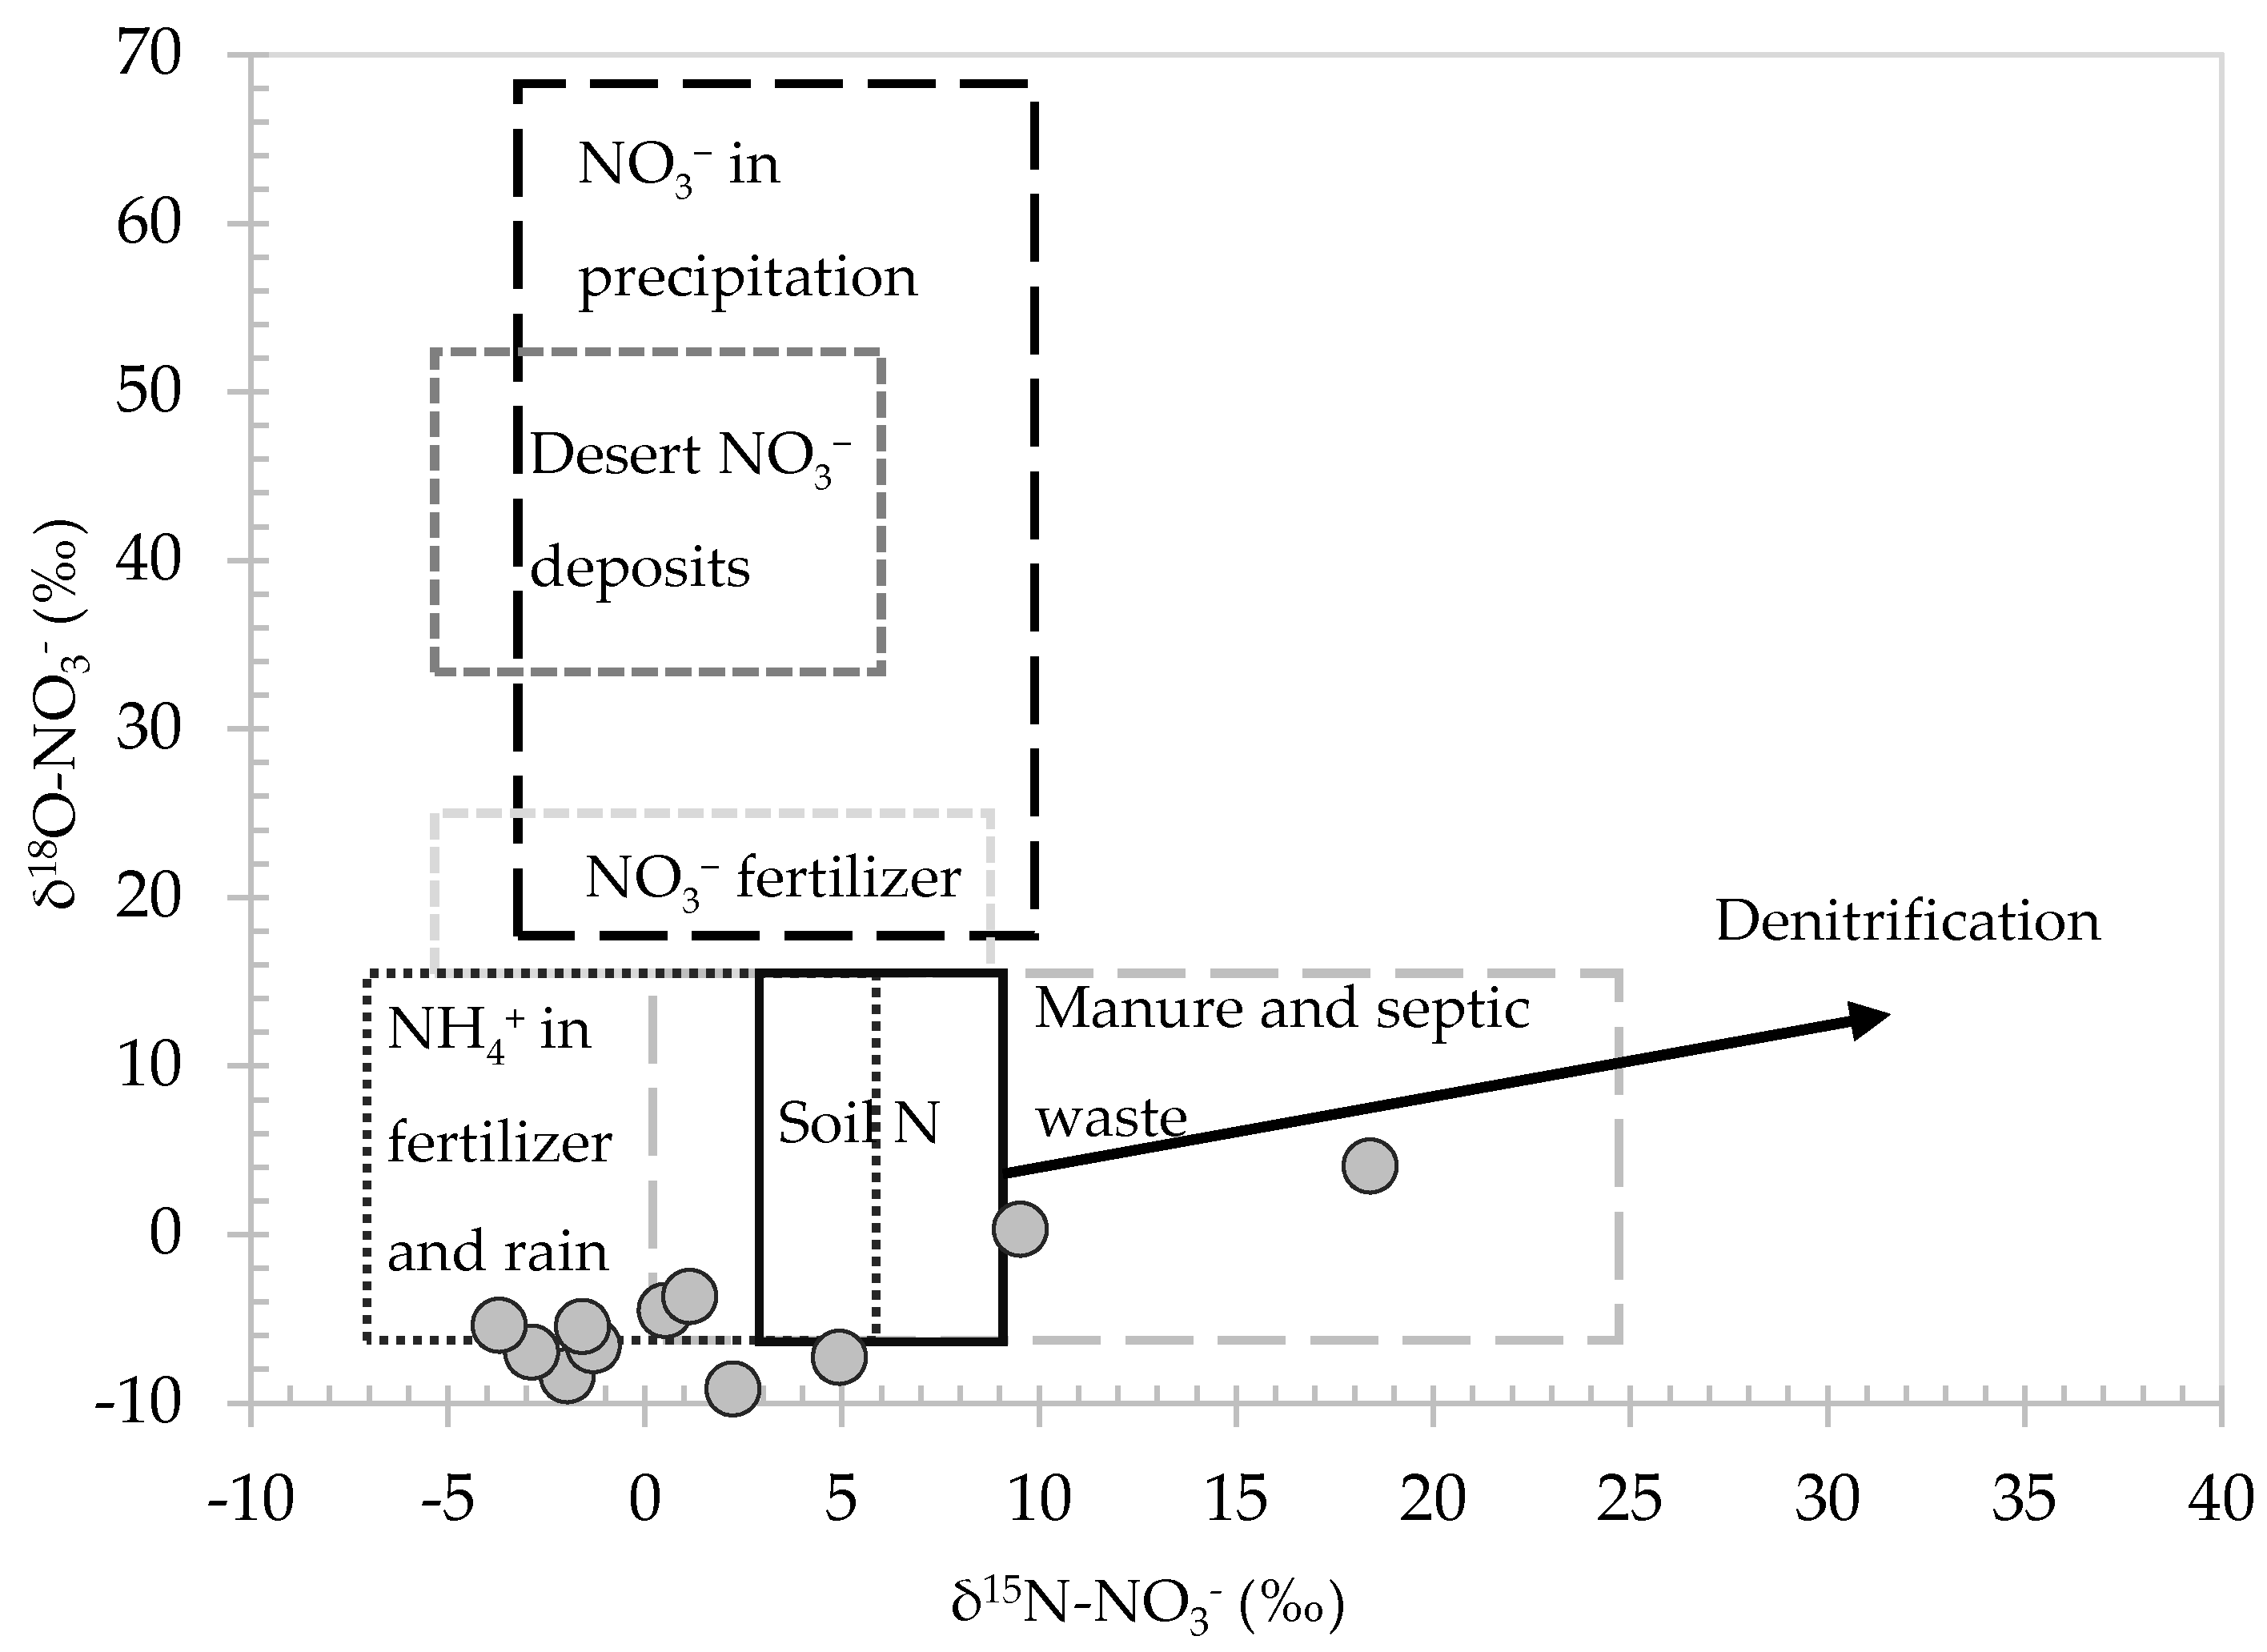
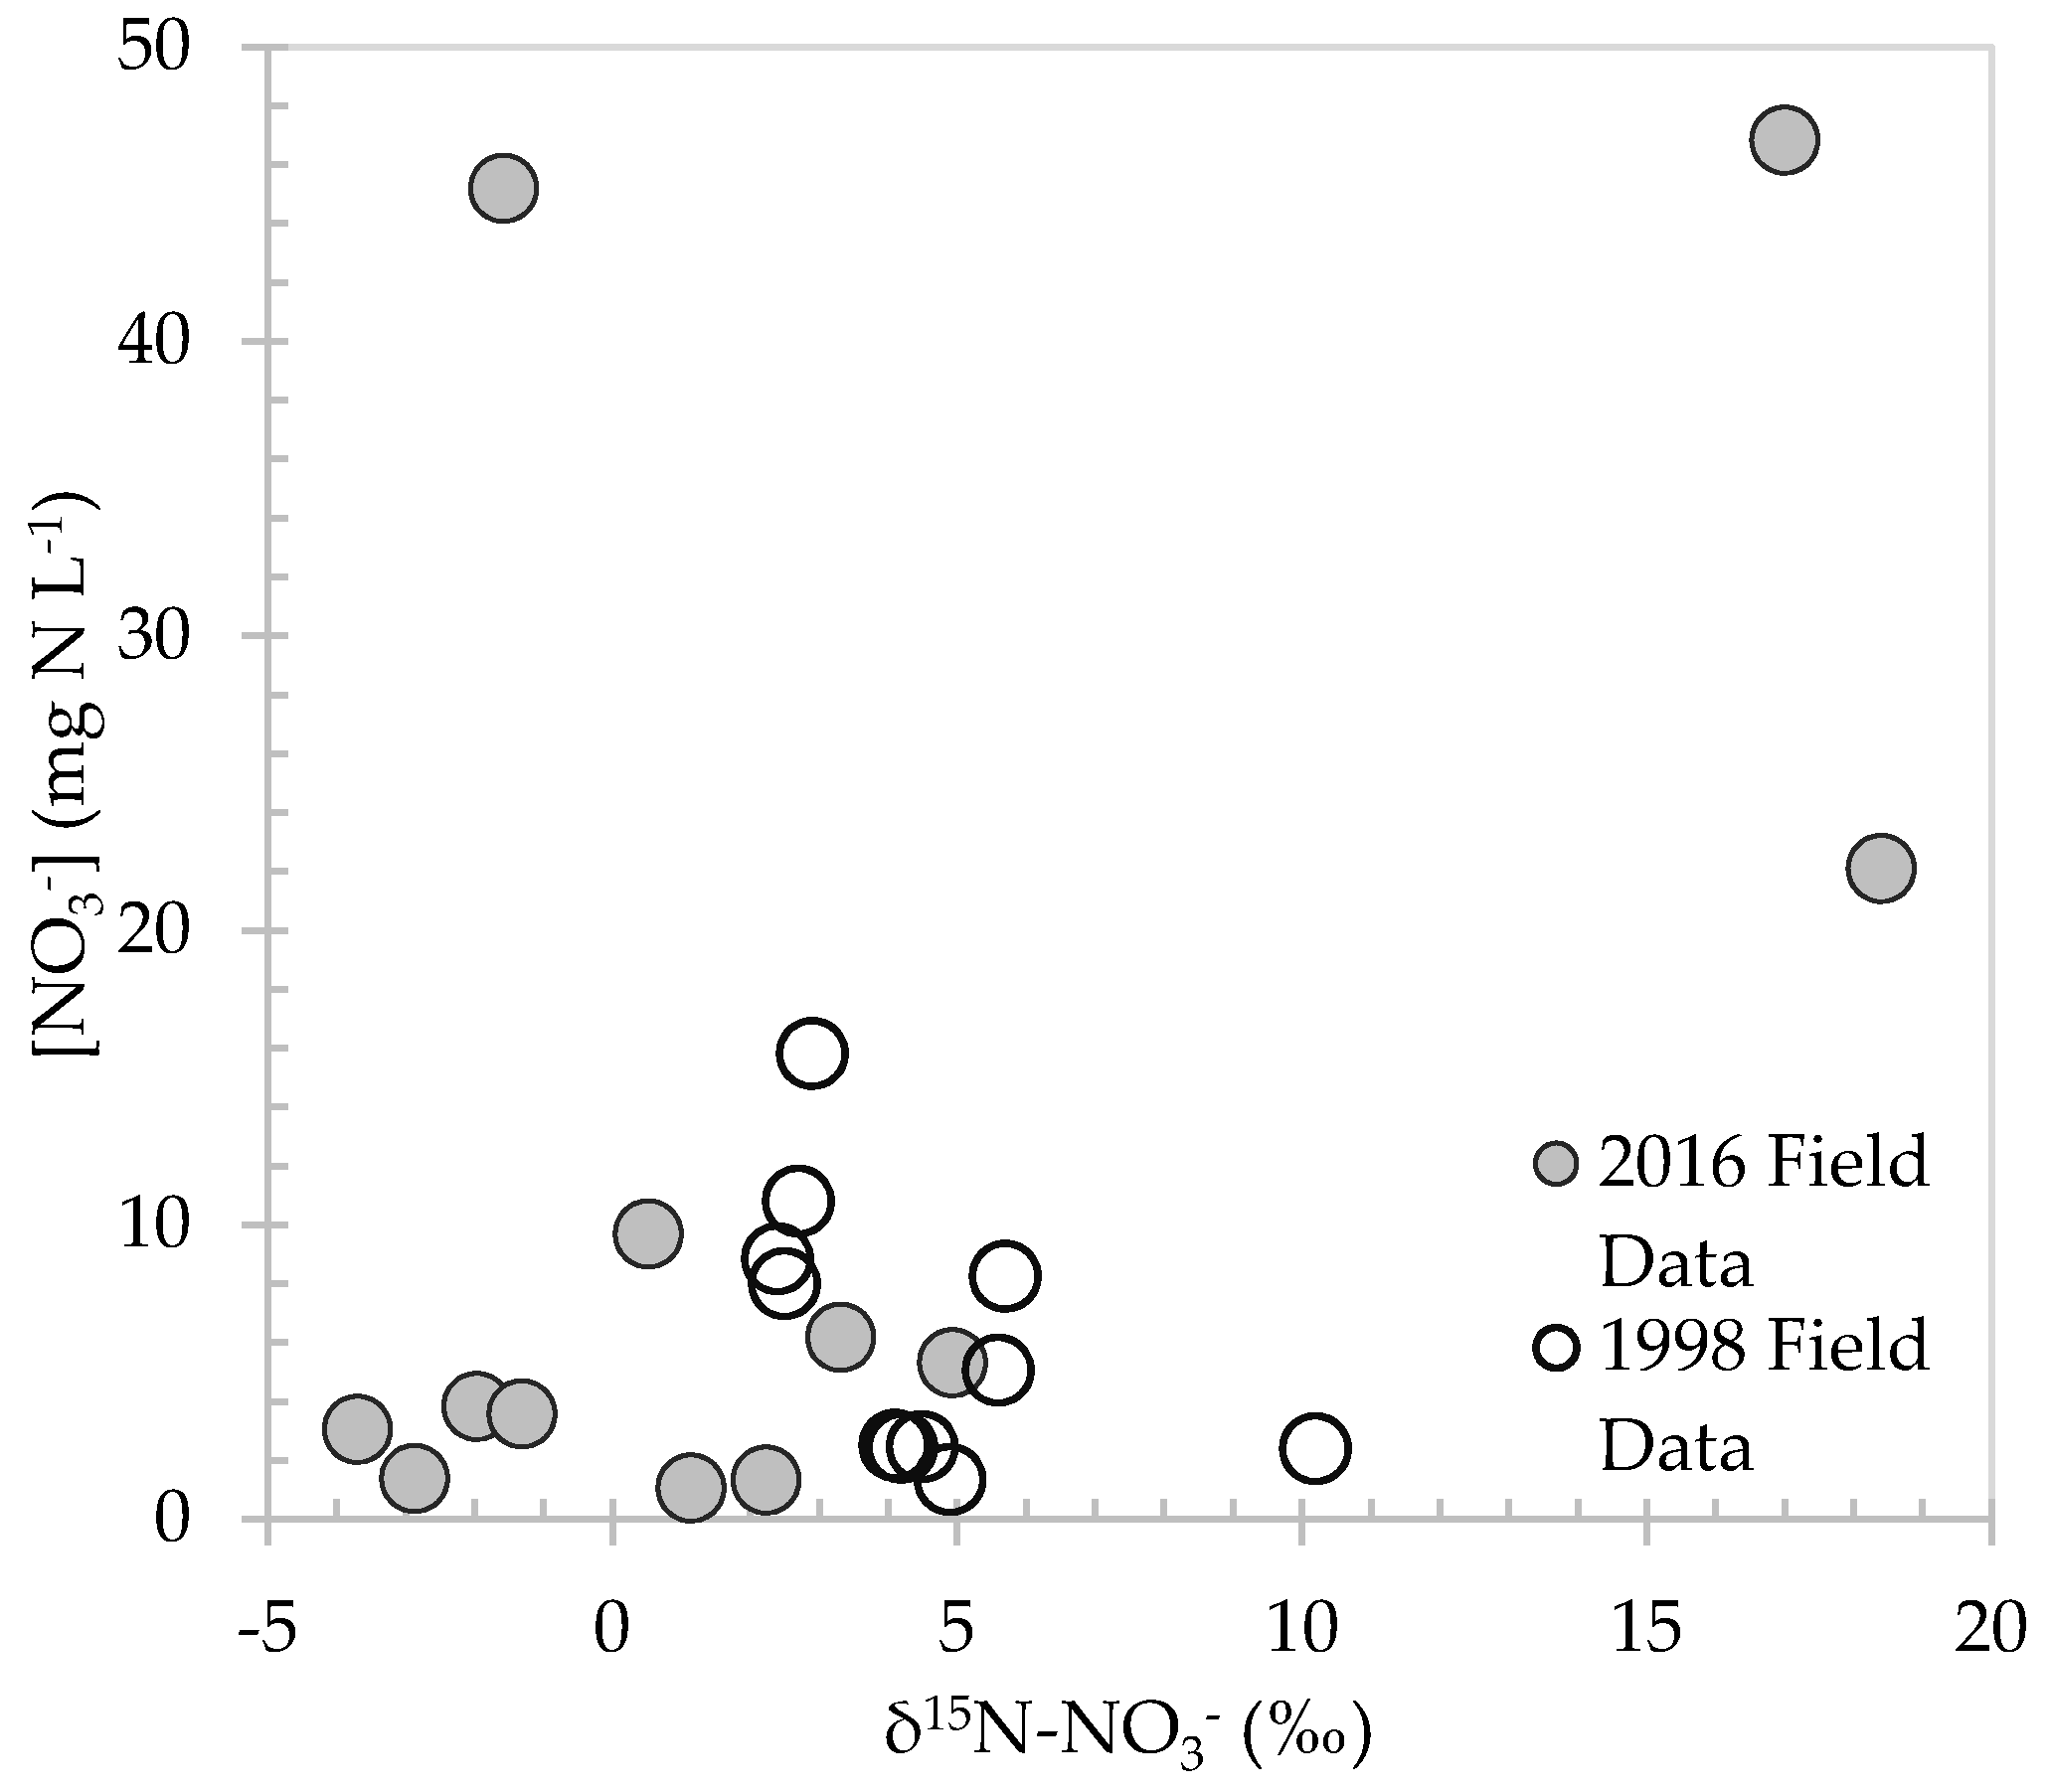
3.4. Sources of Nitrate

Nitrogen-15 isotopes of nitrate were analyzed to characterize nitrogen sources (Table 2 and Figure 7). Oxygen-18 isotopes of nitrate were also analyzed in 2016. Nitrogen, of both 14N and 15N, is fixed from the atmosphere to produce fertilizer. Plants favor 14N-NO3 to 15N-NO3 during assimilation, increasing 15N-NO3 observed in groundwater. It is believed this process also results in slightly elevated levels of 18O-NO3 [59]. With relatively constant atmospheric ratios of stable oxygen (18O:16O) and nitrogen isotopes (15N:14N), Equation 4 may identify enrichment or depletion of 18O-NO3 and 15N-NO3 in groundwater. The combination of δ15N-NO3 and δ18O-NO3 may be used to determine sources of nitrate and potential for denitrification to have affected nitrate [60,61]. Different signatures suggest nitrogen sources may be naturally occurring or associated with anthropogenic activities.
Well Nest 1G was sampled in both spring and fall, but only fall samples were collected for oxygen isotopes. Nitrogen isotopes were collected during each survey (n = 14), but only samples with an oxygen isotope counterpart were used in this analysis (n = 11). Recently collected δ18O-NO3 varied between −9.2 and 4.1‰, while δ15N-NO3 spanned from −3.7‰ to 18.4‰. The majority of nitrate in Dutch Flats study area appears to be derived from nitrification of ammonium in fertilizer and precipitation. Values from the 1G shallow well (δ18O-NO3 = 4.08‰, δ15N-NO3 = 18.4‰) and intermediate well (δ18O-NO3 = 0.33‰, δ15N-NO3 = 9.52‰) had higher nitrogen isotope composition in comparison to the other nine samples. Isotopically heavy δ15N-NO3 in Well 1G is consistent with nitrate from organic sources (i.e., manure), and is consistent with its proximity to an adjacent feedlot (Figure 7).

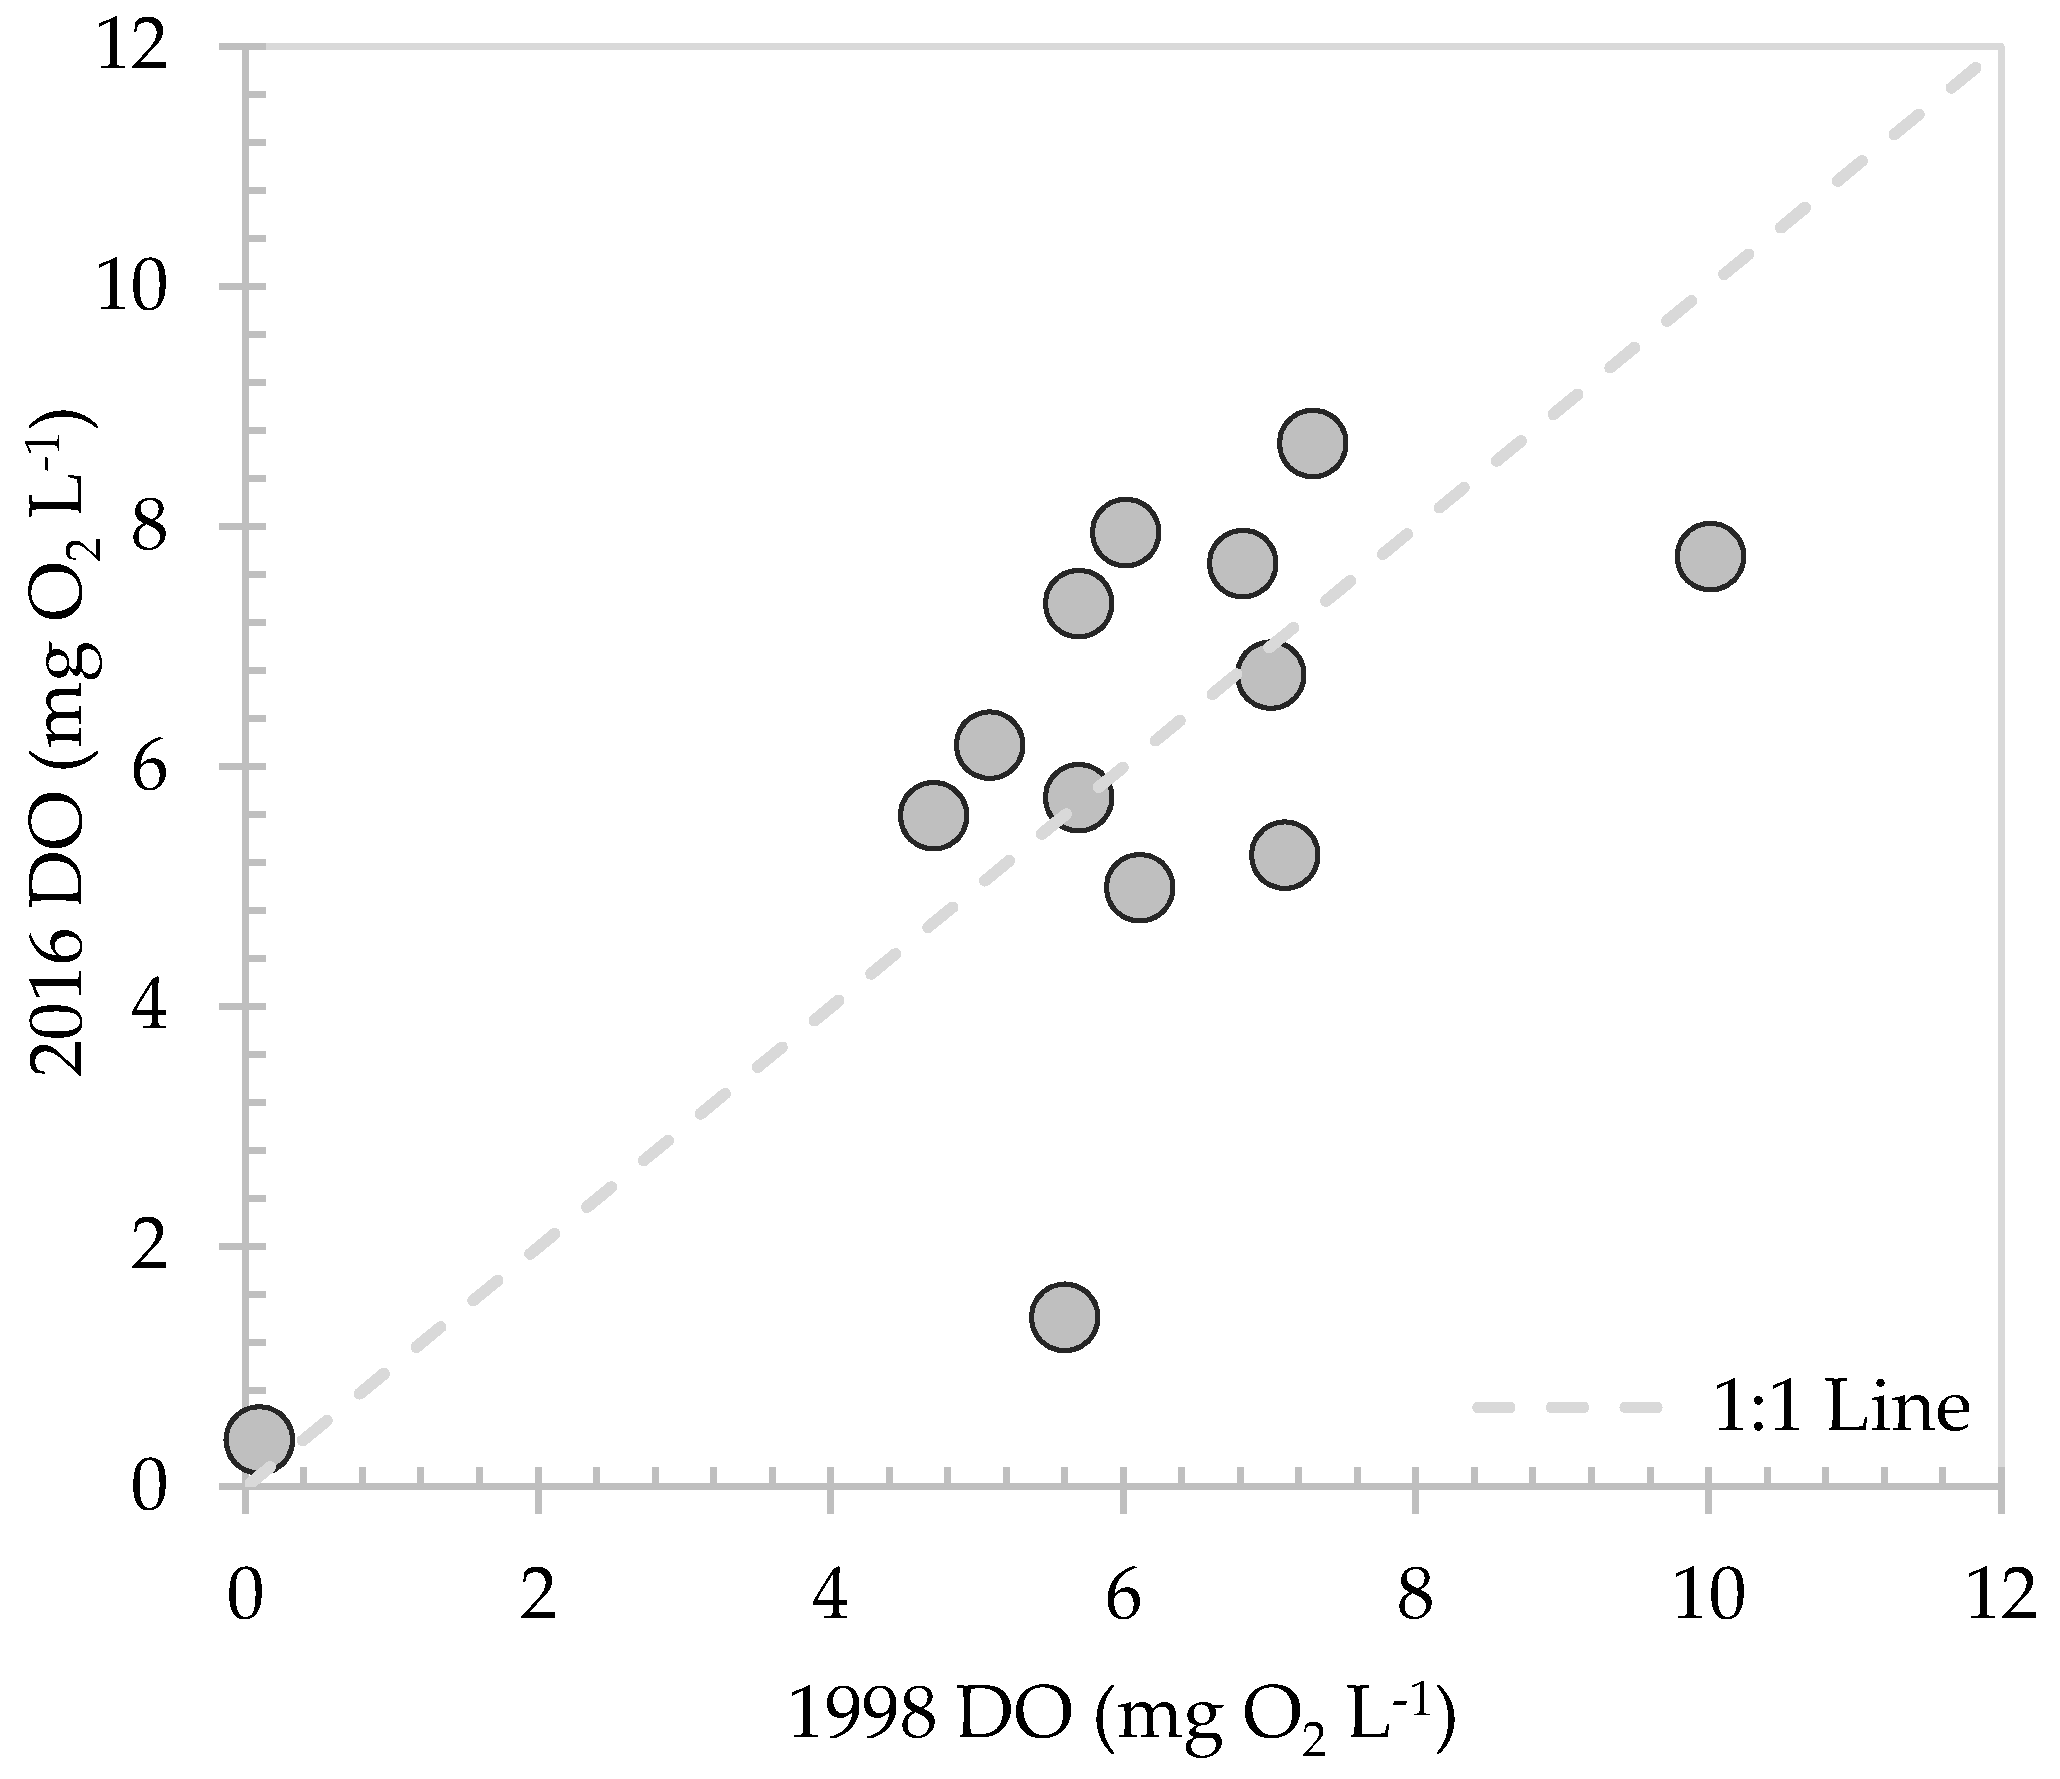
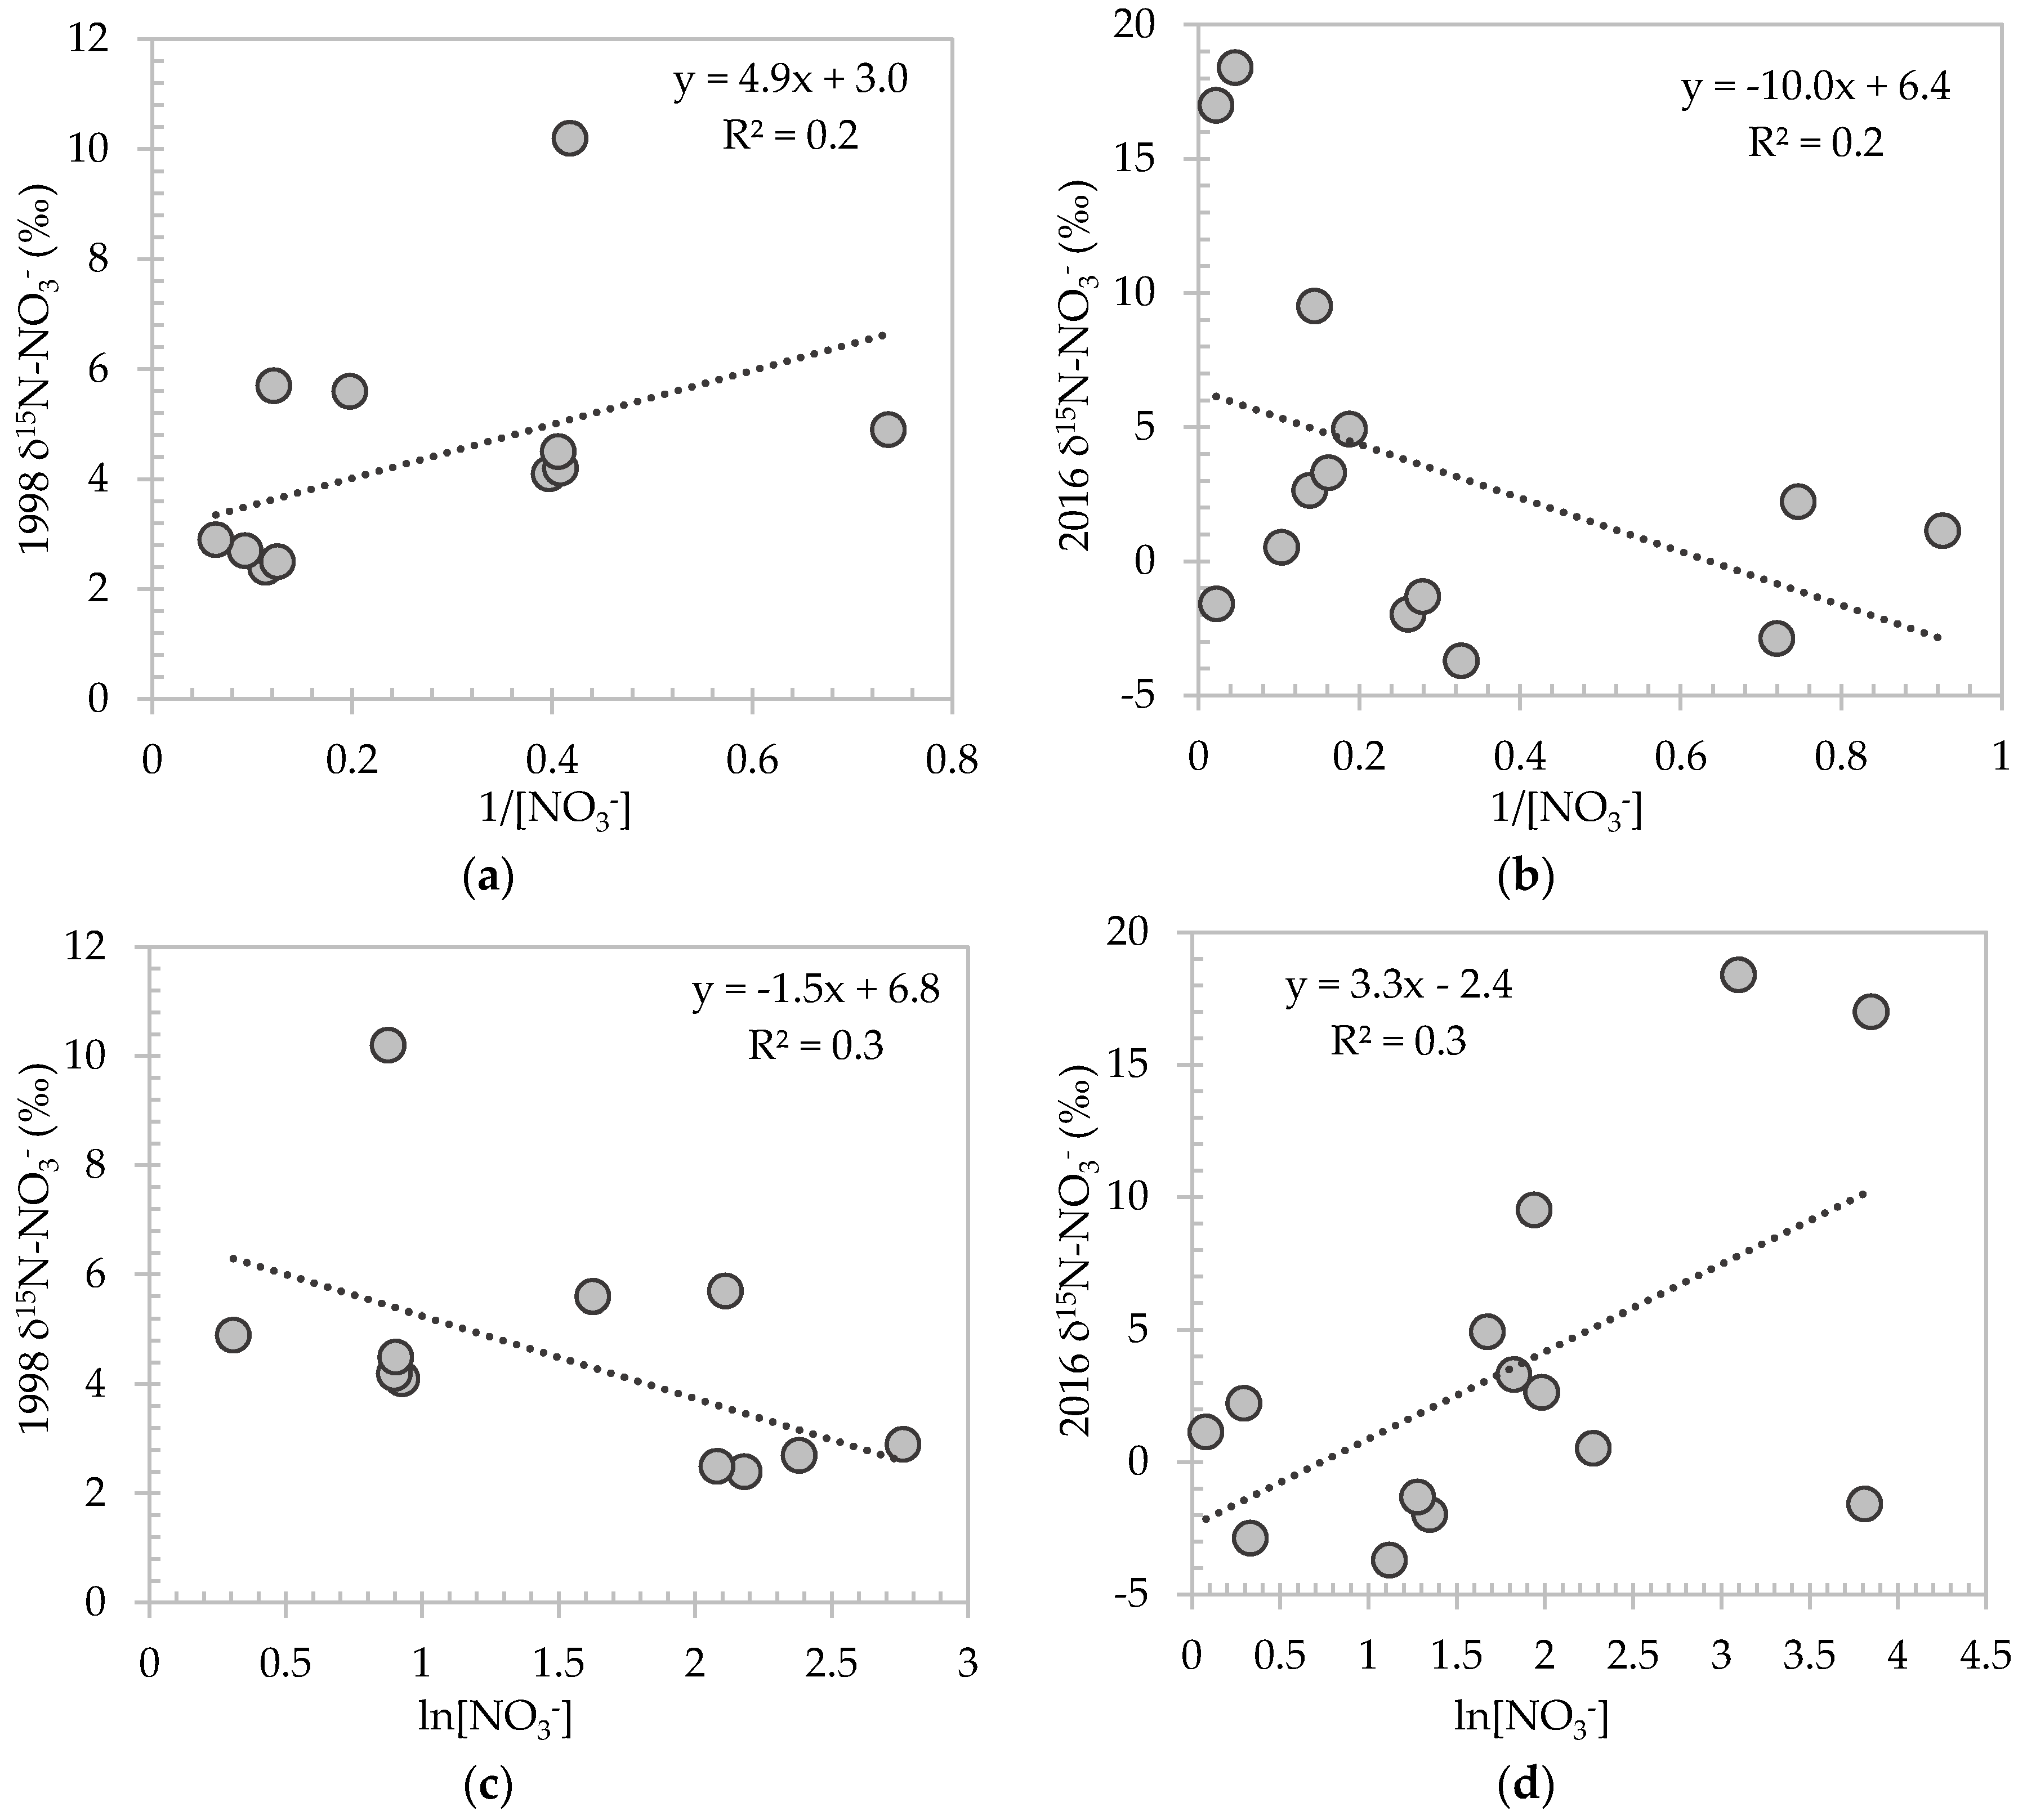
3.5. Biogeochemical Processes

Nitrate isotope composition, dissolved oxygen (DO), and DOC were used to indicate changes in biogeochemical activity affecting nitrate, such as denitrification. Results from DO and DOC may be referenced in Appendix A (Figure A1 and Figure A2). Nitrogen isotopes were collected and analyzed for their signatures in both 1998 and 2016 (Table 2). Samples from Well 1G-I were not available from the 1990s study. Denitrification could lead to increased δ15N-NO3. However, data collected in 2016 generally displayed a leftward shift in δ15N-NO3 compared to 1998. Overall, results do not suggest an increase in denitrification rates throughout the region (Figure 8). Values from 1998 ranged 2.4 to 10.2‰, while 2016 ranged from −3.7 to 18.4‰. Of the 14 samples collected in 2016 for δ15N-NO3, 12 samples had a 1998 counterpart. Eight samples show stable or even a slight decrease in δ15N-NO3 (average change = −6.0‰), while two, excluding two outliers at 1G-S, increased (average change = 0.8‰).
Two nitrate isotope sample results stand out, both from Well 1G. From 1998 to 2016, δ15N-NO3 in Well 1G-S­ increased from 2.4‰, to 17‰ and 18.4‰ in the spring and fall, respectively. It was noted during collection of groundwater in spring of 2016 that Well 1G-S had a yellow color, and spring-time sample collection occurred immediately after a large precipitation event. Thus, it is possible the organic nitrogen source of nitrate was a result of runoff. Increased nitrogen isotope composition in 1G-S indicates and increased influence of organic nitrogen sources, but could also suggest more prevalent microbiological activity coinciding with a decrease in dissolved oxygen (1998 = 5.6 mg O2 L−1, fall 2016 = 1.4 mg O2 L−1), although the groundwater was not strictly anoxic when samples in 2016. Dissolved organic carbon can serve as a mechanism driving microbial activity and denitrification, and within Well 1G-S, DOC increased from 1998 (2.9 mg C L−1) to 2016 (10.2 mg C L−1). Such increases indicate nitrogen from feedlot manure had little influence on samples collected in 1998, or yet to be in operation. Under anoxic conditions (DO < 0.5 mg O2 L−1), reduction of nitrate becomes favorable when concentrations are above 0.5 mg N L−1 [63]. It is possible recharge from high dissolved oxygen in canal water may prevent conditions from becoming anoxic at this site, and without canal leakage, denitrification could be higher.
Well 1L-D, located near North Platte River, had a water table approximately 2 m below the surface. This well had the largest 1998 (10.2‰) to 2016 (1.1‰) decrease in δ15N-NO3, although DO (1998 = 0.1 mg O2 L−1, 2016 = 0.4 mg O2 L−1) indicated consistent anoxic conditions. Slightly higher 1998 concentrations of NO3-N and DOC, coupled with lower DO in 1998, may explain the larger δ15N-NO3 value. From further examination of δ15N-NO3 versus 1/[NO3] and δ15N-NO3 versus ln[NO3], mixing analyses (Figure A3) were inconclusive as to whether mixing of high- and low-[NO3] groundwater or denitrification were factors influencing groundwater nitrate in the Dutch Flats area [64].

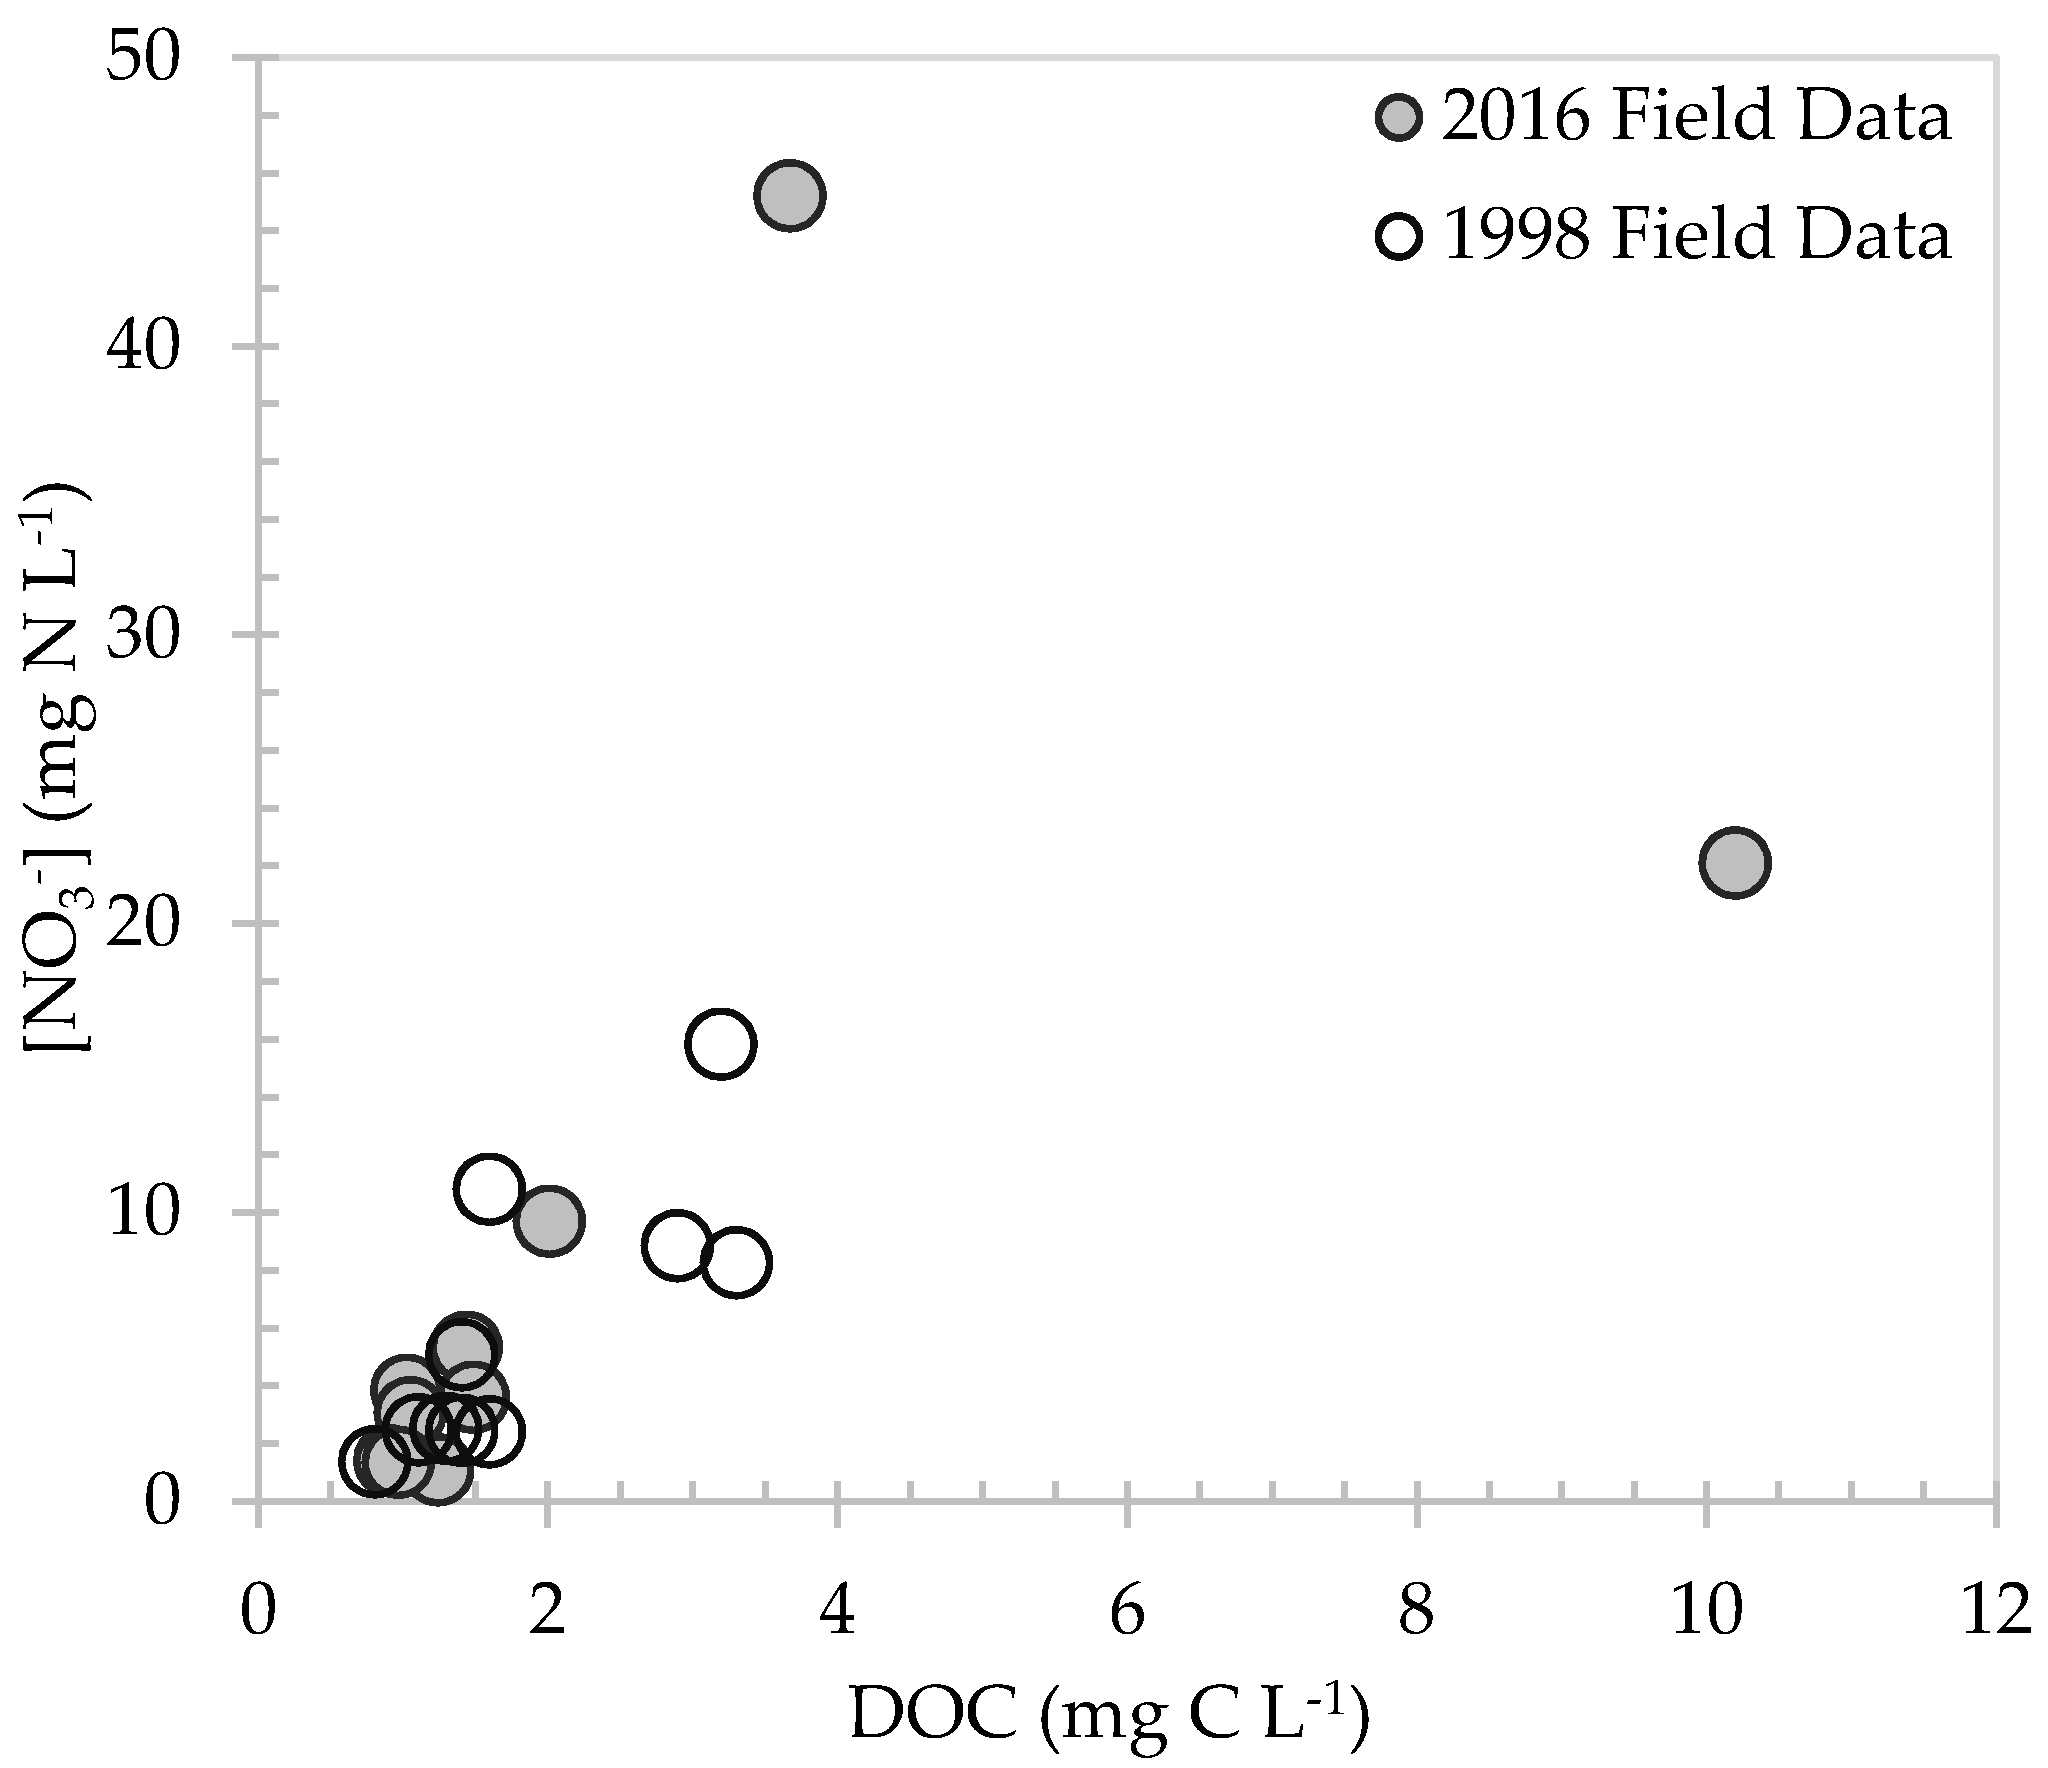
3.6. Analysis of Other Relevant Environmental Variables

Potential changes in relevant environmental variables were evaluated for time periods prior to the 1998 and 2016 studies (i.e., before and after the USGS study). Variables associated with recharge (precipitation and Interstate Canal discharge) and nitrate (planted corn area and fertilizer loads) were analyzed for statistically significant differences between the two time periods. Precipitation records used were from the Western Regional Airport in Scottsbluff, NE [38]. Annual volume of water diverted into the Interstate Canal was from a gage station approximately 1.6 km downstream of Whalen Diversion Dam in Wyoming [65]. Planted corn area and fertilizer loads are both estimates for Scotts Bluff County [66,67]. Due to limited fertilizer application data, two time periods, each 13 years, were compared from 1987 to 1999, and 2000 to 2012. All other variables were compared over 17-year periods prior to and after the completion of the 1990s USGS study. Datasets were determined to follow a normal distribution, and a two-sample t-test was used to evaluate statistically significant differences between two time periods for each variable (Table 4).
Besides precipitation (p = 0.11), each environmental variable was determined to be significantly different when comparing the two time periods. Both Interstate Canal discharge and fertilizer loads exhibited a reduction, while planted corn area increased between the time periods. The inverse relationship between planted corn area and fertilizer loads is interesting and perhaps suggests an improvement in fertilizer application management, or possibly higher uncertainties associated with county level fertilizer estimates. The reduction in discharge from the canal may be attributed to the change in irrigation management practices.

3.7. Further Discussion

Since the previous 1990s study, numerous environmental variables related to groundwater nitrate contamination have undergone changes, including shifts in irrigation practices and canal management. Center pivot irrigated area has increased an estimated 270% from 1999 to 2017 within Dutch Flats. Much of the increase has occurred on fields previously irrigated by furrow systems, although there has likely been an increase in overall irrigated acres as well. Scotts Bluff County total irrigated area statistics from the National Agricultural Statistics Service [68,69] estimated an increase in irrigated area over a similar time period (1997 = 70,075 hectares; 2012 = 80,611 hectares). A significant difference in the means was found when comparing volumes diverted into the Interstate Canal from 1983–1999 to 2000–2016. While precipitation also displayed decreasing trends, statistical analysis did not find a significant difference over the same period. With more efficient irrigation methods, less precipitation, and decreased canal discharge, a decrease in recharge rates would be expected. Although seven of the eight wells did have decreased recharge rates, the mean recharge rates from the two studies were not significantly different. This may be attributed to insufficient time passing between the two sampling periods.
Groundwater denitrification still does not appear to be a major process affecting nitrate attenuation in Dutch Flats since the previous study. Nitrate data collected in 2016 and compared to a small subset of results from the previous study identified a large scatter in data. Three 2016 samples (two from the same well) had high nitrate concentrations, making it difficult to compare trends from the two small datasets. Additional analysis of long-term nitrate data collected by the NPNRD suggests [NO3] have decreased in most wells between 1998 and 2016. Further, two variables related to nitrogen inputs were evaluated during this study: hectares of planted corn and estimated fertilizer loads. The two variables showed significant differences in their means; planted corn area has increased, while fertilizer loads have decreased since the previous study.
Decreased recharge rates were hypothesized to have reduced nitrate concentrations in the Dutch Flats area. However, trends from this study suggest that: (1) improved irrigation efficiency and changes to canal management have yet to significantly influence recharge rates in Dutch Flats; and (2) [NO3] are currently decreasing as a result of a combination of variables, perhaps including improved nitrogen management practices. The second point is further suggested by a significant increase in planted corn area, yet significant decrease in estimated fertilizer application in Scotts Bluff County. In other words, it is possible other variables beyond irrigation practice and canal management are currently driving the decreasing trends in groundwater [NO3], consistent with other studies that emphasize the need to improve both water and nitrogen management in agricultural production [12,13,70,71]. It should be noted, however, that, while this study was unable to detect a significant reduction in recharge rates, limitations and uncertainties associated with groundwater age-dating and recharge calculations may make it difficult to identify a small but meaningful decrease. If future research were performed in a similar manner and found decreased recharge rates compared to this study, an even greater reduction in groundwater [NO3] is likely to be observed.
It is noteworthy that an estimated increase in irrigated area from 1997 to 2012 is being supplemented by a decrease in annual volume of water diverted into the Interstate Canal, with little indication of increased groundwater withdrawals. Without increased precipitation, these trends, nonetheless, serve as potential evidence of the extent at which irrigation efficiency has improved. Simply put, it is possible less water is being applied to fields regionally, even with increases in irrigated area.
An interesting dynamic to consider is the high leakage potential from canals in this region, and their association with diluting groundwater [NO3]. If future efforts are made to improve irrigation efficiency through lining canals, less artificial recharge will be supplied to the region. Ultimately, this could result in a declining water table elevation, where it has been found artificial recharge is important in restoring aquifer storage and improving groundwater quality [72]. Further, it is unknown how the impact these water management improvements may have on groundwater [NO3]. For instance, less nitrate might leach below the root zone with continued advancements in irrigation efficiency, however, less artificial recharge from low-[NO3] canal water would be present to dilute groundwater [NO3].

4. Conclusions

The study area, known locally as the Dutch Flats, has undergone changes in numerous variables influencing groundwater attributes, on timescales similar to those of groundwater movement through the aquifer. This study exemplifies the ability to use intensive snapshot sampling, coupled with long-term continuous data, to evaluate groundwater trends. Varying results in both recharge and [NO3] from this study promote supplementary, and possibly more expansive investigations in the Dutch Flats area. It is possible more time is required to observe changes in groundwater recharge rates. Accounting for lag time through the vadose and saturated zones, some portions of the aquifer may have yet to reflect how changes in environmental variables will impact groundwater quantity and quality. Future resampling in the study area would be beneficial, though carefully-designed long-term monitoring and/or sampling from more wells would offer a better comparison to the more comprehensive 1990s survey. With a vast dataset of nitrate data available through the NPNRD, additional analysis could be beneficial in the identification of variables within Dutch Flats most strongly related to groundwater [NO3]. Existence of the long-term nitrate dataset, coupled with groundwater age-dating to establish a range of lag times, makes for an opportune setting for additional analytics such as machine learning algorithms or classification techniques.

Author Contributions

Conceptualization, T.E.G.; Formal analysis, M.J.W., T.E.G. and A.R.M.; Funding acquisition, T.E.G., D.S. and S.S.S.; Investigation, M.J.W., T.E.G. and S.S.S.; Methodology, T.E.G. and D.S.; Project administration, T.E.G.; Resources, T.E.G.; Supervision, T.E.G.; Writing—original draft, M.J.W.; and Writing—review and editing, M.J.W., T.E.G., A.R.M., D.S. and S.S.S.

Funding

This work was supported by the U.S. Geological Survey 104b Program (Project 2016NE286B), U.S. Department of Agriculture—National Institute of Food and Agriculture (Hatch project NEB-21-177), and Daugherty Water for Food Global Institute Graduate Student Fellowship.

Acknowledgments

The authors acknowledge the North Platte Natural Resources District for providing technical assistance and resources, including long-term groundwater nitrate data accessed via the Quality-Assessed Agrichemical Contaminant Database for Nebraska Groundwater, and Mason Johnson (graduate research assistant) for his support in field sampling efforts. J.K. Böhlke (USGS) also provided insightful comments and suggestions during the project.

Conflicts of Interest

The authors declare no conflict of interest.

Appendix A

Table A1. Nitrate data from current study, North Platte Natural Resources District, and Nebraska Agricultural Contaminant Database. This dataset was used to create comparisons in Table 3 and Figure 6.
Well ID1990s [NO3] *
(mg N L−1)
2008 [NO3]
(mg N L−1)
2016 [NO3]
(mg N L−1)
10A-S1.40.00.0
10E-S16.55.40.0
10K-S7.63.94.4
10M-S9.54.56.4
10N-S3.02.10.0
1C-S9.98.79.5
1E-S13.713.433.5
1G-S8.69.734.5
1H-S11.38.113.7
1J-S16.311.413.8
1M-S10.910.416.1
1N-S3.32.14.3
2E-S4.93.24.7
2F-S16.10.930.5
2J-S12.48.08.8
3B-S2.60.30.0
3C-S1.80.03.8
3F-S4.827.70.5
4A-S0.50.50.7
5A-S2.92.31.4
5B-S0.91.92.2
5D-S11.18.86.5
5F-S4.74.63.5
5G-S11.413.319.8
6C-S4.85.65.9
6D-S19.220.926.4
6E-S8.95.16.3
6F-S3.60.70.9
6G-S2.11.81.7
6H-S3.64.33.5
6M-S4.58.16.4
6N-S6.99.15.7
7A-S5.33.83.3
7B-S6.58.72.6
7C-S14.314.211.2
7D-S3.31.35.0
7H-S14.210.617.8
8B-S5.34.611.3
8C-S5.64.75.7
8D-S5.44.76.5
8E-S0.10.00.0
8G-S1.41.85.0
9D-S5.41.20.0
9E-S9.68.76.4
11D-M2.72.32.2
1C-M3.04.85.7
1E-M9.07.14.6
1G-M9.64.07.1
1H-M4.03.13.5
1J-M7.89.24.0
1M-M11.95.912.9
2C-M2.31.62.3
2D-M5.01.91.3
2F-M19.812.121.4
2J-M9.48.94.7
2L-M4.84.81.4
3C-M1.11.30.9
3E-M7.910.09.2
3F-M6.212.10.0
5B-M0.90.60.6
10A-D3.66.59.4
10E-D5.25.14.1
10K-D5.05.36.2
10M-D9.45.97.6
11A-D4.83.94.2
1C-D2.43.04.3
1E-D2.33.63.1
1G-D8.94.06.2
1L-D4.96.31.1
2C-D2.82.41.9
2D-D1.41.21.4
2F-D3.13.13.8
2L-D1.61.31.0
3B-D1.20.50.3
3C-D1.21.11.6
3E-D3.73.73.9
3F-D11.55.74.7
5B-D0.90.80.6
6G-D6.21.32.0
6H-D0.10.90.6
6M-D2.41.11.4
7A-D1.91.71.7
7C-D5.89.45.7
7D-D3.73.34.1
8D-D5.75.48.1
9D-D2.83.13.1
9E-D5.54.63.4
Note: * Value shown is from 1998 or 1999, or the average from the two years.
Figure A1. Comparison of groundwater dissolved oxygen (DO) in 2016 to 1998, where DO was mostly similar between both studies.
Water 10 01047 g0a1
Figure A2. Comparison of [NO3] in 2016 and 1998 to dissolved organic carbon (DOC). Large [NO3] and DOC at Well 1G-S are consistent with isotopes indicating high organic nitrogen source.
Water 10 01047 g0a2
Figure A3. Evaluating whether δ15N-NO3 suggests processes of mixing high- and low-[NO3] groundwater in: (a) 1998; and (b) 2016; or groundwater denitrification in: (c) 1998; and (d) 2016 [64]. Simple groundwater mixing nor denitrification were indicated from the composition of nitrogen isotopes throughout the Dutch Flats.
Water 10 01047 g0a3

References

  1. Almasri, M.N.; Kaluarachchi, J.J. Assessment and management of long-term nitrate pollution of ground water in agriculture-dominated watersheds. J. Hydrol. 2004, 295, 225–245. [Google Scholar] [CrossRef]
  2. Burkart, M.R.; Stoner, J.D. Nitrate in aquifers beneath agricultural systems. Water Sci. Technol. 2007, 56, 59–69. [Google Scholar] [CrossRef] [PubMed]
  3. Ritter, A.; Muñoz-Carpena, R.; Bosch, D.D.; Schaffer, B.; Potter, T.L. Agricultural land use and hydrology affect variability of shallow groundwater nitrate concentration in South Florida. Hydrol. Process. 2007, 21, 2464–2473. [Google Scholar] [CrossRef]
  4. Derby, N.E.; Casey, F.X.M.; Knighton, R.E. Long-term observations of vadose zone and groundwater nitrate concentrations under irrigated agriculture. Vadose Zone J. 2009, 8, 290–300. [Google Scholar] [CrossRef]
  5. Lockhart, K.M.; King, A.M.; Harter, T. Identifying sources of groundwater nitrate contamination in a large alluvial groundwater basin with highly diversified intensive agricultural production. J. Contam. Hydrol. 2013, 151, 140–154. [Google Scholar] [CrossRef] [PubMed]
  6. Nolan, B.T.; Ruddy, B.C.; Hitt, K.J.; Helsel, D.R. Risk of nitrate in groundwaters of the united states—A national perspective. Environ. Sci. Technol. 1997, 31, 2229–2236. [Google Scholar] [CrossRef]
  7. Saffigna, P.G.; Keeney, D.R.; Tanner, C.B. Nitrogen, chloride, and water balance with irrigated russet burbank potatoes in a sandy soil. Agron. J. 1977, 69, 251–257. [Google Scholar] [CrossRef]
  8. Albertson, P.N. Agricultural Chemicals, Land Use, and Their Impacts on Stream and Ground Water Quality in the Little Plover River Watershed. Master’s Thesis, University of Wisconsin—Stevens Point, Stevens Point, WI, USA, August 1998. [Google Scholar]
  9. Piskin, R. Evaluation of nitrate content of ground water in Hall County, Nebraskaa. Groundwater 1973, 11, 4–13. [Google Scholar] [CrossRef]
  10. Gosselin, D.C. Bazile Triangle Groundwater Quality Study; University of Nebraska: Lincoln, NE, USA, 1991; p. 29. [Google Scholar]
  11. Böhlke, J.K.; Verstraeten, I.M.; Kraemer, T.F. Effects of surface-water irrigation on sources, fluxes, and residence times of water, nitrate, and uranium in an alluvial aquifer. Appl. Geochem. 2007, 22, 152–174. [Google Scholar] [CrossRef]
  12. Exner, M.E.; Perea-Estrada, H.; Spalding, R.F. Long-term response of groundwater nitrate concentrations to management regulations in Nebraska’s Central Platte Valley. Sci. World J. 2010, 10, 286–297. [Google Scholar] [CrossRef] [PubMed]
  13. Exner, M.E.; Hirsh, A.J.; Spalding, R.F. Nebraska’s groundwater legacy: Nitrate contamination beneath irrigated cropland. Water Resour. Res. 2014, 50, 4474–4489. [Google Scholar] [CrossRef] [PubMed]
  14. Jenkins, W.J. A History of Nebraska’s Natural Resources Districts; Hyer, R.B., Ed.; Nebraska Department of Natural Resources: Lincoln, NE, USA, 1975. [Google Scholar]
  15. Exner, M.E.; Spalding, R.F. Groundwater quality and policy options in Nebraska. In Groundwater Quality and Policy Options in Nebraska; Smith, R., Ed.; Center for Applied Urban Research, University of Nebraska: Omaha, NE, USA, 1987. [Google Scholar]
  16. Cash, D.W. Innovative natural resource management: Nebraska’s model for linking science and decisionmaking. Environ. Sci. Policy Sustain. Dev. 2003, 45, 8–20. [Google Scholar] [CrossRef]
  17. Visser, A.; Broers, H.P.; van der Grift, B.; Bierkens, M.F.P. Demonstrating trend reversal of groundwater quality in relation to time of recharge determined by 3H/3He. Environ. Pollut. 2007, 148, 797–807. [Google Scholar] [CrossRef] [PubMed]
  18. Wassenaar, L.I.; Hendry, M.J.; Harrington, N. Decadal geochemical and isotopic trends for nitrate in a transboundary aquifer and implications for agricultural beneficial management practices. Environ. Sci. Technol. 2006, 40, 4626–4632. [Google Scholar] [CrossRef] [PubMed]
  19. Spalding, R.F.; Watts, D.G.; Schepers, J.S.; Burbach, M.E.; Exner, M.E.; Poreda, R.J.; Martin, G.E. Controlling nitrate leaching in irrigated agriculture. J. Environ. Qual. 2001, 30, 1184–1194. [Google Scholar] [CrossRef] [PubMed]
  20. McMahon, P.B.; Plummer, L.N.; Böhlke, J.K.; Shapiro, S.D.; Hinkle, S.R. A comparison of recharge rates in aquifers of the United States based on groundwater-age data. Hydrogeol. J. 2011, 19, 779–800. [Google Scholar] [CrossRef]
  21. Baudron, P.; Alonso-Sarría, F.; García-Aróstegui, J.L.; Cánovas-García, F.; Martínez-Vicente, D.; Moreno-Brotóns, J. Identifying the origin of groundwater samples in a multi-layer aquifer system with Random Forest classification. J. Hydrol. 2013, 499, 303–315. [Google Scholar] [CrossRef]
  22. Johnston, C.T.; Cook, P.G.; Frape, S.K.; Plummer, L.N.; Busenberg, E.; Blackport, R. Ground water age and nitrate distribution within a glacial aquifer beneath a thick unsaturated zone. Groundwater 1998, 36, 171–180. [Google Scholar] [CrossRef]
  23. Katz, B.G.; Chelette, A.R.; Pratt, T.R. Use of chemical and isotopic tracers to assess nitrate contamination and ground-water age, Woodville Karst Plain, USA. J. Hydrol. 2004, 289, 36–61. [Google Scholar] [CrossRef]
  24. Rosen, M.R.; Lapham, W.W. Introduction to the U.S. Geological Survey National Water-Quality Assessment (NAWQA) of ground-water quality trends and comparison to other national programs. J. Environ. Qual. 2008, 37, 190–198. [Google Scholar] [CrossRef] [PubMed]
  25. Puckett, L.J.; Tesoriero, A.J.; Dubrovsky, N.M. Nitrogen contamination of surficial aquifers—A growing legacy. Environ. Sci. Technol. 2011, 45, 839–844. [Google Scholar] [CrossRef] [PubMed]
  26. Böhlke, J.K. Groundwater recharge and agricultural contamination. Hydrogeol. J. 2002, 10, 153–179. [Google Scholar] [CrossRef]
  27. Moore, K.B.; Ekwurzel, B.; Esser, B.K.; Hudson, G.B.; Moran, J.E. Sources of groundwater nitrate revealed using residence time and isotope methods. Appl. Geochem. 2006, 21, 1016–1029. [Google Scholar] [CrossRef] [Green Version]
  28. Carlson, M.A.; Lohse, K.A.; McIntosh, J.C.; McLain, J.E.T. Impacts of urbanization on groundwater quality and recharge in a semi-arid alluvial basin. J. Hydrol. 2011, 409, 196–211. [Google Scholar] [CrossRef]
  29. Harvey, F.E.; Sibray, S.S. Delineating ground water recharge from leaking irrigation canals using water chemistry and isotopes. Groundwater 2001, 39, 408–421. [Google Scholar] [CrossRef]
  30. Verstraeten, I.M.; Steele, G.V.; Cannia, J.C.; Hitch, D.E.; Scripter, K.G.; Böhlke, J.K.; Kraemer, T.F.; Stanton, J.S. Interaction of Surface Water and Ground Water in the Dutch Flats Area, Western Nebraska, 1995–99; Water-Resources Investigations Report; United States Geological Survey, United States Department of the Interior: Reston, VA, USA, 2001; p. 56. [Google Scholar]
  31. Verstraeten, I.M.; Steele, G.V.; Cannia, J.C.; Böhlke, J.K.; Kraemer, T.E.; Hitch, D.E.; Wilson, K.E.; Carnes, A.E. Selected Field and Analytical Methods and Analytical Results in the Dutch Flats Area, Western Nebraska, 1995–99; United States Geological Survey: Reston, VA, USA, 2001; p. 53. [Google Scholar]
  32. Ball, L.B.; Kress, W.H.; Steele, G.V.; Cannia, J.C.; Andersen, M.J. Determination of Canal Leakage Potential Using Continuous Resistivity Profiling Techniques, Interstate and Tri-State Canals, Western Nebraska and Eastern Wyoming, 2004; Scientific Investigations Report; United States Geological Survey, United States Department of the Interior: Reston, VA, USA, 2006; p. 59. [Google Scholar]
  33. Hobza, C.M.; Andersen, M.J. Quantifying Canal Leakage Rates Using A Mass-Balance Approach and Heat-Based Hydraulic Conductivity Estimates in Selected Irrigation Canals, Western Nebraska, 2007 through 2009; Scientific Investigations Report; United States Geological Survey, United States Department of the Interior: Reston, VA, USA, 2010; p. 38. [Google Scholar]
  34. Luckey, R.R.; Cannia, J.C. Groundwater Flow Model of the Western Model Unit of the Nebraska Cooperative Hydrology Study (COHYST) Area; Nebraska Department of Natural Resources: Lincoln, NE, USA, 2006; p. 63. [Google Scholar]
  35. Nebraska Department of Natural Resources (NEDNR). Fifty-fifth biennial report of the Department of Natural Resources; Nebraska Department of Natural Resources (NEDNR): Lincoln, NE, USA, 2009; p. 675.
  36. Cannia, J.C.; Aqua Geo Frameworks, Mitchell, NE, USA; Gilmore, T.E.; University of Nebraska, Lincoln, NE, USA. Personal communication, 2016.
  37. Steele, G.V.; Cannia, J.C. Reconnaissance of Surface-Water Quality in the North Platte Natural Resources District, Western Nebraska, 1993; Water-Resources Investigations Report; United States Geological Survey, United States Department of the Interior: Reston, VA, USA, 1997. [Google Scholar]
  38. NOAA Data Tools|Climate Data Online (CDO)|National Climatic Data Center (NCDC). Available online: https://www.ncdc.noaa.gov/cdo-web/datatools (accessed on 4 August 2017).
  39. Verstraeten, I.M.; Sibray, S.S.; Cannia, J.C.; Tanner, D.Q. Reconnaissance of Ground-Water Quality in the North Platte Natural Resources District, Western Nebraska, June–July 1991; Water-Resources Investigations Report; United States Geological Survey, United States Department of the Interior: Reston, VA, USA, 1995; p. 114. [Google Scholar]
  40. Babcock, H.M.; Visher, F.N.; Durum, W.H. Ground-Water Conditions in the Dutch Flats Area, Scotts Bluff and Sioux Counties, Nebraska, With a Section on Chemical Quality of the Ground Water; United States Geological Survey, United States Department of the Interior: Reston, VA, USA, 1951; p. 51. [Google Scholar]
  41. Homer, C.G.; Dewitz, J.; Yang, L.; Jin, S.; Danielson, P.; Xian, G.Z.; Coulston, J.; Herold, N.; Wickham, J.; Megown, K. Completion of the 2011 National Land Cover Database for the conterminous United States—Representing a decade of land cover change information. Photogramm. Eng. Remote Sens. 2015, 81, 345–354. [Google Scholar]
  42. Maupin, M.A.; Kenny, J.F.; Hutson, S.S.; Lovelace, J.K.; Barber, N.L.; Linsey, K.S. Estimated Use of Water in the United States in 2010; United States Geological Survey: Reston, VA, USA, 2014; ISBN 978-1-4113-3862-3. [Google Scholar]
  43. Conservation and Survey Division 1995 Water Table Contours; Institute of Agriculture and Natural Resources, University of Nebraska-Lincoln: Lincoln, NE, USA, 2003.
  44. Aeschbach-Hertig, W.; Solomon, D.K. Noble gas thermometry in groundwater hydrology. In The Noble Gases as Geochemical Tracers; Burnard, P., Ed.; Springer: Berlin, Germany, 2013; pp. 81–122. ISBN 978-3-642-28835-7. [Google Scholar]
  45. Clarke, W.B.; Jenkins, W.J.; Top, Z. Determination of tritium by mass spectrometric measurement of 3He. Int. J. Appl. Radiat. Isot. 1976, 27, 515–522. [Google Scholar] [CrossRef]
  46. Lucas, L.L.; Unterweger, M.P. Comprehensive review and critical evaluation of the half-life of tritium. J. Res. Natl. Inst. Stand. Technol. 2000, 105, 541–549. [Google Scholar] [CrossRef] [PubMed]
  47. Vogel, J.C. Investigation of groundwater flow with radiocarbon. In Isotopes in Hydrology; International Atomic Energy Agency: Vienna, Austria, 1967; pp. 355–369. [Google Scholar]
  48. Gilmore, T.E.; Genereux, D.P.; Solomon, D.K.; Solder, J.E. Groundwater transit time distribution and mean from streambed sampling in an agricultural coastal plain watershed, North Carolina, USA. Water Resour. Res. 2016, 52, 2025–2044. [Google Scholar] [CrossRef] [Green Version]
  49. Broers, H.P. The spatial distribution of groundwater age for different geohydrological situations in the Netherlands: Implications for groundwater quality monitoring at the regional scale. J. Hydrol. 2004, 299, 84–106. [Google Scholar] [CrossRef]
  50. Solomon, D.K.; Cook, P.G.; Plummer, L.N. Models of groundwater ages and residence times. In Use of Chlorofluorocarbons in Hydrology: A Guidebook; Busenberg, E., Ed.; IAEA: Vienna, Austria, 2006; pp. 73–88. [Google Scholar]
  51. Chang, C.C.; Langston, J.; Riggs, M.; Campbell, D.H.; Silva, S.R.; Kendall, C. A method for nitrate collection for δ15N and δ18O analysis from waters with low nitrate concentrations. Can. J. Fish. Aquat. Sci. 1999, 56, 1856–1864. [Google Scholar] [CrossRef]
  52. Silva, S.R.; Kendall, C.; Wilkison, D.H.; Ziegler, A.C.; Chang, C.C.Y.; Avanzino, R.J. A new method for collection of nitrate from fresh water and the analysis of nitrogen and oxygen isotope ratios. J. Hydrol. 2000, 228, 22–36. [Google Scholar] [CrossRef]
  53. Kreitler, C.W. Determining the Source of Nitrate in Ground Water by Nitrogen Isotope Studies. Ph.D. Dissertation, The University of Texas at Austin, Austin, TX, USA, August 1974; p. 57. [Google Scholar]
  54. Gormly, J.R.; Spalding, R.F. Sources and concentrations of nitrate-nitrogen in ground water of the central platte region, Nebraskaa. Groundwater 1979, 17, 291–301. [Google Scholar] [CrossRef]
  55. Bremner, J.M.; Keeney, D.R. Steam distillation methods for determination of ammonium, nitrate and nitrite. Anal. Chim. Acta 1965, 32, 485–495. [Google Scholar] [CrossRef]
  56. American Public Health Association; American Water Works Association; Water Pollution Control Federation. Total Organic Carbon (TOC) Method #5310D, Wet-Oxidation. In Standard Methods for the Examination of Water and Wastewater; American Public Health Association; American Water Works Association; Water Pollution Control Federation: Washington, DC, USA, 1992. [Google Scholar]
  57. NEDNR. University of Nebraska-Lincoln Quality-Assessed Agrichemical Contaminant Database for Nebraska Ground Water. Available online: https://clearinghouse.nebraska.gov/Clearinghouse.aspx (accessed on 22 September 2016).
  58. Hudson, C.; North Platte Natural Resources District, Scottsbluff, NE, USA; Wells, M.J.; University of Nebraska, Lincoln, NE, USA. Personal communication, 2018.
  59. Kendall, C.; Aravena, R. Nitrate isotopes in groundwater systems. In Environmental Tracers in Subsurface Hydrology; Cook, P.G., Herczeg, A.L., Eds.; Springer US: Boston, MA, USA, 2000; pp. 261–297. ISBN 978-1-4615-4557-6. [Google Scholar]
  60. Amberger, A.; Schmidt, H.L. Natural isotope content of nitrate as an indicator of its origin. Geochim. Cosmochim. Acta 1987, 51, 2699–2705. [Google Scholar] [CrossRef]
  61. Durka, W.; Schulze, E.-D.; Gebauer, G.; Voerkeliust, S. Effects of forest decline on uptake and leaching of deposited nitrate determined from 15N and 18O measurements. Nature 1994, 372, 765–767. [Google Scholar] [CrossRef]
  62. Kendall, C. Tracing nitrogen sources and cycling in catchments. In Isotope Tracers in Catchment Hydrology; Elsevier: Amsterdam, The Netherlands, 1998; pp. 519–576. ISBN 978-0-444-81546-0. [Google Scholar]
  63. McMahon, P.B.; Chapelle, F.H. Redox processes and water quality of selected principal aquifer systems. Groundwater 2008, 46, 259–271. [Google Scholar] [CrossRef] [PubMed]
  64. Mariotti, A.; Landreau, A.; Simon, B. 15N isotope biogeochemistry and natural denitrification process in groundwater: Application to the chalk aquifer of northern France. Geochim. Cosmochim. Acta 1988, 52, 1869–1878. [Google Scholar] [CrossRef]
  65. USBR Hydromet: Archive Data Access. Available online: https://www.usbr.gov/gp/hydromet/hydromet_arcread.html (accessed on 22 May 2018).
  66. Brakebill, J.W.; Gronberg, J.M. County-Level Estimates of Nitrogen and Phosphorus from Commercial Fertilizer for the Conterminous United States, 1987–2012; United States Geological Survey: Reston, VA, USA, 2017. [Google Scholar]
  67. NASS USDA/NASS QuickStats Ad-hoc Query Tool. Available online: https://quickstats.nass.usda.gov/ (accessed on 15 February 2018).
  68. 2012 Census of Agriculture, Nebraska State and County Data; United States Department of Agriculture, National Agricultural Statistics Service: Washington, DC, USA, 2014.
  69. 1997 Census of Agriculture, Nebraska State and County Data; United States Department of Agriculture, National Agricultural Statistics Service: Washington, DC, USA, 1999.
  70. Green, C.T.; Liao, L.; Nolan, B.T.; Juckem, P.F.; Shope, C.L.; Tesoriero, A.J.; Jurgens, B.C. Regional variability of nitrate fluxes in the unsaturated zone and groundwater, Wisconsin, USA. Water Resour. Res. 2018, 54, 301–322. [Google Scholar] [CrossRef]
  71. Mas-Pla, J.; Menció, A. Groundwater nitrate pollution and climate change: Learnings from a water balance-based analysis of several aquifers in a western Mediterranean region (Catalonia). Environ. Sci. Pollut. Res. 2018, 25, 1–19. [Google Scholar] [CrossRef] [PubMed]
  72. Ma, L.; Spalding, R.F. Effects of artificial recharge on ground water quality and aquifer storage recovery. J. Am. Water Resour. Assoc. 1997, 33, 561–572. [Google Scholar] [CrossRef]
Figure 1. Site description: (a) location of Dutch Flats area within Nebraska’s North Platte Natural Resources District, including water table elevation contours [43]; and (b) representative cross-section along well transect with mid-screen elevations at each well nest. Elevations were derived from previous Dutch Flats studies [11,31]. Red well screens indicate locations where the current study collected groundwater samples. Site 2D, shown with a dashed line and in parenthesis, is situated behind 1C, or into the page, and is located above the base of aquifer in its respective location. A small feedlot is directly adjacent to Well 1G.
Water 10 01047 g001
Figure 2. Apparent groundwater age determined in 2016 compared to apparent groundwater ages determined in 1998. Error bars are ±1σ from 2016 analysis using the International Atomic Energy Agency (IAEA) model.
Water 10 01047 g002
Figure 3. Comparison of 1998 and 2016 recharge rates categorized by shallow, intermediate, and deep well depths.
Water 10 01047 g003
Figure 4. Comparison of nitrate concentrations from five well nests sampled in 2016 and 1998 (n = 14). Labels indicate the three wells with high 2016 [NO3].
Water 10 01047 g004
Figure 5. Nitrate data from 1998 to 2016 (n = 987) collected and/or maintained by the North Platte Natural Resources District, Nebraska Agricultural Contaminant Database, and the current study: (a) a Box-and-Whisker plot of all nitrate data, including the number of samples collected each year (referenced above the maxima) and long-term median of each annual median; and (b) mean and median of normalized annual Dutch Flats groundwater nitrate.
Water 10 01047 g005
Figure 6. Comparison of groundwater [NO3] (mg N L−1) from samples collected in 1998 and/or 1999 in shallow, intermediate, and deep wells to: (a) 2008 [NO3] in shallow wells (n = 44); (b) 2016 [NO3] in shallow wells (n = 44); (c) 2008 [NO3] in intermediate depth wells (n = 16); (d) 2016 [NO3] in intermediate depth wells (n = 16); (e) 2008 [NO3] in deep wells (n = 27); and (f) 2016 [NO3] in deep wells (n = 27).
Water 10 01047 g006
Figure 7. Determining sources of nitrogen in Dutch Flats area from oxygen and nitrogen isotopic ratios in nitrate. Figure labels are modified from Kendall [62].
Water 10 01047 g007
Figure 8. Comparison of [NO3] and δ15N-NO3 for 1998 and 2016 field data. Far right data points are from Well 1G-S and suggest organic nitrogen source.
Water 10 01047 g008
Table 1. Apparent groundwater (GW) age from both 1998 and 2016 based on 3H/3He age estimates. Recharge rates were estimated with a linear equation in all cases, and with an exponential (Exp.) equation for intermediate wells.
Well IDBöhlke et al. [11]Current Study
Depth (m) *GW Age (years)Recharge—Linear (m/year)Recharge—Exp. (m/year)Depth (m)*GW Age (years)Recharge—Linear (m/year)Recharge—Exp. (m/year)
1E-S2.45.40.16n.d.1.94.90.13n.d.
2D-S4.92.80.61n.d.2.45.40.15n.d.
1E-I15.720.20.270.3814.520.90.240.34
2D-I25.811.30.801.222.620.50.390.56
1C-D20.312.00.59n.d.19.412.00.57n.d.
1E-D29.431.50.33n.d.28.347.00.21n.d.
1L-D28.520.50.49n.d.30.320.20.53n.d.
2D-D44.320.90.74n.d.41.123.90.60n.d.
Mean: 15.60.50 19.30.35
Std. Dev.: 9.50.23 13.30.19
Note: * Depth given as depth to mid-screen below water table; n.d., no data; S, Shallow well; I, Intermediate well; D, Deep well; Std. Dev., Standard Deviation.
Table 2. Nitrate nitrogen and nitrogen isotopic ratio of nitrate from samples collected in 1998 and compared to 2016 samples, at well nests where age-dating was also conducted. Samples collected in 2016 were mostly analyzed for δ18O-NO3, as shown.
Well IDBöhlke et al. [11]Current Study
Date Sampledδ15N-NO3 (‰)[NO3] (mg N L−1)Date Sampledδ15N-NO3 (‰)[NO3] (mg N L−1)δ18O-NO3 (‰)
1G-S 27 August 19982.48.818 April 201617.046.8n.d.
1G-I 27 August 1998n.d.10.618 April 20162.67.2n.d.
1G-D27 August 19982.58.018 April 20163.36.2n.d.
2D-S 27 August 19985.78.316 August 20160.59.7−4.5
2D-I27 August 19985.65.116 August 20162.21.3−9.16
2D-D 27 August 19984.91.416 August 2016−2.91.4−6.96
1E-S 24 August 19982.915.816 August 2016−1.645.2−5.45
1E-I 24 August 19982.710.816 August 2016−1.33.6−6.6
1E-D 24 August 19984.12.516 August 2016−3.73.1−5.37
1L-D 25 August 199810.22.417 August 20161.11.1−3.67
1C-I27 August 19984.22.517 August 20164.95.3−7.27
1C-D 24 August 19984.52.517 August 2016−2.03.8−8.38
1G-S27 August 19982.48.812 October 201618.422.14.08
1G-I27 August 1998n.d. 10.612 October 20169.56.90.33
Note: n.d., no data; S, Shallow well; I, Intermediate well; D, Deep well.
Table 3. The mean and median groundwater [NO3] (mg N L−1) for 1998 and/or 1999, 2008 and 2016. The calculated p-values are from Mann–Whitney tests comparing the medians between the three time periods.
Well DepthShallow (n = 44)Intermediate (n = 16)Deep (n = 27)
1990s *200820161990s *200820161990s *20082016
Mean7.26.28.06.65.65.14.03.53.5
Median5.44.75.35.64.83.73.63.33.4
Mann–Whitney TestYearsp-valueYearsp-valueYearsp-value
1990s *–20080.151990s *–20080.661990s *–20080.68
1990s *–20160.491990s *–20160.171990s *–20160.62
2008–20160.702008–20160.382008–20160.94
Note: * Value shown is from 1998 or 1999, or the average from the two years.
Table 4. Summary of statistical analysis evaluating variables potentially influencing groundwater quantity and quality. p-values were determined from two-sample t-tests.
VariableMean (±std)p-Value
Year: 1983–1999Year: 2000–2016
Precipitation (mm)431 (±97)370 (±118)0.11
Interstate Canal Discharge (km3/year)0.52 (±0.08)0.44 (±0.08)0.007 *
Planted Corn Area (hectares)29,471 (±2568)34,217 (±2608)<0.001 *
Year: 1987–1999Year: 2000–2012
Fertilizer Loads (kg)11,503,061 (±1,150,187)9,540,057 (±1,222,507)<0.001 *
Note: * Statistically significant difference between two time periods (α = 0.05).

