Article

Proposal of Sustainability Indicators for the Waste Management from the Paper Industry within the Circular Economy Model

by
Emiliano Molina-Sánchez
1,
Juan Carlos Leyva-Díaz
2,
Francisco Joaquín Cortés-García
3 and
Valentín Molina-Moreno
4,*
1
Polytechnic School of Linares, University of Jaén, 23071 Jaén, Spain
2
Department of Chemical and Environmental Engineering, University of Oviedo, 33006 Oviedo, Spain
3
Faculty of Business and Management, Universidad Autónoma de Chile, 7500912 Santiago, Chile
4
Department of Management-1, University of Granada, 18071 Granada, Spain
*
Author to whom correspondence should be addressed.
Water 2018, 10(8), 1014; https://doi.org/10.3390/w10081014
Submission received: 4 June 2018 / Revised: 27 July 2018 / Accepted: 30 July 2018 / Published: 31 July 2018

Abstract

:
The optimization of water management in industrial processes is paramount in diminishing or mitigating, as far as possible, the negative externalities generated by its current use within the linear economy model. This research presents methods for the optimization of wastewater from paper mills which are associated with the new sustainability and circular economy model. In this way, the concept of circular economy was applied to the wastewater treatment from a paper mill, with the objective of recovering the resources contained in this type of effluent. The wastewater treatment plant is based on a biological reactor of activated sludge, and treats a flow of 4868 m3·day−1. This study proposes the development and evaluation of indicators of circular economy applied to wastewater from a paper mill, as well as the assessment of the removal performance of color, total suspended solids (TSS), biochemical oxygen demand on the fifth day (BOD5), and chemical oxygen demand (COD), which are higher than 96% in all cases. Per 1 m3 of wastewater from a paper mill, a volume of 0.9 m3 of potentially reusable water and a recovered sludge mass of 0.7 kg are generated; the latter is reused as a mineral filler during the process itself. In light of this, a multivariable statistical analysis was applied to determine the relationship of the operation variables and indicators of circular economy. In this way, wastewater from the paper mill can be regarded as a technological nutrient, which is partially reintroduced into the production process, enabling the recovery of the water and mineral fillers that it contains.

1. Introduction

One of the challenges of the new circular economy model is for different productive sectors to analyze their waste and by-products production, and based on this, seek the opportunities to dispose of them by converting them into new resources that may be incorporated into the production process. In addition, they should also comply with the European Union legislation regarding this matter [1,2]. In this regard, the paper industry faces a major technological challenge, from which technologies and processes must be obtained in order to operate under the circular economy model [3].
The paper industry is regarded as one of the most important sectors in the world [4]. This industry presents high water requirement, coming in third place in terms of water consumption, after the metal and chemical industries [4,5,6,7]. This heavy water consumption results in high generation of wastewater [4]; in general terms, a typical paper mill generates an effluent volume ranging between 1.5 and 60 m3 per each tonne of paper produced [6,7,8,9]. As a consequence of the treatment of these effluents, a large amount of sludge is produced, with values between 40 and 50 kg of dry sludge per each tonne of paper produced [4,10,11], 70% of which is primary sludge, and 30% biological sludge [12]. Primary sludge usually originates from sedimentation and coagulation-flocculation procedures, while secondary sludge originates from biological treatment [13].
In recent years, paper industry has faced different challenges with regard to the management of the resulting waste as a consequence of increasingly restrictive environmental legislation. Without adequate treatment, wastewater coming from this industry has an adverse effect on the receiving aquatic environment due to silt production and algae growth, in addition to the toxicity to exposed communities, thermal impact, and color problems [14,15].
The most commonly-practiced methods for the management of sludge coming from wastewater treatment have traditionally been incineration for energy recovery and land applications in order to enhance soil fertility in agriculture [12,16,17]. However, indiscriminate and unplanned landfilling has been the most common practice within paper mills [16,17,18], which has led to negative outcomes regarding the three main components of the environment, i.e., soil, air, and water [7,19].
In this regard, a complete ban of landfilling and incineration in the European Union has been established by the Confederation of European Paper Industries (CEPI). This disposition is in accordance with the Waste Framework Directive (2008/98/EC), which prioritizes recovery and reutilization of waste, converting them into resources. This measure conforms to the European Commission Roadmap to a Resource Efficient Europe [20], which foresees the sustainability of the European economy by 2050, proposing the achievement of certain milestones by 2020 so that waste is managed as a resource [13,21,22,23,24].
Thus, the recovery and reutilization of such waste coming from paper mills must become a definitive alternative to its indiscriminate disposal, converting paper mill effluents into a technological nutrient, allowing its conversion into a resource, and its subsequent reintroduction into the production process [25,26], thereby minimizing and reducing its environmental impact [27,28]. In light of this, a technological nutrient is the result of treating waste coming from a production process through a combination of processes (biological, physical, chemical) in order to reintroduce it as a resource in the same production process. This will enable the reduction of the negative externalities of the process, and will contribute to a higher sustainability of the environment and a rational utilization of the natural resources used as production factors.
In this respect, it is advisable to establish a system which directly addresses the European objectives of circular economy, where product, material, and resource values are kept in the economy as long as possible, and waste generation is kept to a minimum [29]. In order to achieve this, it is necessary to develop indicators of circular economy that determine the degree of approach to the circular economy model in paper mills. Nowadays, there is a shortage of coherent and consistent indicators which allow greater operationality and comparability of the variables that are necessary to analyze the processes of management, waste treatment, and fundamentally, recycling and reintroduction into production systems. The design and development of such instruments will aim to establish indicators of circular economy in order to achieve an efficient use of materials and waste management. The development of these indicators will allow us to (i) carry out quantitative measurements and evaluations regarding the reusability of the waste generated during the production process, in a manner which is consistent with the strategic objectives of environmental and socioeconomic sustainability, and (ii) to improve the decision-making process and its subsequent implementation [29,30,31].
Wastewater coming from paper mills contains high levels of total suspended solids (TSS) and organic matter measured in the form of chemical oxygen demand (COD) and biochemical oxygen demand (BOD) [32]. In this regard, the treatment of wastewater coming from paper mills aims to reduce TSS, COD, and BOD, prior to its reutilization [33]. Physicochemical processes, such as primary decanting and coagulation-flocculation, and biological processes, such as secondary treatment, as well as tertiary treatments, represent the main procedures of treatment and reutilization of effluents coming from paper mills [32].
The objective of this study was the treatment of effluent from a paper mill by means of an activated sludge system, establishing the reutilization of the liquid effluent and solid sludge during the process. Both residues are converted into technological nutrients within the circular economy model, and confer a benefit for the industry, since they reuse waste during the same process, and for the environment, as they reuse industrial waste. In this regard, this study deals with the development and evaluation of indicators of circular economy applied to waste management in a paper mill from an environmental point of view, and as the first case of application in a sector of major global significance.

2. Materials and Methods

2.1. Description of Paper Manufacturing Process

The manufacturing process of coated paper from cellulose consists of the following steps: base paper manufacturing and coating, and different finishing stages according to quality and purpose.
Accordingly, it is necessary to distinguish two basic industrial processes. Firstly, the production of base paper of eminently cellulosic nature, which will provide finished paper with the required physical and resistance properties. Secondly, base paper coating, with which an optimum surface finish is achieved, and appearance and printing properties are improved, thus increasing value.

2.1.1. Base Paper Manufacturing

The base paper manufacturing process requires different types of pulps, of varying nature and origin, which can be classified into two main groups: short and long fibers. However, other subtypes, such as thermo-chemical, deinked, or thermo-mechanical are also used, although to a lesser extent.
Paper losses generated during the process itself constitute another cellulose source intervening in the composition of base paper. In quantitative terms, it can be concluded that short-fiber eucalyptus is the most relevant raw material among all materials involved in base paper production. The base paper manufacturing process comprises the following stages:
  • Pulp disintegration in the hydropulper.
  • Pulp refining: mechanical treatment whereby fiber morphology is modified, thus provoking fibers fibrillation, cut and hydration. This is a high-energy consumption process, and plays a crucial goal in reaching the required physico-mechanical characteristics of paper.
  • Preparation of the composition: this consists of the mixture of different fibers with a range of auxiliary chemical products and additives (pigments, binding products, retention agents, colorants, sizing products, etc.), allowing a proper development of the base paper manufacturing process, providing it with the characteristics required for the use of the finished paper.
  • Sheet formation: a mixture of cellulose and additives is incorporated into the paper machine, where it undergoes a series of physical, chemical, and mechanical processes, with the aim of removing the water from the fiber suspension and forming the sheet: draining, pressing, and drying.
  • Surface treatment: a pre-coating of relatively complex composition, mainly including pigments (carbonates, kaolins, etc.) and binding products (starch, latex, etc.), is applied to the sheet. The main objective of this operation is to improve the suitability of the base paper during the subsequent coating process.
During the process of base paper manufacturing, most of the water drained from the cellulose mixture is recovered and reintroduced into the process. It undergoes flocculation processes in order to be clarified, and organic and inorganic matter contained in it is recovered. After the clarification process, the exceeding part of the process, containing a small fraction of fibers and suspended fillers, is then sent to the treatment plant for treatment.

2.1.2. Coating of Base Paper

The “coating color” is applied, in one single pass, to the base paper roll in the coater machine, and then dried by means of natural gas infrared, air, and steam.
This “coating color” is composed by a series of mineral pigments (calcium carbonate, kaolin, talc, etc.) which are fixed onto the base paper by means of different binding products (latex, CMC, starch, PVA, etc.). The coating layer gives finished paper the desired appearance and printability characteristics.
Two paper machines exist for base paper manufacturing. One of them is aligned with the coater online, while the other produces base paper for a coater offline.

2.1.3. Handling and Dispatch of the Finished Product

The paper manufacturing process finishes in the finishing section. Depending on the quality and required presentation, paper may undergo different finishing stages: calendars, winders, sheeters, ream wrapping, and finally, packaging and dispatch. Paper as a finished product is delivered to the customer in the form of sheets or rolls.
The finished products delivered to customers are packaged using pallets, retractable plastic, cardboard covers, fiberboard covers, plastic straps, packaging paper, cardboard tubing, tape and identification tags.

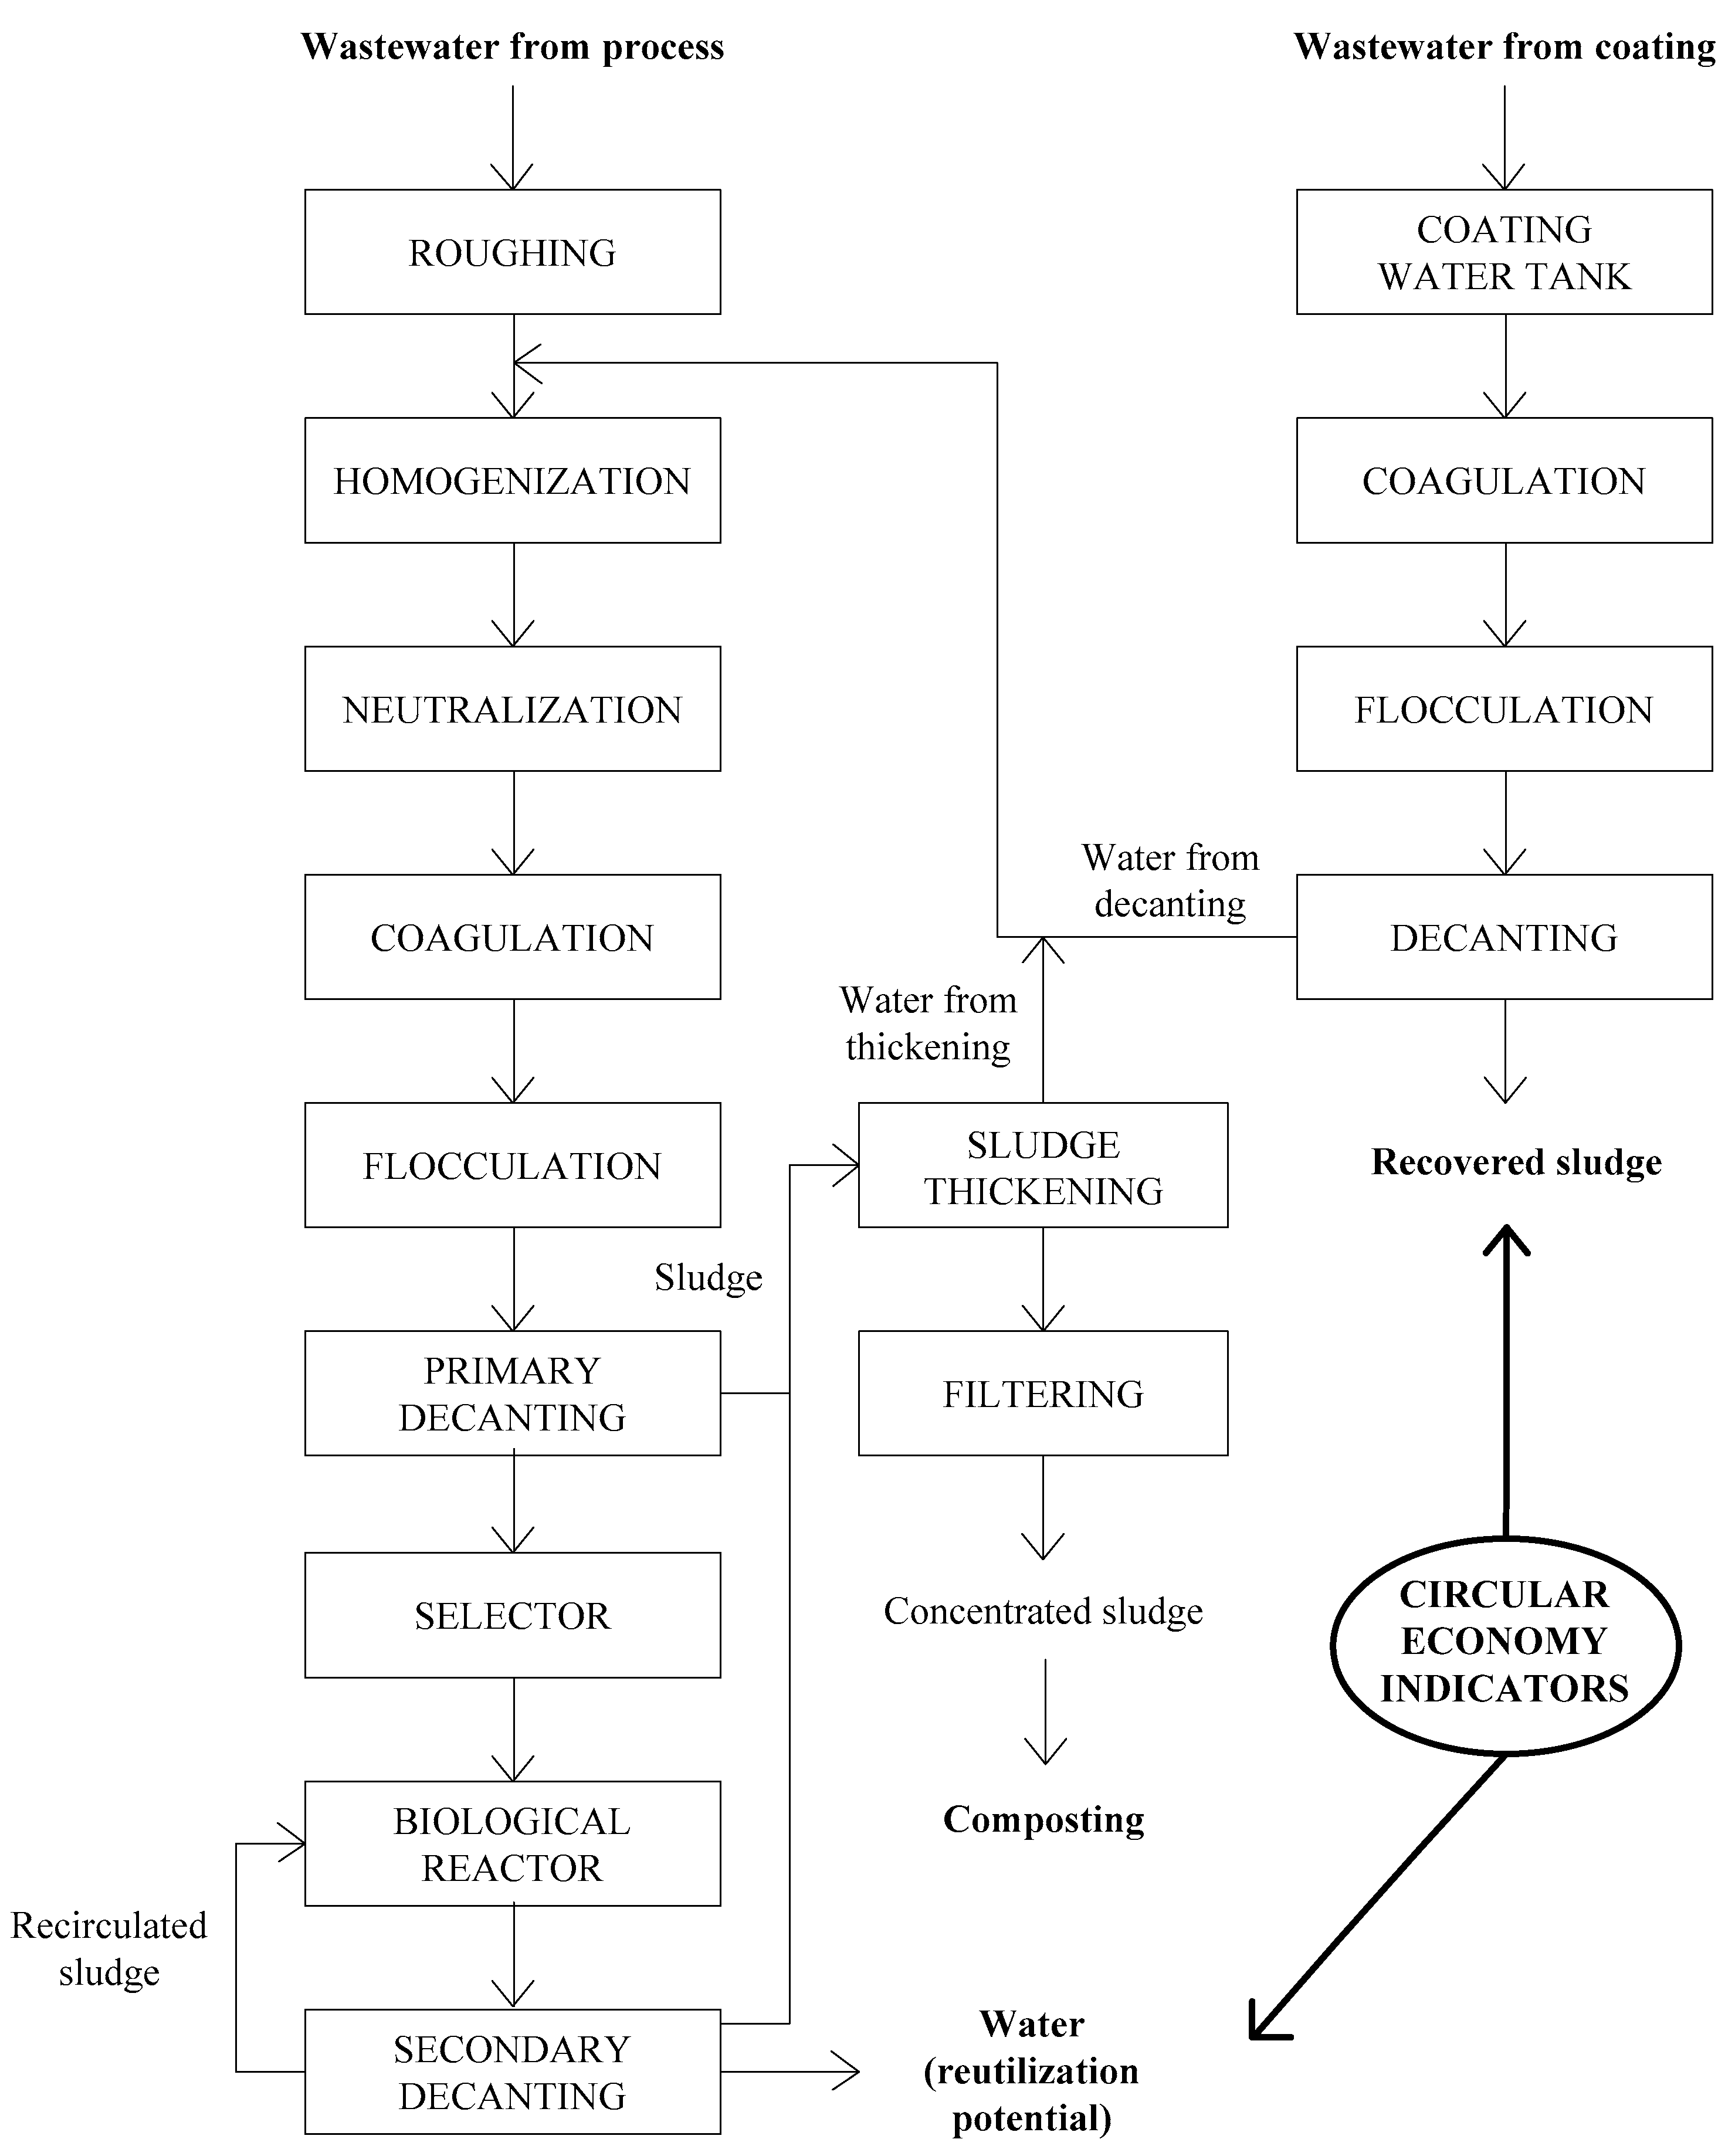
2.2. Description of Wastewater Treatment Process

All the wastewater generated in the paper mill is then treated in a wastewater treatment plant (WWTP).
A distinction is made between wastewater coming from coating process and the rest. The first, while constituting a lower flow value with respect to the total effluent (approximately 3%), presents a high pollution level, and is treated separately before its arrival at the treatment plant.
  • Wastewater from coating flows into a tank with a capacity of 300 m3, which contains a pH control and correction system; it later receives a physicochemical treatment. From this stock tank, water is pumped into a coagulation tank (1 m3), where aluminum polychloride is used in order to destabilize the colloids. Aluminum polychloride is a specific aluminum salt called KEMIRA PAX-18, having a concentration of Al2O3 of 17.0 ± 0.6% and a content of Cl- of 21.0 ± 1.0%. From this point, the water proceeds to another tank (3 m3) where colloids are grouped by means of a polyelectrolyte, thus facilitating the decanting process. The circular-conical decanter has a capacity of 35 m3, and it is the place where there is a separation of, firstly, clarified water, which is sent to the primary treatment with the rest of wastewater from the process, and secondly, slurry, which is reintroduced into the process as mineral load.
  • Wastewater from process comes from paper machines and other areas in the factory where wastewater is generated, constituting the fundamental part of the spillage of those waters coming from the chemical plant. These waters go to the homogenizing tank after having passed through a metal sieve. From that point, they are transferred directly to the neutralization tank, and undergo a primary physicochemical treatment and a secondary biological treatment.
The treatment plant of wastewater coming from the paper mill treats a flow of 4868 m3·day−1, presenting the features shown in Table 1.
The treatment process of the wastewater generated in the paper mill includes pretreatment, primary treatment, and secondary treatment (Figure 1).

2.2.1. Pretreatment

Pretreatment consists of filtering and homogenization stages. Firstly, wastewater passes through a metal sieve in order to separate larger coarse solids from the wastewater. Afterwards, wastewater from the process, clarified water from the thickener, clarified water from the decanting funnel of the coating water treatment, water from band filtering, and supernatants from both decanters are mixed in the collection chamber. This mixture is pumped into a tank with a capacity of 1000 m3. The aim of this action is to homogenize the flow and regulate the volume of wastewater that proceeds to the next stage of neutralization, in which sulphuric acid is used.

2.2.2. Primary Treatment

Primary treatment includes the coagulation process through the use of aluminum polychloride as coagulant, a flocculation process where the agglomeration of clots is carried out by using a polyelectrolyte, and finally, a primary decanting stage where there will be a separation of water and the slurry formed by the floccules that are produced.
The clarified water then passes to the secondary treatment and decanted slurries are transferred to the sludge thickener.

2.2.3. Secondary Treatment

The biological treatment consists of a selector, followed by an aerobic biological reactor and a secondary decanting system.
The selector has a volume of 140 m3. Its function is to remove the nitrates present in wastewater, reducing the compound to molecular nitrogen, which is released into the atmosphere in gaseous form.
The aerobic biological reactor is based on activated sludge technology. It presents a volume of 2310 m3; aeration is carried out by means of diffusers, introducing air with a blower.
The secondary circular-section decanter has a volume of 1423 m3, which is sufficient to ensure a correct separation of the floccules that are formed. A part of the sludge is redirected to the biological reactor with the aim of preserving the concentration of mixed liquor suspended solids (MLSS) from the operation for the process. The excess sludge is sent to a thickener-homogenizer, before being drained in a band filter-press along with the sludge generated during the primary decanting of the wastewater treatment process.

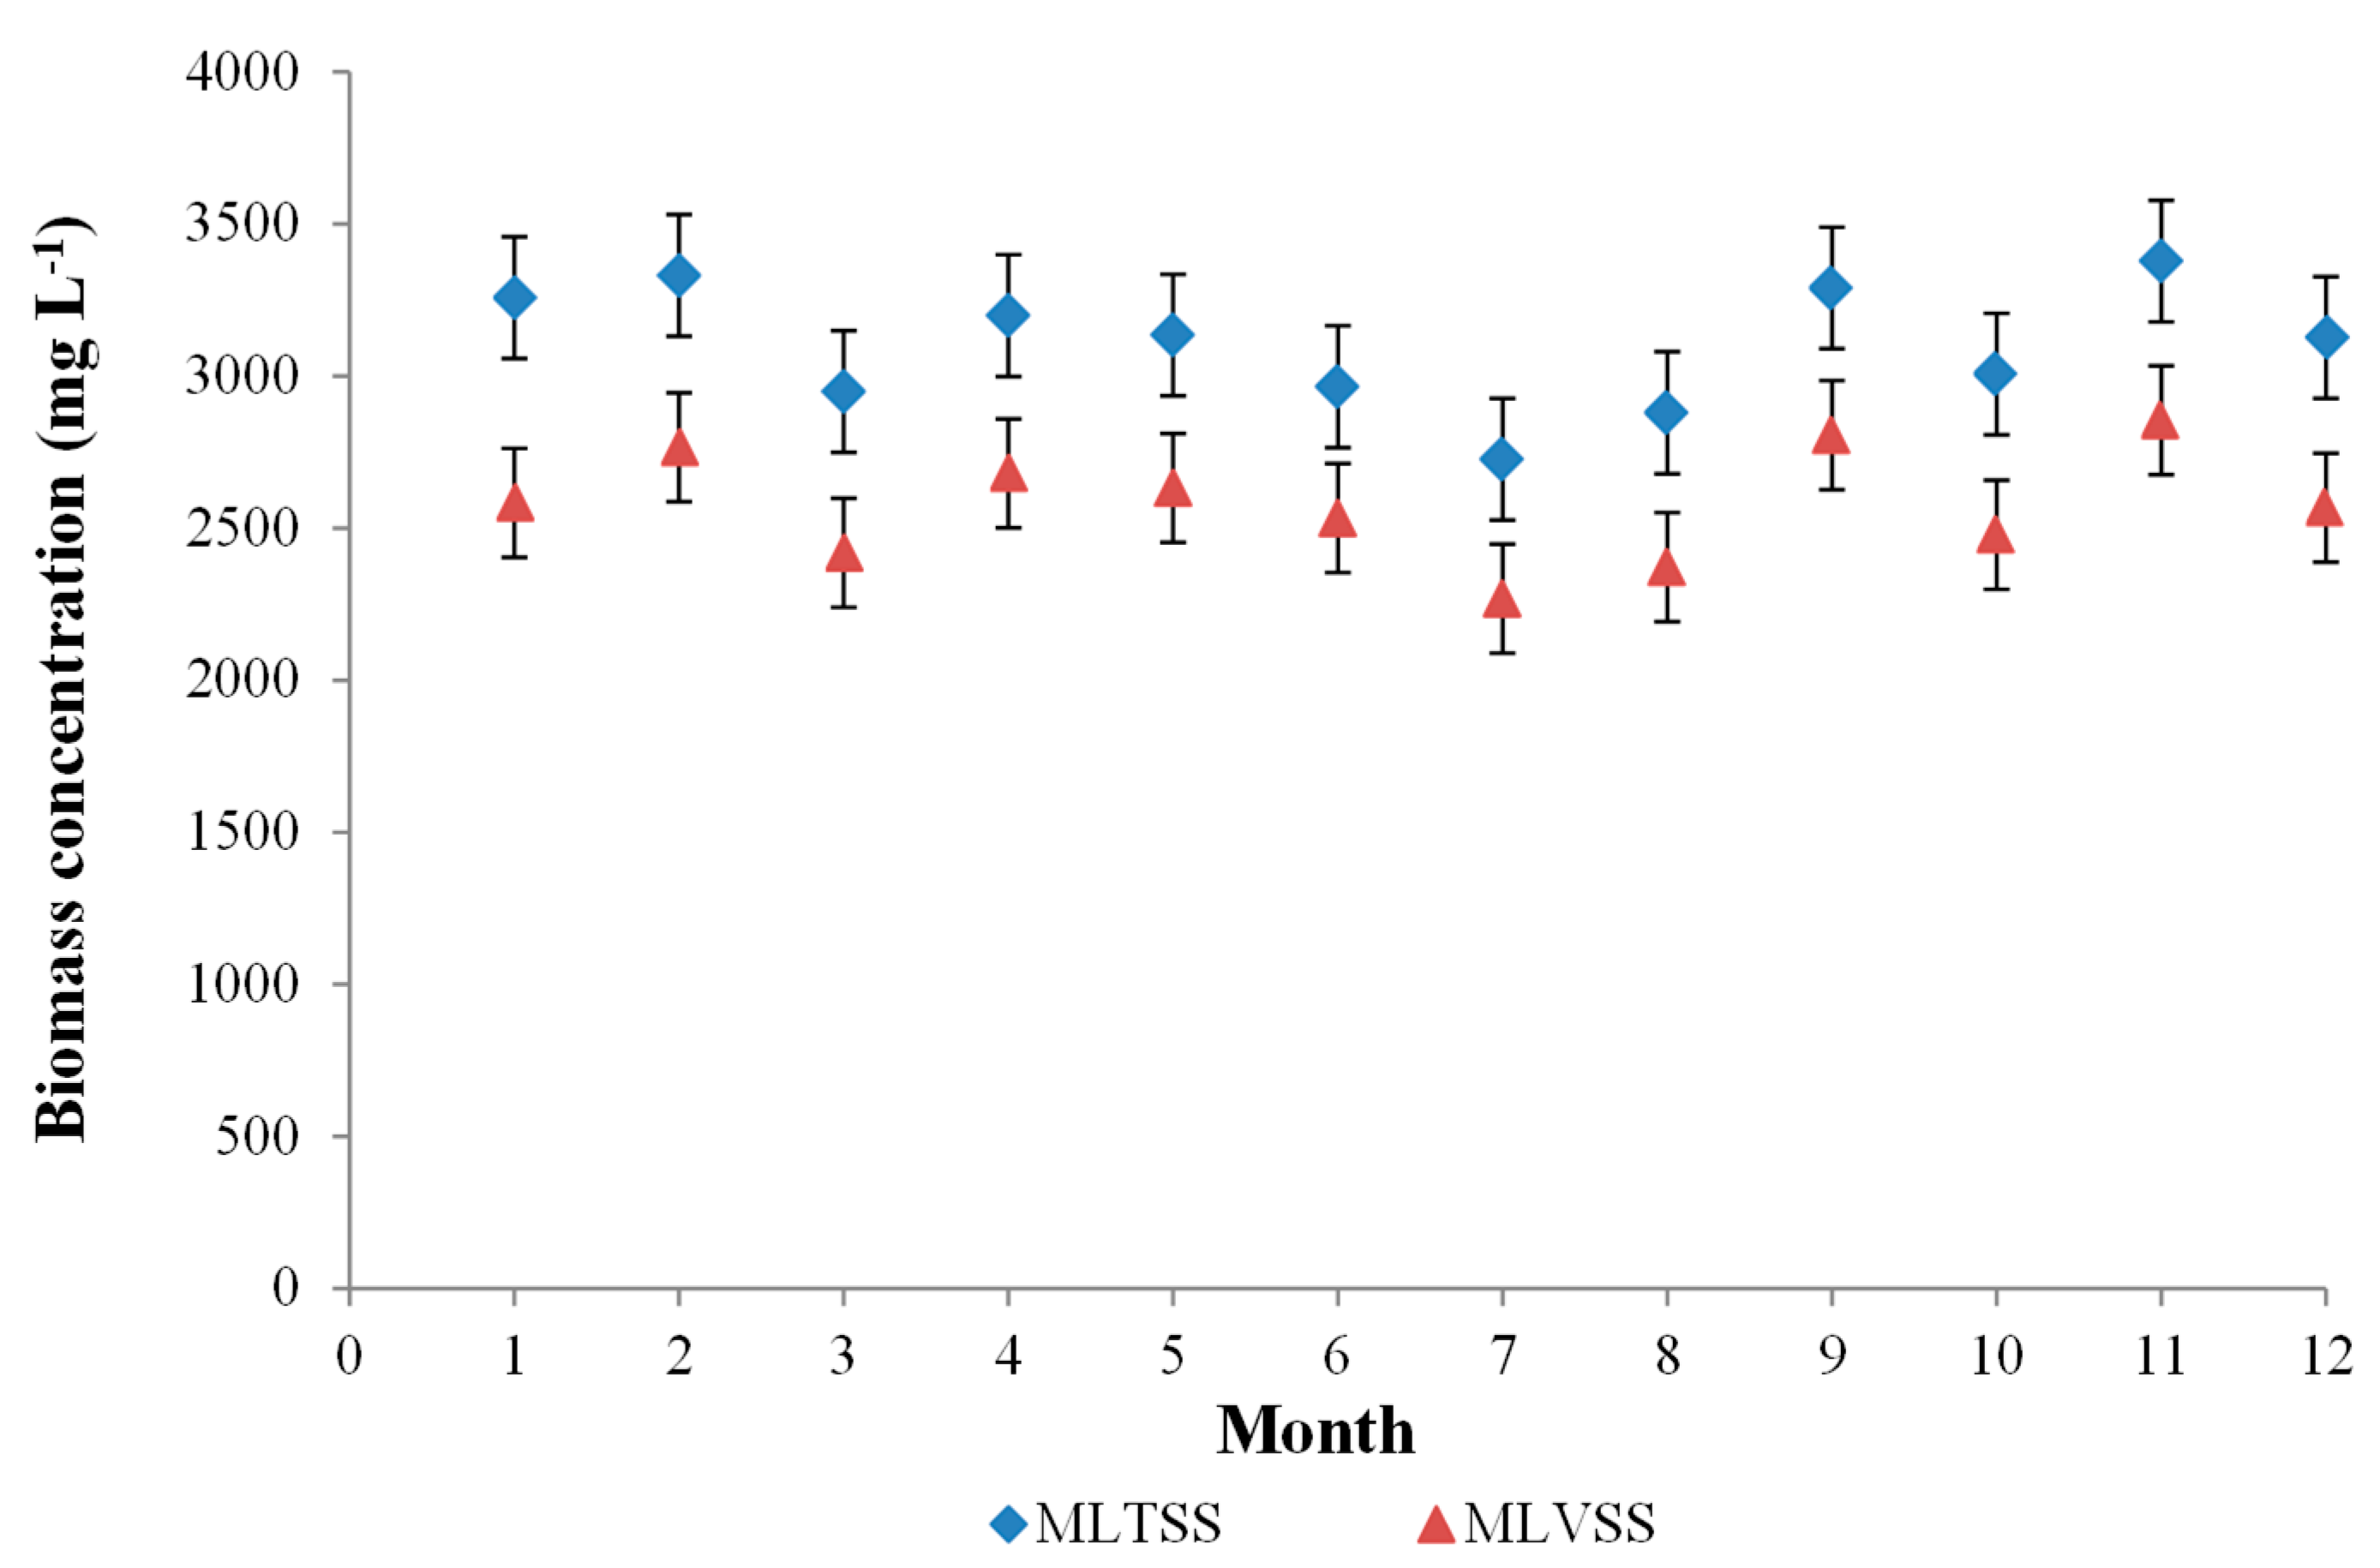
2.3. Physical and Chemical Analysis

The volumetric and mass flow rates, as well as the physicochemical parameters, were measured every day during the year of experimentation. COD, seven-day biochemical oxygen demand (BOD5), mixed liquor total suspended solids (MLTSS), mixed liquor volatile suspended solids (MLVSS), TSS and color were determined in accordance with standard methods [34]. In particular, for the determination of COD, a digestion solution containing distilled water, K2Cr2O7, H2SO4 and HgSO4, and a sulfuric acid reagent were added to each sample before placing the tube with the sample in a block digester at 150 °C for 2 h; afterward, the absorbance was measured at 600 nm in a spectrophotometer in order to evaluate COD. The BOD5 method consists of filling, an airtight bottle of the specified size with the sample to the point of overflowing, and incubating it at 20 °C for five days; dissolved oxygen is measured initially and after incubation, and the BOD is computed from the difference between initial and final dissolved oxygen concentration. In relation to TSS, a volume of the sample was filtered using a filter with a pore size of 0.45 μm, and TSS was evaluated from the difference of mass between the initial weight and after filtration, considering the volume filtered. Electrical conductivity, pH, and dissolved oxygen were measured by a multifunctional meter.

2.4. Indicators of Circular Economy

A series of indicators of circular economy is defined, allowing the conversion of a residue, such as wastewater from a paper mill, into a technological nutrient under the circular economy model, minimizing waste generation and improving the efficiency of the use of resources [31].
The definition of those indicators is going to be applied to two resources that are recovered during the wastewater treatment process of a paper mill, such as the water and sludge obtained (Figure 1).

2.4.1. Indicators of Circular Economy for Water

The indicator of technological nutrient performance for water (IW,TN) is defined as the treated water flow that can be obtained and reused during the process in relation to the wastewater flow that is treated in the paper mill treatment plant.
Such an indicator can be defined according to Equation (1):
  I W , TN = Q EF Q PMW ,  
where QEF is the volumetric flow of treated water that can be recovered during the treatment process and QPMW is the volumetric flow of wastewater from the paper mill.
Regarding the indicators of circular economy efficiency for water, two of them should be mentioned.
The first is the reductive indicator of circular economy efficiency for water (IW,CE,r). Such an indicator provides information about the reduction in the water that is consumed in order to carry out the paper manufacturing process in the paper mill.
Such an indicator is defined according to Equation (2):
  I W , CE , r = Q EF Q W , T × 100 ,  
where QW,T is the total water volumetric flow consumed in the paper production process.
This indicator can range between 0 and 100%: 0 means that no water was recovered during the process, and 100% is the ideal case of sustainability, where there is such recovery of water during the process that no external consumption occurs.
In addition, the productive indicator of circular economy efficiency for water (IW,CE,p) is defined, indicating the volumetric flow of treated water that is recovered during the treatment process in relation with the mass flow of paper produced (PP).
This indicator is defined according to Equation (3):
  I W , CE , p = I W , TN · Q PMW P P  

2.4.2. Indicators of Circular Economy for Sludge

The indicator of technological nutrient performance for the recovered sludge (ISG,TN) can be defined as shown in Equation (4):
  I SG , TN = m SG , R Q PMW   ,  
where mSG,R is the mass flow of recovered sludge during the wastewater treatment of the paper mill.
This indicator provides information about the amount of sludge recovered during the treatment process, and the amount used as mineral load during the paper manufacturing process, depending on the wastewater generated in the paper mill.
In this case, two additional indicators of circular economy efficiency for sludge can be defined: reductive (ISG,CE,r) and productive (ISG,CE,p).
The indicator ISG,CE,r reflects the amount of sludge recovered during the paper production process in relation to the total amount of generated sludge. Such an indicator is defined according to Equation (5):
  I SG , CE , r = m SG , R m SG , T × 100   ,  
where mSG,T is the mass flow of generated sludge.
This indicator ranges between 0 and 100%, indicating the proportion of sludge recovered during the process of wastewater treatment of the paper mill.
Furthermore, the indicator ISG,CE,p represents the sludge recovered during the process of wastewater treatment, used as mineral load during the paper production process in relation with the mass flow of paper produced, according to Equation (6):
  I SG , CE , p = I SG , TN · Q PMW P P  

2.5. Statistical Analysis

A multivariable statistical analysis was carried out by applying the software Canoco for Windows v. 4.5 in order to determine the influence of the operational variables on the different indicators of technological nutrients and circular economy. This will provide the variables with the highest influence on the behavior of the system studied through the length and angles between the different vectors.

3. Results and Discussion

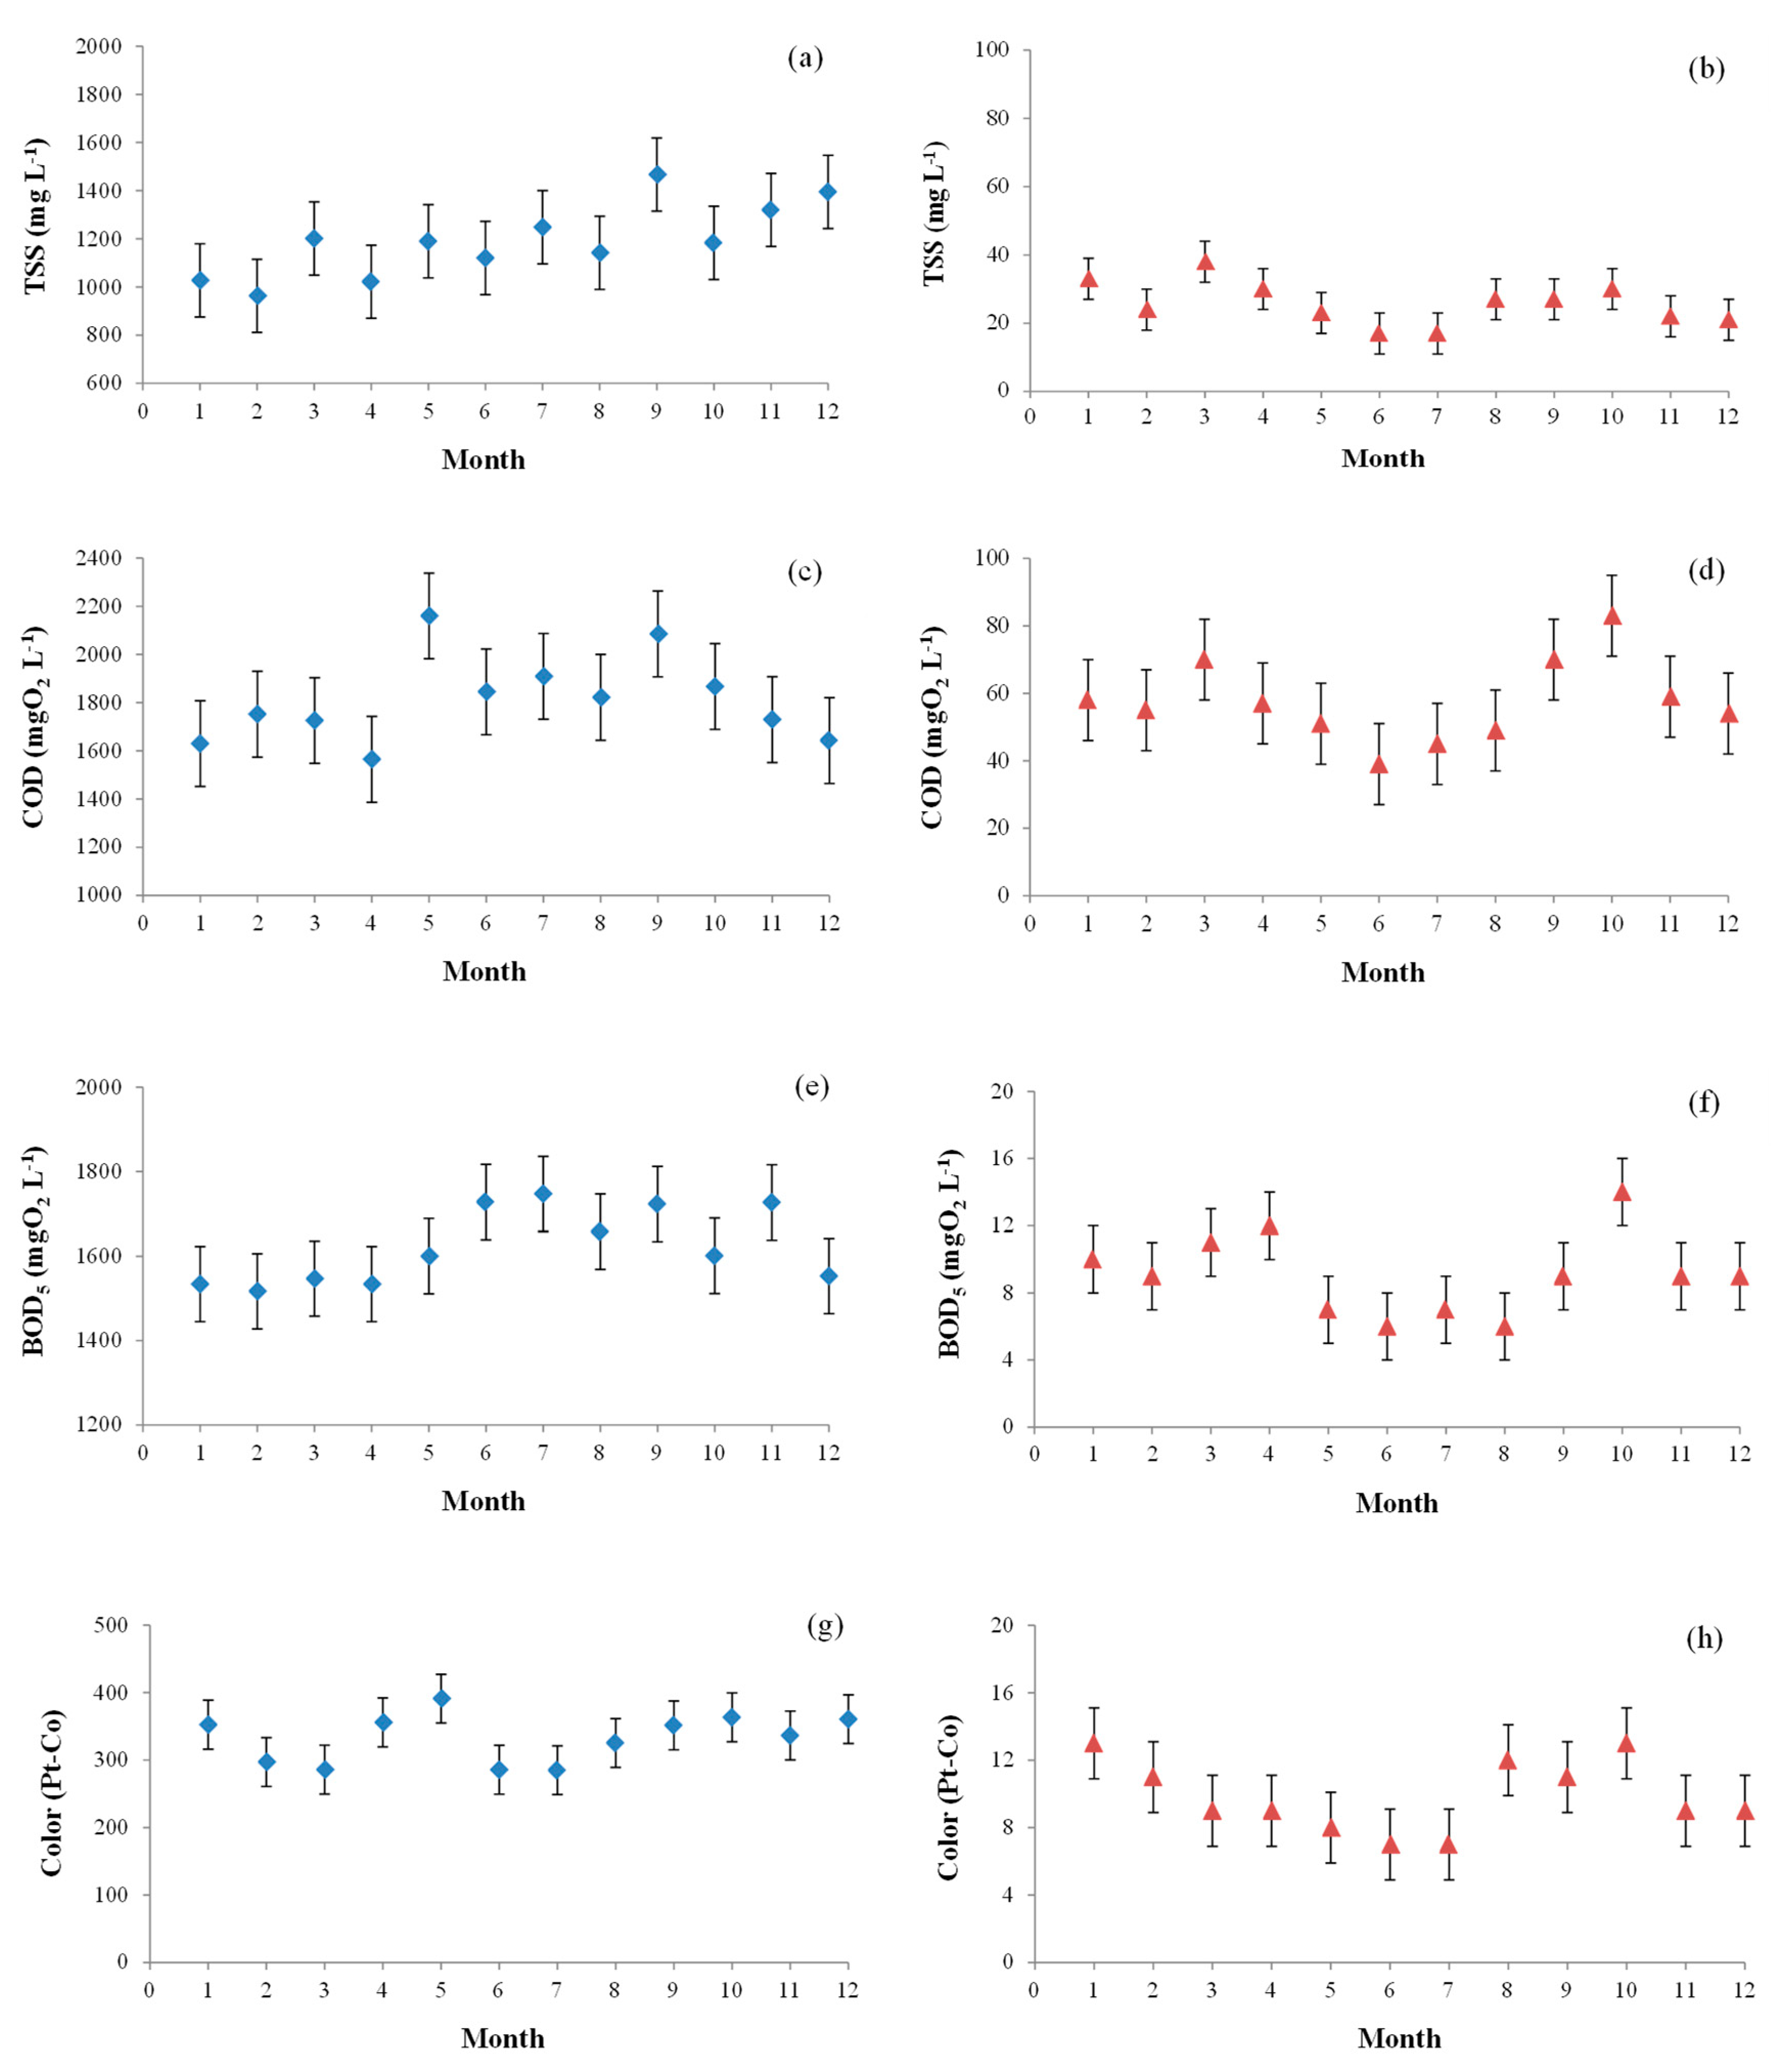
3.1. Performance of the Paper Mill Wastewater Treatment Plant

Table 1 shows the values of electrical conductivity, pH, color, TSS, BOD5, and COD for both the influent and effluent from the wastewater treatment plant of the paper mill.
The wastewater presents a high value of COD (1811 mgO2·L−1) and an elevated biodegradability with a biodegradability factor (defined as the relation of BOD5/COD) of 0.90, which implies that a biological treatment is the most adequate one for the treatment of this type of wastewater (Figure 1) [35]. This is in line with the high value of BOD5 reduction (99.4%), the effluent of activated sludge treatment plant presenting a value of 9 mgO2·L−1 BOD5. Regarding the COD, Wang et al. [36] worked with an influent with 1669.7 mgO2·L−1, very similar to that of this study. Regarding the BOD, Zwain et al. [37] obtained values within the range of 1650–2565 mgO2·L−1, superior to that of this research (Table 1).
Wang et al. [36] worked with an influent with a biodegradability factor of 0.27, and Zwain et al. [37] operated within the range of 0.488–0.52, the biodegradability being based on BOD5 in both cases. These values are far below those obtained in the present study, which implies different types of treatment in the studies of these authors.
Avsar and Demirer [38] worked with influents with values of TSS of 1241 mg·L−1 and 1309 mg·L−1, which were slightly higher than the value of the treatment plant under study (Table 1).
The pH values obtained by Zwain et al. [37], Kansal et al. [39] and Liu et al. [40] for this type of wastewater are similar to those obtained in this study (7.9 for the influent).
The activated sludge biological reactor represents the most important part in the wastewater treatment plant. In this study, the biological process is aerobic, with an average value of 3.7 ± 0.4 mgO2·L−1 dissolved oxygen. Figure 2 shows the evolution of the MLTSS and MLVSS concentration present in the activated sludge biological reactor over the analyzed period.
The volatile fraction represents 83% of MLTSS, which is in line with other studies where urban wastewater treatment is analyzed by means of aerobic biological processes [41].
Table 1 shows that the performance of color, TSS, BOD5, and COD removal is higher than 96% in all cases. Khansorthong and Hunsom [42] obtained similar performance for color and COD removal with an electrocoagulation process. However, Tiku et al. [43] obtained lower performance (76%) for the COD and color in an activated sludge system.
Figure 3 shows the values of TSS, COD, BOD5 and color for both the influent and effluent from the wastewater treatment plant during the operational period analyzed.

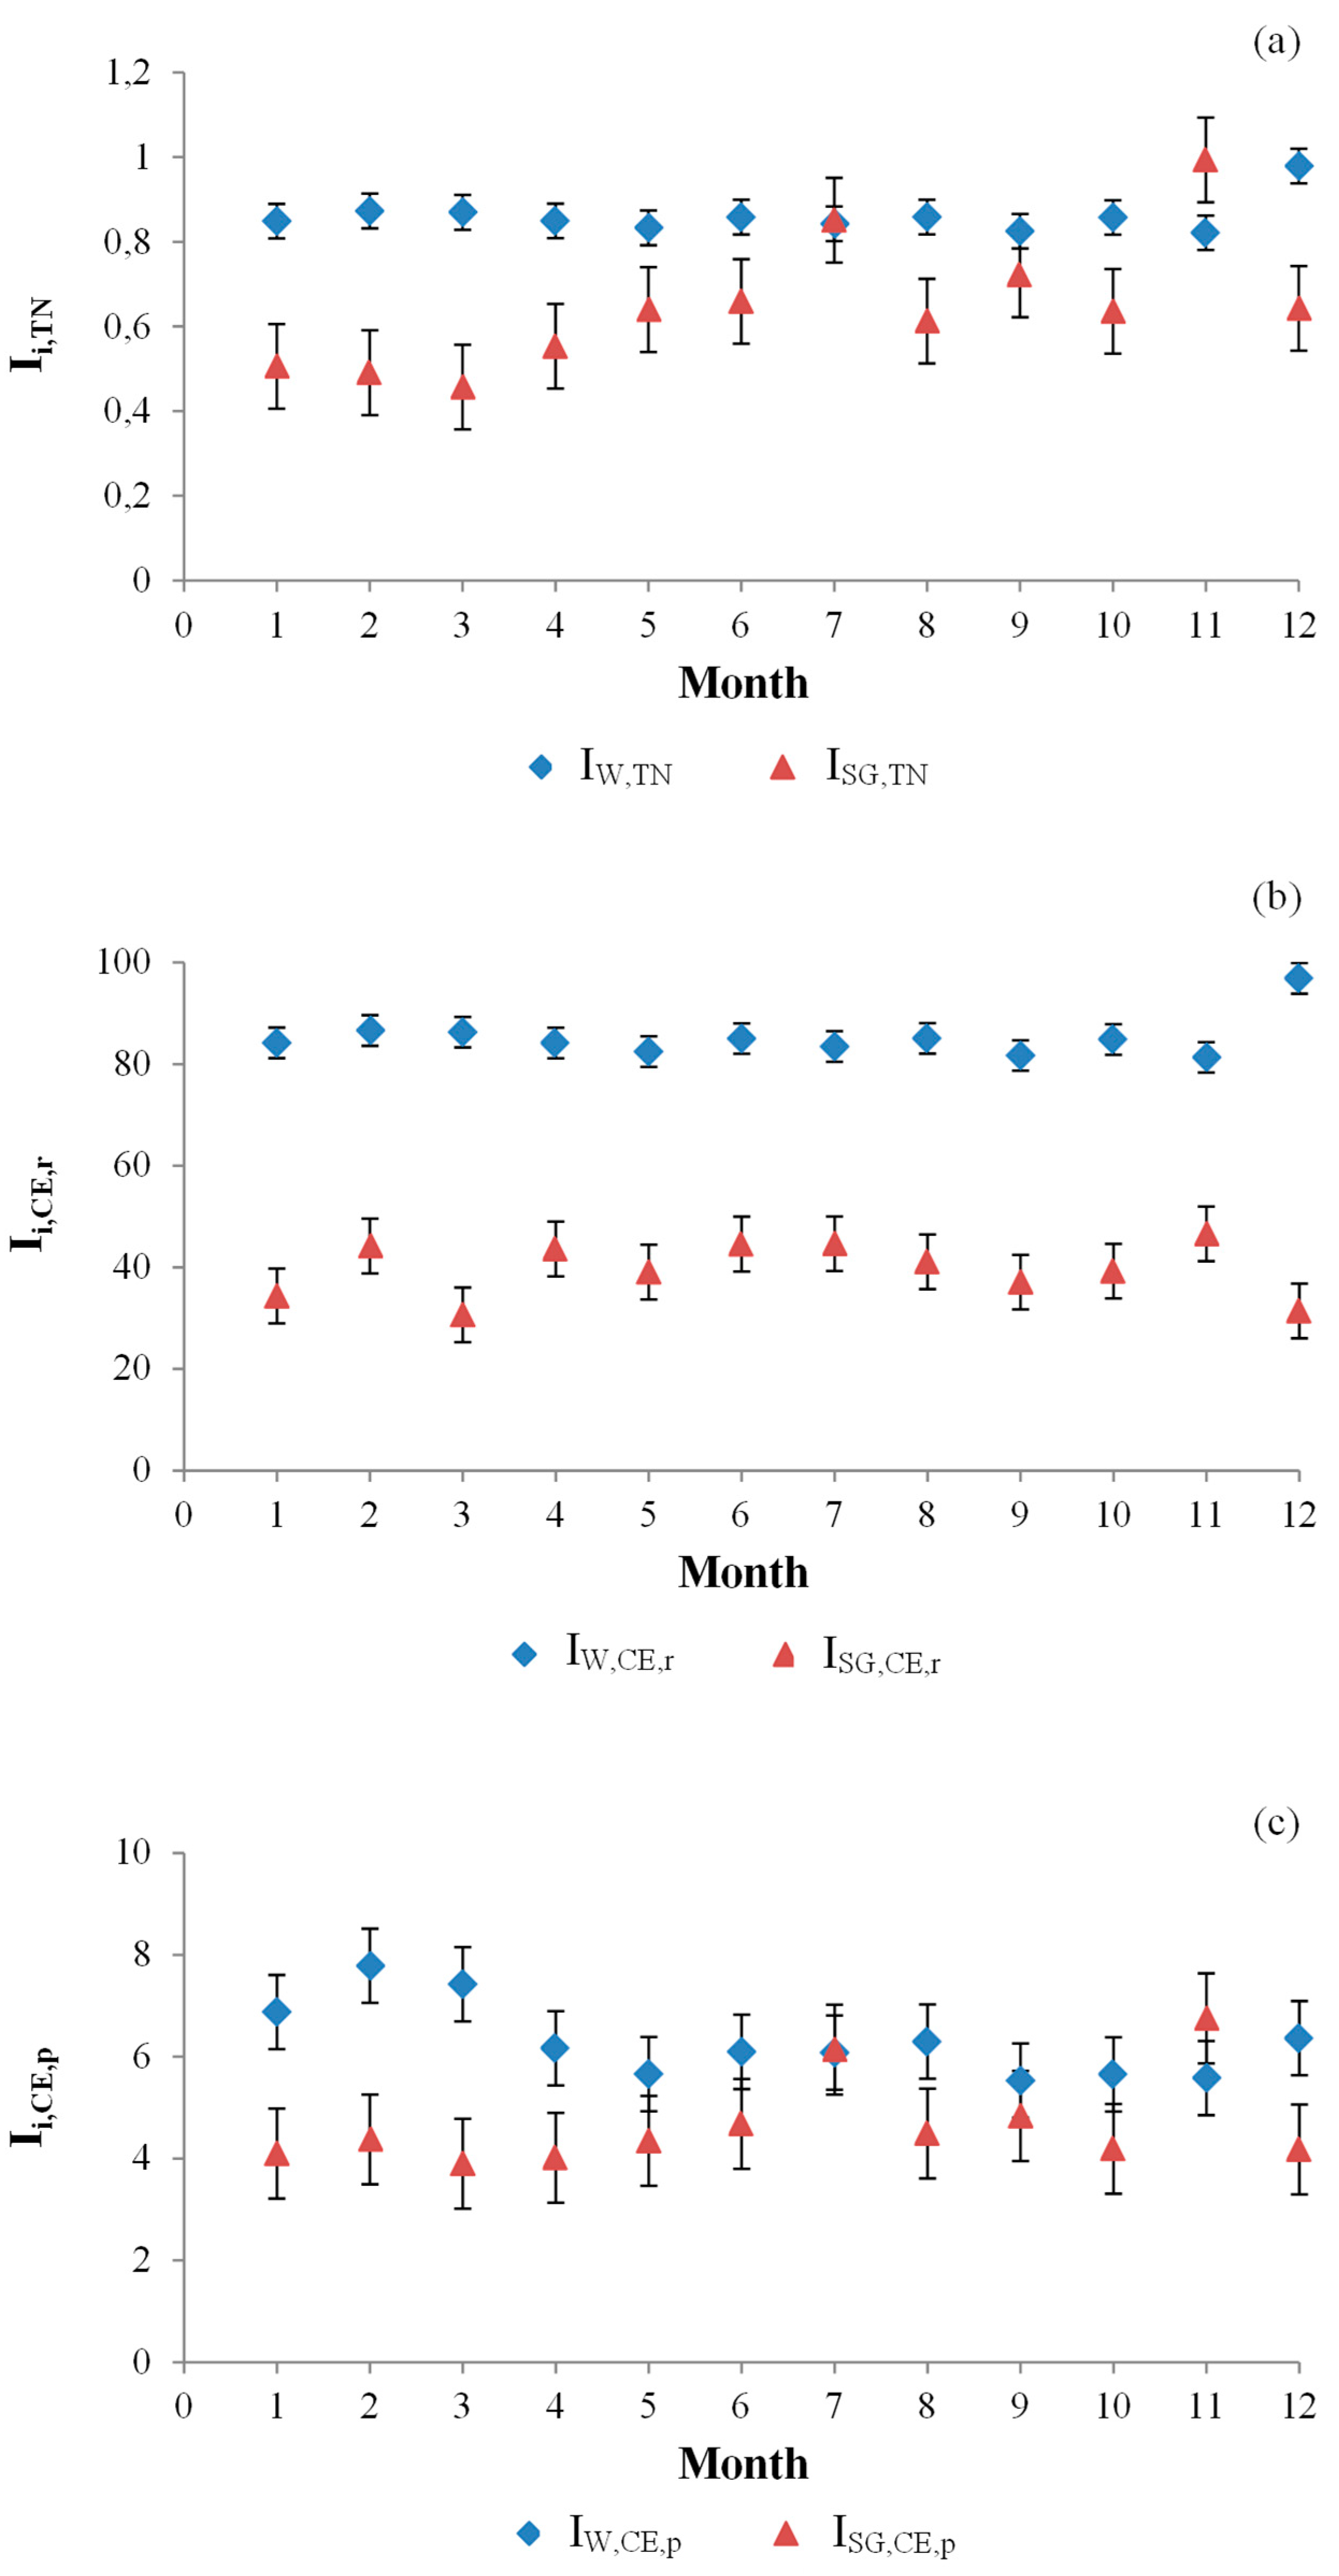
3.2. Indicators of Circular Economy

Table 2 shows the values of QEF, QW,T, mSG,R, mSG,T, QPMW and PP during the year of research.
Table 3 shows the average values of the six indicators of circular economy evaluated for the process of wastewater treatment of the paper pill, which were defined previously in Section 2.4.1 and Section 2.4.2.
As shown in Table 3, the treatment process allows water and sludge recovery from waste, turned into a technological nutrient, which constitutes the wastewater from the paper mill. The water obtained would make it possible to reduce water consumption for such a process by 85.1%, once it undergoes untrafiltration or ion-exchange membrane processes, having one of its best applications in irrigation of the fourdrinier machine. In this way, the discharge of effluent into the sea would be avoided by means of an emissary submarine without any type of reutilization. The water, which could be recycled in the process, must comply the limits established in Table 4.
In addition, 39.7% generated sludge during the treatment process is recovered and used as mineral load along with the rest of raw materials in the base paper manufacturing stage, described in Section 2.1.1. These values for reductive indicators of circular economy efficiency are considerably higher than those obtained by Molina-Moreno et al. [31] for pig manure treatment, with values of 49.81% for water and 4.60% for biofertilizer.
Furthermore, the productive indicators of circular economy efficiency indicate that 6.3 m3 water and 4.7 kg sludge would be recovered per 1 Tn paper produced. This represents a reduction in water consumption and raw materials during the paper production process.
Regarding the indicators that allow us to obtain technological nutrients, they demonstrate the transformation of wastewater from paper mills as a resource, which can later be reintroduced into the production process as mineral load or water. This is also reflected through the previously mentioned indicators of circular economy efficiency. According to Table 3, 0.9 m3 water and 0.7 kg sludge are produced per 1 m3 wastewater from the paper mill. Regarding pig manure treatment, Molina-Moreno et al. [31] determined that 0.99 m3 water and 47.42 kg biofertilizer were generated per 1 m3 pig manure, exceeding the values of the present research, especially those associated with the process of obtaining the biofertilizer in comparison to recovered sludge as mineral load during the paper production process.
As a consequence, the process costs can be reduced through the recycling of sludge and water (Figure 4). In light of this, the sludge recycling implies a lower management cost with a saving from dumping control fee of sludge. This saving is evaluated from the average value of mSG,R (dry base), the moisture percentage (80%), and the price of this sludge (21 €·Tnwet−1), resulting in 119,756 €·year−1. In addition, the reintroduction of sludge as mineral load into the paper production process will avoid the use of a fraction of carbonate (H-75). If a recycling efficiency of 95% in relation to mSG,R is supposed, and considering a price of 70 €·Tnwet−1 and an assay of 72% for H-75, the saving obtained is equal to 105,341 €·year−1. Finally, the saving from water recycling in the irrigation of the fourdrinier machine within the paper production process results in savings of 20,000 €·year-1 due to the absence of discharge control fee by water reuse.
Figure 5 shows the stability of the three indicators defined for both water and sludge during the year of experimentation.
Figure 5 shows that those indicators related to water are superior to those related to sludge, both for technological nutrient performance and circular economy efficiency. However, when referring to the volumes of water and sludge mass, only reductive indicators of circular economy efficiency would be comparable, presenting a value for the water indicator (85.1%) which nearly doubles the sludge indicator (39.7%).
The triplot diagram from the multivariable statistical analysis is shown in Figure 6.
Concerning the indicators of technological nutrients, IW,TN is negatively affected by QPMW, and ISG,TN is negatively correlated with QPMW and mSG,R. In relation to the indicators of circular economy for water, IW,CE,r is negatively affected by QW,T, and IW,CE,p is positively correlated with IW,TN and negatively correlated with PP. Regarding the indicators of circular economy for sludge, ISG,CE,r is positively affected by mSG,R, and ISG,CE,p is positively correlated with ISG,TN and negatively affected by QPMW.
In addition to this proposal of an in situ recovery of water and sludge, there is an evident trend of in situ recovery, as shown in recent examples from various fields, i.e. membrane-based solvent recovery [44], in situ formation of struvite with simultaneous water recovery from digested swine wastewater [45], in situ solvent and reagent recycling from a hybrid process combining a nanofiltration unit and a continuous-flow reactor [46], and in situ product recovery of prodigiosin by micellar aqueous two-phase systems [47].
The importance of the application of the circular economy model in wastewater treatment in paper mills becomes more evident thanks to the values of the indicators of circular economy efficiency and technological nutrient performance. These indicators of circular economy are intended to allow the paper industry to become a reference regarding so-called sustainable production, since they demonstrate that once the input waste characterization applied to a production process is known, waste can be considered as a technological nutrient. In this regard, it can be reincorporated into the same process, generating an added value. The key fact is that it is not considered as waste with negative impact on the environment and sustainability as a whole. The implementation of those indicators can make the decision-making process easier for those working in the paper industry, allowing the adoption of the corresponding operational decisions so that this sector moves towards a production system conceived of within the circular economy model, reducing negative externalities as far as possible. Thus, these indicators of circular economy seek to transfer knowledge to the sector of a real and productive economy, in order for the paper industry to comply with the European Union’s new regulatory requirements regarding waste generation by 2020. In the same way, they contribute to the implementation of the Spanish Government’s legislation regarding a new action plan in favor of a circular economy in Spain. In relation to this plan, it must be mentioned that the Ministry of Agriculture and Fisheries, Food and Environment has made public the draft of Spanish Circular Economy Strategy, which envisages measures in order for the country’s economy to become circular, and therefore, fully sustainable.

4. Conclusions

The first conclusion drawn from this research is that it was possible to demonstrate that wastewater from paper mills can be considered as a technological nutrient that can be reintroduced into the production system. This enables reusing those resources present in the industry, such as water and mineral load in the form of sludge, from the treatment process whose central axis is the activated sludge system, as a consequence of the high biodegradability of the influent to be treated with a biodegradability factor of 0.90. Such resources can be reused during the process itself, with a reduction of 85.1% in water consumption and another of 39.7% in the mineral load of the base paper manufacturing process. In this regard, 0.9 m3 water and 0.7 kg sludge are produced per 1 m3 wastewater from the paper mill. In addition, the productive indicators for circular economy efficiency show that there is a recovery of 6.3 m3 water and 4.7 kg sludge per 1 Tn paper produced.
As a consequence, this research provides the first indicators for circular economy efficiency and technological nutrient performance within paper industry. On this basis, decision-makers from both the production sector and public administration can incorporate them into their sustainability models, and in this way, contribute towards a change of model, from a linear to a circular economy. This would allow for improved efficiency in the use of resources, and the minimization of waste generation.

Author Contributions

All authors participated equally in the conception and design of this research, and the elaboration of this paper. All authors read and approved the final manuscript.

Funding

Research Project ECO2017-84138-P MINECO, AGENCIA ESTATAL DE INVESTIGACIÓN and FEDER (EU).

Acknowledgments

This research was supported by the European Regional Development Fund (European Union), the Government of Spain (Research Projects ECO2013-47027-P and ECO2017-84138-P), and the Regional Government of Andalusia (Research Project P11-SEJ-7294).

Conflicts of Interest

The authors declare no conflict of interest.

Nomenclature

IW,TNm3water m−3paper mill wastewaterIndicator of technological nutrient performance for water
IW,CE,r%Reductive indicator of circular economy efficiency for water
IW,CE,pm3water Tn−1paperProductive indicator of circular economy efficiency for water
ISG,TNkg sludge m−3paper mill wastewaterIndicator of technological nutrient performance for the recovered sludge
ISG,CE,r%Reductive indicator of circular economy efficiency for sludge
ISG,CE,pkg sludge Tn−1paperProductive indicator of circular economy efficiency for sludge

References

  1. Hu, J.; Xiao, Z.; Zhou, R.; Deng, W.; Wang, M.; Ma, S. Ecological utilization of leather tannery waste with circular economy model. J. Clean. Prod. 2011, 19, 221–228. [Google Scholar] [CrossRef]
  2. Núñez-Cacho, P.; Molina-Moreno, V.; Corpas-Iglesias, F.A.; Cortés-García, F.J. Family businesses transitioning to a circular economy model: The case of “Mercadona”. Sustainability 2018, 10, 538. [Google Scholar] [CrossRef]
  3. Lieder, M.; Rashid, A. Towards circular economy implementation: A comprehensive review in context of manufacturing industry. J. Clean. Prod. 2016, 115, 36–51. [Google Scholar] [CrossRef]
  4. Jaria, G.; Silva, C.P.; Ferreira, C.I.A.; Otero, M.; Calisto, V. Sludge from paper mill effluent treatment as raw material to produce carbon adsorbents: An alternative waste management strategy. J. Environ. Manag. 2017, 188, 203–211. [Google Scholar] [CrossRef] [PubMed]
  5. Asghar, M.N.; Khan, S.; Mushtaq, S. Management of treated pulp and paper mill effluent to achieve zero discharge. J. Environ. Manag. 2008, 88, 1285–1299. [Google Scholar] [CrossRef] [PubMed]
  6. Soucy, J.; Koubaa, A.; Migneault, S.; Riedl, B. The potential of paper mill sludge for wood–plastic composites. Ind. Crop. Prod. 2014, 54, 248–256. [Google Scholar] [CrossRef]
  7. Adhikari, G.; Bhattacharyya, K.G. Impact of pulp and paper mill effluents and solid wastes on soil mineralogical and physicochemical properties. Environ. Monit. Assess. 2015, 187, 1–13. [Google Scholar] [CrossRef] [PubMed]
  8. Thompson, G.; Swain, J.; Kay, M.; Froster, C.F. The treatment of pulp and paper mill effluent: A review. Bioresour. Technol. 2001, 77, 275–286. [Google Scholar] [CrossRef]
  9. Szolosi, O. Water cycle with zero discharge at Visy Pulp and Paper, Tumut, NSW. Water (Australia) 2003, 30, 34–36. [Google Scholar]
  10. Edalatmanesh, M.; Sain, M.; Liss, S.N. Cellular biopolymers and molecular structure of a secondary pulp and paper mill sludge verified by spectroscopy and chemical extraction techniques. Water Sci. Technol. 2010, 62, 2846–2853. [Google Scholar] [CrossRef] [PubMed]
  11. Amini, S.; Movahedi, S.A.R.; Mashayekhi, K. Effects of paper-mill sludge as a mulch versus topsoil incorporation on potassium uptake and the grain yield of rain-fed wheat in a high specific surface loess soil with illite dominance in clay fraction. Appl. Environ. Soil Sci. 2012, 2012, 1–10. [Google Scholar] [CrossRef]
  12. Bajpai, P. Management of Pulp and Paper Mill Waste; Springer International Publishing: Cham, Switzerland, 2015. [Google Scholar]
  13. Buruberri, L.H.; Seabra, M.P.; Labrincha, J.A. Preparation of clinker from paper pulp industry wastes. J. Hazard. Mater. 2015, 286, 252–260. [Google Scholar] [CrossRef] [PubMed]
  14. Pellegrin, V.; Juretschko, S.; Wagner, M.; Cottenceau, G. Morphological and biochemical properties of a Sphaerotilus sp. isolated from paper mill slimes. Appl. Environ. Microbiol. 1999, 65, 156–162. [Google Scholar] [PubMed]
  15. Pokhrel, D.; Viraraghavan, T. Treatment of pulp and paper mill wastewater—A review. Sci. Total Environ. 2004, 333, 37–58. [Google Scholar] [CrossRef] [PubMed]
  16. Likon, M.; Trebse, P. Recent Advances in Paper Mill Sludge Management; InTech: Rijeka, Croatia, 2012; pp. 73–90. [Google Scholar]
  17. Pervaiz, M.; Sain, M. Recycling of paper mill biosolids: A review on current practices and emerging biorefinery initiatives. Clean 2015, 43, 919–926. [Google Scholar] [CrossRef]
  18. Whitehead, J.H.; Geary, P.M. Geotechnical aspects of domestic on-site effluent management systems. Aust. J. Earth Sci. 2000, 47, 75–82. [Google Scholar] [CrossRef]
  19. Reckamp, J.M.; Garrido, R.A.; Satrio, J.A. Selective pyrolysis of paper mil sludge by using pretreatment processes to enhance the quality of bio-oil and biochar products. Biomass Bioenerg. 2014, 71, 235–244. [Google Scholar] [CrossRef]
  20. Communication from the Commission to the European Parliament, the Council, the European Economic and Social Committee and the Committee of the Regions. Towards a Circular Economy: A Zero Waste Programme for Europe, 2014. 398 Final. Available online: http://ec.europa.eu/transparency/regdoc/rep/1/2014/EN/1-2014-398-EN-F1-1.Pdf (accessed on 15 May 2018).
  21. Confederation of European Paper Industries. 2016. Available online: http://www.cepi.org (accessed on 15 May 2018).
  22. European Commission. Directive 2008/98/EC on Waste (Waste Framework Directive). 2016a. Available online: http://ec.europa.eu/environment/waste/framework/ (accessed on 15 May 2018).
  23. European Commission. Roadmap to a Resource Efficient Europe. 2016b. Available online: http://ec.europa.eu/environment/resource_efficiency/about/roadmap/index_en.htm (accessed on 15 May 2018).
  24. Molina-Moreno, V.; Leyva-Díaz, J.C.; Sánchez-Molina, J.; Peña-García, A. Proposal to foster sustainability through circular economy-based engineering: A profitable chain from waste management to tunnel lighting. Sustainability 2017, 9, 2229. [Google Scholar] [CrossRef]
  25. Molina-Moreno, V.; Leyva-Díaz, J.C.; Sánchez-Molina, J. Pellet as a technological nutrient within the circular economy model: Comparative analysis of combustion efficiency and CO and NOx emissions for pellets from olive and almond trees. Energies 2016, 9, 777. [Google Scholar] [CrossRef]
  26. Argudo-García, J.J.; Molina-Moreno, V.; Leyva-Díaz, J.C. Valorization of sludge from drinking wáter treatment plants. A commitment to circular economy and sustainability. Dyna 2017, 92, 71–75. [Google Scholar]
  27. Havlínová, B.; Katuscak, S.; Petrovicová, M.; Maková, A.; Brezová, V. A study of mechanical properties of papers exposed to various methods of accelerated ageing. Part I. The effect of heat and humidity on original wood–pulp papers. J. Cult. Herit. 2009, 10, 222–231. [Google Scholar] [CrossRef]
  28. Vochozka, M.; Marousková, A.; Váchal, J.; Straková, J. Reengineering the paper mill waste management. Clean Techn. Environ. Policy 2016, 18, 323–329. [Google Scholar] [CrossRef]
  29. Morató, J.; Tollin, N.; Jiménez, L.; Villanueva, B.; Plà, M.; Betancourth, C.; de la Cruz, J.L.; Pérez-Lagüela, E. Situación y Evolución de la Economía Circular en España; Fundación COTEC para la Innovación: Madrid, Spain, 2017; Available online: http://cotec.es/media/informe-CotecISBN-1.pdf (accessed on 15 May 2018).
  30. Franklin-Johnson, E.; Figge, F.; Canning, L. Resource duration as a managerial indicator for circular economy performance. J. Clean. Prod. 2016, 133, 589–598. [Google Scholar] [CrossRef]
  31. Molina-Moreno, V.; Leyva-Díaz, J.C.; Llorens-Montes, F.J.; Cortés-García, F.J. Design of indicators of circular economy as instruments for the evaluation of sustainability and efficiency in wastewater from pig farming industry. Water 2017, 9, 653. [Google Scholar] [CrossRef]
  32. Kamali, M.; Khodaparast, Z. Review on recent developments on pulp and paper mill wastewater treatment. Ecotox. Environ. Safe 2015, 114, 326–342. [Google Scholar] [CrossRef] [PubMed]
  33. Gilbride, K.A.; Fulthorpe, R.R. A survey of the composition and diversity of bacterial populations in bleached kraft pulp-mill wastewater secondary treatment systems. J. Microbiol. 2004, 50, 633–644. [Google Scholar] [CrossRef] [PubMed]
  34. APHA (American Public Health Association), AWWA, WEF. Standard Methods for the Examination of Water and Wastewater; APHA: Washington, DC, USA, 2012. [Google Scholar]
  35. Lin, H.; Peng, W.; Zhang, M.; Chen, J.; Hong, H.; Zhang, Y. A review on anaerobic membrane bioreactors: Applications, membrane fouling and future perspectives. Desalination 2013, 314, 169–188. [Google Scholar] [CrossRef]
  36. Wang, B.; Gu, L.; Ma, H. Electrochemical oxidation of pulp and paper making wastewater assisted by transition metal modified kaolin. J. Hazard. Mater. 2007, 143, 198–205. [Google Scholar] [CrossRef] [PubMed]
  37. Zwain, H.M.; Hassan, S.R.; Zaman, N.Q.; Aziz, H.A.; Dahlan, I. The start-up performance of modified anaerobic baffled reactor (MABR) for the treatment of recycled paper mill wastewater. J. Environ. Chem. Eng. 2013, 1, 61–64. [Google Scholar] [CrossRef]
  38. Avsar, E.; Demirer, G.N. Cleaner production opportunity assessment study in SEKA Balikesir pulp and paper mill. J. Clean. Prod. 2008, 16, 422–431. [Google Scholar] [CrossRef]
  39. Kansal, S.K.; Singh, M.; Sud, D. Effluent quality at kraft/soda agro-based paper mills and its treatment using a heterogeneous photocatalytic system. Desalination 2008, 228, 183–190. [Google Scholar] [CrossRef]
  40. Liu, T.; Hu, H.; He, Z.; Ni, Y. Treatment of poplar alkaline peroxide mechanical pulping (APMP) effluent with Aspergillus niger. Bioresour. Technol. 2011, 102, 7361–7365. [Google Scholar] [CrossRef] [PubMed]
  41. Leyva-Díaz, J.C.; Poyatos, J.M. Start-up of membrane bioreactor and hybrid moving bed biofilm reactor–membrane bioreactor: kinetic study. Water Sci. Technol. 2015, 72, 1948–1953. [Google Scholar] [CrossRef] [PubMed]
  42. Khansorthong, S.; Hunsom, M. Remediation of wastewater from pulp and paper mill industry by the electrochemical technique. Chem. Eng. J. 2009, 151, 228–234. [Google Scholar] [CrossRef]
  43. Tiku, D.K.; Kumar, A.; Chaturvedi, R.; Dayal, S.; Manoharan, A.; Kumar, R. Holistic bioremediation of pulp mill effluents using autochthonous bacteria. Int. Biodeterior. Biodegrad. 2010, 64, 173–183. [Google Scholar] [CrossRef]
  44. Schaepertoens, M.; Didaskalou, C.; Kim, J.F.; Livingston, A.G.; Szekely, G. Solvent recycle with imperfect membranes: A semi-continuous workaround for diafiltration. J. Membr. Sci. 2016, 514, 646–658. [Google Scholar] [CrossRef] [Green Version]
  45. Wu, Z.; Zou, S.; Zhang, B.; Wang, L.; He, Z. Forward osmosis promoted in-situ formation of struvite with simultaneous water recovery from digested swine wastewater. Chem. Eng. J. 2018, 342, 274–280. [Google Scholar] [CrossRef]
  46. Fodi, T.; Didaskalou, C.; Kupai, J.; Balogh, G.T.; Huszthy, P.; Szekely, G. Nanofiltration-enabled in situ solvent and reagent recycle for sustainable continuous-flow synthesis. ChemSusChem 2017, 10, 3435–3444. [Google Scholar] [CrossRef] [PubMed]
  47. Chávez-Castilla, L.R.; Aguilar, O. An integrated process for the in situ recovery of prodigiosin usingmicellar ATPS from a culture of Serratia marcescens. J. Chem. Technol. Biotechnol. 2016, 91, 2896–2903. [Google Scholar] [CrossRef]
Figure 1. Flowchart of the paper mill wastewater treatment plant.
Water 10 01014 g001
Figure 2. Evolution of mixed liquor total suspended solids (MLTSS) and mixed liquor volatile suspended solids (MLVSS).
Water 10 01014 g002
Figure 3. Evolution of total suspended solids (TSS), chemical oxygen demand (COD), seven-day biochemical oxygen demand (BOD5) and color for the influent and effluent of the paper mill wastewater treatment plant. (a) TSS of the influent. (b) TSS of the effluent. (c) COD of the influent. (d) COD of the effluent. (e) BOD5 of the influent. (f) BOD5 of the effluent. (g) Color of the influent. (h) Color of the effluent.
Water 10 01014 g003
Figure 4. Distribution of savings from the recycling of sludge and water within the circular economy model.
Water 10 01014 g004
Figure 5. Evolution of indicators of technological nutrient performance (Ii,TN) and indicators of circular economy efficiency (Ii,CE,r and Ii,CE,p). (a) Indicators of technological nutrient performance for water (IW,TN) and for sludge (ISG,TN), (b) reductive indicators of circular economy efficiency for water (IW,CE,r) and for sludge (ISG,CE,r), (c) productive indicators of circular economy efficiency for water (IW,CE,p) and for sludge (ISG,CE,p).
Water 10 01014 g005
Figure 6. Triplot diagram for redundancy analysis of the indicators of technological nutrient (Ii,TN) and circular economy (Ii,CE,r and Ii,CE,p) in relation to the operational variables QEF (volumetric flow of treated water that can be recovered during the treatment process), QPMW (volumetric flow of wastewater from the paper mill), QW,T (total water volumetric flow consumed in the paper production process), PP (mass flow of paper produced), mSG,R (mass flow of recovered sludge during the wastewater treatment of the paper mill) and mSG,T (mass flow of generated sludge).
Water 10 01014 g006
Table 1. Characterization of the influent and effluent from the wastewater treatment plant of the paper mill, and the removal percentages of color, TSS (total suspended solids), BOD5 (seven-day biochemical oxygen demand) and COD (chemical oxygen demand).
ParameterSampling ZoneRemoval Percentage (%)
InfluentEffluent
Electrical conductivity (μS·cm−1)1455 ± 1341547 ± 129-
pH7.9 ± 0.27.8 ± 0.1-
Color (Pt-Co)332.5 ± 36.29.8 ± 2.197.1
TSS (mg·L−1)1190 ± 15226 ± 697.8
BOD5 (mg O2·L−1)1622 ± 899 ± 299.4
COD (mgO2 ·L−1)1811 ± 17858 ± 1296.8
Table 2. Characterization of water and sludge flows of the wastewater treatment plant, and water consumption and paper production of the paper mill. QEF (volumetric flow of treated water), QW,T (volumetric flow of total water consumed during the paper manufacturing process), mSG,R (mass flow of recovered sludge), mSG,T (mass flow of generated sludge), QPMW (volumetric flow of wastewater from paper mill), PP (mass flow of paper produced).
MonthQEF (m3·day−1)QW,T (m3·day−1)mSG,R (kg·day−1)mSG,T (kg·day−1)QPMW (m3·day−1)PP (Tn·day−1)
14341 ± 3355158 ± 2202587 ± 3247529 ± 9355114 ± 215631 ± 77
24679 ± 3615403 ± 2302631 ± 3295953 ± 7405361 ± 225601 ± 74
34677 ± 3605422 ± 2302457 ± 3088012 ± 9905378 ± 230630 ± 75
44287 ± 3305096 ± 2202792 ± 3506404 ± 7955047 ± 210695 ± 80
54115 ± 3204991 ± 2153161 ± 3968089 ± 9954940 ± 211727 ± 90
64262 ± 3305015 ± 2143273 ± 4057343 ± 9154966 ± 212699 ± 85
74299 ± 3325152 ± 2204342 ± 5409730 ± 11505103 ± 220707 ± 85
84471 ± 3405258 ± 2253191 ± 4007765 ± 9655208 ± 225710 ± 80
93927 ± 3004809 ± 2053435 ± 4259262 ± 10704759 ± 205710 ± 85
103953 ± 3054659 ± 1992931 ± 3657467 ± 9304610 ± 200699 ± 83
113747 ± 2904609 ± 1974532 ± 5609734 ± 11704562 ± 195671 ± 81
123297 ± 2503404 ± 1402165 ± 2706888 ± 8553368 ± 140518 ± 63
Table 3. Indicators of technological nutrient performance and circular economy efficiency for water and sludge produced during the process of wastewater treatment of the paper mill. IW,TN (indicator of technological nutrient performance for water), IW,CE,r (reductive indicator of circular economy efficiency for water), IW,CE,p (productive indicator of circular economy efficiency for water), ISG,TN (indicator of technological nutrient performance for the recovered sludge), ISG,CE,r (reductive indicator of circular economy efficiency for sludge), ISG,CE,p (productive indicator of circular economy efficiency for sludge).
Indicator of Circular EconomyValue
Water
IW,TN (m3water m−3paper mill wastewater)0.9 ± 0.1
IW,CE,r (%)85.1 ± 4.0
IW,CE,p (m3water Tn−1paper)6.3 ± 0.7
Sludge
ISG,TN (kg sludge m−3paper mill wastewater)0.7 ± 0.2
ISG,CE,r (%)39.7 ± 5.4
ISG,CE,p (kg sludge Tn−1paper)4.7 ± 0.9
Table 4. Characterization of the water used in the paper production process.
ParameterValueParameterValue
Hardness (°HF)30.7 ± 0.7pH7.8 ± 0.1
Ca2+ (mg·L−1)75.0 ± 3.0Conductivity (μS·cm−1)692 ± 31
Mg2+ (mg·L−1)29.0 ± 0.9Dry residue (mg·L−1)485 ± 22
Alkalinity (°F)23.7 ± 1.4Silica (mg·L−1)7.9 ± 0.6
HCO3 (mg·L−1)289.0 ± 16.5Fe2+ (mg·L−1)0.020 ± 0.005
Cl (mg·L−1)76.0 ± 4.7SO42− (mg·L−1)90.0 ± 5.4
T (°C)18.8 ± 0.7PO43− (mg·L−1)0.20 ± 0.03

