Benthic Diatoms of the Ying River (Huaihe River Basin, China) and Their Application in Water Trophic Status Assessment

College of Life and Environmental Sciences, Shanghai Normal University, No. 100 Guilin Road, Xuhui District, Shanghai 200234, China
*
Author to whom correspondence should be addressed.
Water 2018, 10(8), 1013; https://doi.org/10.3390/w10081013
Submission received: 4 June 2018
/
Revised: 17 July 2018
/
Accepted: 18 July 2018
/
Published: 31 July 2018
(This article belongs to the Section Water Quality and Contamination)
Abstract
:Benthic diatoms are an indispensable link of the water ecological system in terms of energy flow and material cycling, and they directly or indirectly reflect the status of the water environment. We sampled benthic diatoms and environmental factors from April to May of 2013 from 53 sites along the Ying River to study their application in local water trophic status assessment, with a focus on the dominant benthic diatom species, their composition and distribution pattern, and the relationship between benthic diatoms and environmental factors. A total of 370 species and varieties were identified, belonging to 56 genera and six orders. The dominant species were as follows: Nitzschia inconspicua Grunow, Achnanthidium minutissimum (Kützing) Czarnecki, Navicula aitchelbee L. L. Bahls, Nitzschia palea (Kützing) Smith, Cyclotella meneghiniana Kützing, Navicula submuralis Hustedt and Mayamaea atomus (Kützing) Lange-Bertalot. The Ying River was divided into five orders using the Strahler method and three regions according to total nitrogen, total phosphorus and ammonia nitrogen. In region Y-1, which had the lowest nutrient level, the dominant species was Achnanthidium minutissimum. In region Y-2, which had the highest nutrient level, Navicula aitchelbee, Nitzschia palea, and Cyclotella meneghiniana were dominant, while in region Y-3, which had moderate nutrient levels, Nitzschia inconspicua was dominant. Pearson’s correlation analysis and canonical correspondence analysis (CCA) revealed a significant correlation between the environmental factors with dominant species and diatom indices (especially the SPI). Our study indicates that dominant species and diatom indices can, to some extent, indicate the environment, especially nutrient distribution.
1. Introduction
Diatoms are a valuable tool in water quality assessment and monitoring because of their wide geographic distribution, well studied ecology, ease of collection and sensitivity to physical, chemical and biological changes in water [1,2,3,4,5,6].
Benthic diatoms, located at the beginning of the food chain in the ecosystem, are important regulators in fresh water by absorption, adsorption, oxidation and decomposition, precipitation and storage of nutrients [7,8,9,10,11,12,13,14,15]. Benthic diatoms have become an essential part of water ecological status monitoring in the last decade in many countries, especially in Europe [16,17,18].
There is a long history of developing diatom-based indices since the first system was created by Kolkwitz & Marsson [19]. Indeed, more than 20 indices were developed from 1975 to 2015, with the most popular ones being of the following types: indicators of humic degree, such as the Sládeček index (SLA, the Czech Republic [20]); indicators of trophic level, such as the Trophic Diatom Index (TDI, United Kingdom [21]), the Eutrophication Pollution Index using Diatoms (EPI-D, Italy [22]), and the Schiefele-Schreiner Diatom Index (SHE, Germany [23]); indicators of water pollution, such as the Specific Polluosensitivity Index (SPI, France [24]), the standardized Biological Diatom Index, (BDI, France, [25]), the Generic Diatom Index (GDI, France, [26]), and the European Economic Community Index (CEE, Europe [27]).
However, there is evidence that diatom metrics or indices developed in one geographic area are less successful when applied in other areas [3,28]. This is due not only to differences in flora among regions but also environmental differences [29], which modify species responses to water-quality characteristics [3].
The Ying River, the largest tributary in the left bank of the middle reaches, is the key water ecosystem of the Huaihe River Basin, which runs from the northwest to the southeast. The tributaries of the Ying River are numerous and change greatly. This river has historically been important for shipping and agricultural irrigation. There have been a large number of water-conservation facilities constructed on the river since the 1950s, and there are three large reservoirs in the upper reaches of the river. With the development of industry and increasing population density, water quality is decreasing, which is posing a direct threat to aquaculture and residents’ lives. Because of its diverse environmental status, the Ying River is an ideal system for ecological assessment.
Therefore, this study was conducted to investigate the application of benthic diatoms in water trophic status assessment and to attempt to evaluate whether the diatom index is suitable for the diatom community growing under special geographical conditions, such as those that occur in the Ying River, which may be more practical and convenient for routine monitoring and management.
2. Materials and Methods
2.1. Study Region and Sampling Sites
The Ying River (34°20′–34°34′ N, 112°45′–113°15′ E), which is about 36,651 km2 with a total length of 561 km, is located in a warm temperate zone of an area with a semi-humid continental climate that has a mean annual temperature of 14–16° C and a mean annual precipitation of 770 mm.
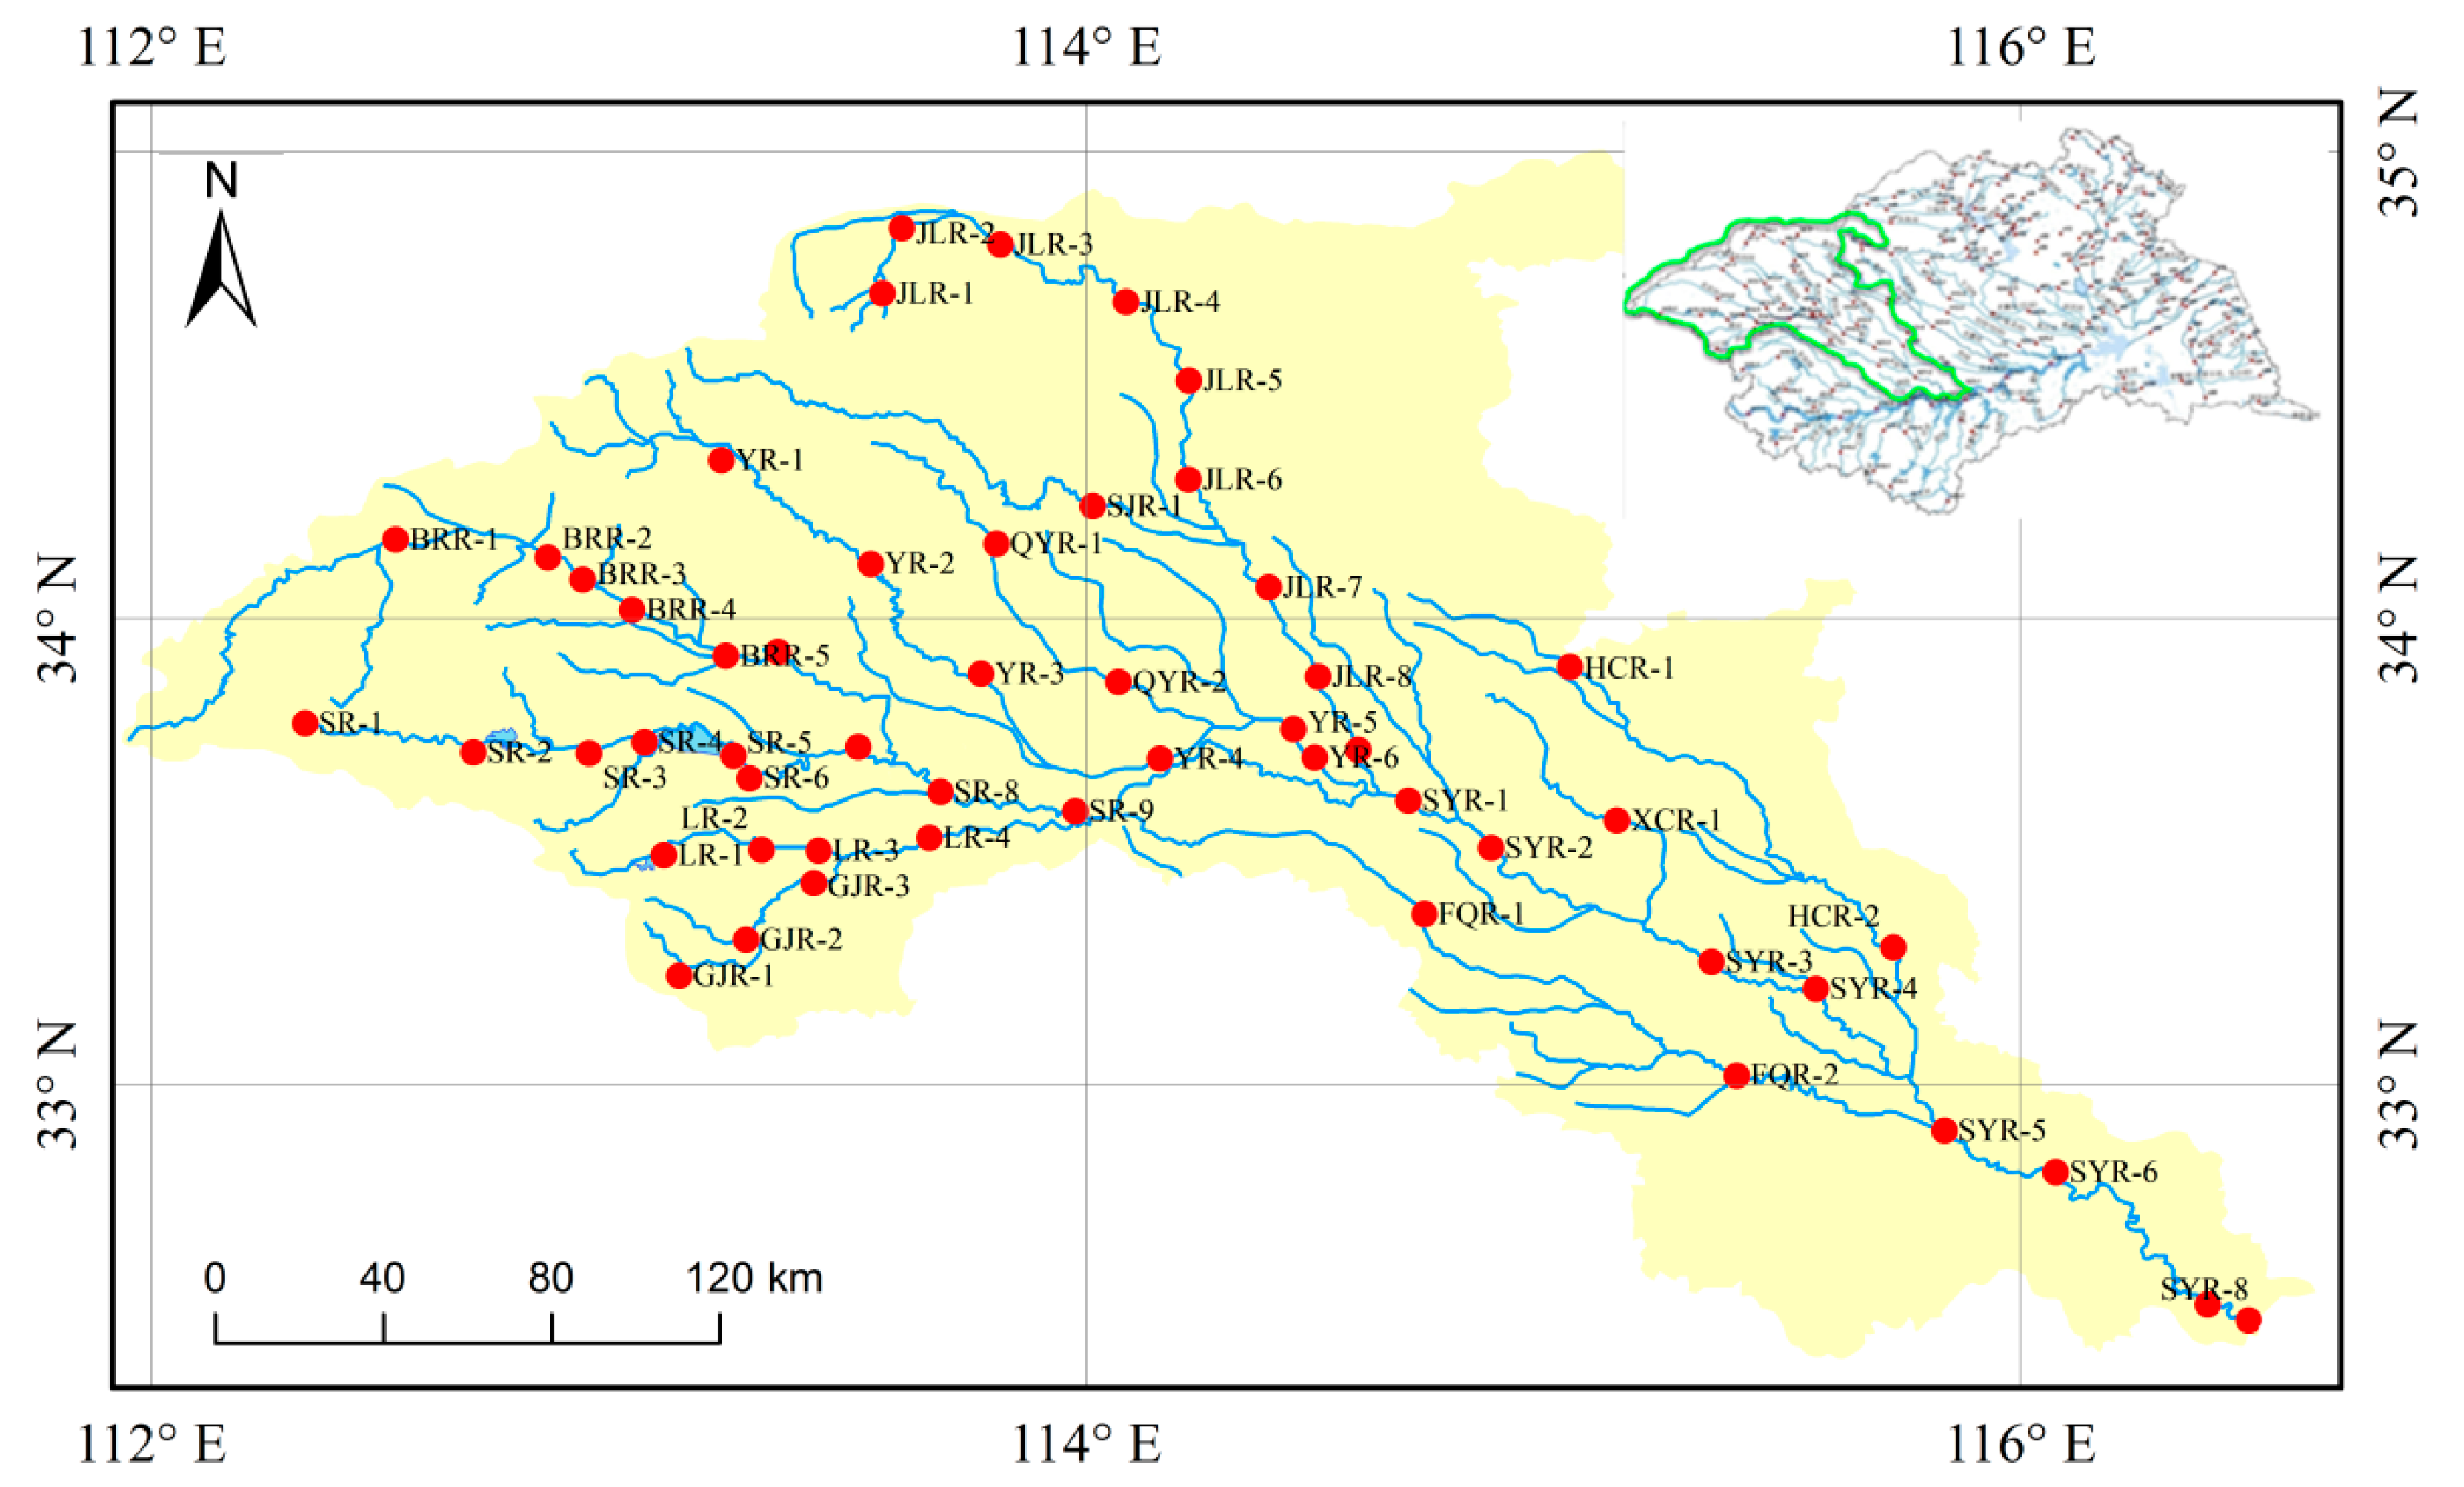
A total of 53 sites were sampled from April to May in 2013. The selected sites cover the major tributaries of the river network and the main-stem river (Figure 1).
2.2. Sampling and Measurement Procedures
Samples were collected from about 0.5 m below the surface of the water with an organic glass hydrophore. Ambient water-quality parameters, including dissolved oxygen (DO), pH, conductivity (Cond), water temperature (WT), turbidity (Turb), salinity (Sal) and other environmental factors were measured using a portable multi-probe (SEBA MPS-K-16, GmbH & Co. KG, Kaufbeuren, Germany) outside the dosing facility before and after the experiment. Water transparency (SD) was measured based on the Secchi depth. We also collected and preserved water samples from each location for nutrient analysis. Total nitrogen (TN) and total phosphorus (TP) were analyzed based on the standard methods (GB11894-89; GB11893-89), while chemical oxygen demand (COD) was determined by the high potassium acid index method.
The benthic diatom samples were collected from representative habitats (such as stone, aquatic plants, etc.) of specific areas using a brush to scrape the samples into the white porcelain plate to form mixed samples. Next, pure water was added to give a final volume of 100 mL in a plastic bottle, and then 4 mL formaldehyde was added. Following complete mixing, 0.1 mL of the concentrated sample was counted directly in a 0.1 mL counting chamber under a microscope at 400× magnification. Each sample was counted three times, after which the average value was taken. Hydrogen peroxide treatment and preparation of permanent slides mounted in Naphrax™ were conducted according to the European Standard EN 13946 (2003). For scanning electron microscopy (SEM), part of the material was also mounted on glass stubs and then coated with gold palladium. Diatoms were observed and identified at the lowest taxonomic level possible using a Nikon 80i multi-function microscope at 1000× magnification, and a minimum of 600 diatom valves were counted on each slide [30,31,32,33,34].
2.3. Data Analysis
Y is dominance, N is the number of all benthic diatoms in the samples, ni is the number of benthic diatom i, fi is the frequency of the species i appearing at each sampling point. The diatom index SPI and GDI were calculated as the following equations:
The two indices are based on a modified version of the Zelinka & Marvan equation [36], where Aj/Ai is the relative abundance of the species j/i, Vj /Vi is its indicative value (1 ≤ Vj/Vi ≤ 3) and Ij/Si its pollution sensitivity (1 ≤ Ij/Si ≤ 5). The values range from 1 to 20, with SPI/GDI ≥ 16 indicating zero pollution or low eutrophication, 13.5 ≤ SPI/GDI < 16 indicating moderate eutrophication, 11 ≤ SPI/GDI < 13.5 indicating moderate pollution or heavy eutrophication, 7 ≤ SPI/GDI < 11 indicating high pollution and SPI/GDI < 7 very heavy pollution.
The SPSS 19.0 software was also used for statistical analysis, and the Canoco 4.5 software was employed for canonical correspondence analysis (CCA). Arcgis and other software were used for charts.
3. Results and Discussion
3.1. Benthic Diatom Assemblages
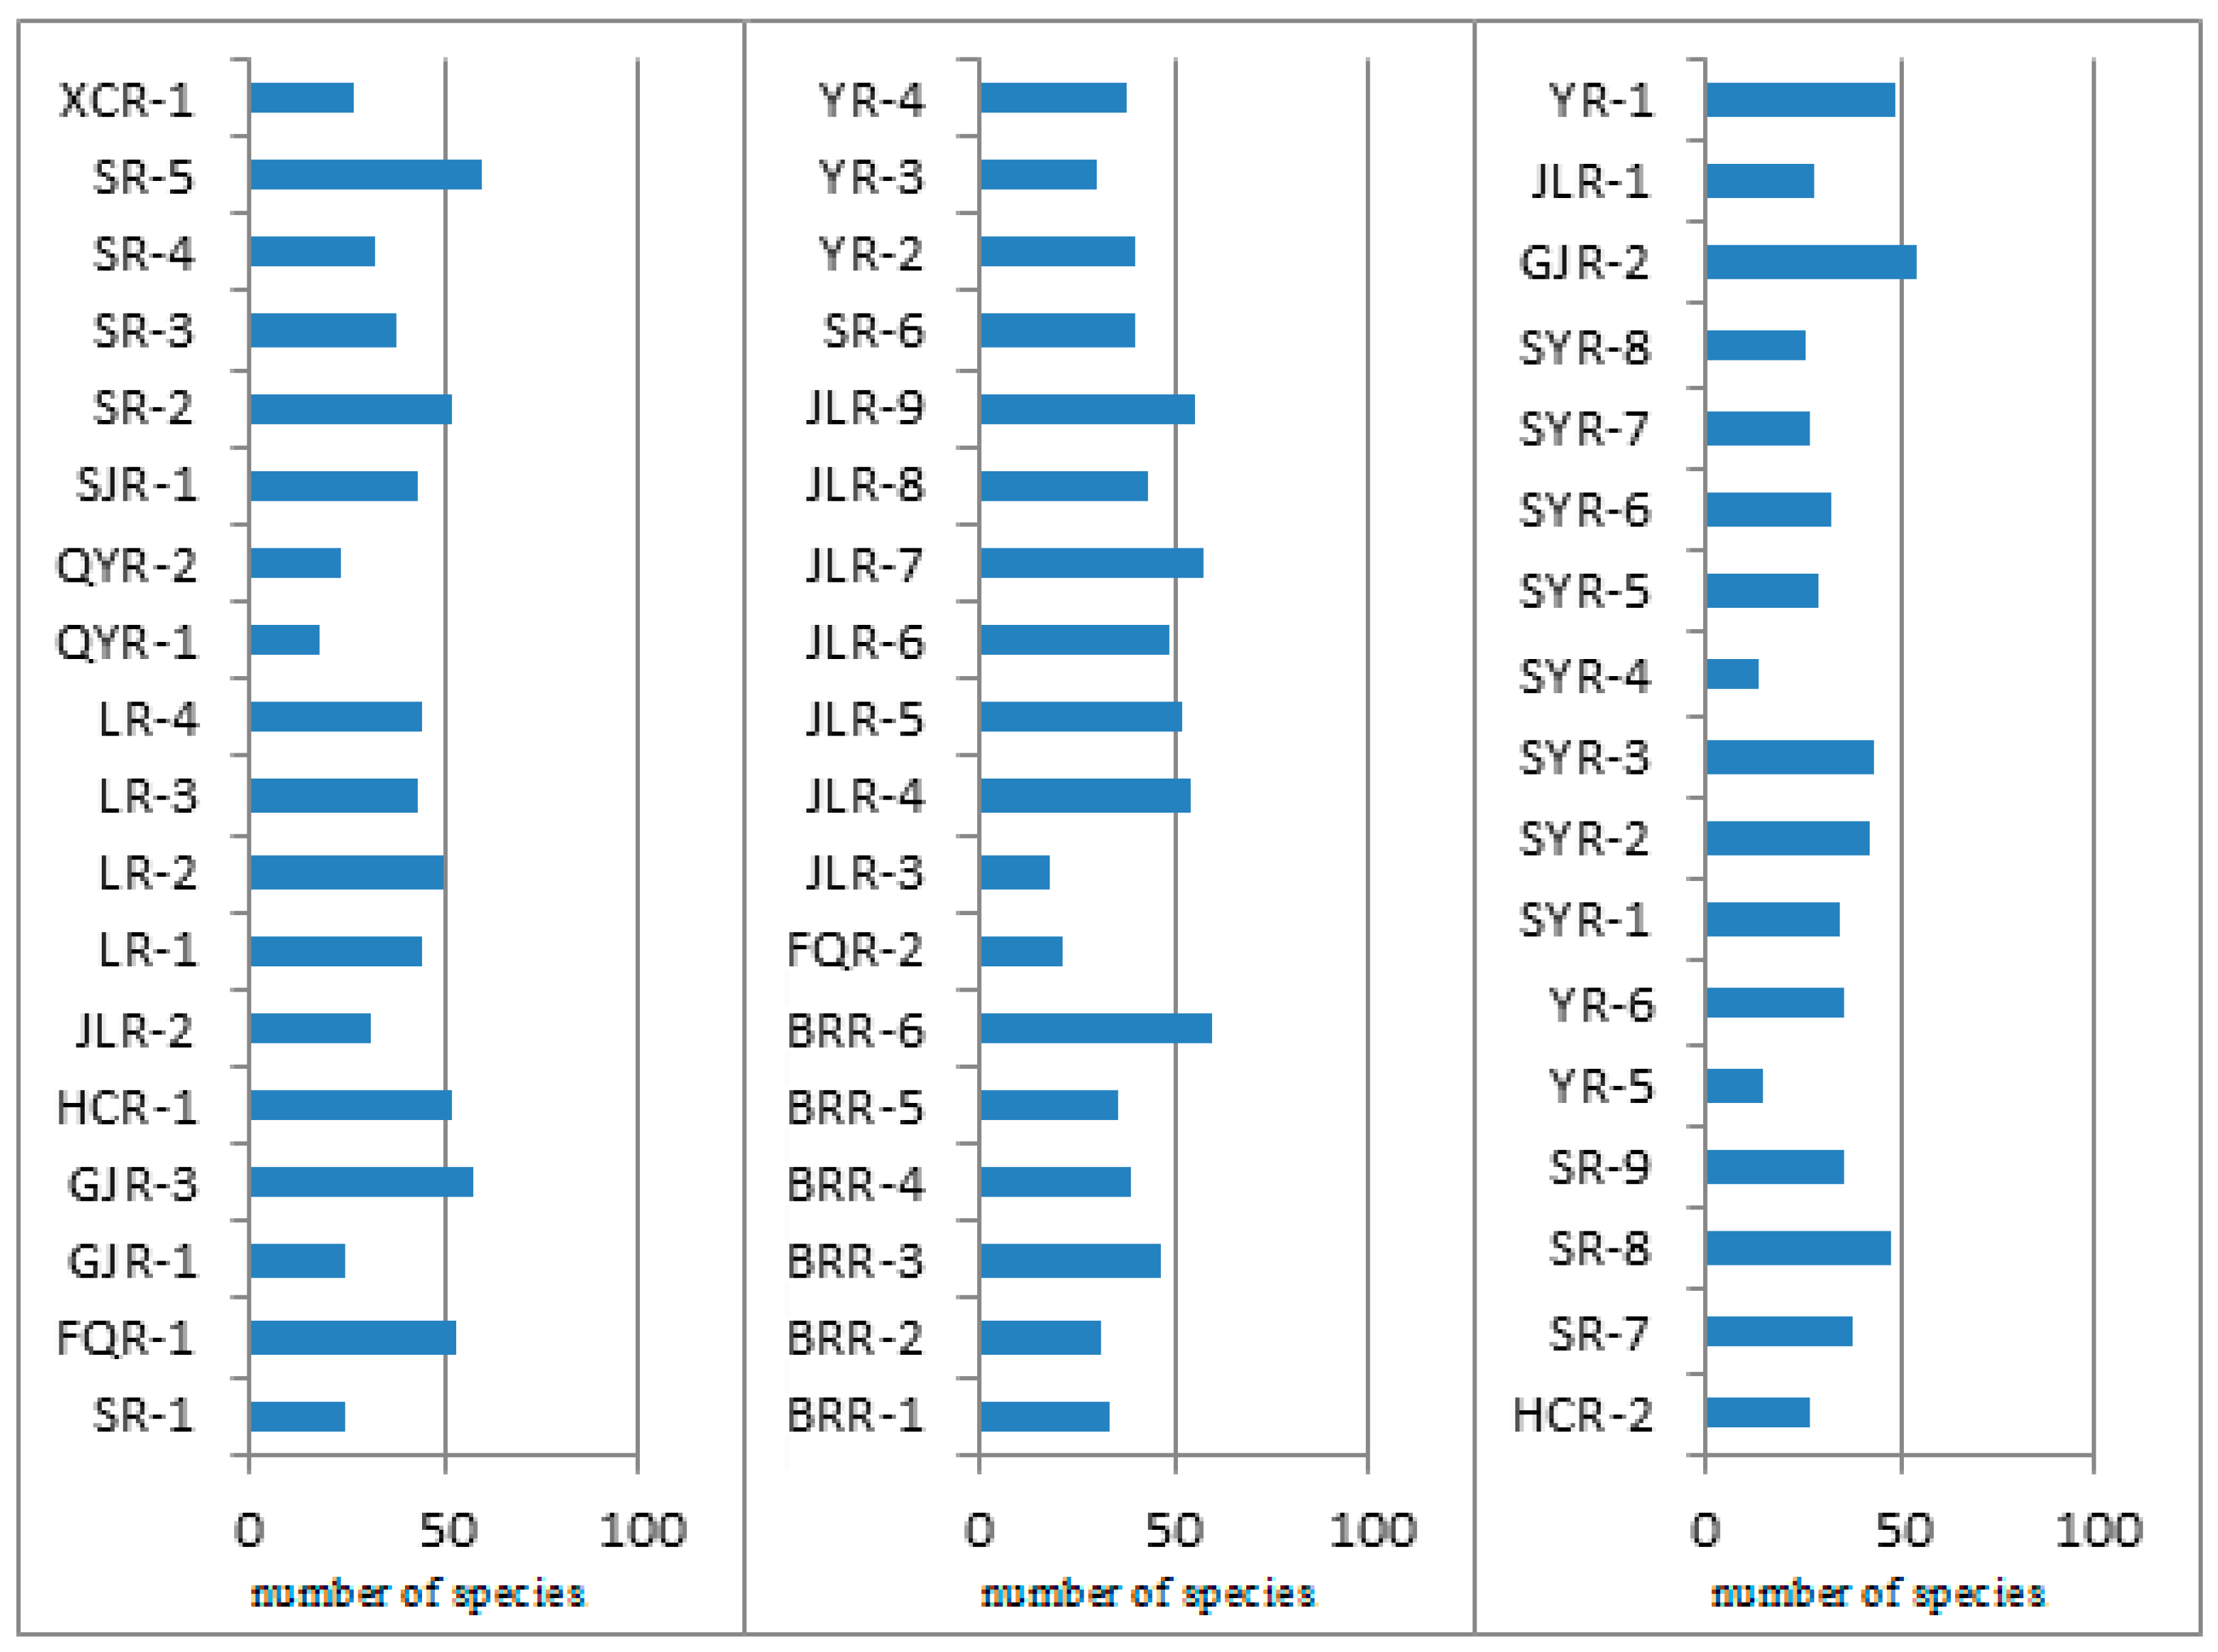
A total of 370 species and varieties of diatoms belonging to six orders and 56 genera were identified. In the investigation, Navicula, Nitzschia, Gomphonema and Achnanthidium were abundant, being represented by 71 (19.19%), 49 (13.24%), 46 (12.43%) and 37 (10.00%), species number in each genus of the total 370, respectively. The dominant species were Nitzschia inconspicua, Achnanthidium minutissimum, Navicula aitchelbee, Nitzschia palea, Cyclotella meneghiniana, Navicula submuralis and Mayamaea atomus. Among these, Achnanthidium minutissimum indicated the distribution of low nutrition water in the Ying River, while Nitzschia palea, Nitzschia inconspicua and Navicula aitchelbee were indicative of eutrophication status [37,38,39]. The species number of other genera was between 1 and 14 (0.27–3.78%). The composition of each sampling site ranged greatly from 14 to 60 species, with the richest appearing in both SR-5 and BRR-6 (60 species) and the fewest in SYR-4 (14 species; Figure 2).
3.2. Dominant Species of Benthic Diatoms and Their Distribution
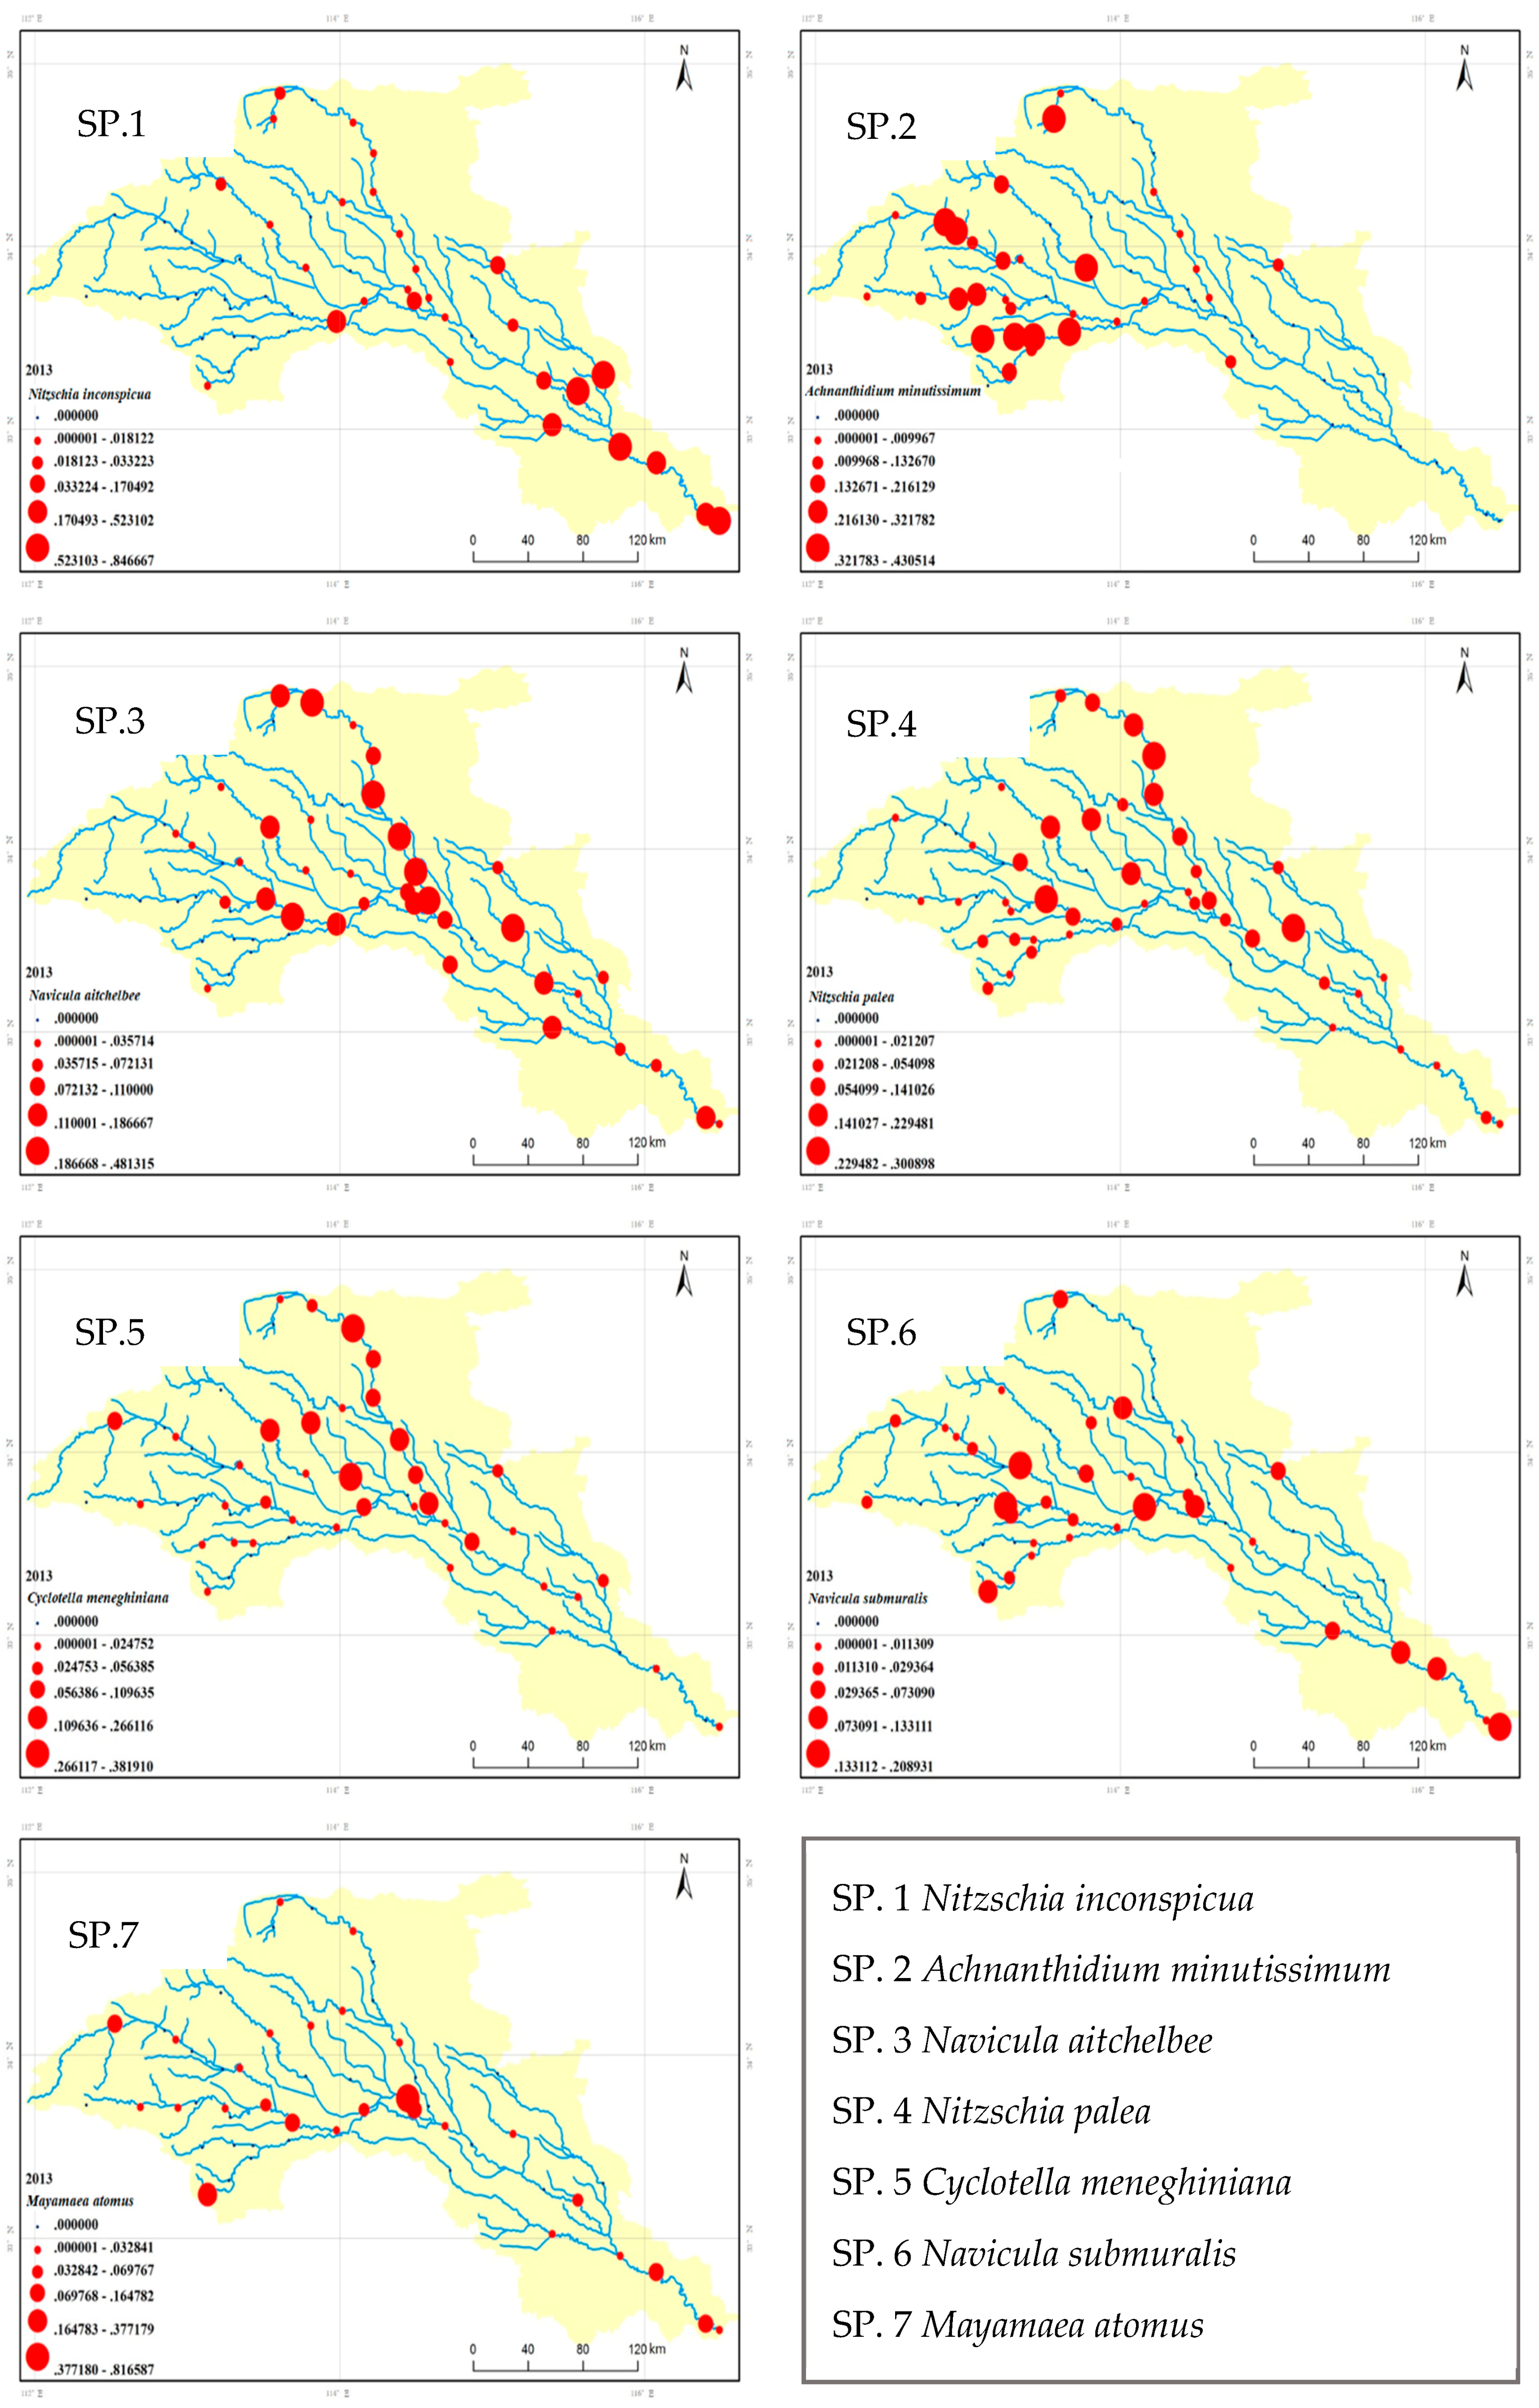
There were seven dominant species of benthic diatoms in the Ying River (Table 1), Nitzschia inconspicua, Achnanthidium minutissimum, Navicula aitchelbee and Nitzschia palea with a dominance of 0.05, followed by Cyclotella meneghiniana, Navicula submuralis and Mayamaea atomus.
As shown in Figure 3, Arcgis revealed that these species were distributed throughout the water system, but they differed among samples and regions. Specifically, Nitzschia inconspicua was dominant in the Shaying River, while Achnanthidium minutissimum dominated in the Sha River and its tributaries. Moreover, the sampling sites in which Navicula aitchelbee was dominant were scattered, being present mainly in the middle and lower reaches of the Sha River and throughout the Jialu River, as well as in some parts of the Shaying River. Nitzschia palea was relatively concentrated in the middle and upper reaches of the Ying River. Navicula aitchelbee and Cyclotella meneghiniana were basically the same, mainly dominating in the Jialu River and being scattered in other sampling sites. The locations in which Navicula submuralis was dominant were relatively dispersed and less, the same as Mayamaea atomus.
3.3. Distribution of Benthic Diatoms in Graded Rivers of the Ying River
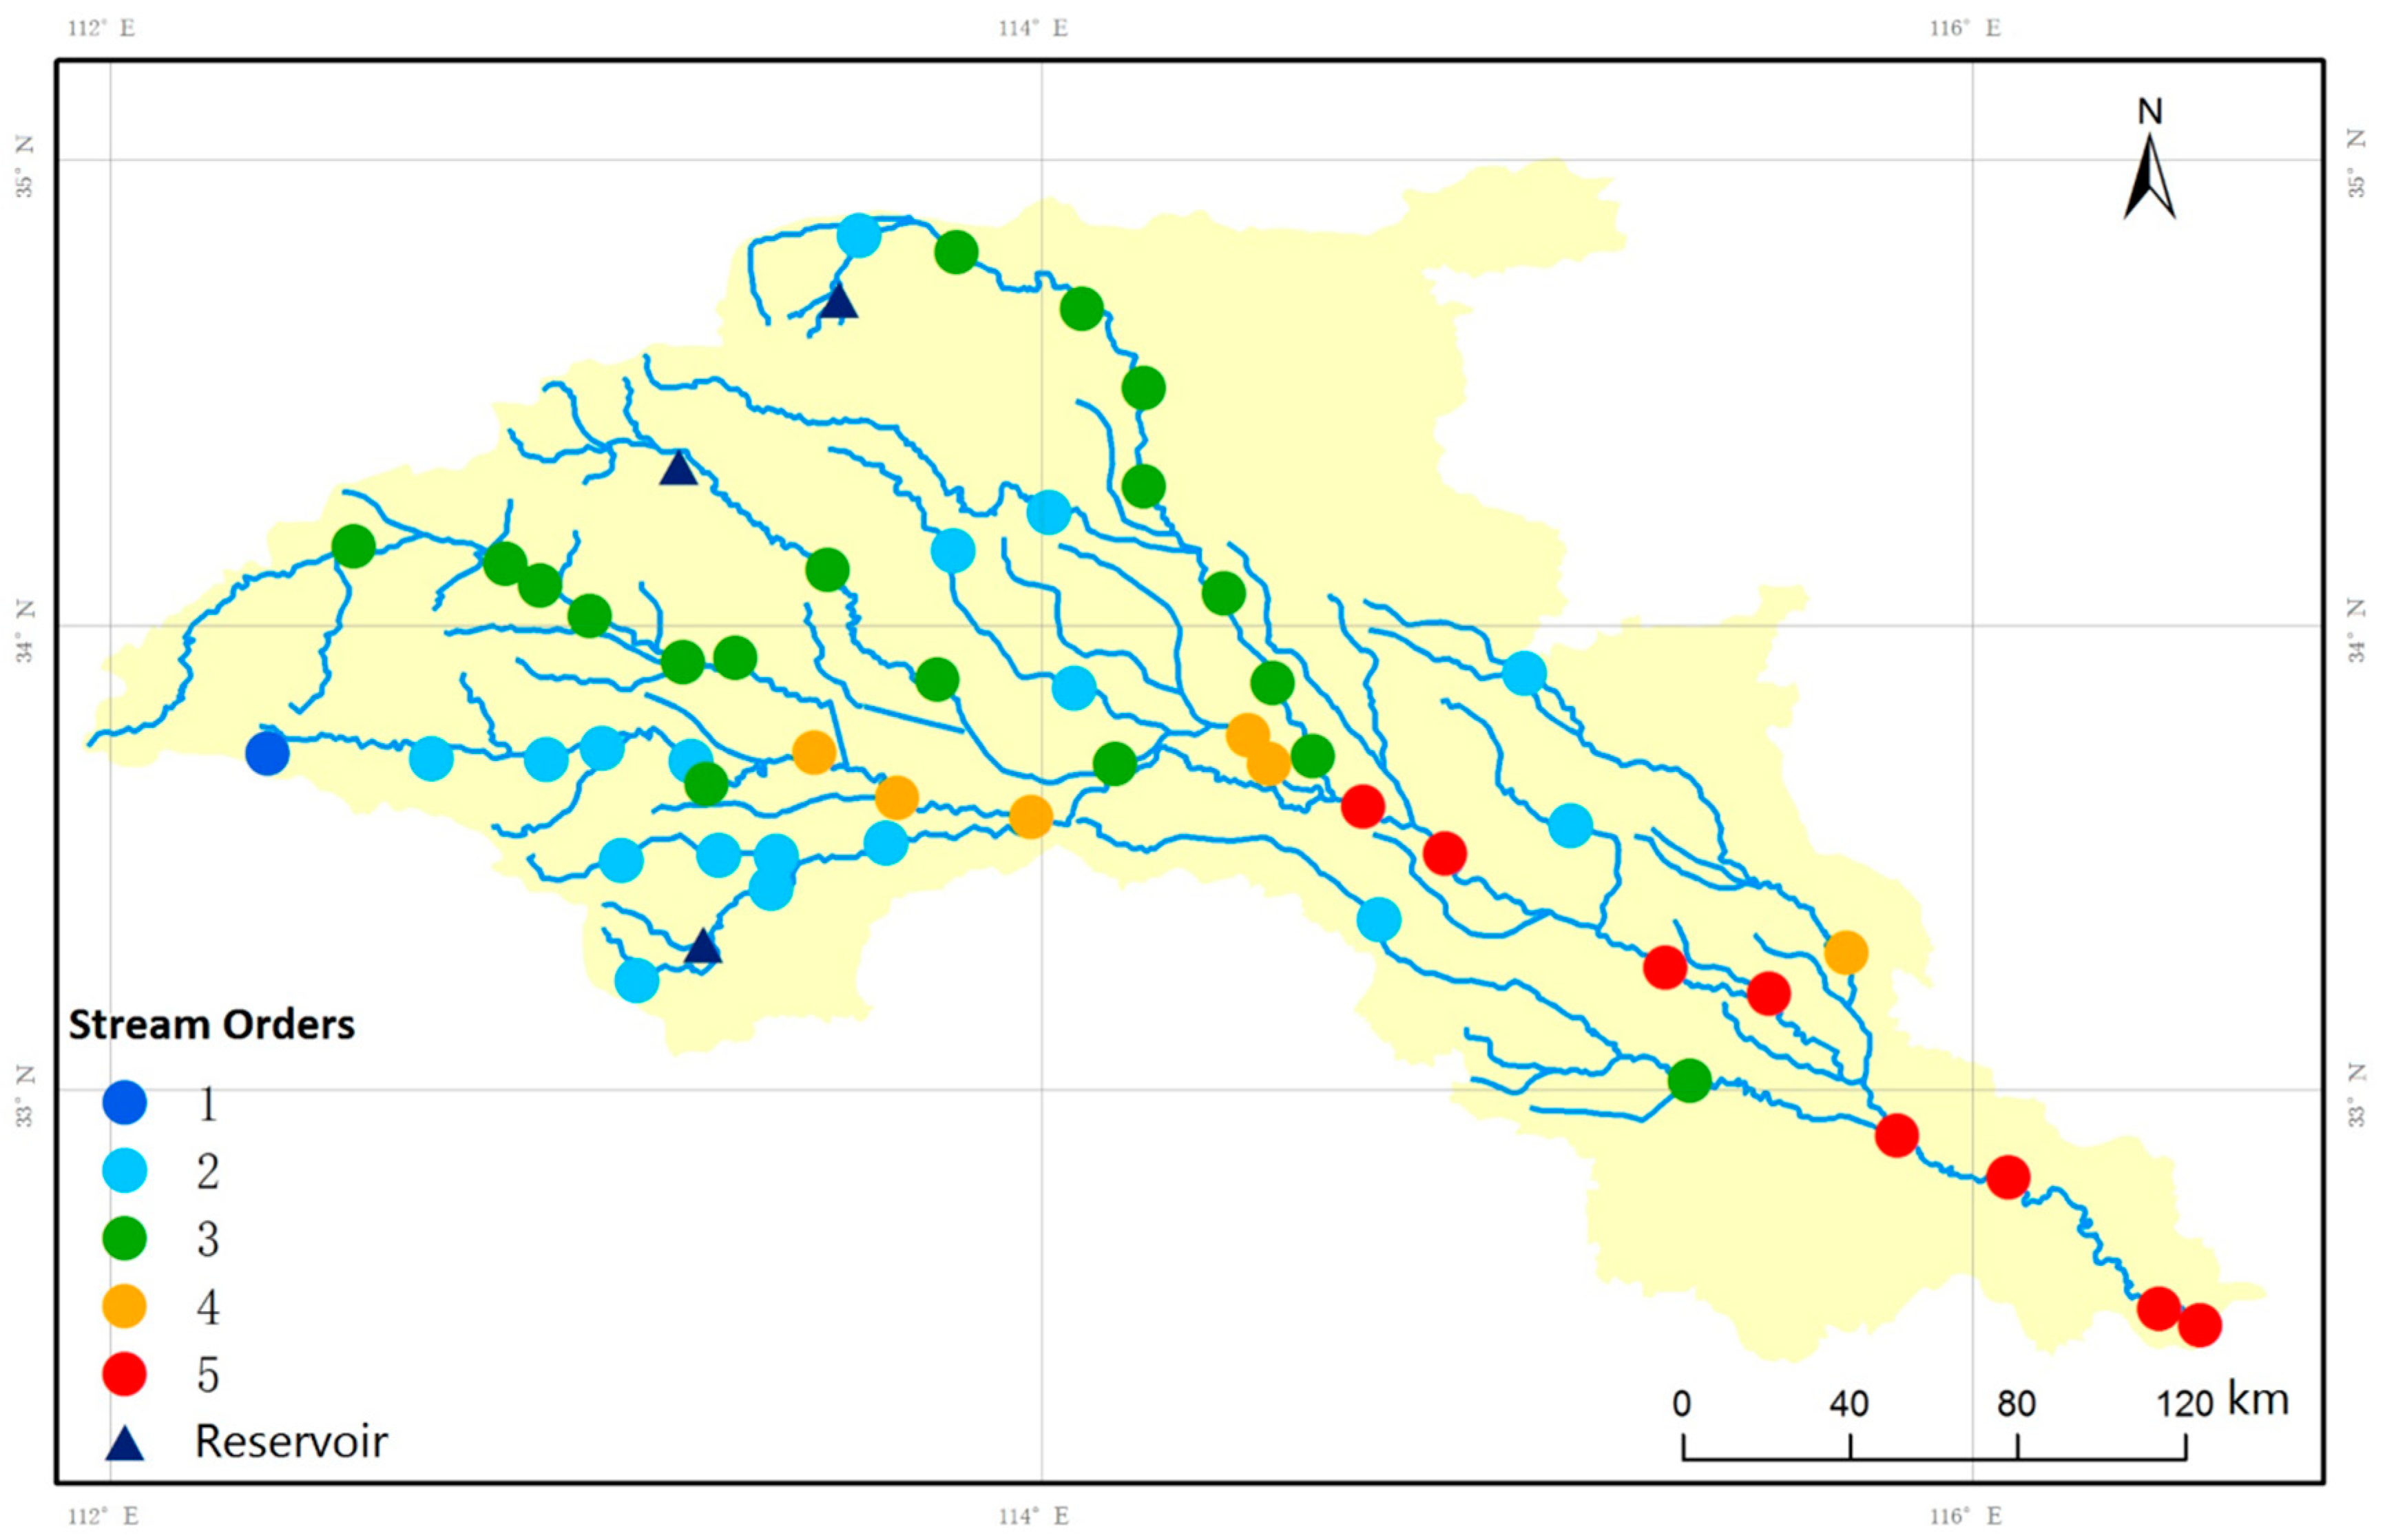
The methods of Horton, Strahler, Shreve and Scheidegger are commonly used for river classification [40]. In the present study, the Strahlar method was adopted to divide the Ying River into five orders [41]. This method helps determine what types of life might be present in a waterway and is essential to the River Continuum Concept, which is a model used to determine the number and types of organisms present in streams of a given size (Figure 4).
As shown in Figure 3 and Figure 4, Navicula submuralis (SP. 6) is relatively abundant in first order streams, while Achnanthidium minutissimum (SP. 2) is dominant in second order streams. Additionally, Navicula aitchelbee (SP. 3) is dominant in third order streams, while Nitzschia palea (SP. 4) and Cyclotella meneghiniana (SP. 5) are also present in high abundance. Finally, Mayamaea atomus (SP. 7) is dominant in fourth order streams and Nitzschia inconspicua (SP. 1) in fifth order streams.
Water velocity is an important environmental factor affecting the benthic diatom metacommunity structure [42] that plays a vital role in the distribution and diversity of diatoms in aquatic systems [43,44]. The dominance of Achnanthidium minutissimum (SP. 2) in second order streams indicates that water velocity plays a major role in dominance within a given period of time, with larger diatoms tending to be replaced by smaller diatoms in high velocity rivers. These findings are in accordance with the finding that Achnanthidium species were suitable for growth in flowing water [45] and exerted strong anti-interference to wave disturbance [46].
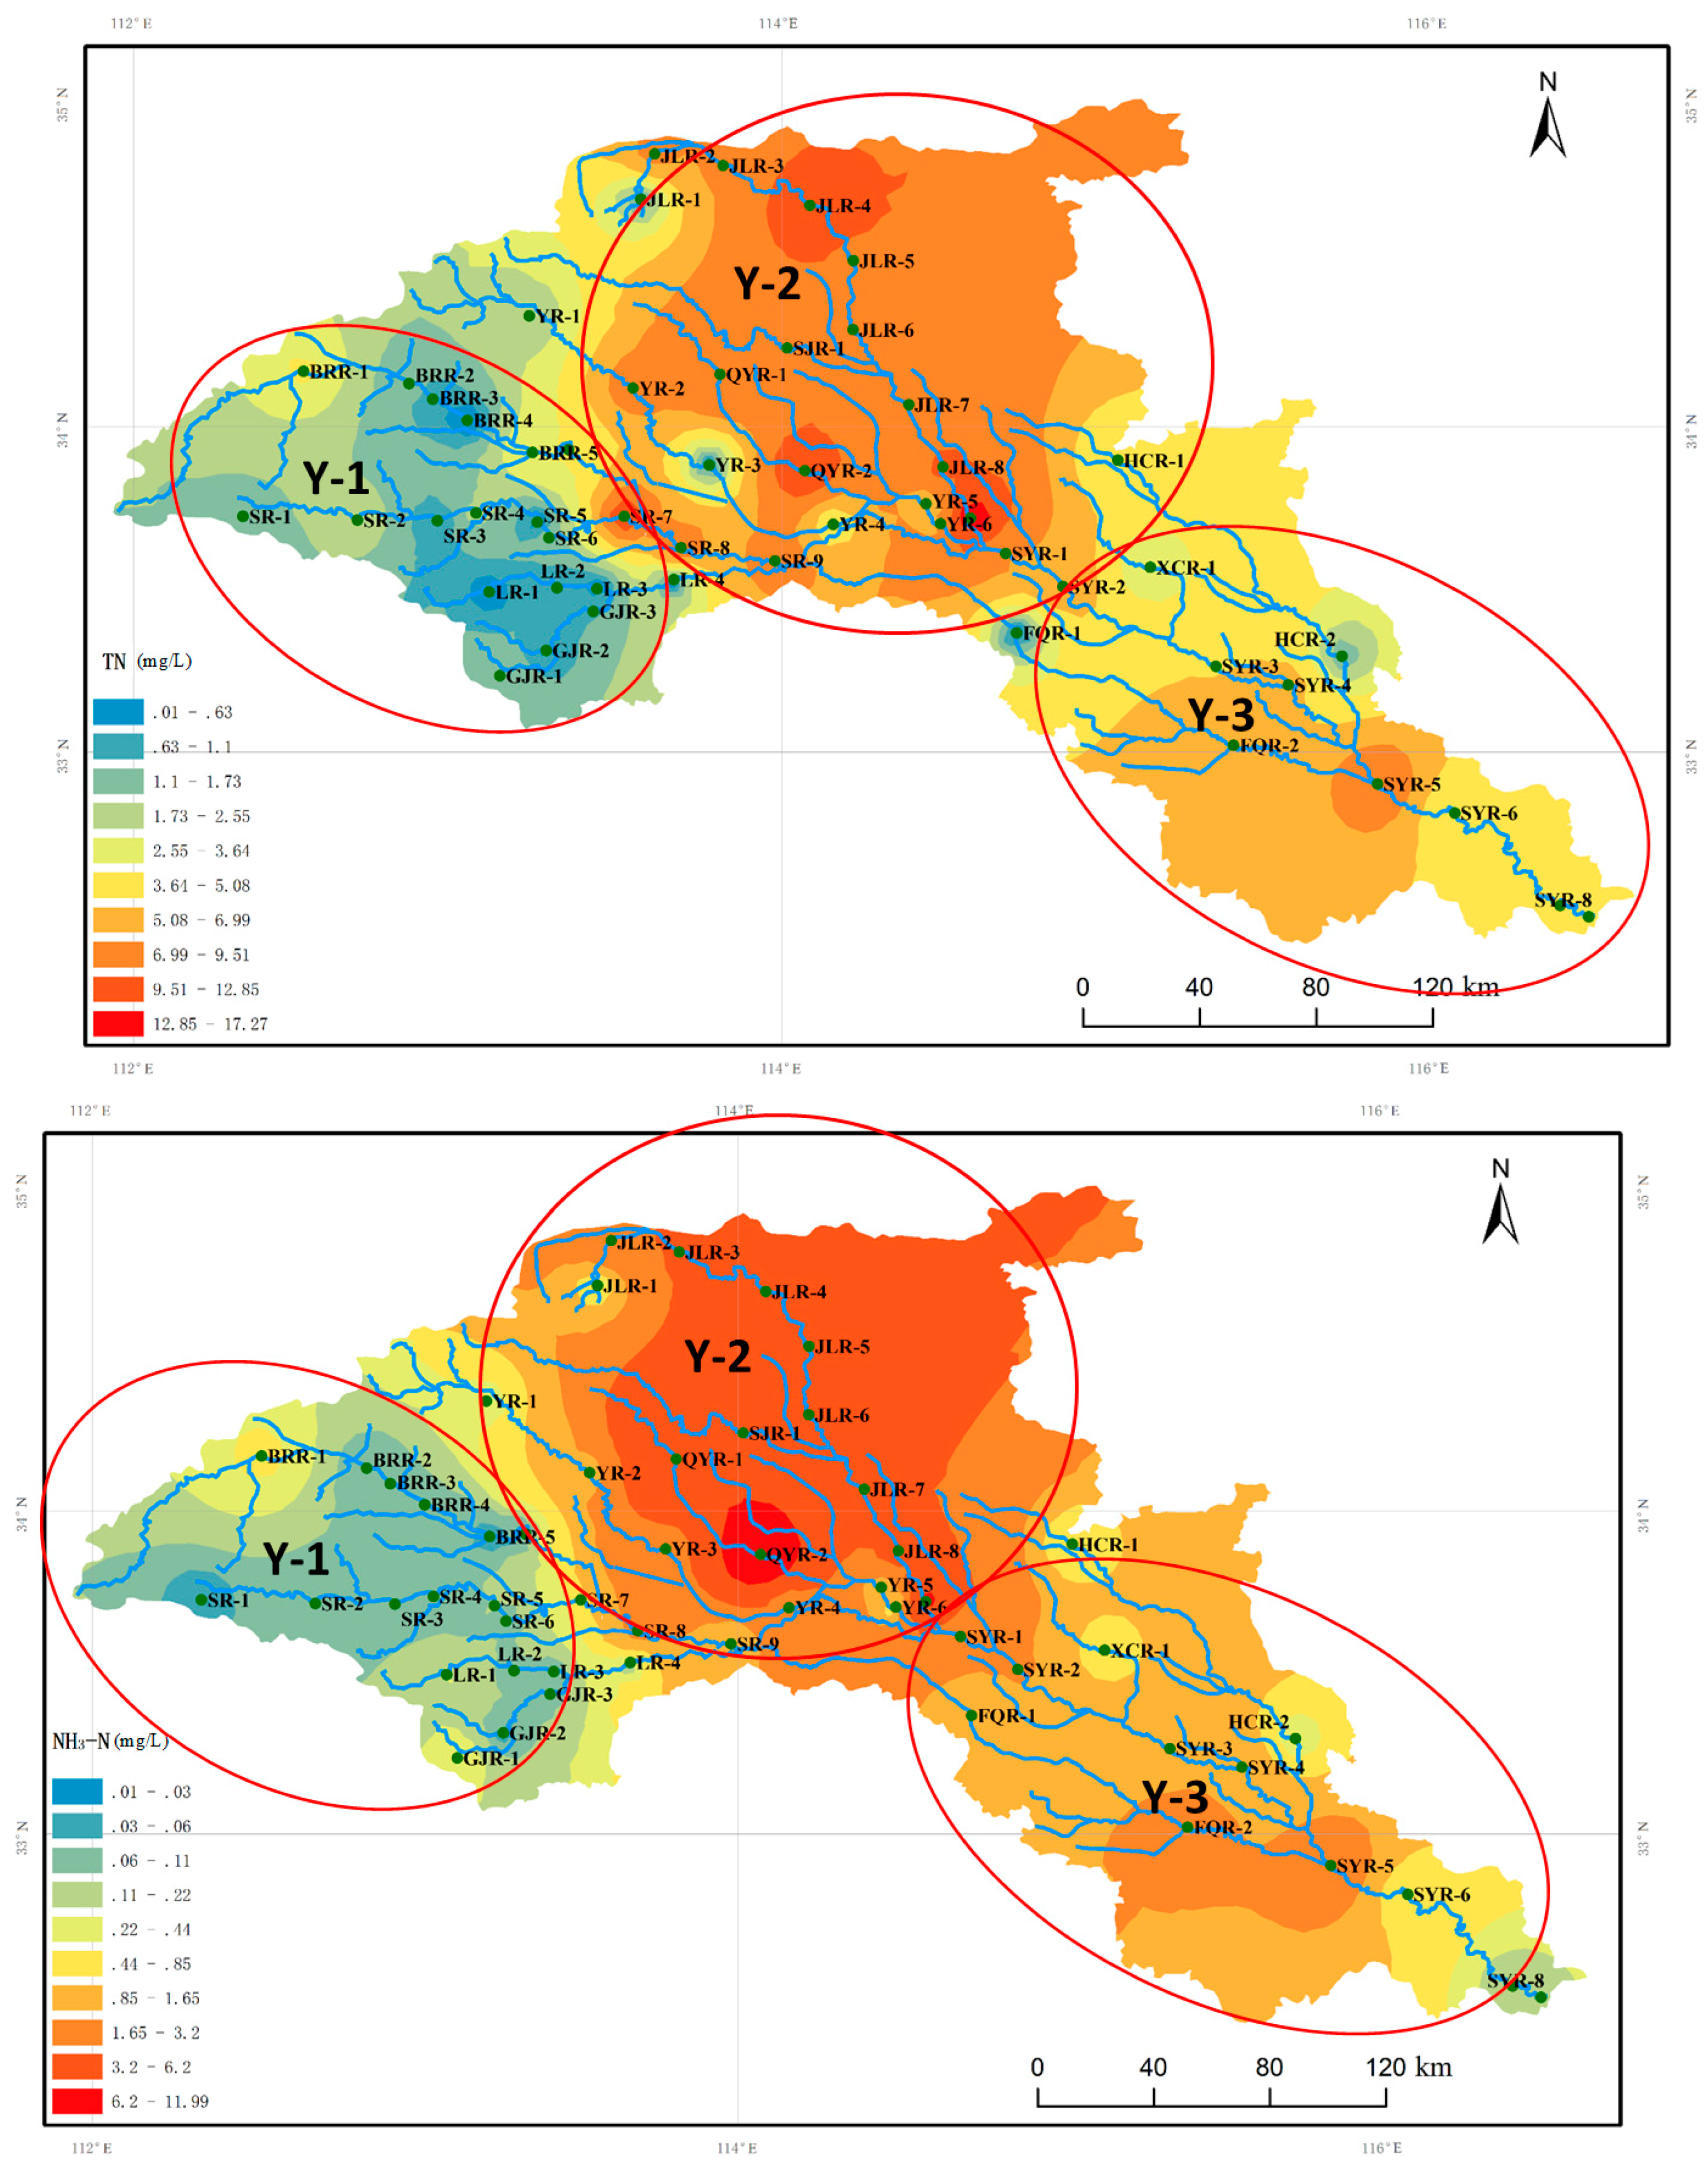
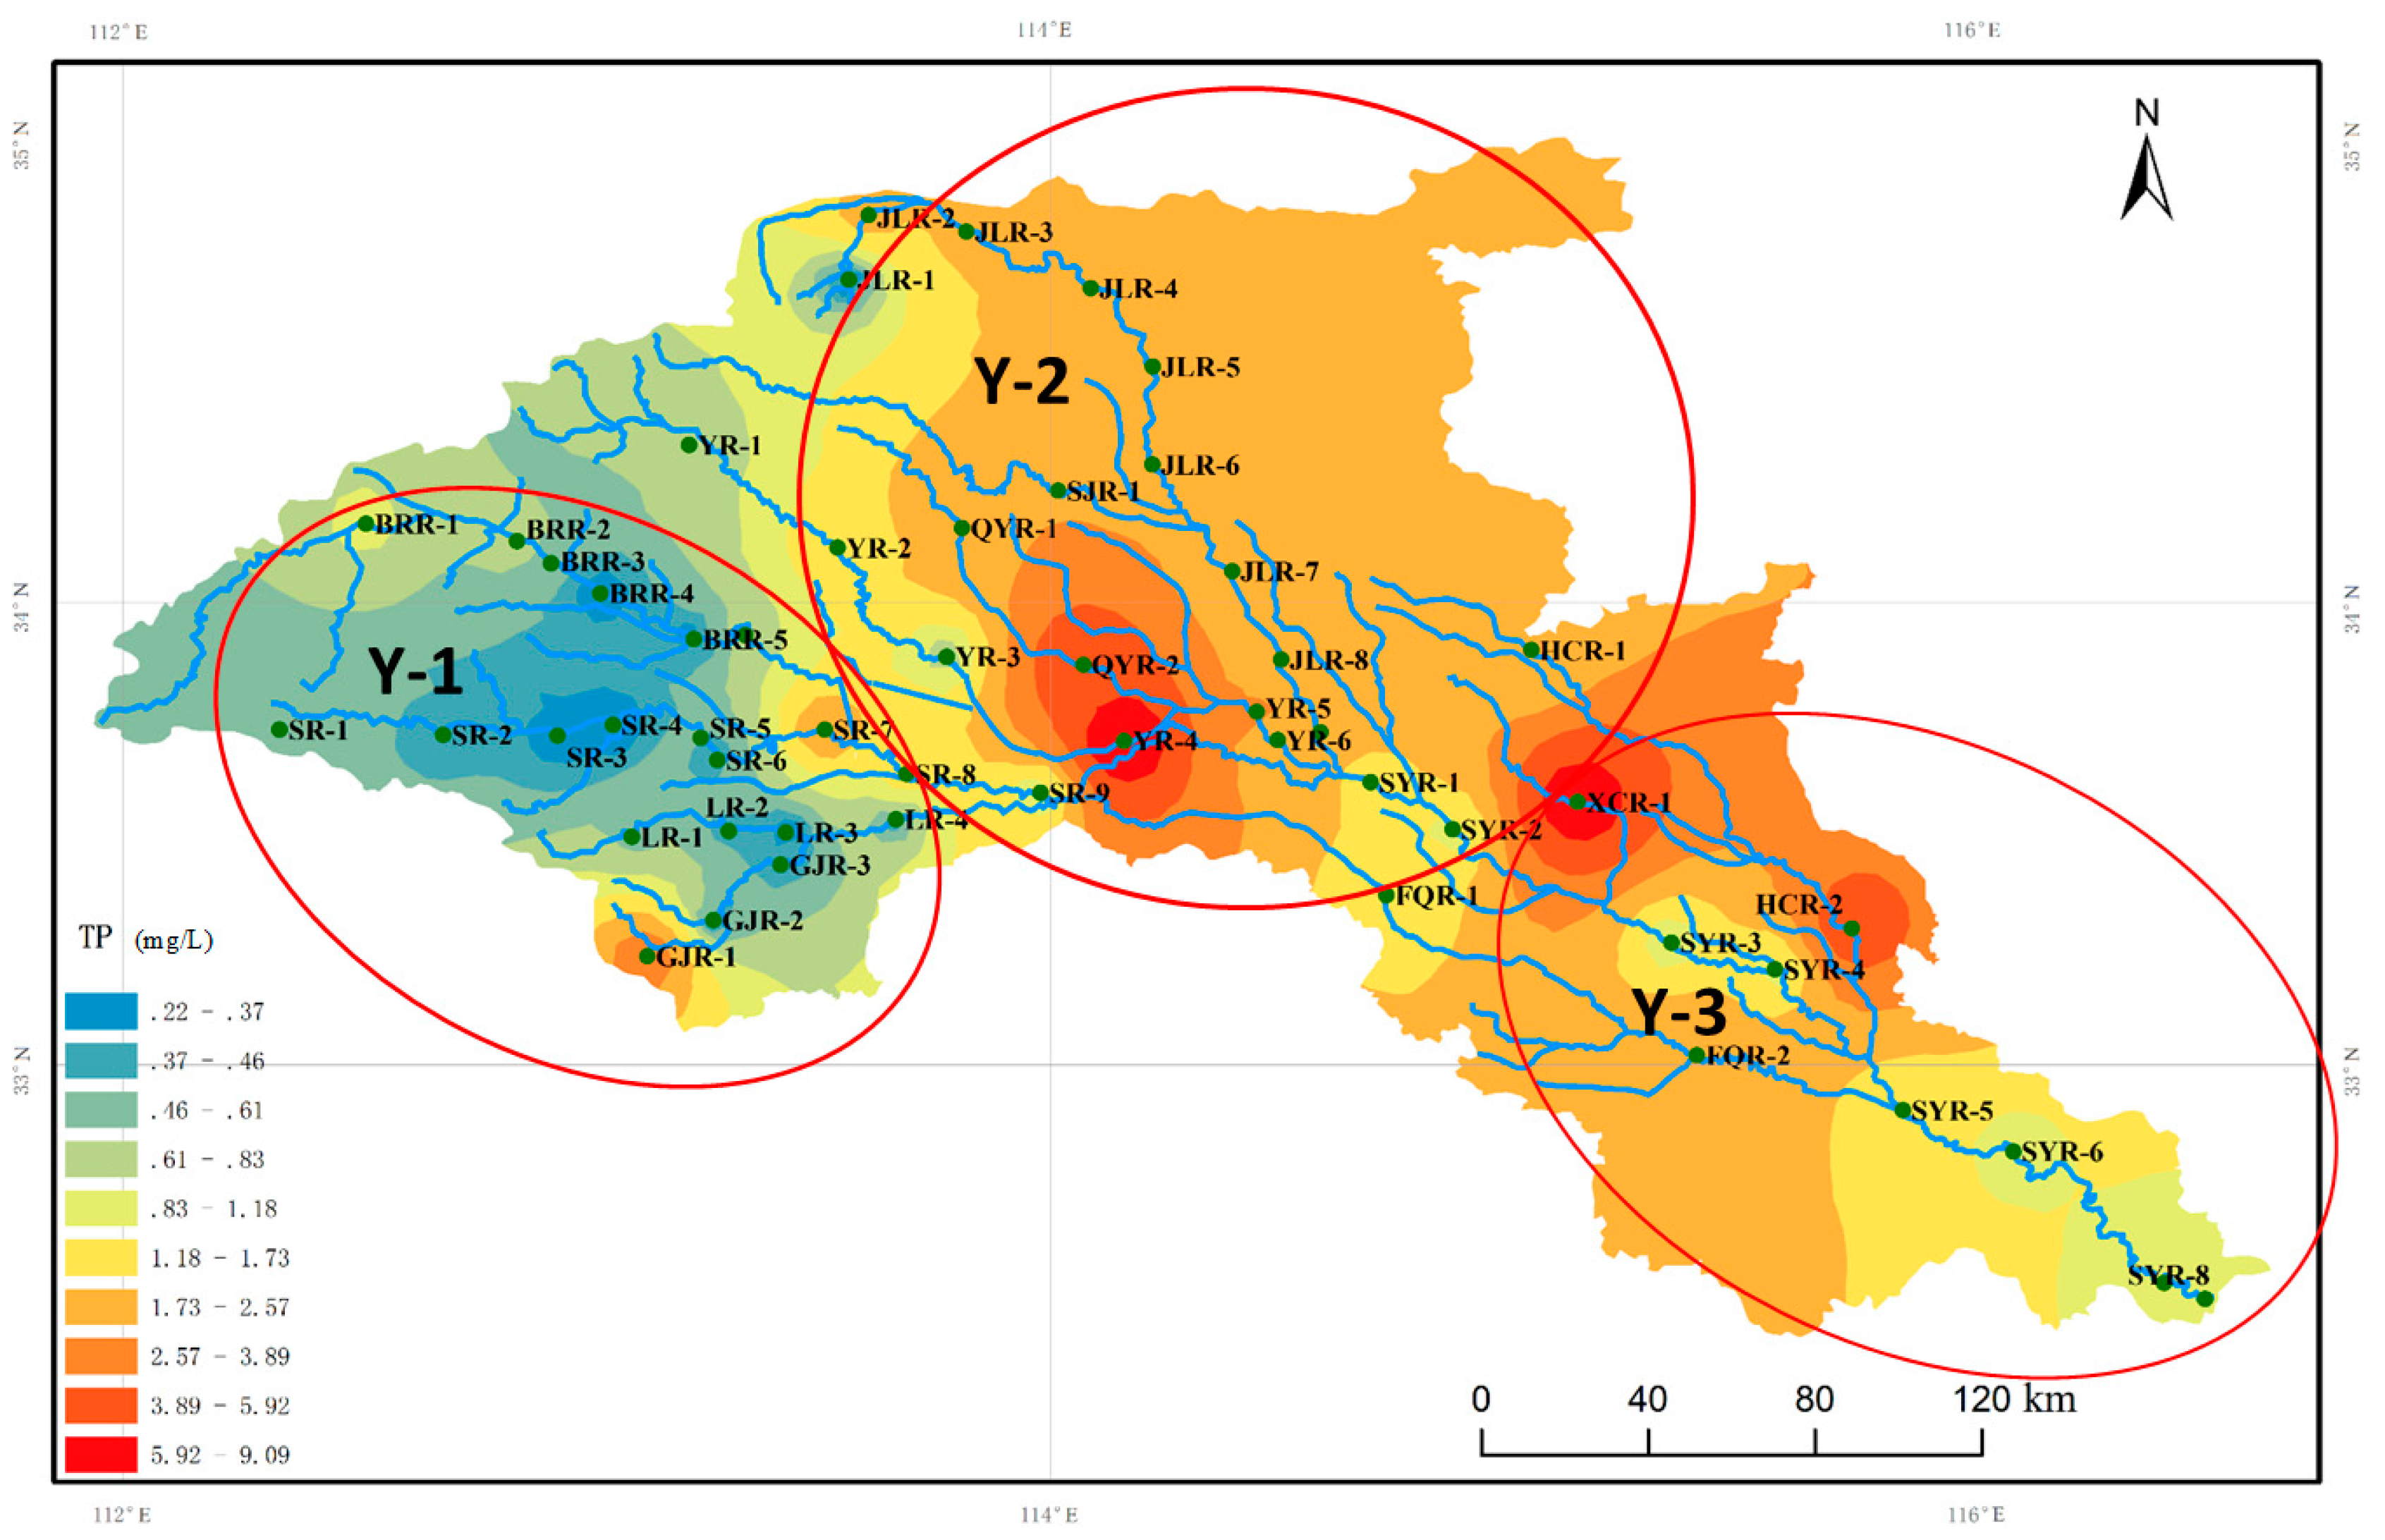
3.4. Distribution of Dominant Benthic Diatoms of the Ying River by Nutrients
Arcgis maps of total nitrogen, ammonia nitrogen and total phosphorus were made to visualize spatial differences (Figure 5). According to the distribution of nutrients of the Ying River, we divided it into three regions: Y-1, Shahe and its tributaries; Y-2, the upper reaches of Zhoukou and their tributaries as well as the Jialu River and its tributaries; Y-3, rivers below Zhoukou (also known as the Shaying River) and their tributaries. The nitrogen and phosphorus content in the regions was Y-2 > Y-3 > Y-1.
Most samples in the Y-1 and Y-2 districts were collected from second and third order streams, while the main sampling sites in the Y-3 region were in fifth order streams. Of the seven dominant species of benthic diatoms detected in Y-1 (Table 2), Achnanthidium minutissimum was present at levels much higher than others. Seven dominant species were detected in Y-2, with Navicula aitchelbee (Y = 0.11), Cyclotella meneghiniana (Y = 0.09), and Nitzschia palea (Y = 0.09) being present in the greatest dominance. In Y-3, there were five dominant species, of which Nitzschia inconspicua was the highest (Y = 0.31) and was present at much higher levels than the other species.
Nutrients in water comprise a key factor influencing diatom activity and growth rate, and the community structure of diatoms changes with variations in nutrients [47,48]. As shown in the nutrient maps (Figure 5), Achnanthidium minutissimum could grow in low nutrient environments, while Navicula aitchelbee, Cyclotella meneghiniana, and Nitzschia palea occurred in similar nutrient environments and Nitzschia inconspicua were adapted to high nutrient environments.
These results probably occurred because the second and third order streams flow through the village, causing more serious eutrophication than others. Moreover, competition between benthic diatoms is small, and it is difficult to form a single dominant species. The fourth and fifth order streams are mostly river habitats, and the flow is relatively static with high turbidity, which makes the exchange of nutrients slower and results in certain restrictions on the uptake of nutrients by algae.
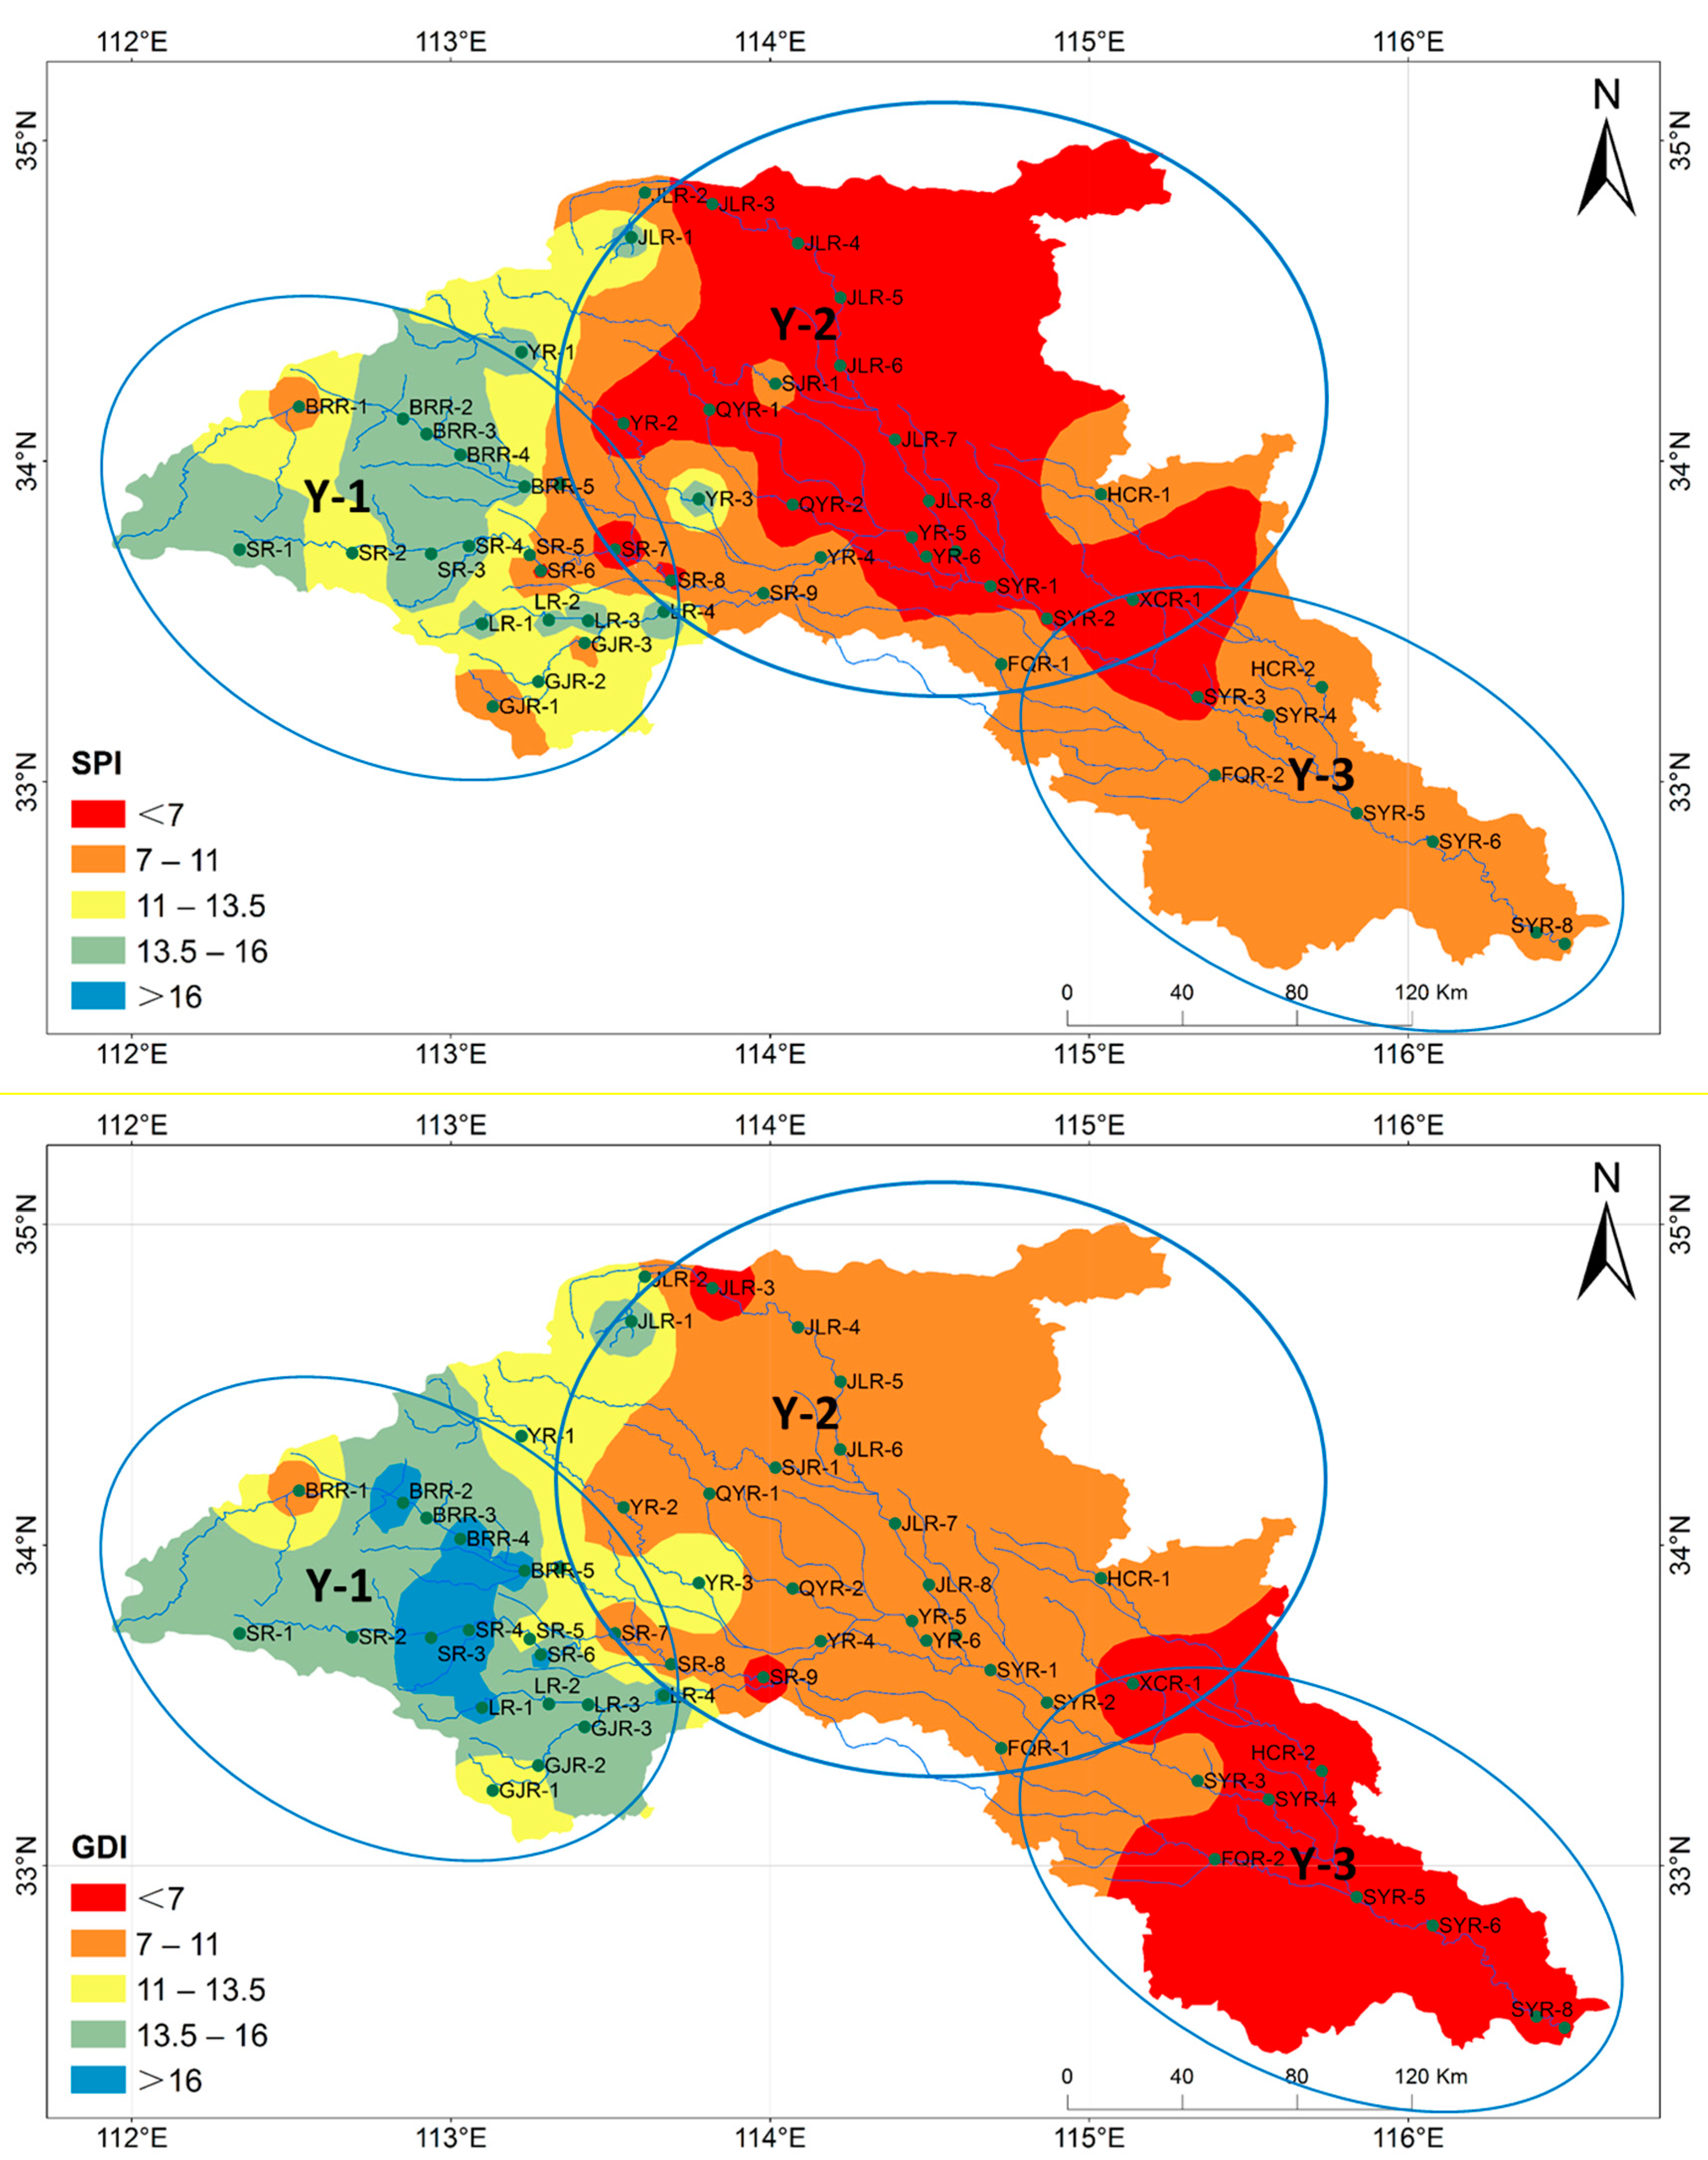
3.5. Distribution of Dominant Benthic Diatoms of the Ying River by Diatom Indices
The Arcgis maps of diatom index SPI and GDI were also made to identify spatial differences (Figure 6). Based on the distribution of index values of the Ying River (Table 3), we divided the SPI into three regions: Y-1, Y-2 and Y-3, in which the eutrophication degree was Y-2 > Y-3 > Y-1, which was approximately the same as the nutrients distribution. Additionally, the GDI was divided into three regions with the eutrophication degree as Y-3 > Y-2 > Y-1.
Diatoms are recognized as powerful bioindicators of freshwater quality and various diatom indices are routinely used in European countries to monitor water quality in waterways. However, their use as indices is rare in China. We verified the indicative function of SPI and GDI for water quality to provide a basis for future studies. The results from the Arcgis (Figure 5 and Figure 6) indicate that the SPI distribution is approximately the same as the nutrients distribution in the Ying River.
Diatoms include a great diversity of taxa, and researchers have been investigating simple and effective methods for their detection [49]. In our study, 370 species and varieties of diatoms were identified. Although it is costly and time-consuming, the SPI is more precise because it necessitates species-level identification. Because the GDI is based on the genus level, its results are not suitable for some investigations [26].
3.6. Correlation between Benthic Diatoms and Environmental Parameters in the Ying River
3.6.1. Physicochemical Parameters of the Ying River
Physicochemical parameters of the Ying River measured in this survey were flow rate (Velocity), WT, Cond, Sal, pH, Turb, TSS (Total Suspended Solid), SD, COD, TN, TP, ammonia nitrogen (NH3-N), and the TN/TP index. The measured values are shown in Table 4.
The physicochemical parameters of the Ying River changed greatly. Several physical and chemical factors were also especially high, such as Turb, COD, and NH3-N. Therefore, the ecological status of the Ying River was diverse.
3.6.2. Pearson’s Correlation Analysis
Pearson’s correlation analysis was conducted to analyze the correlation between the environmental parameters with dominant benthic diatoms and the diatom indices (SPI, GDI) (Table 5).
The results showed that there was a significant negative correlation between Nitzschia inconspicua and Velocity, while there was a significant positive correlation with Sal. Achnanthidium minutissimum and Cond, Sal, TN, and TP showed a significant negative correlation, a significant negative correlation with NH3-N and TN/TP, and a significant positive correlation with pH and WT. There was a significant positive correlation between Navicula aitchelbee and Velocity, Cond, Sal, Turb, TSS, and TN, as well as a significant positive correlation with NH3-N and TN/TP and a significant negative correlation with WT. Moreover, a significant positive correlation between Nitzschia palea and Cond, Sal, TN, TP, and NH3-N was observed, as was a significant positive correlation with Velocity, Turb, and TSS and a significant negative correlation with WT. There was a significant positive correlation between Cyclotella meneghiniana and Cond, Sal, TN, NH3-N, as well as a significant positive correlation with Velocity and TP, while there was a significant negative correlation with WT. In addition, Navicula submuralis and Mayamaea atomus showed no significant correlation with these factors.
Both SPI and GDI showed a significant negative correlation with Cond, Sal, Turb, TSS, TN and TP. Furthermore, there was a significant negative correlation between SPI and NH3-N (P < 0.01), while GDI showed a significant negative correlation with this factor (P < 0.05). Additionally, SPI showed a significant positive correlation with WT (P < 0.01), while GDI was positively significant correlated with WT (P < 0.05). Finally pH and TN/TP showed a significant positive correlation and a significant negative correlation, respectively, with SPI, while GDI showed no significant relationship with these factors. These findings confirm that the SPI was more sensitive and suitable for assessment of water quality in the Ying River than the GDI.
Pearson’s correlation analysis indicated that there was a significant correlation between Cond, Sal, WT, TN, TP, and NH3-N and several dominant species and diatom indices. Specifically, there was a significant positive correlation between Navicula aitchelbee, Nitzschia palea, and Cyclotella meneghiniana with Velocity, Cond, Sal, TN, and NH3-N, while WT showed a significant negative correlation with them. These findings indicated that the three species underwent the same environmental selection to form a competitive relationship. Conversely, Achnanthidium minutissimum was significantly negatively correlated with Cond, Sal, TN, TP NH3-N, and TN/TP, but positively correlated with pH and WT.
3.6.3. Canonical Correspondence Analysis (CCA) of Benthic Diatoms with Environmental Factors at Various Orders of Rivers
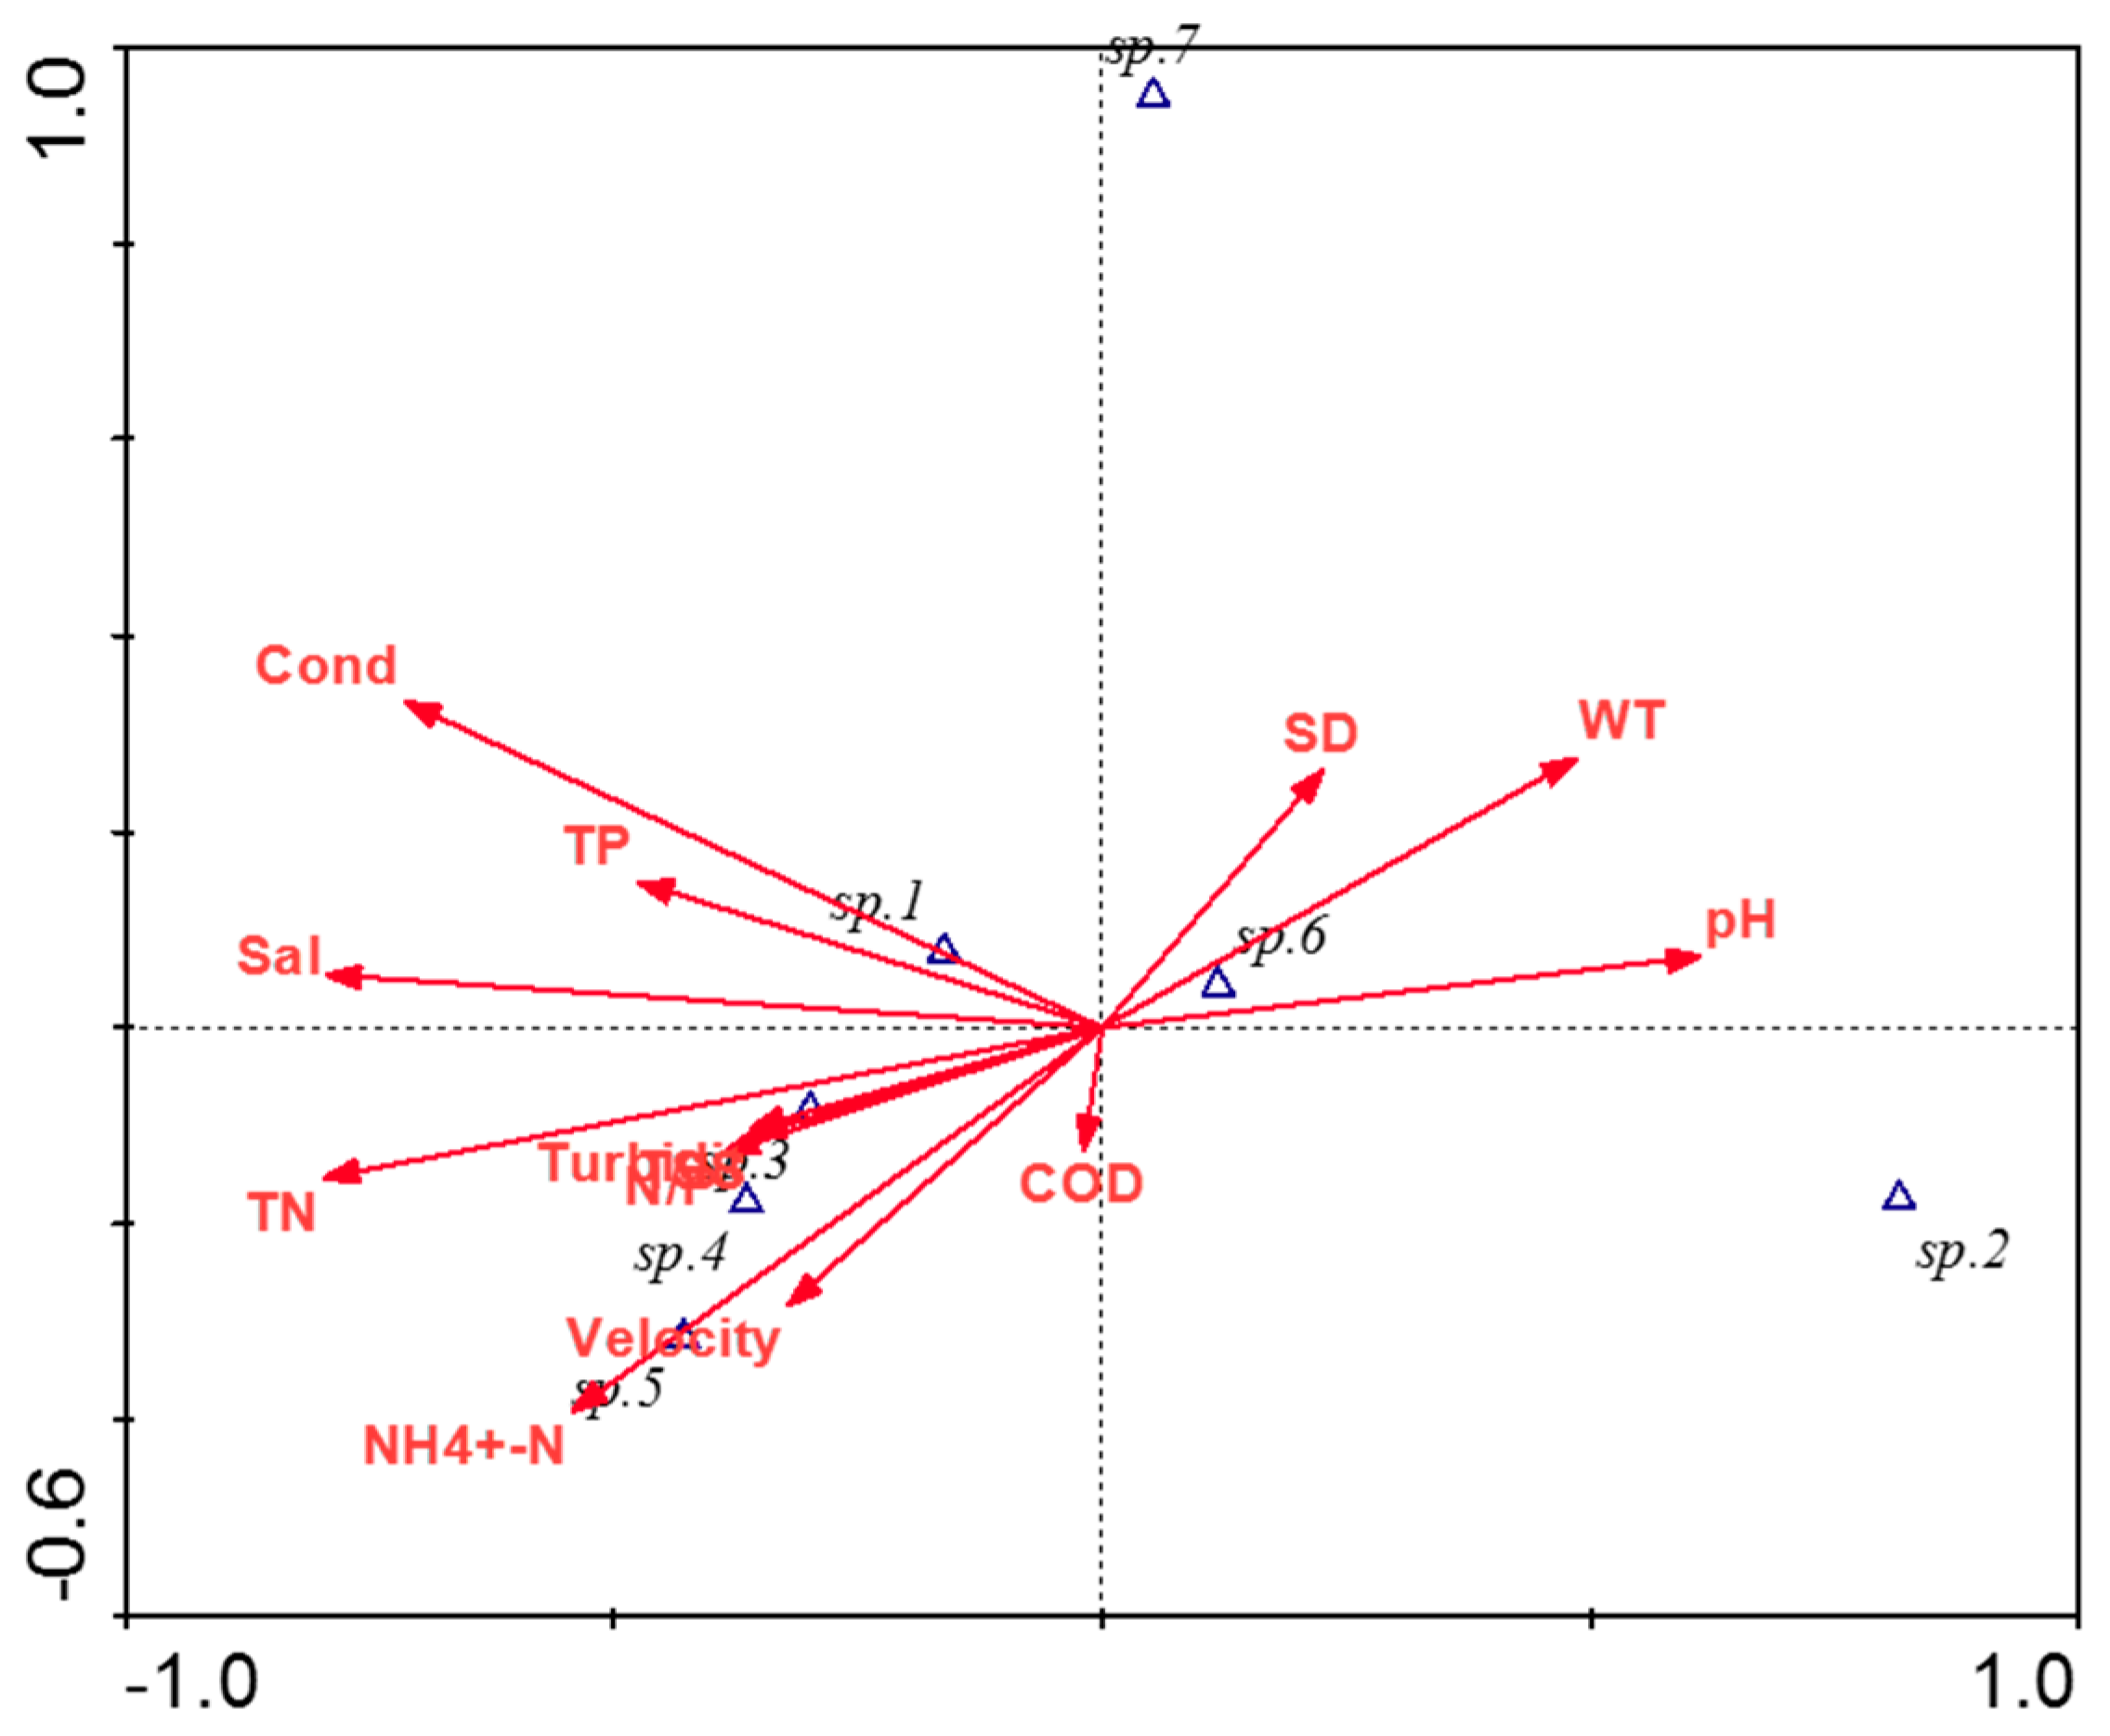
Canonical correspondence analysis (CCA) is designed to analyze the relationship between plants and influencing factors [50,51]. A two-dimensional ordination map was generated using the dominant species of diatom and their influencing factors in the Ying River (Figure 7). In the CCA ordination diagram, each division factor was represented by arrows. Arrows at the quadrant show the positive and negative relationship between environmental factors and axes, with the length of the arrow and the size of the plots representing the correlation factor. In these charts, a longer line is associated with greater correlation, and vice versa. The angle between the line and the sorting axis indicates that the size of the function partitioning factor is related to the sorting axis, with a smaller angle indicating a greater correlation.
As shown in Figure 7, the distribution of dominant benthic diatom species was influenced by environmental factors such as Cond, Sal, TN, NH3-N, pH, and WT. The pH value was the largest positive correlation with the first sort axis, and the Sal was the largest negative correlation with the first sort axis, followed by TN and Cond. The length of arrows in the figure revealed that Cond, Sal, TN, NH3-N and pH value were the main environmental factors affecting the distribution of benthic diatoms in the Ying River. In addition, the arrow length of COD was shortest, indicating there was little relationship between species and COD.
The first quadrant contained SP. 6 (Navicula submuralis) and SP. 7 (Mayamaea atomus). SP. 6 was largely affected by low conductivity, nutrient and salinity. The position of SP.7 indicated it had a special selection for the environment, which needed further data validation. The species in the second quadrant, SP. 1 (Nitzschia inconspicua), was influenced by high conductivity, salinity and nutrients. Species located in the third quadrant included SP. 3 (Navicula aitchelbee), SP. 4 (Nitzschia palea) and SP. 5 (Cyclotella meneghiniana), which had the similar environmental selection and easily co-existed in high nutrient, high nitrogen phosphorus ratio, high turbidity and high velocity water. These findings were concordant with those shown in Figure 5. However, more data is necessary to identify the influence factors of SP.2 (Achnanthidium, minutissimum), located in the fourth quadrant.
4. Conclusions
The indication of the five dominant species was clear, and the following two were particularly obvious. Nitzschia inconspicua, which was the absolute dominant species in region Y-3, lived in polluted water and was found to be negatively correlated with Velocity and positively correlated with Sal; accordingly, it is an indicator species for high concentrations of total phosphorus pollution. Achnanthidium minutissimum was the absolute dominant species in region Y-1. This species prefers clean water and was significantly negatively correlated with Cond, Sal, TN, TP NH3-N, and TN/TP, while it was positively correlated with pH and WT. This organism is a low-nutrition indicator that has a strong anti-interference to wave disturbance [46]. Navicula aitchelbee, Nitzschia palea and Cyclotella meneghiniana are positively correlated with Velocity, Cond, Sal, TN and NH3-N and negatively correlated with WT. These three species are eutrophic indicators found in the same environment.
The river classification was closely related to the status of nutrients and the distribution of dominant species. The fifth order rivers in the Y-3 region are mostly great river habitats with slow flow, high salinity, high turbidity and heavy nutrients. The first and second order rivers in the Y-1 region are habitats with fast flow, low turbidity and low nutrients. The second and third order rivers, which are all in the Y-2 region, consisted of high nutrition and low water temperature habitats. The second and third order rivers flow through the village; therefore, nutrition is more abundant in these rivers than the first, fourth and fifth order rivers. The competition between benthic diatoms is relatively small, and it is difficult to form a single dominant species; however, several species were co-dominant.
The results of this study support the use of diatom indices, especially the SPI, to monitor rivers such as the Ying River in China. Although it is complex, the SPI is more precise because it necessitates species-level identification. Conversely, the GDI provides genus level results and therefore is not suitable for the Ying River.
Author Contributions
Q.W. conceived, designed and administrated the project; H.R. contributed in investigation and data collection; Q.Y. and W.P. prepared the data; P.Y. was responsible for formal analysis; R.S. analyzed the data and wrote the paper.
Funding
This project is funded by Major Science & Technology Pro-gram for Water Pollution Control and Management of China (2012ZX07501002-003).
Acknowledgments
This project is funded by Major Science & Technology Pro-gram for Water Pollution Control and Management of China (2012ZX07501002-003). We would like to thank Yangdong Pan for his thoughtful suggestions.
Conflicts of Interest
The authors declare no conflict of interest.
References
- Mccormick, P.V.; Cairns, J. Algae as indicators of environmental change. J. Appl. Phycol. 1994, 6, 509–526. [Google Scholar] [CrossRef]
- Winter, J.G.; Duthie, H.C. Epilithic diatoms as indicators of stream total N and total P concentration. J. N. Am. Benthol. Soc. 2000, 19, 32–49. [Google Scholar] [CrossRef]
- Potapova, M.; Charles, D.F. Diatom metrics for monitoring eutrophication in rivers of the United States. Ecol. Indic. 2007, 7, 48–70. [Google Scholar] [CrossRef]
- Reid, M.A.; Tibby, J.C.; Penny, D.; Gell, P.A. The use of diatoms to assess past and present water quality. Aust. J. Ecol. 2010, 20, 57–64. [Google Scholar] [CrossRef]
- Vasiljević, B.; Krizmanić, J.; Ilić, M.; Marković, V.; Tomović, J.; Zorić, K.; Paunović, M. Water quality assessment based on diatom indices–small hilly streams case study. Water Res. Manag. 2014, 4, 31–35. [Google Scholar]
- Chen, X.; Bu, Z.; Stevenson, M.A.; Cao, Y.; Zeng, L.; Qin, B. Variations in diatom communities at genus and species levels in peatlands (central China) linked to microhabitats and environmental factors. Sci. Total Environ. 2016, 568, 137–146. [Google Scholar] [CrossRef] [PubMed]
- Liboriussen, L.; Jeppesen, E. Structure, biomass, production and depth distribution of periphyton on artificial substratum in shallow lakes with contrasting nutrient concentrations. Freshw. Biol. 2006, 51, 95–109. [Google Scholar] [CrossRef]
- Ponader, K.C.; Charles, D.F.; Belton, T.J. Diatom-based TP and TN inference models and indices for monitoring nutrient enrichment of New Jersey streams. Ecol. Indic. 2007, 7, 79–93. [Google Scholar] [CrossRef]
- Wagenhoff, A.; Clapcott, J.E.; Lau, K.E.M.; Lewis, G.D.; Young, R.G. Identifying congruence in stream assemblage thresholds in response to nutrient and sediment gradients for limit setting. Ecol. Appl. 2017, 27, 469. [Google Scholar] [CrossRef] [PubMed]
- Lavoie, I.; Campeau, S.; Zugicdrakulic, N.; Winter, J.G.; Fortin, C. Using diatoms to monitor stream biological integrity in Eastern Canada: An overview of 10 years of index development and ongoing challenges. Sci. Total Environ. 2014, 475, 187–200. [Google Scholar] [CrossRef] [PubMed]
- Stevenson, R.J.; Pan, Y.; Manoylov, K.M.; Parker, C.A.; Larsen, D.P.; Herlihy, A.T. Development of diatom indicators of ecological conditions for streams of the western Us. J. N. Am. Benthol. Soc. 2008, 27, 1000–1016. [Google Scholar] [CrossRef]
- Smucker, N.J.; Vis, M.L. Spatial factors contribute to benthic diatom structure in streams across spatial scales: Considerations for biomonitoring. Ecol. Indic. 2011, 11, 1191–1203. [Google Scholar] [CrossRef]
- Liu, J.; Soininen, J.; Han, B.P.; Declerck, S.A.J. Effects of connectivity, dispersal directionality and functional traits on the metacommunity structure of river benthic diatoms. J. Biogeogr. 2013, 40, 2238–2248. [Google Scholar] [CrossRef]
- Rimet, F.; Bouchez, A.; Tapolczai, K. Spatial heterogeneity of littoral benthic diatoms in a large lake: Monitoring implications. Hydrobiologia 2016, 771, 179–193. [Google Scholar] [CrossRef]
- Tang, T.; Tang, T.; Tan, L.; Gu, Y.; Jiang, W.; Cai, Q. Identifying community thresholds for lotic benthic diatoms in response to human disturbance. Sci. Rep. 2017, 7, 4134. [Google Scholar] [CrossRef] [PubMed]
- Solak, C.N.; Àcs, É. Water quality monitoring in European and Turkish rivers using diatoms. Turk. J. Fish. Aquat. Sci. 2011, 11, 329–337. [Google Scholar] [CrossRef]
- Szczepocka, E.; Szulc, B.; Szulc, K.; Rakowska, B.; Żelazna-Wieczorek, J. Diatom indices in the biological assessment of the water quality based on the example of a small lowland river. Oceanol. Hydrobiol. Stud. 2014, 43, 265–273. [Google Scholar] [CrossRef] [Green Version]
- Jakovljević, O.; Krizmanić, J.; Cvijan, M. Water quality assessment of the DTD hydrosystem by diatom indices. Matica Srpska J. Nat. Sci. Novi. Sad. 2014, 127, 22–33. [Google Scholar]
- Kolkwitz, R.; Marsson, M. Ökologie der pflanzlichen Saprobien. Ber. Dt. Bot. Ges. 1908, 26A, 505–519. [Google Scholar]
- Sládeček, V. Diatoms as indicators of organic pollution. Acta Hydrochim. Hydrobiol. 1986, 14, 555–566. [Google Scholar] [CrossRef]
- Kelly, M.G.; Whitton, B.A. The trophic diatom index: A new index for monitoring eutrophication in rivers. J. Appl. Phycol. 1995, 7, 433–444. [Google Scholar] [CrossRef]
- Dell’Uomo, A. L’indice Diatomico Di Eutrofizzazione/Polluzione (EPI-D) Nel Monitoraggio Delle Acque Correnti. Linee guida; Agenzia per la protezione dell’ambiente e per i servizi tecnici: Roma, Italy, 2004. [Google Scholar]
- Schiefele, S.; Schreiner, C. Use of diatoms for monitoring nutrient enrichment, acidification and impact of salt in rivers in Germany and Austria. In Use of Algae for Monitoring Rivers; Studia Student G.m.b.H.: Innsbruck, Austria, 1991. [Google Scholar]
- Coste, M. Étude Des Méthodes Biologiques D'appréciation Quantitative De La Qualité Des Eaux; Bassin Rhône-Méditérannée-Corse, Cemagref: Lyon, France, 1982. [Google Scholar]
- Lenoir, A.; Coste, M. Development of a practical diatom index of overall water quality applicable to the French national water board network. In Use of Algae for Monitoring Rivers II; Studia Student G.m.b.H: Innsbruck, Austria, 1996. [Google Scholar]
- Rumeau, A.; Coste, M. Initiation à la systématique des diatoméesd’eau douce. Bull. Fr. Pêche Piscic. 1988, 309, 1–69. [Google Scholar] [CrossRef]
- Descy, J.P.; Coste, M. A test of methods for assessing water quality based on diatoms. Int. Ver. für theor. und angew. Limnol. Verh. 1991, 24, 2112–2116. [Google Scholar] [CrossRef]
- Pipp, E. A regional diatom-based trophic state indication system for running water sites in Upper Austria and its overregional applicability. Int. Ver. für theor. und angew. Limnol. Verh. 2002, 27, 3376–3380. [Google Scholar] [CrossRef]
- Kelly, M.G.; Cazaubon, A.; Coring, E.; Dell’Uomo, A.; Ector, L.; Goldsmith, B.; Guasch, H.; Hu¨rlimann, J.; Jarlman, A.; Kawecka, B.; et al. Recommendations for the routine sampling of diatoms for water quality assessments in Europe. J. Appl. Phycol. 1998, 10, 215–224. [Google Scholar] [CrossRef]
- Hustedt, F. Bacillariophyta (Diatomeae). In Die Süsswasserflora Mitteleuropas, Heft 10. (2. Aufl.); Pascher, A., Ed.; Gustav Fischer: Jena, LA, USA, 1930. [Google Scholar]
- Krammer, K.; Lange-Bertalot, H. Bacillariophyceae. 1. Teil: Naviculaceae. In Süßwasserflora von Mitteleuropa, (Band 2/1); Spektrum Akademischer Verlag: Heidelberg, Germany, 1986. [Google Scholar]
- Krammer, K.; Lange-Bertalot, H. Bacillariophyceae. 2. Teil: Bacillariaceae, Epithemiaceae, Surirellaceae. In Süßwasserflora von Mitteleuropa, (Band 2/2); Spektrum Akademischer Verlag: Heidelberg, Germany, 1988. [Google Scholar]
- Krammer, K.; Lange-Bertalot, H. Bacillariophyceae. 3. Teil: Centrales, Fragilariaceae, Eunotiaceae. In Süßwasserflora von Mitteleuropa, (Band 2/3); Spektrum Akademischer Verlag: Heidelberg, Germany, 1991. [Google Scholar]
- Krammer, K.; Lange-Bertalot, H. Bacillariophyceae. 4. Teil: Achnanthaceae, Kritische Ergänzungen zu Achnanthes s. 1., Navicula s. str., Gomphonema. Gesamtliteraturverzeichnis. Teil 1-4. In Süßwasserflora von Mitteleuropa, (Band 2/4); Spektrum Akademischer Verlag: Heidelberg, Germany, 1991. [Google Scholar]
- McNaughton, S.J. Relationship among functional properties of California grassland. Nature 1967, 216, 168–169. [Google Scholar] [CrossRef]
- Zelinka, M.; Marvan, P. Zur Prazisierung der biologischen Klassifikation des Reinheit fliessender Gewässer. Archiv für Hydrobiologie 1961, 57, 389–407. [Google Scholar]
- Kalyoncu, H.; ÇİCek, N.L.; Akkoz, C.; Yorulmaz, B. Comparative performance of diatom indices in aquatic pollution assessment. Afr. J. Agric. Res. 2009, 4, 1032–1040. [Google Scholar]
- Gomà, J.; Rimet, F.; Cambra, J.; Hoffmann, L.; Ector, L. Diatom communities and water quality assessment in mountain rivers of the upper segre basin (la cerdanya, oriental pyrenees). Hydrobiologia 2005, 551, 209–225. [Google Scholar] [CrossRef]
- Simkhada, B. Diatoms as Indicators of Environmental Change in Lakes and Ponds of the Lowlands, Middle Hills and High Himalaya of Nepal. Ph.D. Thesis, University of Bielefeld Faculty, Kathmandu, Népal, 2006. [Google Scholar]
- Qian, N.; Zhang, R.; Zhou, Z. Fluvial Process Theory; Science Press: Beijing, China, 1987. [Google Scholar]
- Strahlar, A.N. Quantitative analysis of watershed geomorphology. Eos Trans. 1957, 38, 913–920. [Google Scholar] [CrossRef]
- Stevenson, R.J. Effects of current and conditions stimulating autogenically changing microhabitats on benthic diatom immigration. Ecology 1983, 64, 1514–1524. [Google Scholar] [CrossRef]
- Hynes, H.B.N. The Ecology of Running Waters; Livepool University Press: Liverpool, UK, 1970; Volume 555. [Google Scholar]
- Pan, Y.; Stevenson, R.J.; Hill, B.H.; Kaufmann, P.R.; Herlihy, A.T. Spatial Patterns and ecological determinants of benthic algal assemblages in Mid-Atlantic streams, USA. J. Phycol. 1999, 35, 460–468. [Google Scholar] [CrossRef]
- Douglas, B. The ecology of attached diatoms and other algae in a small stony stream. J. Ecol. 1958, 46, 295–322. [Google Scholar] [CrossRef]
- Hoagland, K.D.; Peterson, C.G. Effects of light and wave disturbance on vertical zonation of attached microalgage in a large reservoir. J. Phycol. 2010, 26, 450–457. [Google Scholar] [CrossRef]
- Boyd, C.E.; Mnnsiri, P. Phosphorous absorption capacity and availability of added phosphorous in soils from aquaculture areas in Tailand. J. World Aquacult. Soc. 1996, 27, 160–167. [Google Scholar] [CrossRef]
- Balod, M.; Purina, I.; Becllemin, C.; Maestrini, S.Y. Effects of nutrient enrichment on the growth rates and community structure of summer phytoplankton from the Gulf of Riga, Baltic Sea. J. Plankton Res. 1998, 20, 2251–2271. [Google Scholar] [CrossRef]
- Keck, F.; Bouchez, A.; Franc, A.; Rimet, F. Linking phylogenetic similarity and pollution sensitivity to develop ecological assessment methods: A test with river diatoms. J. Appl. Ecol. 2016, 53, 856–864. [Google Scholar] [CrossRef]
- Braak, C.J.F.T. Canonical correspondence analysis: A new eigenvector method for multivariate direct gradient analysis. Ecology 1986, 67, 1167–1179. [Google Scholar] [CrossRef]
- Braak, C.J.F.T. Unimodal Models to Related Species to Environment; Agricultural Math Group: Wageningen, The Netherlands, 1987. [Google Scholar]
Figure 1.
Locations of sampling sites in the Ying River, the largest tributary of the Huaihe River in Eastern China.
Figure 1.
Locations of sampling sites in the Ying River, the largest tributary of the Huaihe River in Eastern China.

Figure 2.
Number of benthic diatom species in each sampling site.

Figure 3.
Distribution and dominance Y of benthic diatoms (SP. 1–7) in the Ying River.

Figure 4.
Classification of sampling sites in the Ying River with the Strahlar method.

Figure 5.
Total nitrogen (TN) NH3-N, and Total phosphorus (TP) distribution in the Ying River.


Figure 6.
Values of diatom indices the Specific Polluosensitivity Index (SPI) and the Generic Diatom Index (GDI) in the Ying River.
Figure 6.
Values of diatom indices the Specific Polluosensitivity Index (SPI) and the Generic Diatom Index (GDI) in the Ying River.

Figure 7.
Canonical correspondence analysis (CCA) ordination diagram of benthic diatoms and environmental factors in the Ying River. (SP. 1–7 refer to Figure 3).
Figure 7.
Canonical correspondence analysis (CCA) ordination diagram of benthic diatoms and environmental factors in the Ying River. (SP. 1–7 refer to Figure 3).


Table 1.
Dominant species and dominance of benthic diatoms in the Ying River.
| Dominant Species | Dominance Y |
|---|---|
| Nitzschia inconspicua | 0.05 |
| Achnanthidium minutissimum | 0.05 |
| Navicula aitchelbee | 0.05 |
| Nitzschia palea | 0.05 |
| Cyclotella meneghiniana | 0.03 |
| Navicula submuralis | 0.02 |
| Mayamaea atomus | 0.02 |
Table 2.
Dominant species and dominance of benthic diatoms in Y-1, Y-2, and Y-3.
| Region | Dominant Species | Dominance Y |
|---|---|---|
| Y-1 | Achnanthidium minutissimum | 0.15 |
| Achnanthidium sp. 2 | 0.03 | |
| Nitzschia palea | 0.03 | |
| Achnanthidium cf. eutrophilum | 0.03 | |
| Navicula submuralis | 0.02 | |
| Nitzschia amphibian | 0.02 | |
| Encyonopsis microcephala | 0.02 | |
| Y-2 | Navicula aitchelbee | 0.11 |
| Cyclotella meneghiniana | 0.09 | |
| Nitzschia palea | 0.09 | |
| Gomphonema parvulum | 0.05 | |
| Mayamaea atomus | 0.03 | |
| Achnanthidium minutissimum | 0.03 | |
| Nitzschia paleacea | 0.02 | |
| Y-3 | Nitzschia inconspicua | 0.31 |
| Navicula aitchelbee | 0.09 | |
| Nitzschia palea | 0.04 | |
| Navicula submuralis | 0.02 | |
| Navicula subminuscula | 0.02 |
Table 3.
Values of diatom indices in each sampling site.
| Sampling | Diatom Indices | Sampling | Diatom Indices | Sampling | Diatom Indices | |||
|---|---|---|---|---|---|---|---|---|
| Sites | SPI | GDI | Sites | SPI | GDI | Sites | SPI | GDI |
| LR-1 | 14.38 | 16.74 | SR-9 | 7.85 | 4.94 | JLR-6 | 2.95 | 7.25 |
| LR-2 | 14.97 | 16.07 | GJR-1 | 6.26 | 10.07 | JLR-7 | 5.28 | 8.76 |
| LR-3 | 17.39 | 16.61 | GJR-2 | 13.21 | 13.43 | JLR-8 | 6.73 | 10.32 |
| LR-4 | 17.29 | 17.49 | GJR-3 | 8.71 | 13.7 | JLR-9 | 5.11 | 9.01 |
| BRR-1 | 9.95 | 9.45 | YR-1 | 14.2 | 12.34 | SYR-1 | 5.81 | 9.27 |
| BRR-2 | 16.33 | 18.79 | YR-2 | 3.38 | 7.55 | SYR-2 | 6.82 | 9.28 |
| BRR-3 | 14.94 | 12.75 | YR-3 | 16.01 | 16.1 | SYR-3 | 6.49 | 8.77 |
| BRR-4 | 15.51 | 17.53 | YR-4 | 8.11 | 9.24 | SYR-4 | 9.33 | 2.6 |
| BRR-5 | 15.4 | 17.91 | YR-5 | 5.17 | 10.38 | SYR-5 | 9.39 | 4.26 |
| BRR-6 | 7.42 | 9.16 | YR-6 | 7.27 | 8.48 | SYR-6 | 8.92 | 6.79 |
| SR-1 | 16.25 | 16.01 | QYR-1 | 3.79 | 9.27 | SYR-7 | 7.05 | 6.6 |
| SR-2 | 12.06 | 13.75 | QYR-2 | 3.76 | 8.7 | SYR-8 | 9.22 | 4.49 |
| SR-3 | 15.67 | 17.84 | SJR-1 | 8.23 | 11.13 | FQR-1 | 13.16 | 10.72 |
| SR-4 | 14.98 | 19.13 | JLR-1 | 15.48 | 16.14 | FQR-2 | 8.43 | 5.39 |
| SR-5 | 11.39 | 10.17 | JLR-2 | 7.75 | 10.92 | XCR-1 | 2.38 | 4.27 |
| SR-6 | 5.35 | 17.38 | JLR-3 | 1.35 | 4.37 | HCR-1 | 9.29 | 10.47 |
| SR-7 | 3.03 | 8.44 | JLR-4 | 4.33 | 7.64 | HCR-2 | 7.32 | 3.19 |
| SR-8 | 4.89 | 7.5 | JLR-5 | 3.46 | 6.36 | |||
Note: Sampling sites in green are Y-1, Y-2 in red and Y-3 in yellow.
Table 4.
The values of physicochemical parameters of the Ying River.
| Parameters | Mean | Range |
|---|---|---|
| Velocity (m/s) | 0.13 | 0–1.022 |
| WT (°C) | 23.48 | 17.28–31.02 |
| Cond (mS/cm) | 0.91 | 0.17–1.93 |
| Sal (‰) | 0.45 | 0.08–0.96 |
| pH | 8.34 | 4.41–9.41 |
| Turbidity (NTU) | 31.03 | 1.18–93.84 (111.50, 115.70) |
| TSS (mg/L) | 0.12 | 0–0.46 |
| SD (cm) | 51.65 | 9–214 |
| COD (mg/L) | 33.89 | 0–57.20 (320.10, 341.00, 348.70) |
| TN (mg/L) | 4.81 | 0.01–17.27 |
| TP (mg/L) | 1.67 | 0.22–9.09 |
| NH3-N (mg/L) | 1.58 | 0.01–5.50 (7.46, 8.55, 10.74, 11.99) |
| TN/TP | 3.70 | 0.3–12.96 |
Note: Numbers in the parenthesis are the exception values.
Table 5.
Pearson’s correlation analysis of various environmental factors and diatom indices.
| Dominant Species and Diatom Indices | Velocity | Cond | Sal | pH | Turbidity | WT | |||||
| Nitzschia inconspicua | −0.277 * | 0.265 | 0.288 * | 0.034 | 0.146 | 0.077 | |||||
| Achnanthidium minutissimum | −0.242 | −0.535 ** | −0.557 ** | 0.301 * | −0.241 | 0.345 * | |||||
| Navicula aitchelbee | 0.421 ** | 0.474 ** | 0.495 ** | −0.068 | 0.430 ** | −0.302 * | |||||
| Nitzschia palea | 0.310 * | 0.402 ** | 0.459 ** | −0.263 | 0.340 * | −0.355 ** | |||||
| Cyclotella meneghiniana | 0.322 * | 0.360 ** | 0.408 ** | −0.192 | 0.027 | −0.366 ** | |||||
| Navicula submuralis | 0.079 | 0.065 | 0.072 | 0.068 | −0.097 | 0.123 | |||||
| Mayamaea atomus | −0.083 | 0.250 | 0.063 | 0.027 | −0.070 | 0.095 | |||||
| SPI | −0.252 | −0.670 ** | −0.696 ** | 0.360 ** | −0.361 ** | 0.382 ** | |||||
| GDI | −0.115 | −0.685 ** | −0.722 ** | 0.175 | −0.356 ** | 0.329 * | |||||
| Dominant Species and Diatom Indices | TSS | SD | COD | TN | TP | NH3-N | TN/TP | ||||
| Nitzschia inconspicua | 0.138 | −0.089 | −0.091 | 0.056 | 0.015 | −0.120 | 0.181 | ||||
| Achnanthidium minutissimum | −0.242 | 0.135 | −0.003 | −0.594 ** | −0.413 ** | −0.339 * | −0.310 * | ||||
| Navicula aitchelbee | 0.431 ** | −0.195 | 0.158 | 0.525 ** | 0.213 | 0.294 * | 0.284 * | ||||
| Nitzschia palea | 0.341 * | −0.145 | 0.009 | 0.614 ** | 0.401 ** | 0.667 ** | 0.130 | ||||
| Cyclotella meneghiniana | 0.028 | −0.105 | 0.014 | 0.624 ** | 0.320 * | 0.762 ** | 0.150 | ||||
| Navicula submuralis | −0.084 | −0.006 | −0.027 | −0.041 | 0.239 | −0.117 | −0.161 | ||||
| Mayamaea atomus | −0.074 | 0.172 | −0.056 | 0.017 | 0.158 | −0.082 | −0.109 | ||||
| SPI | −0.363 ** | 0.180 | −0.132 | −0.719 ** | −0.492 ** | −0.491 ** | −0.272 * | ||||
| GDI | −0.355 ** | 0.214 | −0.071 | −0.535 ** | −0.422 ** | −0.289 * | −0.211 | ||||
** Correlation at 0.01 (2-tailed); * Correlation at 0.05 (2-tailed).
© 2018 by the authors. Licensee MDPI, Basel, Switzerland. This article is an open access article distributed under the terms and conditions of the Creative Commons Attribution (CC BY) license (http://creativecommons.org/licenses/by/4.0/).
Share and Cite
MDPI and ACS Style
Shen, R.; Ren, H.; Yu, P.; You, Q.; Pang, W.; Wang, Q. Benthic Diatoms of the Ying River (Huaihe River Basin, China) and Their Application in Water Trophic Status Assessment. Water 2018, 10, 1013. https://doi.org/10.3390/w10081013
AMA Style
Shen R, Ren H, Yu P, You Q, Pang W, Wang Q. Benthic Diatoms of the Ying River (Huaihe River Basin, China) and Their Application in Water Trophic Status Assessment. Water. 2018; 10(8):1013. https://doi.org/10.3390/w10081013
Chicago/Turabian StyleShen, Rongrong, Hongye Ren, Pan Yu, Qingmin You, Wanting Pang, and Quanxi Wang. 2018. "Benthic Diatoms of the Ying River (Huaihe River Basin, China) and Their Application in Water Trophic Status Assessment" Water 10, no. 8: 1013. https://doi.org/10.3390/w10081013
Note that from the first issue of 2016, this journal uses article numbers instead of page numbers. See further details here.