1. Introduction
In California, the most populous state of the United States with approximately 39 million residents [
1], recurring periods of drought cause frequent water scarcity issues [
2]. Many areas of the state experience groundwater depletion as a result, which may also lead to seawater intrusion in coastal areas. Water scarcity issues are most prevalent in Southern California [
3], including all counties south of Kern, San Bernardino and San Luis Obispo, where 61% of the state’s population resides [
1]. Steady and continued population growth in Southern California will lead to increased water demand, but plans are being implemented to decrease withdrawals from the Colorado River, State Water Project canals and rivers and the Los Angeles Aqueduct to protect sensitive ecosystems and threatened species from high water temperatures and low flows in river systems that feed into Southern California’s water supply [
4].
Uncertainty about the availability of water resources at the state, regional and community levels is generating increased interest in emerging potable water technologies. As California cities attempt to mitigate the impacts of prolonged drought, two main technology paths for potable water production have emerged: water reuse and seawater desalination. Traditionally, water reuse has been implemented for non-food crop irrigation, landscaping and other non-potable uses [
5]. Advancements in wastewater treatment technologies have expanded water reuse applications to include groundwater aquifer recharge, reduction of seawater intrusion, industrial applications, restoration of natural systems, geothermal energy production and potable reuse [
6]. Similarly, seawater desalination may present a solution to water scarcity issues for California and other drought-stricken coastal regions of the United States. In general, there are two main processes for seawater desalination: evaporation and membrane separation. Common technologies associated with the two desalination processes are reverse osmosis, electro-dialysis, multi-stage flashing, multi-effect distillation and vapor compression distillation. Seawater reverse osmosis (SWRO) is the most efficient technology, having the lowest combined energy demand, and represents state-of-the-art seawater desalination technology [
7]. In general, all these technologies produce high salinity brine as a byproduct, and SWRO brine has approximately double the salinity of the feed seawater itself [
8].
Potable water reuse and SWRO are both viable options to expand California’s water portfolio, and each of the technologies has strengths and weaknesses. Potable water reuse is limited by the availability of treated wastewater and relatively high treatment costs and may suffer from negative public opinion about reusing wastewater [
9]. SWRO is mostly limited to large-scale facilities due to the energy cost advantages of treating large flow rates [
10]. Environmental concerns have caused negative public opinion about this relatively new technology and deterred the expansion of SWRO facilities in California [
11]. Overall, the SWRO potential of California is constrained by sustainable power supplies, economies of scale and environmental impacts of seawater intake and brine discharge.
During SWRO, the concentrated brine that is discharged to the ocean may cause both acute and chronic toxicity to marine life [
12]. Starting in 1972, the California State Water Resources Control Board adopted the Water Quality Control Plan for the Ocean Waters of California (Ocean Plan) as a regulatory oversight to address the environmental impacts of brine discharge. In the 2015 desalination amendment, the Ocean Plan included provisions to address issues arising from desalination facility intakes, the desalination processes and the discharge of high-salinity brine [
13]. The Ocean Plan now recommends the dilution of SWRO brine by commingling it with wastewater effluent prior to ocean discharge, as discharging SWRO brine with a salinity concentration near the ocean’s background concentration minimizes the negative effects on marine life. This dilution requirement changes the paradigm of seawater desalination from a resource that is limited by energy and economies of scale to a resource that is limited by the availability of wastewater effluent. The amount of wastewater effluent determines the amount of brine that can be diluted and therefore the amount of water that can be extracted from the Pacific Ocean and processed into potable water. In detail, the Ocean Plan recommends a maximum allowable increase of 2.0 parts per thousand (ppt) from the background salinity at the edge of the effluent mixing zone.
Potential brine dilution water being discharged to the ocean is highly available along the California coast. Sources can include storm water, municipal wastewater effluent and industrial wastewater effluent, which may be seawater coolant or treated water used in industrial processes. The objective of this study is to quantify the amount of potential dilution water discharged into the ocean and determine the seawater desalination capacity of California. The quantity, quality and location of available potential dilution water sources are cataloged. By comparing available wastewater dilution sources with regional water needs, using metrics of water scarcity and stress to characterize a community’s demand for alternative water sources, the relevance of SWRO in different regions of California is determined. Furthermore, this paper characterizes the wastewater effluent discharged into the California coast by cataloging treatment levels and discharge violations for wastewater treatment facilities (WWTFs) along the coast. By cataloging the quantity, quality and location of wastewater effluent, this paper provides a survey on the state of treatment levels and typical discharge violations that could be utilized by several stakeholders to manage and plan future wastewater and water reuse practices.
2. Materials and Methods
Spatial inventory of available wastewater resources: The first step to determine the seawater desalination potential in California is to create an index of the available wastewater for brine dilution. Under the Clean Water Act, any facility that discharges pollutants into a body of water in the United States must be permitted by the U.S. Environmental Protection Agency’s National Pollutant Discharge Elimination System (NPDES) [
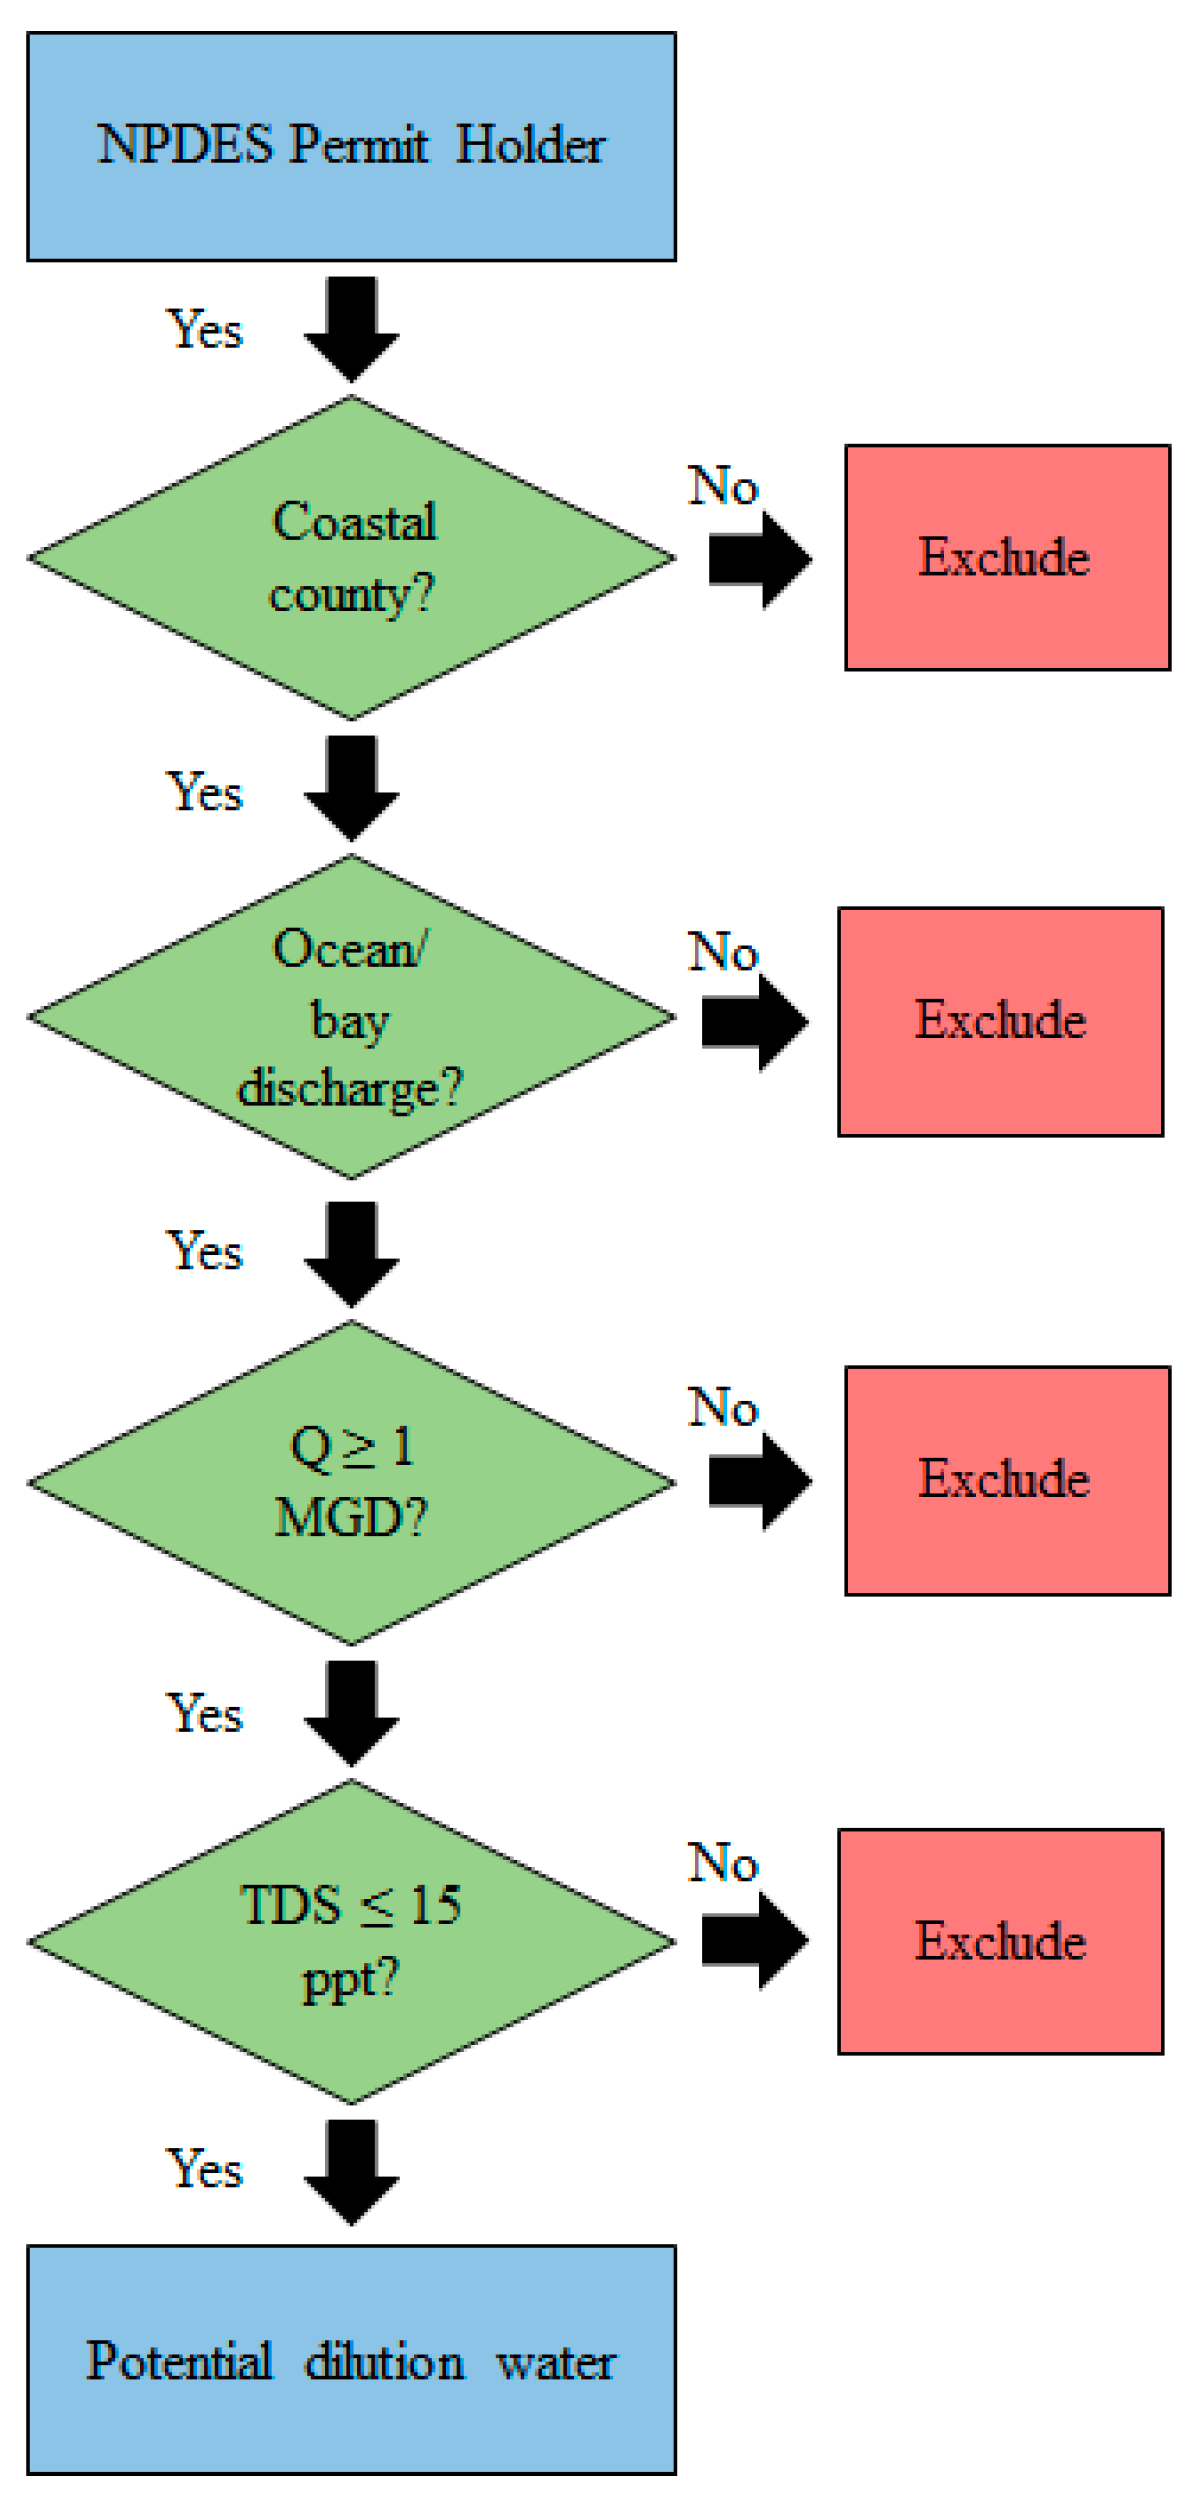
14]. A list of candidate discharge facilities for brine dilution was generated from the NPDES database, and the facilities were screened to determine if they were an appropriate source of dilution water (
Figure 1). Screening was based on four constraints: (1) the NPDES permit holder must be within a coastal county; (2) the coastal NPDES permit holder must discharge into a bay or ocean. If the permit holder discharges into a river, the discharge point must be within 1 geodesic mile of a bay or ocean; (3) the NPDES average dry weather flow rate must be equal to or greater than 3.8 MLD (1 MGD); and (4) the effluent from the NPDES holder must have an average total dissolved solids (TDS) concentration equal to or less than 15 ppt.
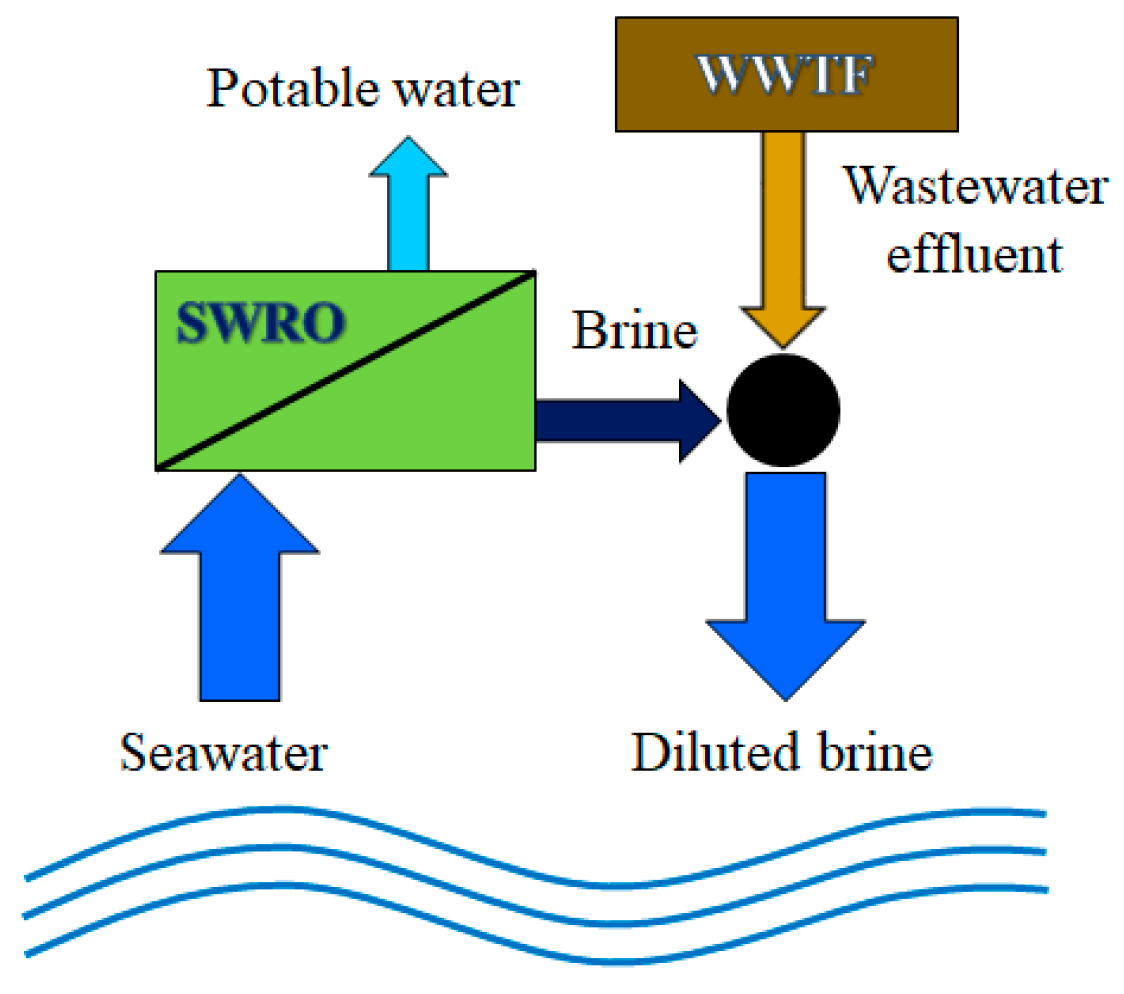
After screening, it was found that all the facilities meeting the criteria are WWTFs, and these were included in a list of potential WWTFs that could be utilized as a dilution water source. To estimate the flow rate of potable water that can be generated by collocating SWRO and WWTFs, a mass balance of both the seawater desalination and brine dilution processes, schematized in
Figure 2, was developed (
Appendix A). By applying a mass balance to both the desalination and brine dilution processes, it is possible to estimate the flow rate of potable water produced by the desalination facility. Furthermore, wastewater treatment level and discharge violation data were collected to assess the potential to use the effluent for water reuse.
Flow rate data: WWTF effluent flow rates usually vary throughout the year, depending on seasonal storm runoff and infiltration. Along the California coast, the lowest flow rates (or dry weather flow rates) typically occur from July through September. To isolate a conservative dry weather flow rate (i.e., baseline flow rate) estimate for each WWTF, the daily flow rates for the summer months were retrieved from the WWTF electronic self-monitoring reports (eSMRs) and averaged. Data points that appeared to result from measurement or reporting errors were excluded from the analysis. In the event of large gaps in the reported dataset, that reporting period was omitted from the calculations.
Total dissolved solids data: Relatively high TDS concentrations in the WWTF effluent would limit the amount of brine that can be diluted, since the commingled brine TDS concentration must be no more than 2.0 ppt greater than that of the background ocean water. When available, the eSMR of the WWTF was used to quantify the average annual maximum effluent TDS concentration. If TDS concentrations were not recorded by the facility, then total solids and total suspended solids or conductivity data were used to calculate TDS. If none of the necessary data were available, then an averaged TDS value from neighboring WWTFs was used.
Wastewater effluent quality data: To assess the quality of the wastewater effluent, WWTFs were categorized in two ways: the wastewater treatment level and the effluent discharge violations during the whole 2016 year. Each WWTF was cataloged as having primary, secondary or tertiary level treatment. Primary treatment reduces only suspended solids and organic matter; secondary treatment also reduces biodegradable organic matter and suspended solids; and tertiary treatment further reduces residual suspended solids and nutrients [
5]. In general, tertiary level-treated wastewater would be preferable for water reuse. Additionally, the three most frequent violations for each facility during the year 2016 were reported, as disclosed in the eSMR.
Spatial distribution of water needs: A scoring system was used to determine the water needs for each water district containing a WWTF in the final pool of potential dilution water sources. The need for an alternative water source in a district was determined based on four factors: (1) the percentage of the water supply imported from outside the district; (2) the severity of saltwater intrusion or land subsidence from groundwater drawdown; (3) the amount of wastewater a district has allocated for reuse; and (4) the quality of groundwater sources in the district. Each of these categories received a score from 0–3, with 3 representing the highest need for water. The scores were then totaled and used to rank the need for an alternative water source as low (0–4), moderate (5–8) or high (9–12).
Percentage of imported water: Locations that import water from any non-local source, including water transported via canals, deltas, vehicle shipment or aqueduct, are water dependent. By analyzing the water source for each water district, the water dependency was categorized as being highly dependent, moderately dependent or not significantly dependent. The Association of California Water Agencies (ACWA) lists the water districts that distribute approximately 90% of the water in California; included in the list is the percentage of water that is imported by each water district [
15]. This information was used to rank the water importation dependency of each district by assigning a score between zero and three (
Table 1).
California Statewide Groundwater Elevation Monitoring (CASGEM) groundwater prioritization level: Locations that depend on depleting groundwater basins are considered areas of priority for alternative water sources. The California Department of Water Resources monitors a large majority of the groundwater basins through the California Statewide Groundwater Elevation Monitoring (CASGEM) program. CASGEM data are compiled by groundwater monitoring agencies, water replenishment districts, local agencies and voluntary groundwater associations [
3]. Individual water basins were scored 0–3 based on the priority assigned to the basin by the CASGEM program (
Table 1). Water districts with groundwater basins that had “very low” CASGEM priority received a score of 0. Those that had “low” CASGEM priority groundwater basins received a score of 1, and a score of 2 was assigned to districts with “medium” CASGEM priority. Water districts with “high” priority groundwater basins were assigned a score of 3.
Annual water reuse volume: Locations that recycle or reuse a large volume of water were assumed to have strained water resources. Data quantifying reuse was taken from the website for each individual water district or from city urban water management plans. If this data were not available from districts/cities, then county reuse data were applied to the district. The volume of water reused in each county was collected from Chapter 12, Vol. 3, of the California Water Plan [
16].
Table 1 summarizes the scoring conventions based on the district’s or county’s annual volume of water reused.
Percent dependence on contaminated groundwater: Water districts may also be considered as having a high need for an alternative water source if groundwater sources are contaminated. These districts were identified using the “Communities that Rely on a Contaminated Groundwater Source for Drinking Water” report from the California State Water Resources Control Board [
17]. This report identifies the number of people in each county that are 100% reliant on contaminated groundwater for their drinking water. This quantity is expressed as a percentage of the total population within the county, and the percentage was used to assign a score between 0 and 3 (
Table 1).
3. Results
To put the following section into perspective, one must consider that California has the largest water use of any state in the United States. The United States Geological Survey (USGS) estimates the withdrawal of water in California to be about 143,846 MLD (38 BGD), two-thirds of which is sourced from surface waters, and the remainder is drawn from groundwater sources. Of this, 117,348 MLD (31 BGD) of water withdrawal is freshwater, 83,279 ML (22 billion gallons) of which is used for non-potable applications. The remaining 34,069 MLD (9 BGD) of freshwater withdrawals are used as potable water [
18].
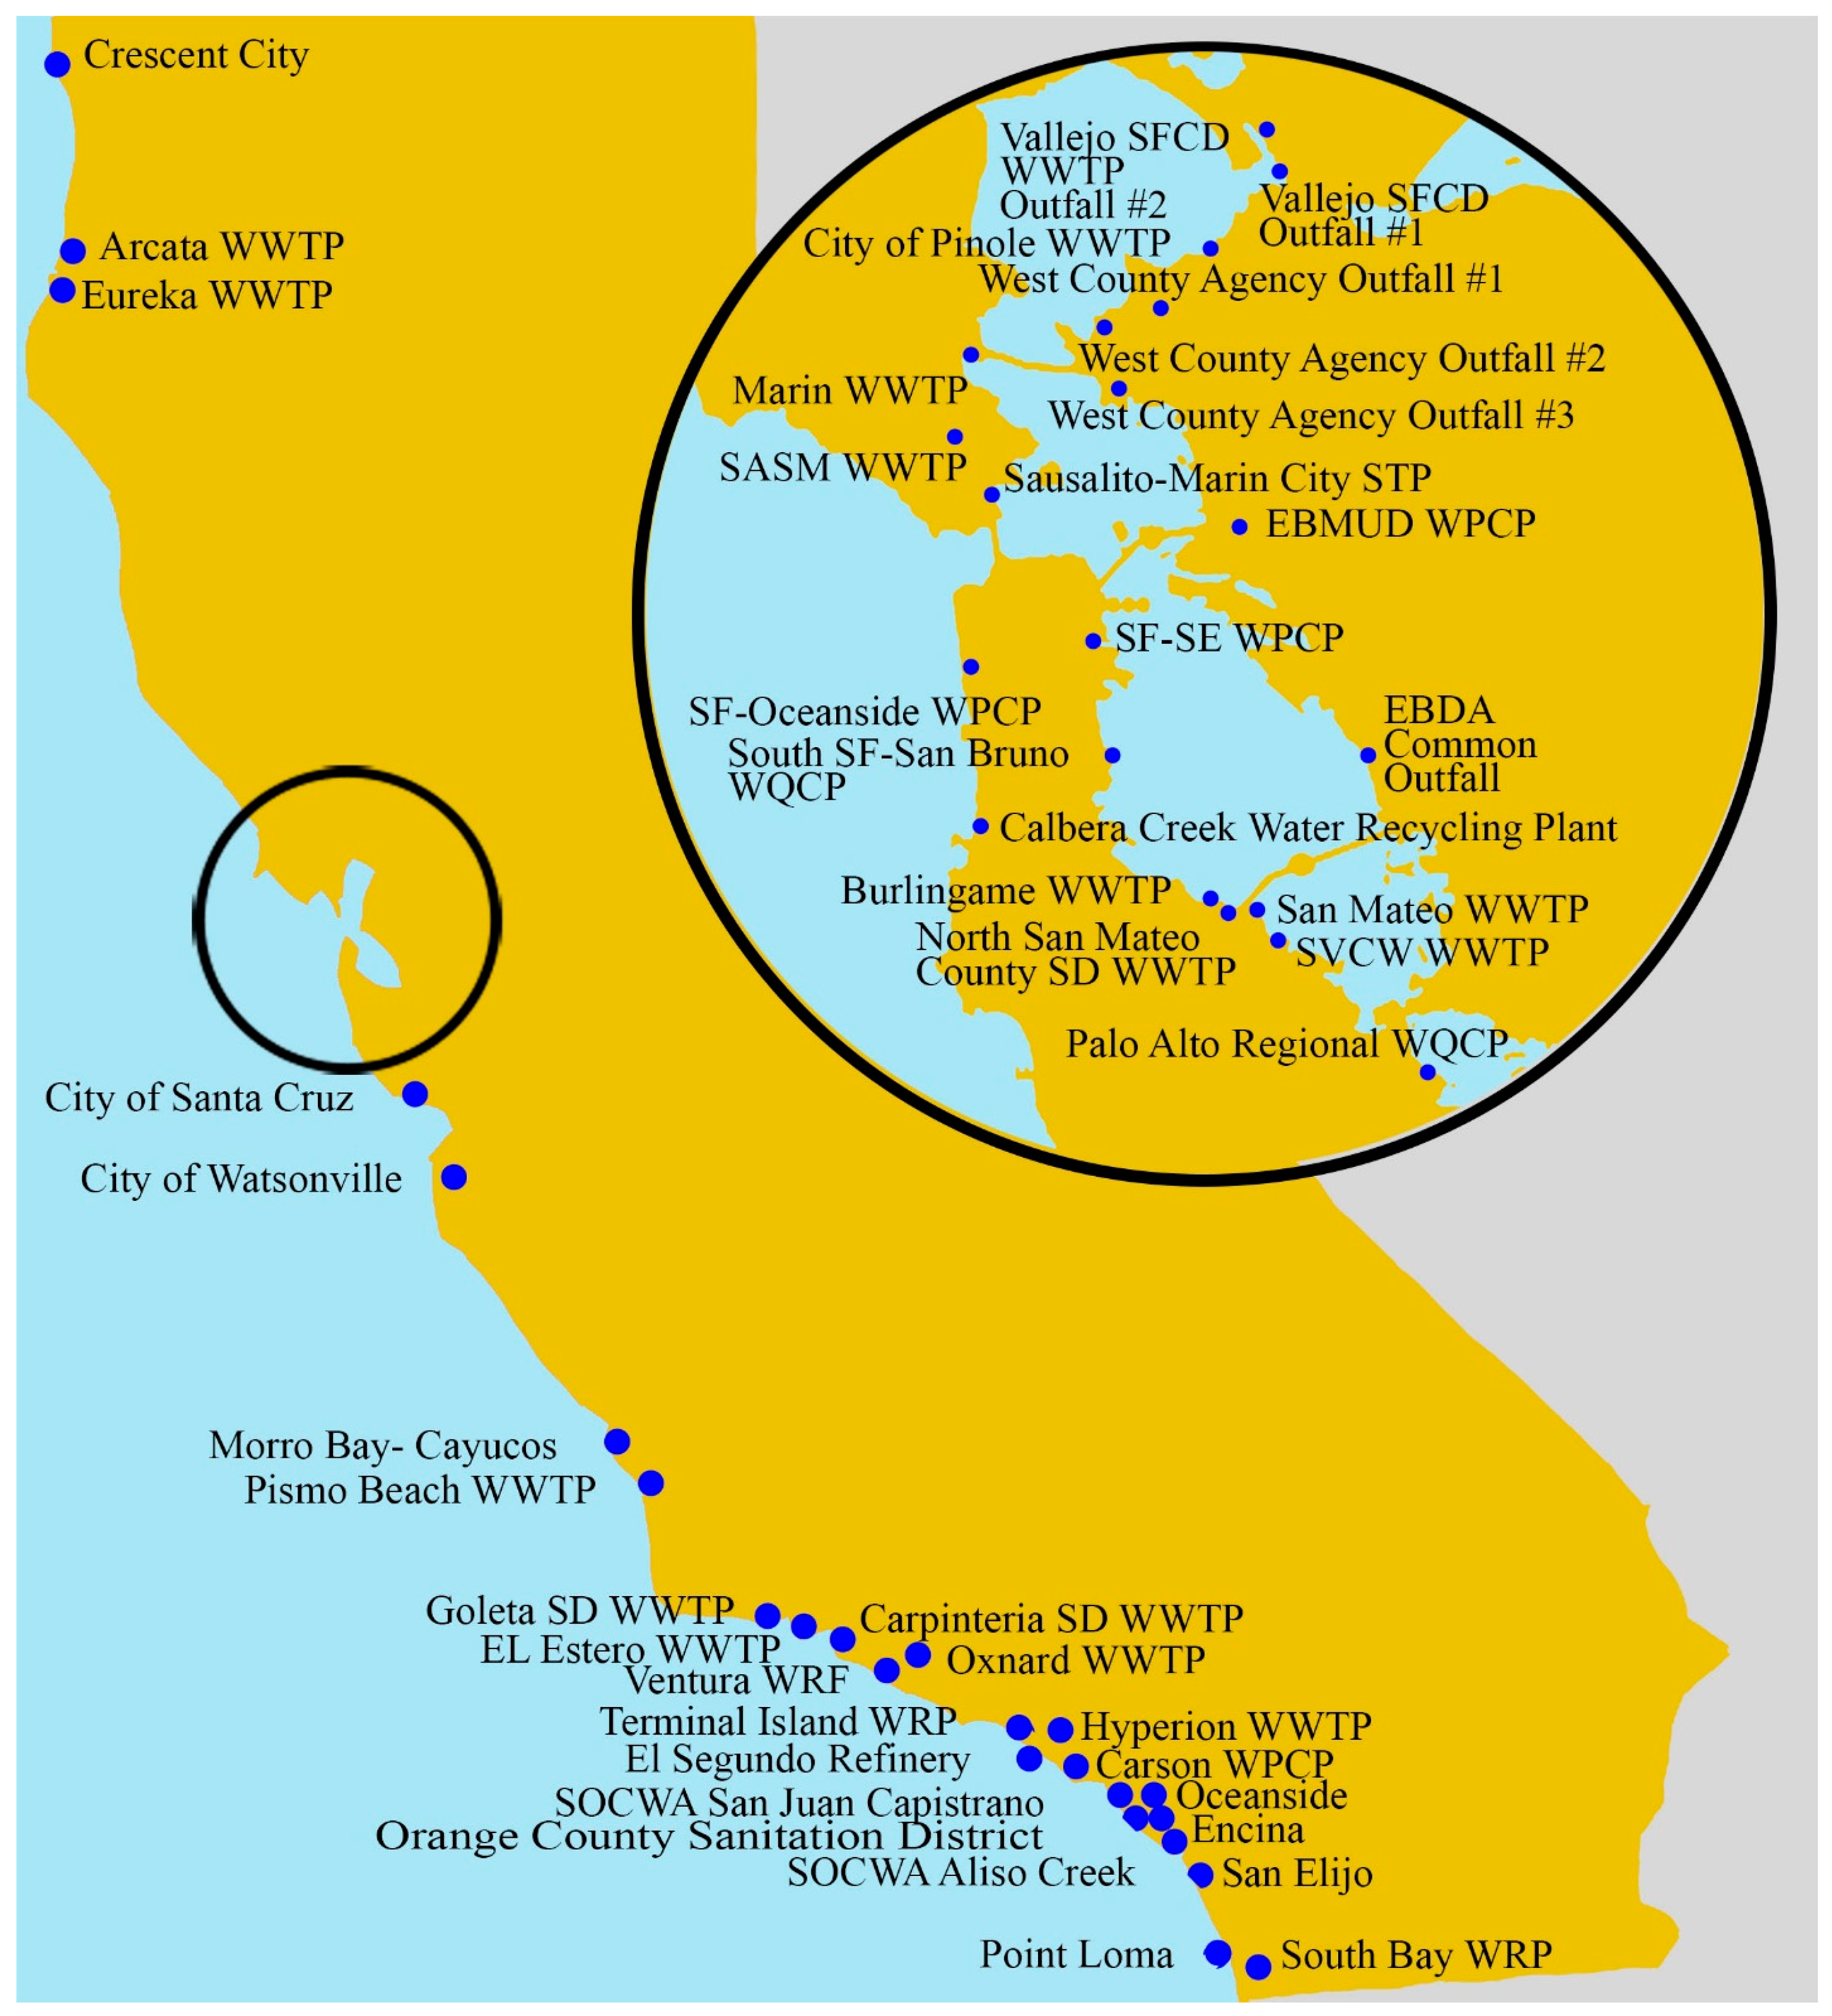
The California coast, strategically located to ease some of this freshwater demand with desalinated seawater, has suitable WWTFs that could provide wastewater effluent for brine commingling in four regions: North Coast, San Francisco Bay Area, Central Coast and South Coast (
Figure 3). As expected, the density of WWTFs increases with increasing population density. The North Coast and Central Coast regions are mostly rural and sparsely populated, with only three and nine WWTFs, respectively, that discharge more than 3.8 MLD (1 MGD) year-round. The Bay Area has a large population and a high density of WWTFs, 23 of which have flow rates greater than 3.8 MLD (1 MGD). The South Coast has the densest population in California and 12 qualifying WWTFs. Although the South Coast has fewer WWTFs than the Bay Area, they are some of the largest in the state.
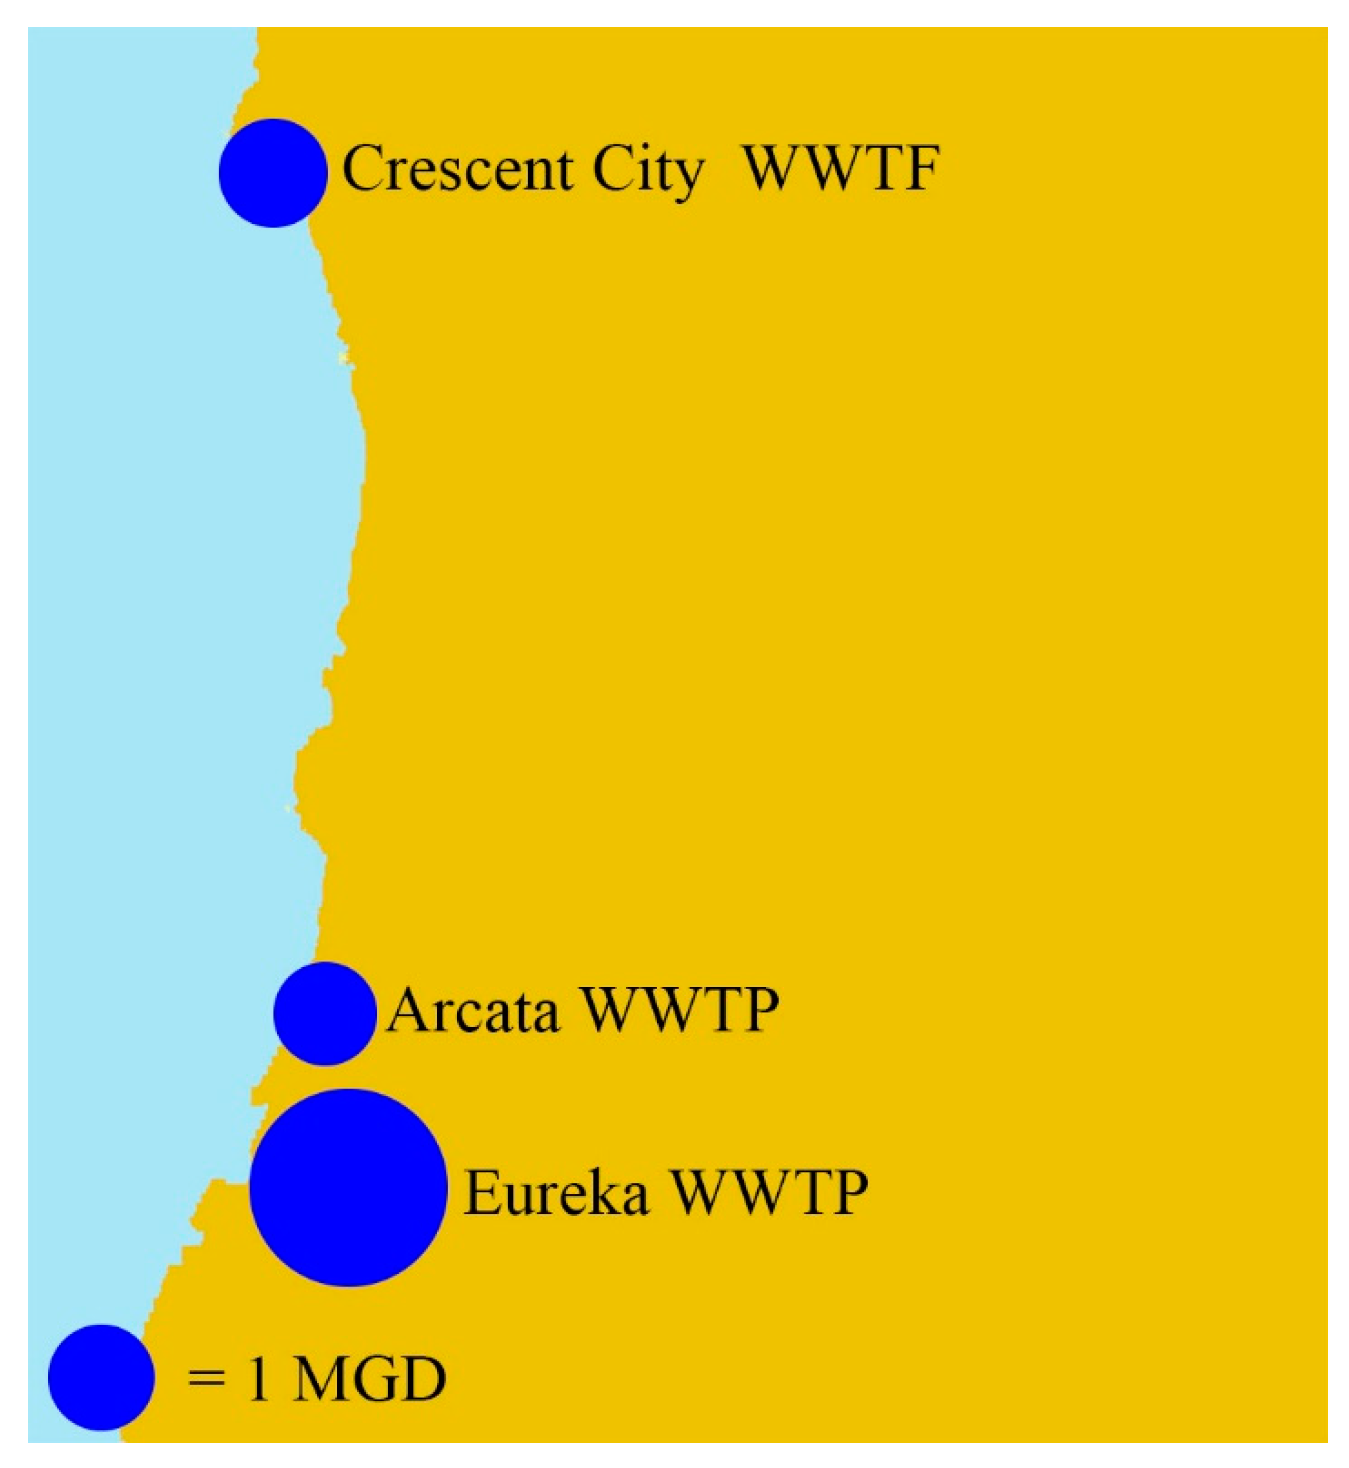
North Coast region: In the North Coast, there are three ocean and bay WWTFs discharging more than one MGD. These WWTFs are located in Crescent City, Arcata and Eureka and have average dry weather flow rates of 3.8 MLD (1.0 MGD), 3.8 MLD and 13.2 MLD (3.5 MGD), respectively (
Figure 4). The average TDS concentrations for the WWTFs in Crescent City, Arcata and Eureka are 0.3 g/L, 0.6 g/L and 0.3 g/L, respectively (
Table 2). The combined total ocean and bay discharge WWTF effluent of 20.8 MLD (5.5 MGD) in the North Coast region could allow a production of 23.5 MLD (6.2 MGD) of potable water from seawater desalination.
Effluent discharged from the Crescent City WWTF, Arcata wastewater treatment plant (WWTP) and Eureka WWTP receives secondary treatment to reduce suspended solids and BOD (
Table 2). The California Integrated Water Quality System reports that there were no effluent water quality violations at the Crescent City WWTF in 2016. At the Arcata WWTF, there were seven violations for dichlorobromomethane, which is a carcinogenic disinfection byproduct [
19], and nine violations for BOD. The California Integrated Water Quality System reported five violations for ammonia and two for fecal coliforms at the point of discharge for the Eureka WWTF.
Crescent City, Arcata and Eureka have a low need for additional water sources, mainly due to high precipitation that replenishes water sources. Additionally, no water is currently imported to the North Coast region; excess water is even available for export from the Humboldt Bay Municipal Water District, which is associated with the Arcata and Eureka WWTFs. However, this excess water may be prohibitively expensive to transport over the coastal range [
20]. Overall, the water districts of the North Coast region have low incentive for desalination implementation.
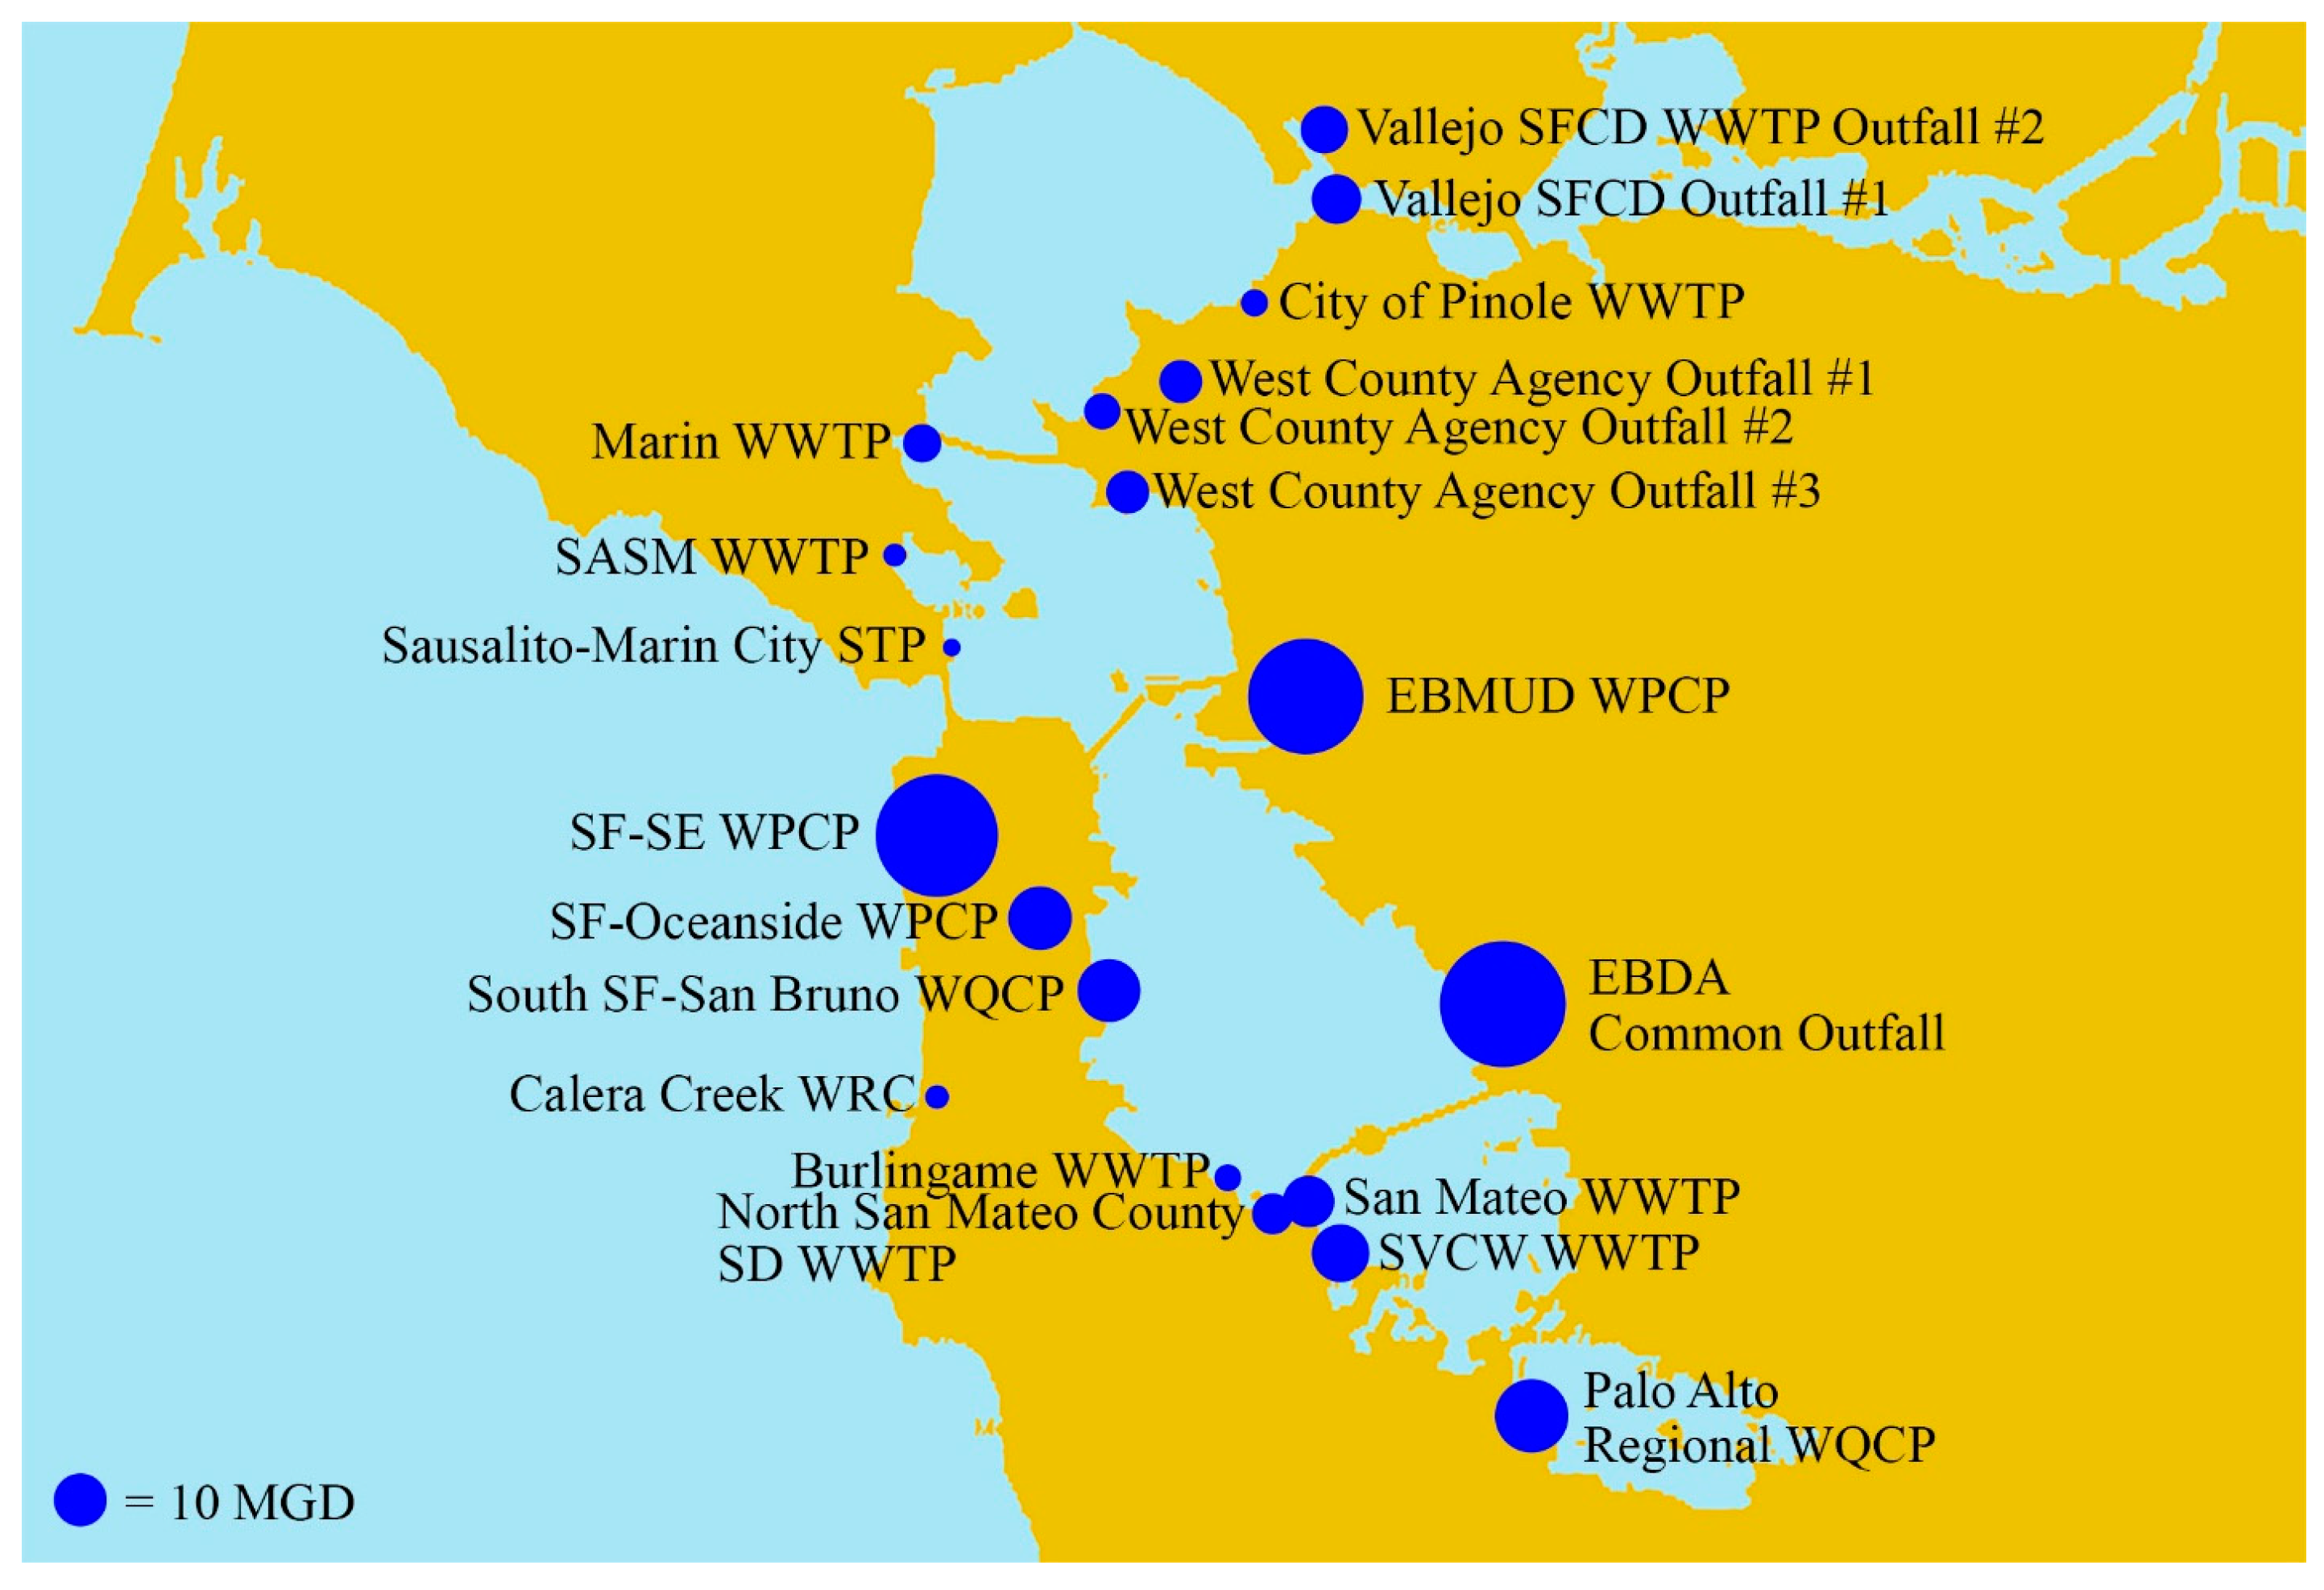
Bay Area region: The Bay Area includes seven counties with 19 WWTFs and a total of 23 discharge points larger than 3.8 MLD (1 MGD) (
Figure 5). Some WWTFs have multiple ocean or bay outfalls, and the larger effluent outfalls in the Bay Area discharge the combined effluents from multiple municipalities. The East Bay Dischargers Authority Common Outfall serves six WWTFs, while the East Bay Municipal Utilities District serves nine WWTFs [
21]. The effluents from these two networks serving nearly 1.5 million people are discharged roughly 11 miles apart, and both WWTFs are located within the East Bay Municipal Utilities District service boundaries. The average dry weather effluent flow rates in the region vary from 4.2 MLD (1.1 MGD) in Sausalito-Marin City to 214 MLD (56.6 MGD) at the East Bay Dischargers Authority. Average TDS concentrations vary from 0.5–3.2 g/L. The combined total effluent available from all WWTFs in the Bay Area region is approximately 1503 MLD (397 MGD) and could allow for the production of approximately 1613 MLD (426 MGD) of potable water from seawater desalination.
The most common treatment level among WWTFs is secondary, but there are 579 MLD (153 MGD) of primary effluent released into the bay by the SF-SE Water Pollution Control Plant, accounting for 39% of the total effluent volume in the bay area (
Table 3). There are two WWTFs with problematic violations in 2016: SVCW WWTF has a violation for enterococcus and SF-SE Water Pollution Control Plant has three violations for acute toxicity. There are also several violations for BOD and one for CBOD in the region.
Overall, the Bay Area has a moderate need for additional water resources. Local governments have responded to this need for water with a substantial commitment to water reuse and conservation projects. Although no desalination facilities currently exist in the Bay Area, proposals such as the Bay Area Regional Desalination Project have identified multiple potential WWTFs for commingled brine and wastewater effluent discharge to the brackish waters of the Sacramento and San Joaquin Deltas [
22]. Groundwater depletion is not a large contributor to the region’s demand for additional water sources [
3]. In general, the region has no problems with source water quality, but does have high water importation. The 2014–2015 annual water report of the Bay Area Water Supply and Conservation Agency, a joint venture between the Alameda, San Mateo and Santa Clara water districts, estimated that up to 65% of potable water is imported from the San Francisco Regional Water System [
23]. These factors indicate that the Bay Area would benefit from the construction of desalination facilities, and the Bay Area Regional Desalination Project collaborators have come to the same conclusion. Five water agencies are collaborating on this project focusing on treating brackish water for potable water use and have completed feasibility studies [
23].
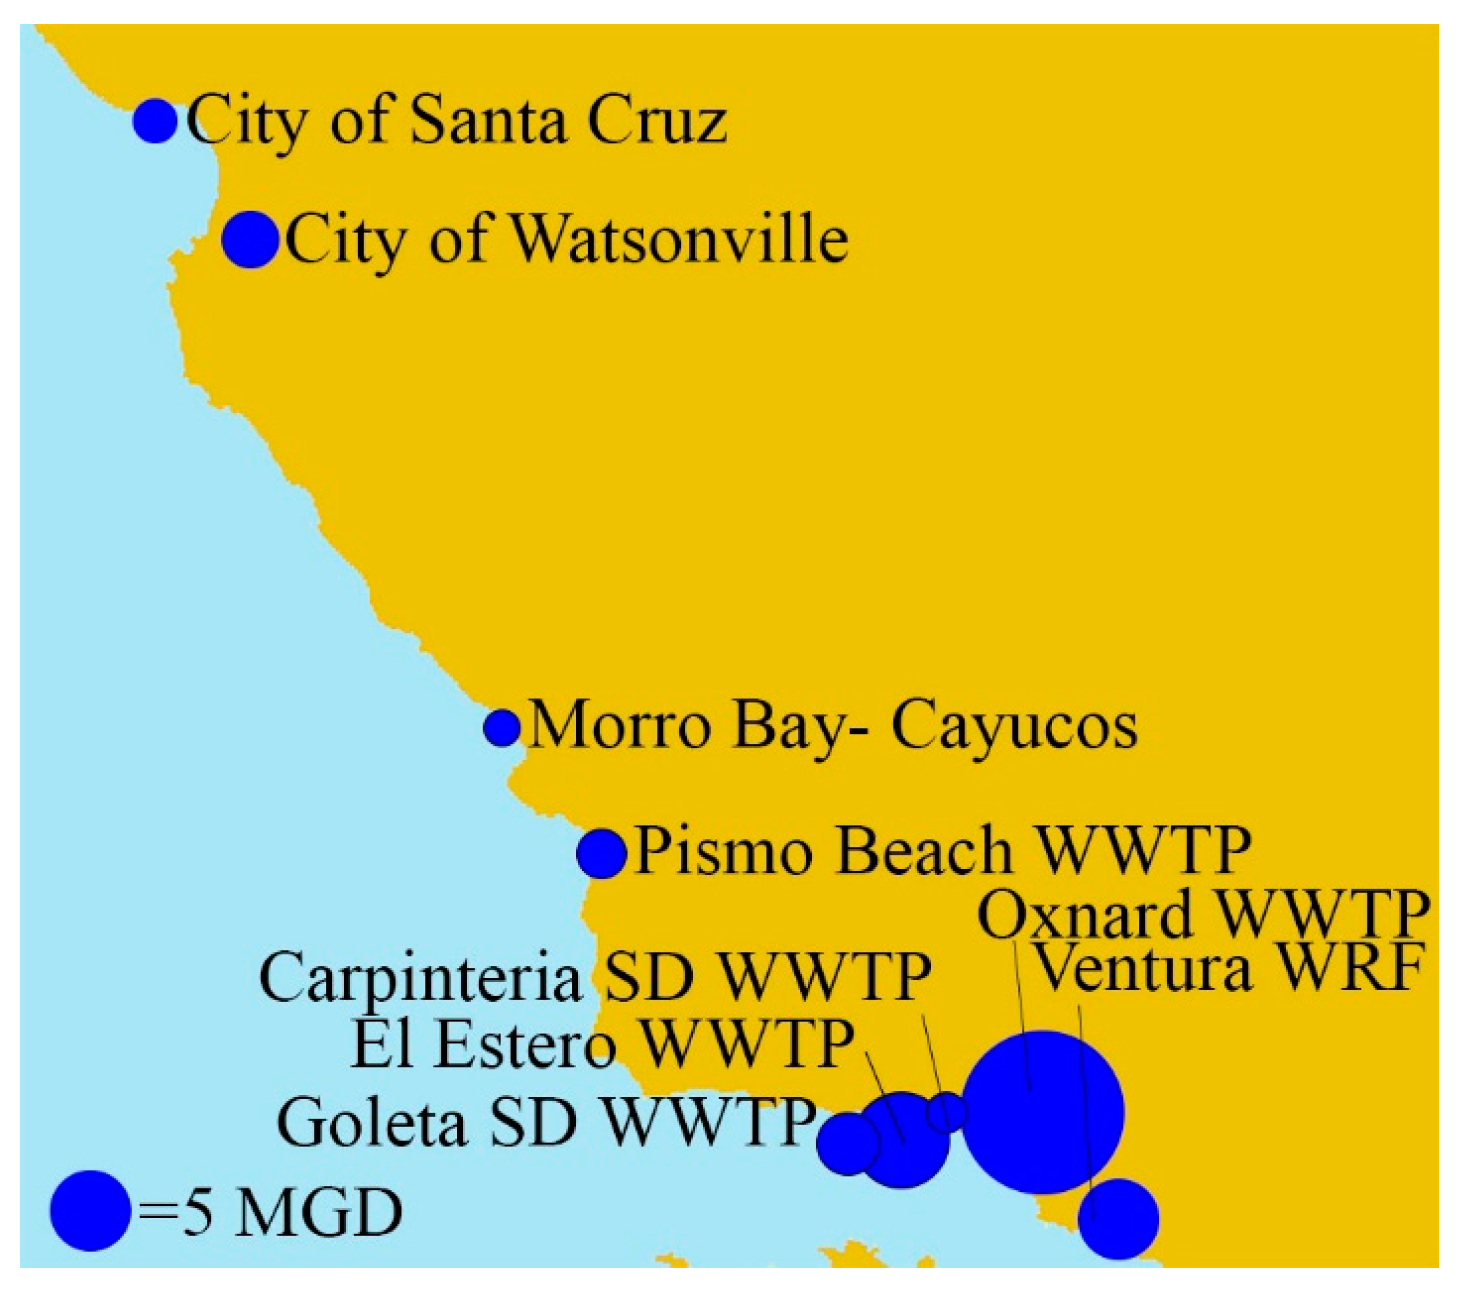
Central Coast region: The Central Coast contains nine WWTFs that discharge more than 3.8 MLD (1 MGD) (
Figure 6). The volume of available effluent increases from north to south in the region, due to the higher population in Santa Barbara and Ventura counties. The average dry weather flow rates vary from 4.2 MLD (1.1 MGD) at the Morro Bay/Cayucos WWTF to 75.7 MLD (20 MGD) at the Oxnard WWTF. Average TDS concentrations in the region vary from 1.3–1.4 g/L. The combined total effluent available is approximately 185 MLD (49 MGD) and could allow for the production of approximately 204 MLD (54 MGD) of potable water from seawater desalination.
All the WWTFs in the Central Coast have the secondary treatment level, except for the Ventura Water Reclamation Facility (WRF), which has tertiary treatment (
Table 4). There were 15 total violations in 2016, 14 of which occurred at the Oxnard WWTF and Ventura WRF. Seven of the violations were for BOD or CBOD concentrations, and the remaining violations were for TDS, pH and total coliforms.
Overall, the Central Coast has a low need for additional water resources. Water districts on the Central Coast import less water than the Bay Area and South Coast regions, but experience some water stress due to groundwater pumping, seawater intrusion and more arid climates towards the southern portion of the Central Coast [
3]. Although regional water demands are met without severe depletion of groundwater resources, desalination is an existing and future resource for potable water in the region, with an operational public desalination plant in Sand City (1.1 MLD or 0.3 MGD) and one in Cambria (1.5 MLD or 0.4 MGD) [
24]. Desalination projects under consideration include four major facilities: both a 36.3 MLD (9.6 MGD) and a 16.7 MLD (4.4 MGD) facility in Marina [
25,
26] and both an 84.4 MLD (22.3 MGD) and a 45.4 MLD (12 MGD) facility in Moss Landing [
27,
28] as the region plans for the future water needs of a growing population [
24]. The overall quality of the effluent suggests that most WWTFs in the Central Coast region would be good candidates for water reuse implementation (
Table 4).
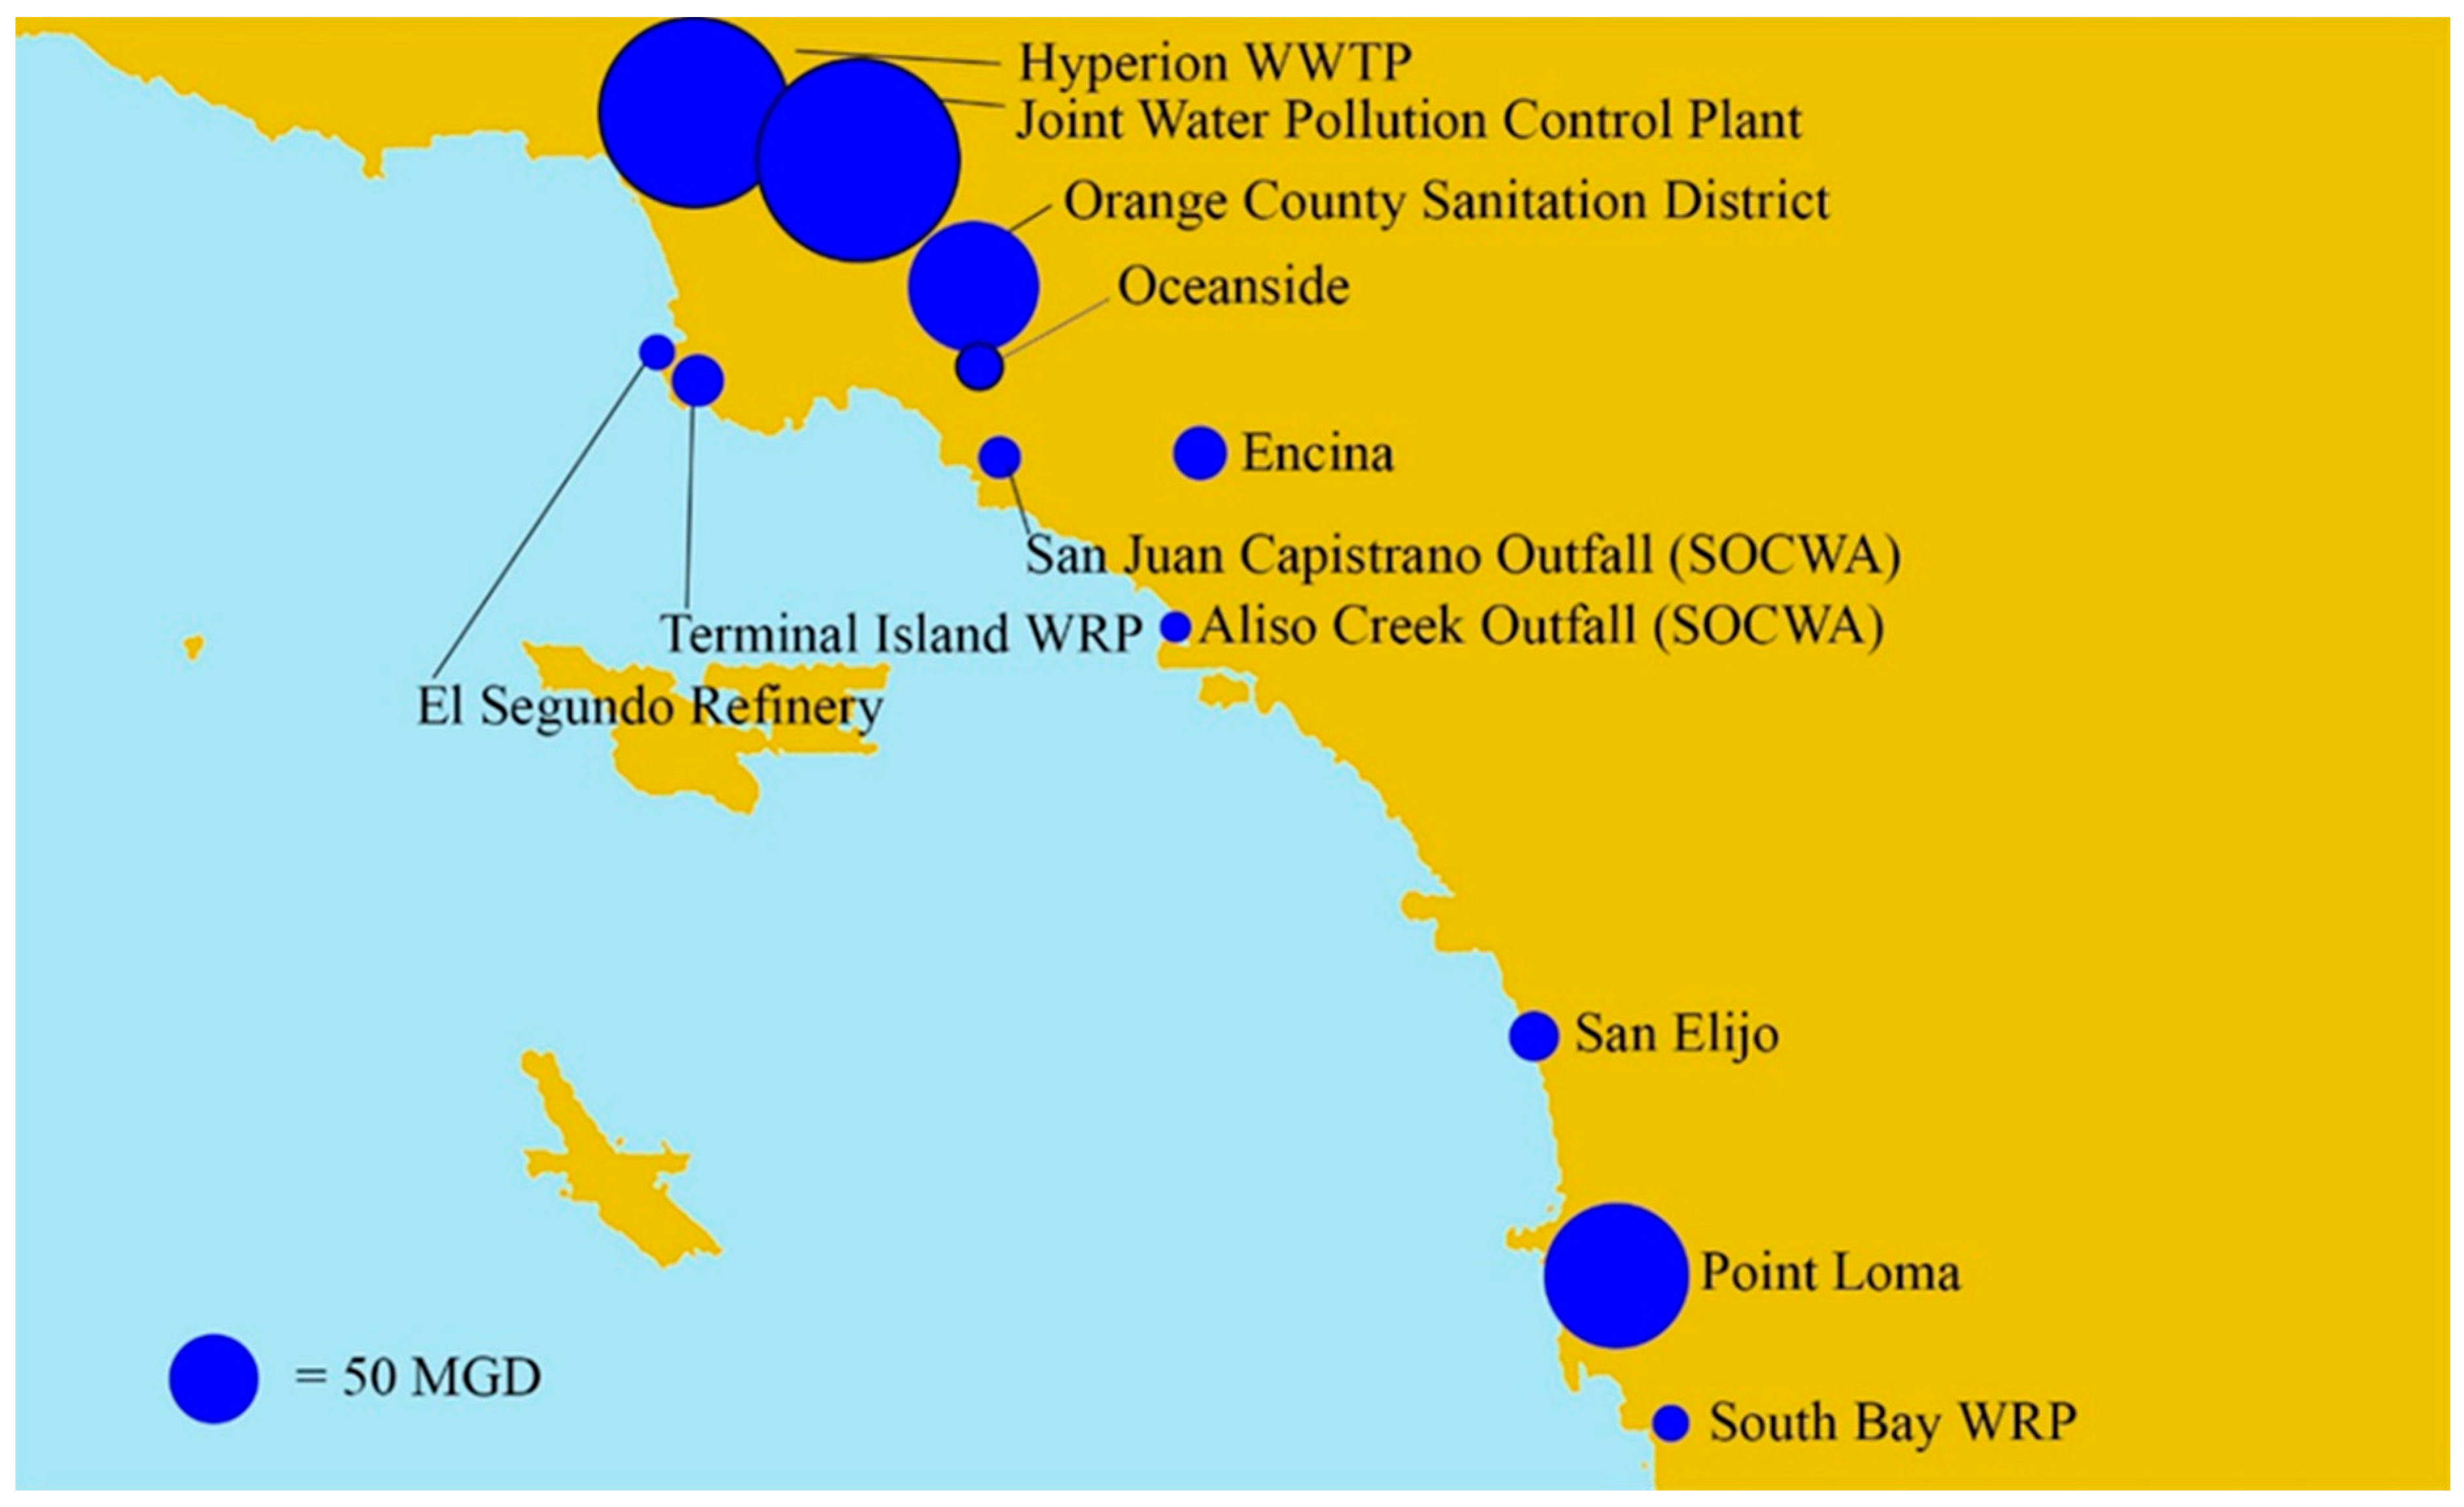
South Coast region: The South Coast is composed of Orange County, Los Angeles County and San Diego County. There are 12 suitable WWTFs in this region that provide a total of approximately 3157 MLD (834 MGD) of ocean-discharged wastewater effluent (
Figure 7). Dry weather flow rates range from 23.5 MLD (6.2 MGD) at the Aliso Creek Outfall to 996 MLD (263 MGD) at the Joint Water Pollution Control Plant in Carson. TDS concentrations vary from 1.0–1.7 g/L. The total available effluent from the South Coast could be used to produce approximately 3486 MLD (921 MGD) of potable water from seawater desalination. Of all the California regions, the South Coast has the largest WWTF effluent volume available for brine commingling and therefore the largest SWRO capacity.
There are three tertiary effluent ocean dischargers in Ventura and Los Angeles counties: San Elijo WWTF, Terminal Island Water Reclamation Plant and El Segundo Refinery, which produce a combined total tertiary effluent of approximately 155 MLD (41 MGD) (
Table 5). Tertiary treatment of effluent saves cost in potable reuse by minimizing pretreatment, and the effluent can also be used for irrigation or other non-potable uses with little or no additional treatment required. Even with tertiary treatment of its effluent, however, Terminal Island Water Reclamation Plant had 16 violations for copper in 2016; crustaceans and bivalve mollusks are particularly sensitive to copper and can experience bioaccumulation and acute, chronic and reproducible toxicities [
29]. There is only one primary level WWTF, located at Point Loma, which discharges approximately 500 MLD (132 MGD) and had four effluent violations in 2016 for Total Solids (TS) and oil in the wastewater.
The South Coast has a high demand for alternative water sources common to all water districts. All of the South Coast regional water stress factors indicate a potential need for desalination that correlates with the dense population and high volume of effluent. The water districts of Los Angeles County have the highest degree of potential need for desalination in this analysis, having poor water quality, high percentages of imported water and existing reuse and conservation in all water districts. Groundwater is generally of medium CASGEM priority in Los Angeles County with the exception of the El Segundo district.
Local governments have implemented independent projects to address the high water needs of the region. Carlsbad’s desalination plant, located north of San Diego, is the prime example of desalination in California, producing 189 MLD (50 MGD) of fresh water. As early as 1964, the South Coast had a steam-powered desalination plant at Point Loma, a district with high water stress and high desalination capacity [
30]. The West Basin Municipal Water District, associated with the 17 sanitation districts in the Los Angeles area, has the greatest demand for additional water resources in coastal California and is an excellent candidate for future desalination projects. West Basin imports most of its water and has been researching cost-lowering options for ocean desalination since 1947. They are considering two desalination facility designs, a 75.7 MLD (20 MGD) and a 227 MLD (60 MGD) plant facility [
31]. The high discharge volumes of the Hyperion WWTF (approximately 973 MLD or 257 MGD) and the Joint Water Pollution Control Plant (approximately 1102 MLD or 291 MGD) make these WWTFs strong candidates for collocating large-sized desalination facilities, each potentially producing over 1041 MLD (275 MGD) of potable water (
Table 5). Seawater desalination facilities of this capacity, although very expensive, are not unreasonable proposals. The largest seawater desalination facility in the world is capable of producing 863 MLD (228 MGD) of fresh water and is located in Saudi Arabia [
32].
In addition to planned and existing desalination facilities, potable water reuse projects have been historically implemented in Southern California. The most notable example is the Groundwater Replenishment System (GWRS) implemented by a partnership between Orange County Water District and Orange County Sanitation District (OCSD). In the GWRS, approximately 379 MLD (100 MGD) of treated secondary effluent from OCSD are utilized for seawater intrusion barrier and aquifer recharge at a competitive cost of
$850/acre-foot. Following the positive experience of the GWRS, the Metropolitan Water District of Southern California and the Sanitation Districts of Los Angeles County recently inaugurated a demonstration 1.9 MLD (0.5 MGD) potable water reuse facility with plans to expand into a full-scale facility in the near future. In this project, up to 568 MLD (150 MGD) of treated wastewater from the Joint Water Pollution Control Plant would be utilized for indirect potable reuse (IPR) [
33,
34].
4. Discussion
The total ocean/bay wastewater effluent that could be available for dilution of brine from seawater desalination in California is approximately 4872 MLD (1287 MGD). Of this total, 1491 MLD (394 MGD), or approximately 31%, have no recorded water quality violations (
Figure 8). About 73% of this effluent comes from WWTFs with secondary treatment. Although only two WWTFs, San Francisco Southeast and Point Loma, discharge primary treated wastewater, they produce approximately 22% of the total coastal wastewater effluent. Conversely, the five WWTFs providing tertiary treatment contribute only approximately 4% of all coastal wastewater effluent.
The majority of the effluent violations incurred by the two primary treatment WWTFs in 2016 were for solids and acute toxicity, which indicates that these older primary treatment facilities are not achieving their main goal of reducing solids to acceptable levels. As expected, secondary-treated effluent has a variety of violations in 2016, but few solids violations, and many violations for nutrients and organic compounds, which could be mitigated by upgrading facilities to tertiary systems designed to reduce those compounds. Similarly, tertiary-treated effluent has violations for several compounds, of which metals are the largest component. The percent of the total effluent with violations in 2016 for primary, secondary and tertiary treatment levels is similar (65%, 70% and 62%, respectively) and overall is approximately 69%.
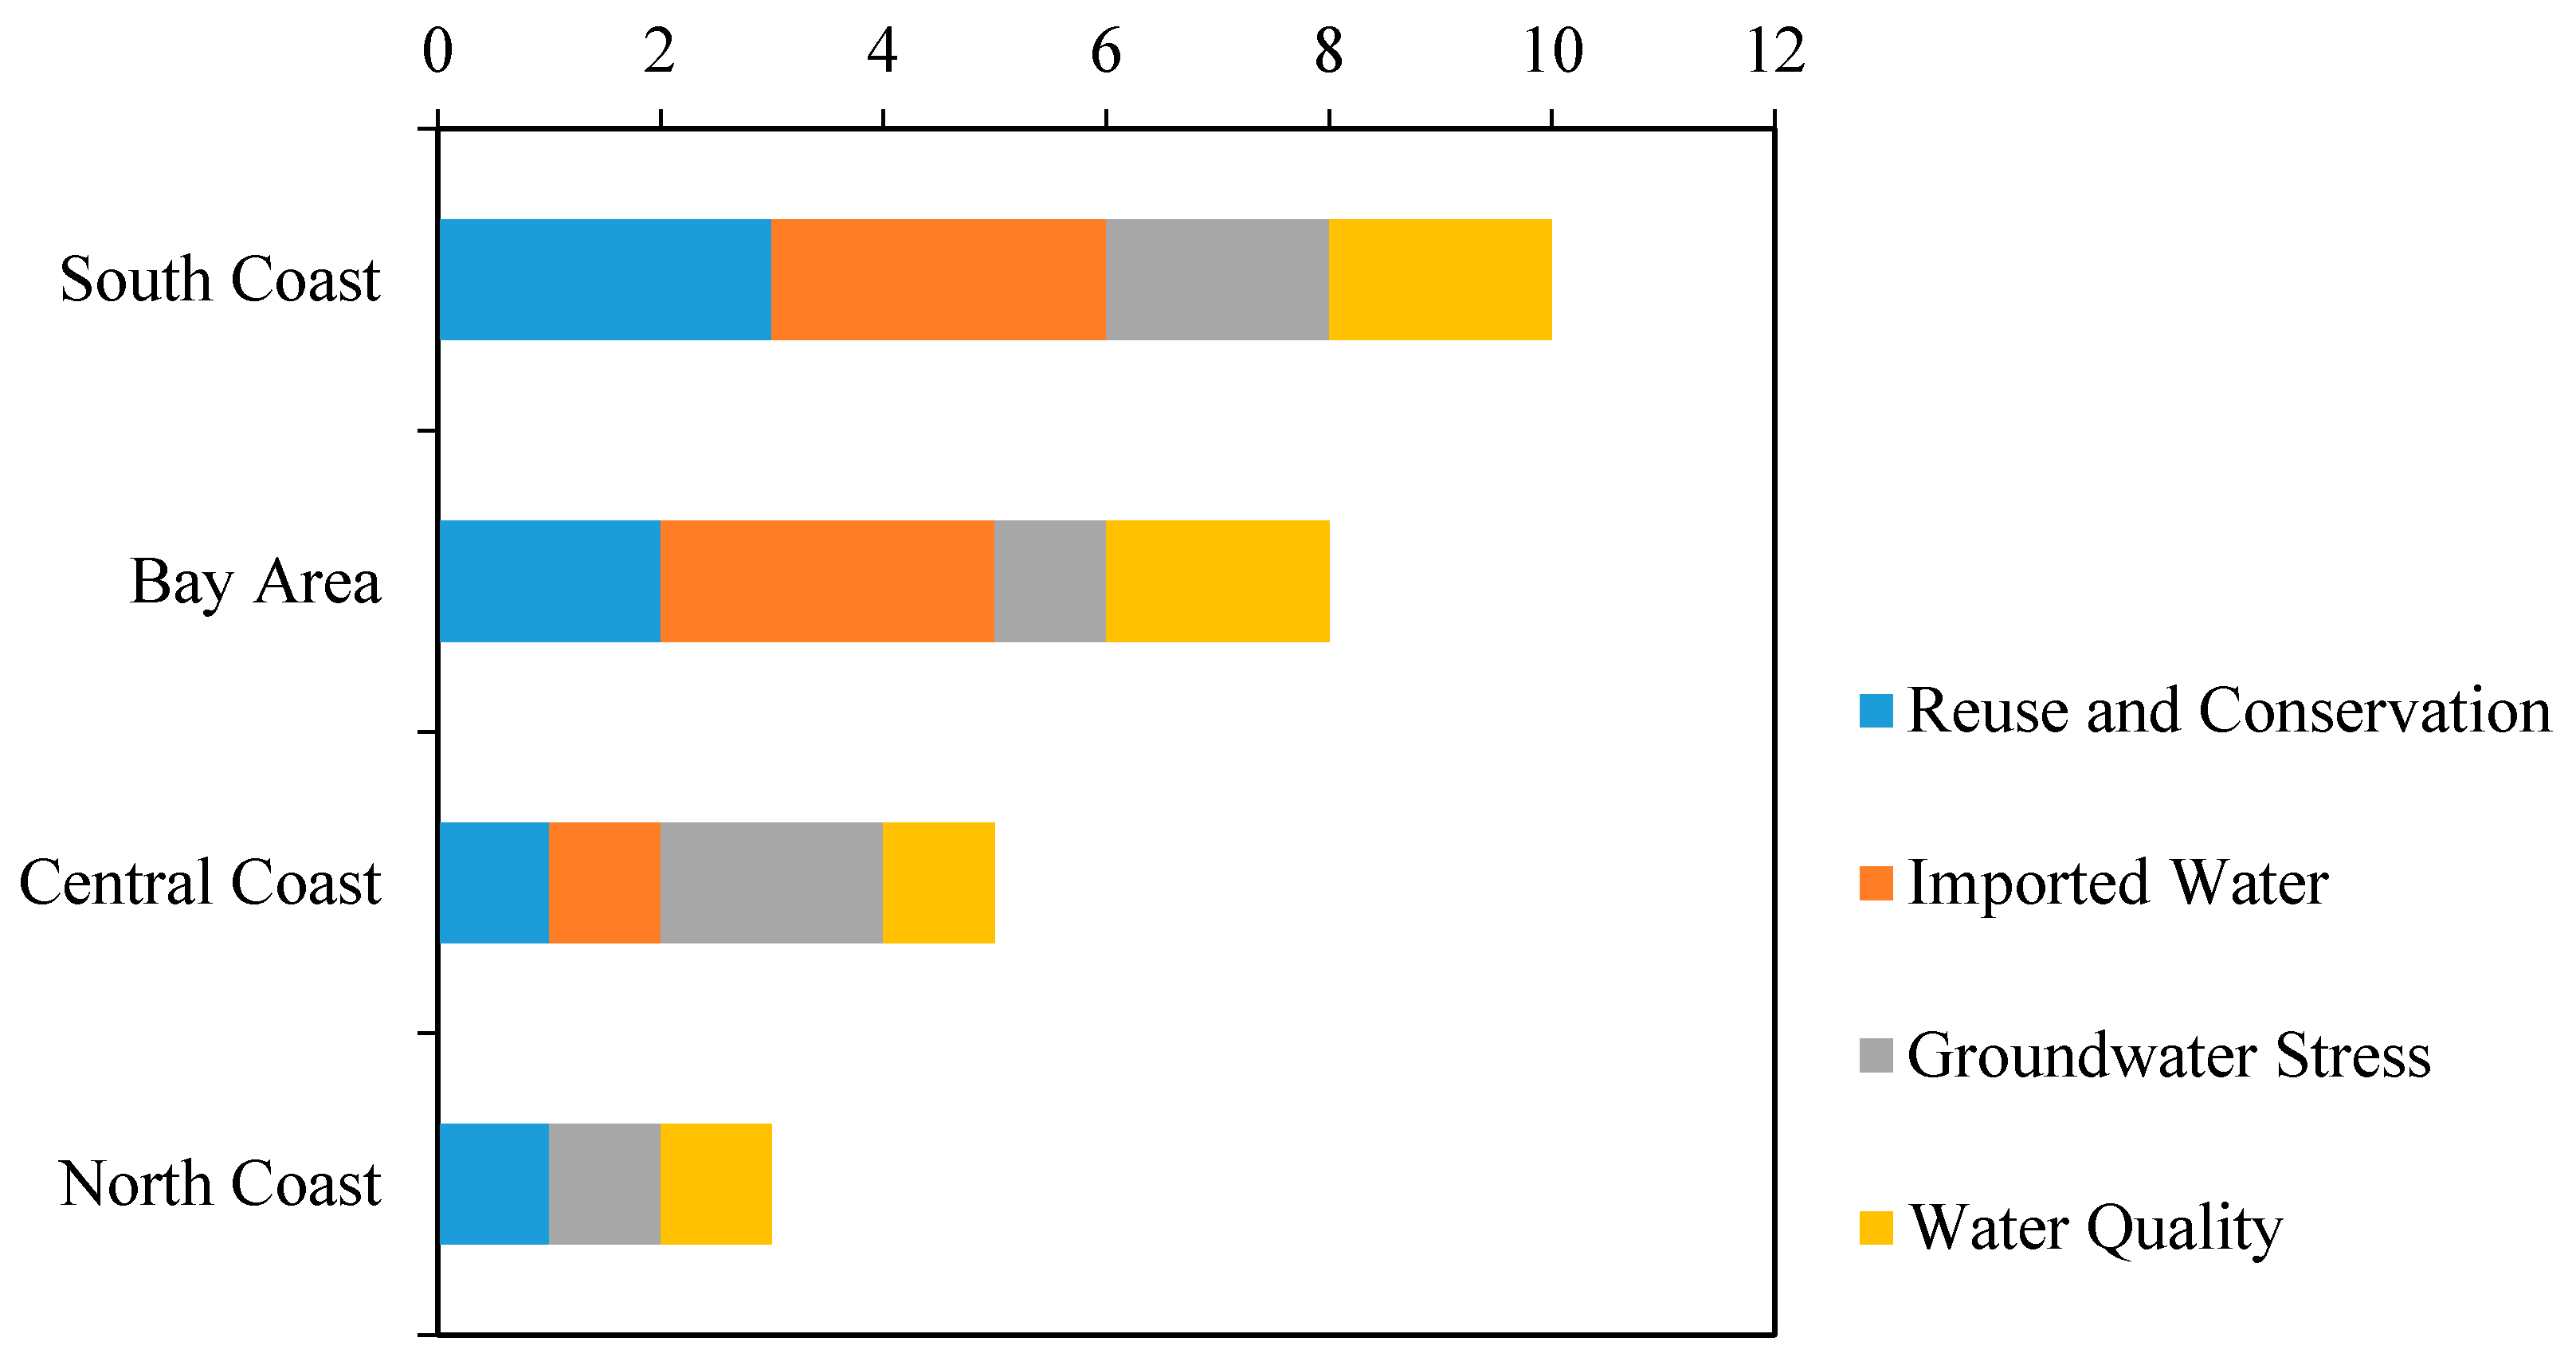
The stress on potable water resources in coastal regions, analyzed for each region based on water importation, groundwater concerns, water reuse and conservation projects and water quality, was used to determine the need for seawater desalination (
Figure 9). The North Coast region has a sufficient high-quality water supply, low to moderate groundwater prioritization and low to moderate water reuse. The Bay Area region is a major importer of water and has implemented numerous reuse and conservation projects. In general, its groundwater depletion level is low, and its source water quality is high. The regional need for desalination is moderate, and the Bay Area Regional Desalination Project is pursuing brackish water desalination options for potable water use [
22]. The Central Coast has low water importation, good water quality and few existing water reuse projects, but there is high seawater intrusion and groundwater stress [
3]. The need for desalination is classified as low due to these factors, but local water districts are pursuing SWRO to ease groundwater stress and saltwater intrusion [
35]. The South Coast region imports the greatest percentage of its water. Driven by drought and interest in a reliable local water supply [
36], water districts and counties have implemented significant wastewater reuse and conservation projects [
37]. Water quality problems are most serious in Los Angeles County, based on the eSMR reports of violations for 2016. San Diego County has partially responded to water stress with the desalination facility in Carlsbad, and Orange County has responded with advanced wastewater treatment for IPR.
When comparing seawater desalination projects with water reuse in California and other global locations with high need for alternative water sources, the primary concerns are negative environmental impacts, economic considerations and the high energy costs of SWRO. The high capital investment and operation and maintenance costs of developing SWRO facilities can be offset by the end user paying for desalinated water [
38]. Utilizing WWTF effluent to dilute brine from SWRO addresses the primary environmental impacts associated with SWRO and could generate more potable water for the end user than water reuse.
SWRO is an advancing industry with rapid growth and development of new technologies to improve plant efficiency, reduce environmental impacts and reduce the energy requirements by 30–40% in the future. For example, the “Mega-Ton Water System” full-scale pilot project operating as part of SWRO research in Japan has been able to reduce energy consumption by 20% by implementing new membrane technologies [
39]. Meanwhile, Saudi Arabia, the world’s largest producer of desalinated water, is researching the impacts of integrating the demand for desalination with the country’s transition to a 100% renewable energy power system by 2050 [
40]. Operating a SWRO facility on renewable energy would significantly reduce the environmental impacts associated with the energy requirements for seawater desalination.
Furthermore, with current SWRO technology, the energy costs of SWRO are comparable to the energy costs associated with water reuse [
7]. While potable water reuse is approximately 20% less costly than SWRO (
$1.4 versus
$1.8 per m
3 or
$1750 versus
$2250 per acre-foot. in 2015 U.S. dollars [
41]), the recovery of potable water from the effluent stream via any reuse treatment scheme would be a fraction, although large, of the available wastewater and therefore much less than the production of potable water from SWRO. The recovery volume for coastal communities is likely to offset the economic disadvantages of SWRO.
5. Conclusions
Overall, the seawater desalination capacity of coastal California, constrained by available wastewater effluent to commingle with waste brine, is approximately 5326 MLD or 1407 MGD. This production of potable water is equivalent to 35% of the approximately 15 MLD (4 MGD) of total domestic water use in the state [
42]. The desalination capacity of the most densely-populated regions of California (1613 MLD (426 MGD) in the Bay Area and 3486 MLD (921 MGD) in the South Coast) happens to be where the greatest need is. If Californians use approximately 400 Liters (105 gallons) per day of potable water [
42] and the value is decreasing with conservation, potable water from seawater desalination in the Bay Area and in the South Coast could satisfy the average daily needs of approximately 4.1 and 8.8 million people, respectively.
Considering the relatively high quality of the wastewater effluent in coastal California, potable water reuse could also be a viable alternative to SWRO [
35]. However, SWRO is capable of “recovering” almost 110% of the WWTF effluent volume under the Ocean Plan’s commingling recommendations. For the effluent available on the coast of California, even a reuse system such as the water recycler on the International Space Station with 93% recovery [
43,
44] would only produce approximately 4527 MLD (1196 MGD) of potable water, which is 799 MLD (211 MGD) less than the 5326 MLD (1407 MGD) from desalination. Seawater desalination would produce approximately 18% more potable water from wastewater effluent than the best reuse systems and could be the preferred alternative where large volumes of additional fresh water are needed.
With continuing advances in efficiency for SWRO processes driven by the need for additional water resources in drought-stricken countries across the world, SWRO is likely to maintain a central role in the effort to develop additional sources of water in California, and especially in Southern California, where the highest need exists. SWRO is most beneficial in areas near the coast, while water reuse projects are more suitable for inland WWTFs. Jointly assessing the availability of suitable wastewater for brine commingling with the stress on potable water resources will help to prioritize the implementation of SWRO globally. The advancements in membrane technologies, improved economics and reduction in energy demands for membrane processes should benefit both inland water reuse facilities and coastal SWRO plants to generate potable water in drought-stricken areas of the world, as well as California.


