Assessing Eutrophication Potential of a Freshwater Lake by Relating Its Bioproductivity and Biodiversity: A Case Study of Lake Wilson on Central Oahu, Hawaii

1
Department of Civil Engineering and Water Environment Research Center, National Taipei University of Technology, Taipei 10608, Taiwan
2
Department of Civil and Environmental Engineering and Water Resources Research Center, University of Hawaii at Manoa, Honolulu, HI 96822, USA
*
Author to whom correspondence should be addressed.
Water 2018, 10(3), 296; https://doi.org/10.3390/w10030296
Submission received: 30 October 2017
/
Revised: 4 March 2018
/
Accepted: 6 March 2018
/
Published: 9 March 2018
(This article belongs to the Special Issue Eutrophication Management: Monitoring and Control)
Abstract
:Algal bloom in a freshwater lake is a rapid increase of aquatic plants, which disrupts the ecological balance and its potential for beneficial uses. This problem has been managed by relating the trophic levels of a lake with nutrient loading. This traditional management approach is less than satisfactory as it neglects considering the intricate relationship between nutrient loading and the algal community. As a result, it often fails to detect an imminent algal bloom and fails to formulate and implement timely remedial measures. The advancement of modern molecular biosciences has provided an opportunity to improve this traditional approach. In this study, field and laboratory experiments on lake bioproductivity and biodiversity were conducted in Lake Wilson on central Oahu, Hawaii. Bioproductivity or algal productivity was evaluated in terms of the rate of chlorophyll growth in the lake water, and the biodiversity or genetic biodiversity was evaluated by using the method of denaturing gradient gel electrophoresis of the algae species and the Shannon index. Research results indicated that eukaryote communities in Lake Wilson were more diverse under the mesotrophic state of algal productivity than those under the oligotrophic and eutrophic states. Therefore, the reduction of the biodiversity of a mesotrophic lake can be used in water quality management as a warning sign of an imminent algal bloom.
1. Introduction
Many researchers have assessed the problem of lake eutrophication and have tried to formulate water quality management strategies to control the problem by either reducing the nutrient loading or by altering hydrodynamic characteristics [1,2]. One popular method of lake water quality assessment is the Vollenweider phosphorus loading plots, which relates a lake’s nutrient loading with its trophic state [3]. Another simple assessment method is the Carlson Index, which determines the trophic state of a lake based on three independent variables of chlorophyll, total phosphorus (TP), and Secchi depth or transparency [3]. More detailed lake assessments have been conducted using water quality models of varying levels of sophistication [4]. These traditional methods do not consider the intricate relationships between nutrient loading and the algal community structure and species composition, or biodiversity and thus, further improvement of water quality assessment of freshwater lakes can be achieved by a better understanding of their biodiversity as well as bioproductivity [5].
Phytoplankton diversity in a freshwater lake can be examined in terms of species biodiversity and genetic biodiversity [5,6]. The species biodiversity in a freshwater lake denotes the number of phytoplankton species and the abundance of each species that live in the lake. Generally, phytoplankton in freshwater lakes has few morphologically distinct features, and thus, it is difficult to be discriminated and numbered [7]. The advancement of modern molecular biosciences prompted the development and application of genetic biodiversity for lake water quality assessment. The genetic biodiversity is based on gene sequence to denote the heritable variation within and between populations of organisms. It can provide much more invaluable species information than species diversity [8,9,10]. One of the popular deoxyribonucleic acid (DNA) based methods for the detection and identification of aquatic microorganisms is denaturing gradient gel electrophoresis (DGGE) method, which is a molecular fingerprinting method that separates polymerase chain reaction (PCR)-generated DNA product [11,12].
Recent studies on lake biodiversity show that the eukaryotic biodiversity of a lake varies with its trophic state. In one of these studies, Lefranc et al. [13] analyzed the genetic biodiversity of small eukaryotes in several oligotrophic, mesotrophic, and eutrophic lakes, and found that the population composition of eukaryotes in these lakes varied with the trophic states [13]. A similar study was later conducted by Zhao et al. [14], and they found that the diversity of picoeukaryotes in a freshwater lake was much greater when the lake was under mesotrophic state than under oligotrophic state [14].
Several studies investigated the structure of planktonic eukaryotic community under varying trophic environmental conditions as defined by the concentrations of phosphorous and chlorophyll a (Chl a) [15,16]. These studies came up with a few hypotheses to explain the biodiversity variation with trophic states. Generally, these hypotheses suggest that genetic biodiversity is regulated by many interactive factors, such as climatic change, spatial heterogeneity, and the availability of nutrient and solar energy. The biodiversity can be either positively or negatively correlated with bioproductivity. Six patterns of the change of biodiversity with algal productivity were observed and they are: random, positive, flat, negative, hump-shaped, and U-shaped [17,18]. Among them, however, the hump-shaped relationship of biodiversity-bioproductivity with the peak of diversity occurring at the intermediate bioproductivity level is the most widely observed pattern [19]. All of these previous studies were conducted by analyzing field samples that were collected from freshwater lake and coastal marine waters.
A research framework integrating modern molecular biosciences with environmental engineering was developed by a research team in the University of Hawaii at Manoa (UHM). As the initial phase of this framework, field and laboratory experiments were conducted by this study to extend previous studies on the relationship between the bioproductivity and genetic biodiversity of freshwater lakes. Field water samples were collected from an eutrophic freshwater lake, Lake Wilson on Central Oahu, Hawaii for the analysis of phytoplankton growth and genetic biodiversity. In addition, three microcosms or bioreactors were constructed to simulate Lake Wilson under varying trophic states. Laboratory experiments with microcosms allow for detailed analysis of genetic biodiversity and corresponding bioproductivity. The objective of this study is to show that genetic biodiversity should be considered for achieving more effective lake eutrophication control and water quality management, and to present a practical procedure for the determination of lake biodiversity.
2. Materials and Methods
2.1. Field Investigation
2.1.1. Study Site
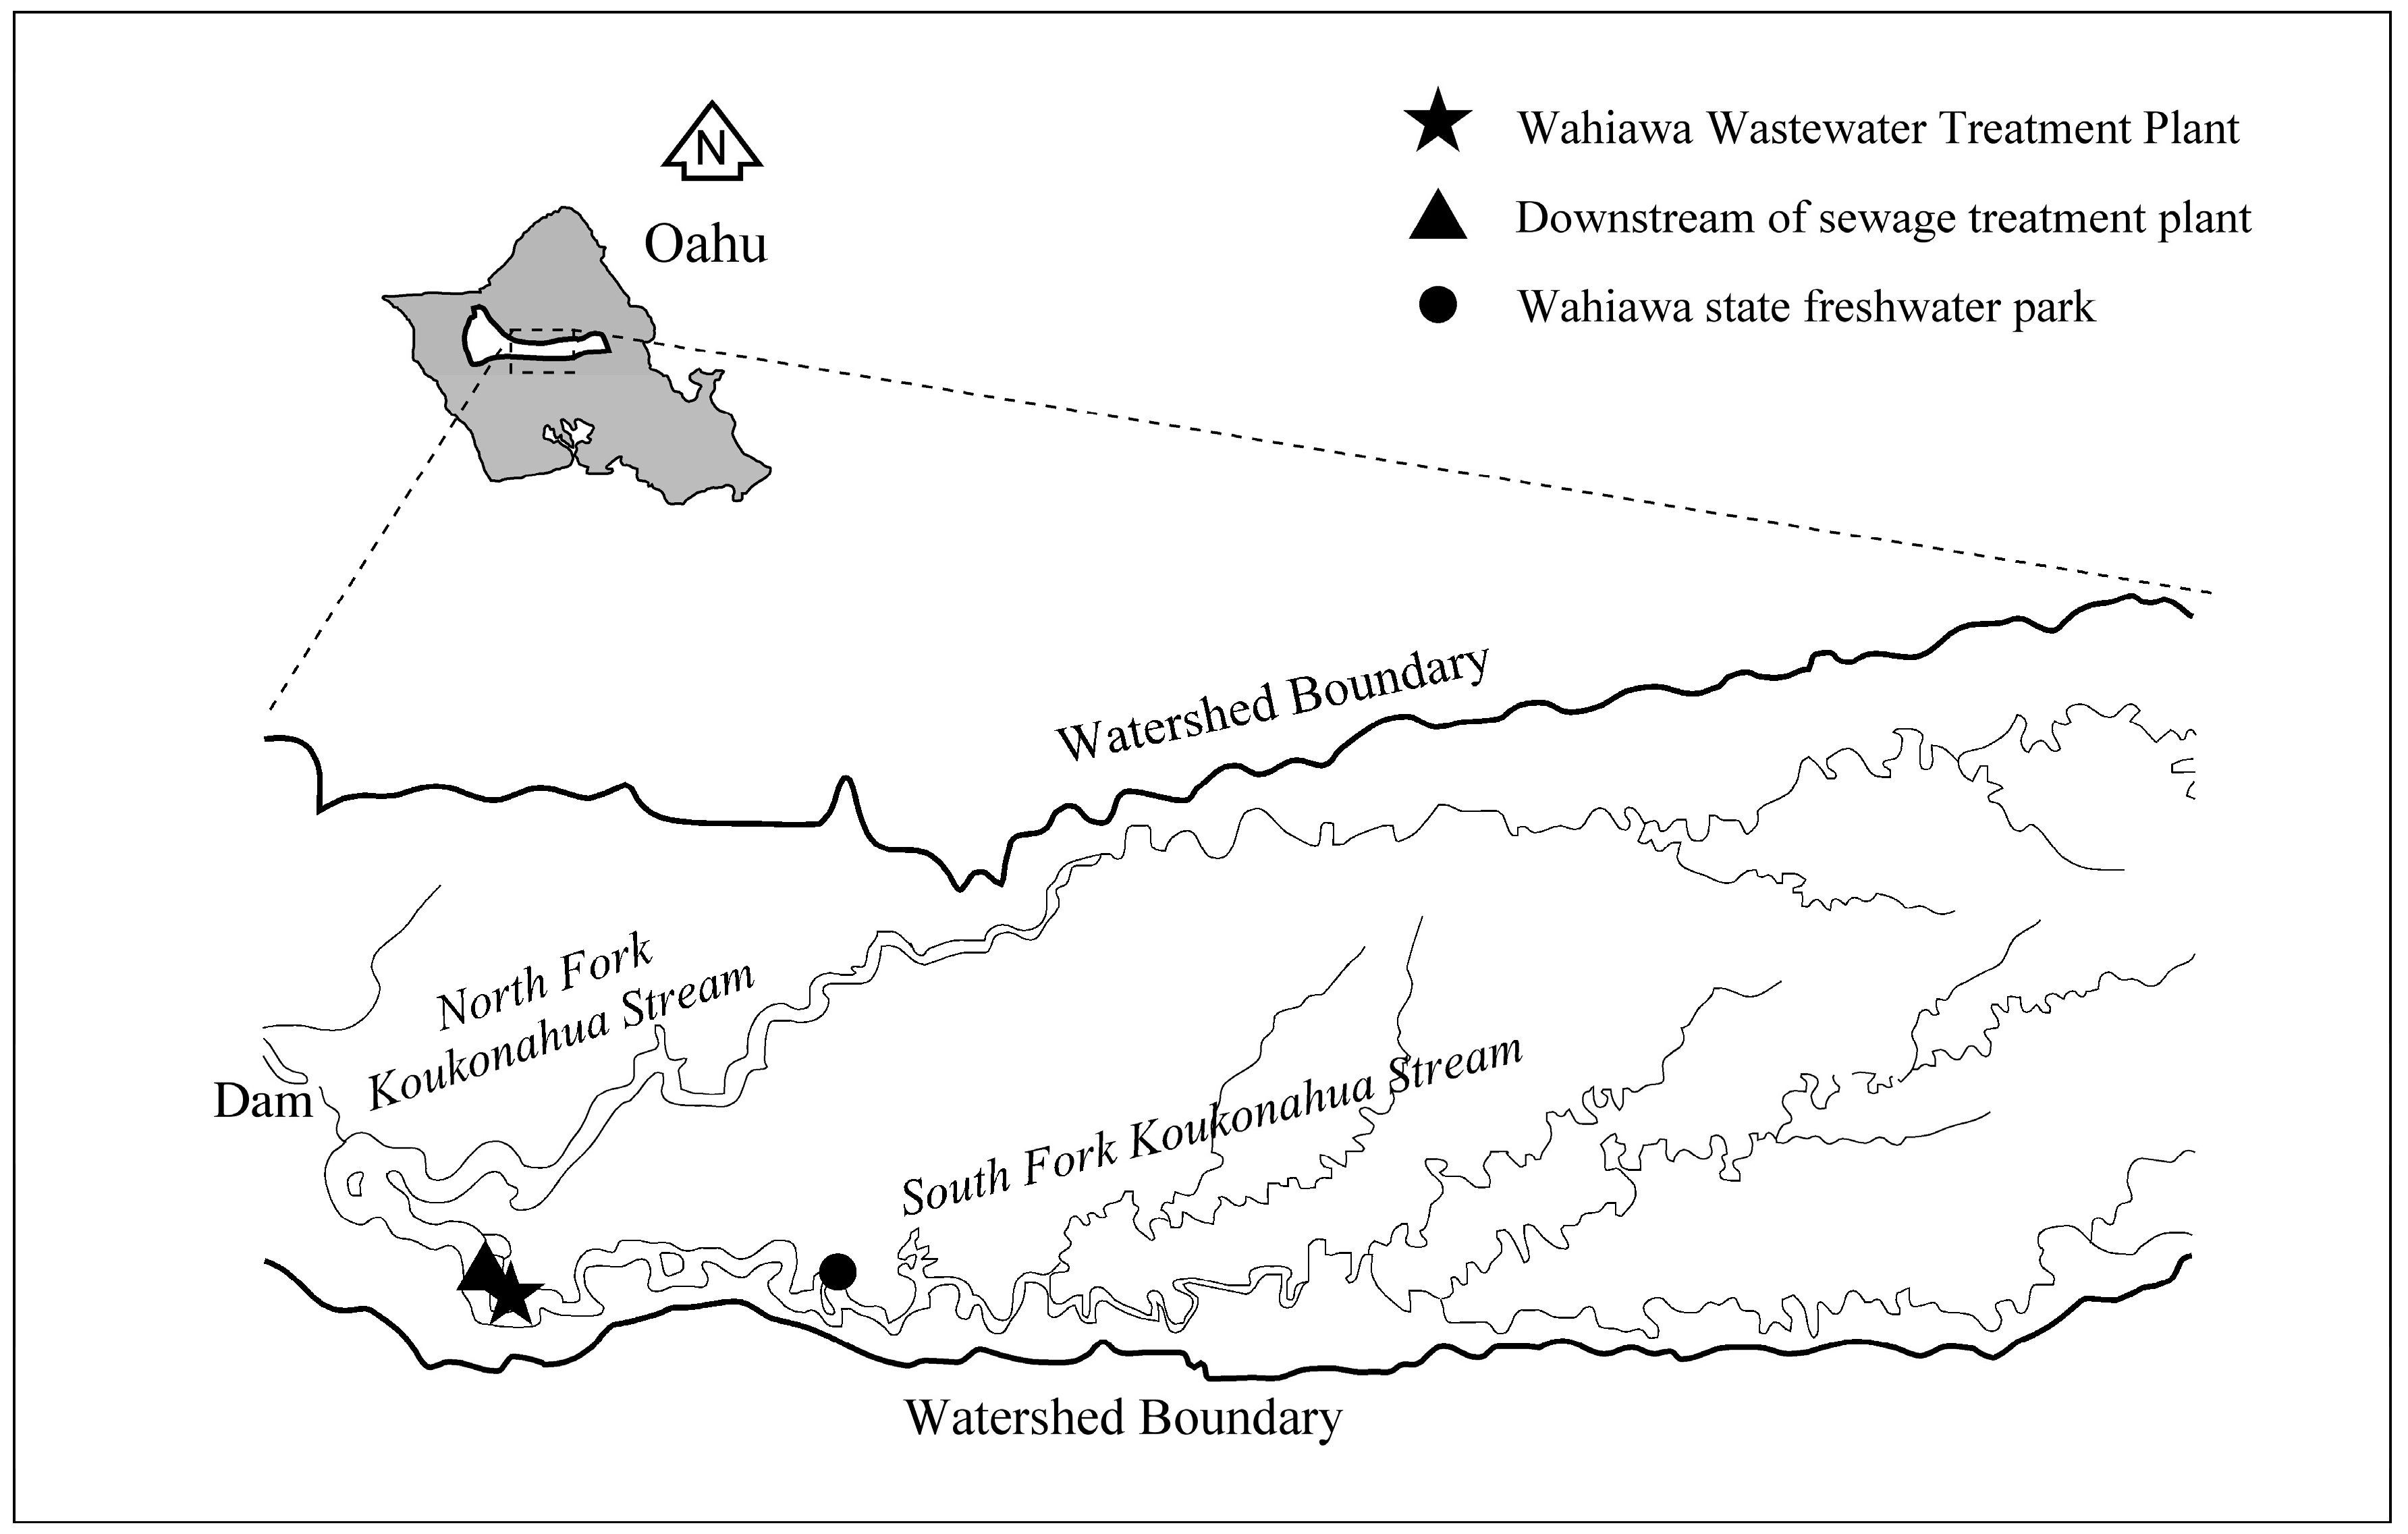
Lake Wilson (also known as Wahiawa Reservoir) in Central Oahu, Hawaii was selected as a study site to examine the relationship between bioproductivity and biodiversity of freshwater lakes subject to eutrophication stress. Lake Wilson was formed by a dam to withhold the impounded water from the North and South Forks of the Koukonahua Stream (Figure 1). As the largest freshwater body on Oahu, Lake Wilson is used for recreation, fishing, and irrigation. Over the years, Lake Wilson has experienced the problems of algal bloom and fish toxicity [20], with the most serious episode occurred in 2002 when the lake surface was almost entirely covered by the weed Salvinia molesta. Several studies were conducted in order to develop a comprehensive Lake Wilson water quality management plan. More recently, the total maximum daily loads (TMDLs) of pollutants that were entering Lake Wilson were determined by the State of Hawaii, as required by the Section 301 of the federal Clean Water Act [21].
2.1.2. Field Experiment
Based on a preliminary lake-wide survey, two sampling stations in Lake Wilson—one downstream of the sewage treatment plant (DSTP), the other in the Wahiawa State Freshwater Park (WSFP)—were slected for this study (Figure 1). A field water quality survey was conducted to measure in situ water quality conditions in terms of dissolved oxygen, temperature, and turbidity. During the survey, water samples were also collected at the two sampling stations and were delivered to the Environmental Engineering laboratory at UHM for further bioproductivity and genetic biodiversity analysis.
Water samples were collected offshore from the lake surface at sampling stations DSTP and WSFP on 12 April 2011. Water Samples were kept in a container with ice and were delivered immediately to the Environmental Engineering laboratory at UHM for further algal productivity and genetic biodiversity analysis. In the laboratory, field samples were kept at 4 °C before being analyzed.
At each analysis, 30 mL of water sample was filtered through a 0.45 m pore-size hydrophilic mixed cellulose ester filter (Pall Life Science). The procedure 10200 H of the Standard methods was used in the measurement of Chl a. The Chl a was extracted with the acetone as solvent. The algal pigments with the extracts were then determined with a spectrophotometer. The quantification of Chl a was achieved by adsorption measurements at three different wave lengths of 664, 647, and 630 nm, using a spectrophotometer (DR/4000, HACH Company, Colorado, USA). Soluble reactive phosphorus (SRP) and TP concentration were measured daily by using a PhosVer 3 kit and a DR/4000 Hach spectrophotometer. Total nitrogen (TN) was measured using a TOC-VCPN instrument (Shimadzu Corporation, Kyoto, Japan), based on the oxidative combustion-chemiluminescence mechanism. Total carbon (TC), inorganic carbon (IC), and total organic carbon (TOC) were measured using a TOC-VCPH/CPN instrument (Shimadzu Corporation, Kyoto, Japan). Total suspended solids were determined based on the Standard Method 2540 D.
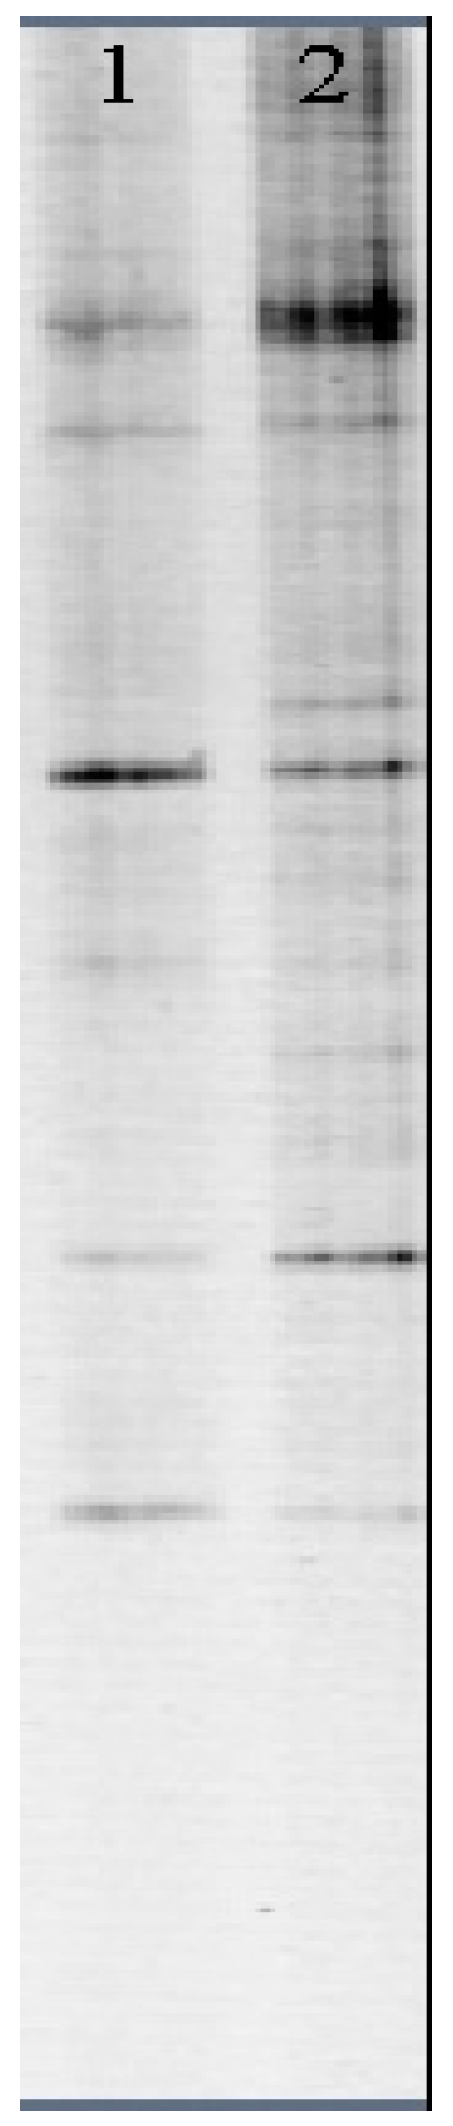
The DGGE profiles of the DNA fragments from the water samples that were collected at the two sampling stations were amplified and the results are shown in Figure 2. Detailed results and discussion are shown below in Section 3.1.
2.2. Laboratory Investigation
2.2.1. Laboratory Apparatus
To study algal bioproductivity, three algal microcosms or bioreactors were constructed and were operated in the UHM Environmental Engineering laboratory to simulate the biological growth in Lake Wilson. Each of the three algal microcosms was a rectangular tank with a volume of 0.015 m3 and a surface area of 0.045 m2. The hydraulic overflow rate (q) and areal loading of total phosphorus (TP) () were selected to simulate different trophic states based on the Vollenweider plots [22]. During the experiments, a sterile growth medium at varying nutrient concentrations and flow rates was continuously fed through microcosms. Materials inside the microcosms were stirred thoroughly and continuously to make these microcosms as completely stirred tank reactors (CSTRs).
TP was used to control the trophic states within the algal microcosms and was applied with a nitrogen-to-phosphorus ratio of higher than 7.2 [3]. Bold’s basal medium (BBM) [23] was adopted for algae cultivation to create the limited-nutrient condition of phosphorus. The test apparatus was continuously irradiated at 8900 W/m2 with the metal-halide lamp (400 Watt, GE Multi-Vapor Lamp, General Electric Company, Boston, MA, USA). The inoculums of algae were introduced from the Lake Wilson water and were added to the three microcosms using an inoculum to BBM ratio of 1:10.
2.2.2. Laboratory Experiments
The Lake Wilson water samples used in the preparation of the initial conditions in three microcosms were collected on 13 April 2011 at WSFP. The BBM were autoclaved and sterilized at 121 °C for 20 min before use. The initial concentrations of Chl a used were 4.4 μg/L. The initial phosphorus concentrations used were 5 μg/L, 15 μg/L, and 60 μg/L in terms of K2HPO4 for three microcosms. During the laboratory experiments, three samples were taken daily at the same time from each microcosm, and later analyzed. The concentrations of chlorophyll a (Chl a), total organic carbon (TOC), total suspended solids (TSS), total nitrogen (TN) in the algal microcosms were measured for eash sample by following the same procedure as given in Section 2.1.2. Soluble reactive phosphorus (SRP) and TP concentration were measured daily for only one water sample by using a PhosVer 3 kit and a DR/4000 Hach spectrophotometer.
The DGGE profiles of the DNA fragments from the water samples collected from the three microcosms were amplified. The deatiled results and discussion are given below in Section 3.2.3.
2.2.3. Bioproductivity Determination
Because microcosms are completely mixed systems, the algal bioproductivity can be calculated by the following mass balance equations:
where Xi = input Chl a concentration (mg/m3), X = Chl a concentration (mg/m3), V = volume of reactor (m3), Q = flow (m3/day), rn = the change of Chl a concentration during a unit time (mg/m3/day), rs = algal net growth rate (day−1), μg = algal gross growth rate (day−1), and λl = algal net loss rate (day−1).
If the input Chl a concentration (Xi) is assumed to be close to zero and Q/V is defined as dilution rate (D), then rn can be calculated by Equation (4).
Algal bioproductivity can be expressed as Pr (mg/m2/day) based on the definition: The changes in biomass as Chl a of algae occur in a given area over a photoperiod. The Pr (mg/m2/day) of areal basis can be formulated as:
The area (AL) is determined by water volume divided by the depth (z) of the euphotic zone, which assumes that the water volume is under a condition of uniform algal density and light intensity. Based on Equation (5), Pr (mg/m2/day) can be calculated by Equation (6) in a microcosm. Average algal bioproductivity (, mg/m2/day) is determined by PT/T.
where rn can be calculated by Equation (4) based on the mass balance model in a microcosm, X is Chl a biomass concentration of (mg/m3). In Equation (7), the integrated term, , is the amount of areal algal product (PT) forming over T period. Using Equation (8), PT can be approximately calculated.
In this study, algal productivity of three microcosms were calculated by using experiemtal data of daily Chl a data (See Section 3.2.1). The calculation procedure consists of the following steps:
- Calculate the rate of change of Chl a concentration or dX/dt, X is the Chl a concentration.
- Calculate the washout terms of three microcosms or DX. Dilution rate D is defined as , the retention time of the three microcosms were regulated to be 4.8, 8.6, and 10.4 days for oligotrophic, mesotrophic, and eutrophic microcosms, respectively.
- Based on steps (1) and (2), calculate by Equations (4) and (6).
- Calcualte Cumulated areal algal product (PT, mg/m2) by Equation (8). Calculated results are shown in Section 3.2.2.
- Finally, average algal bioproductivities (, mg/m2/day) in the three microcosms was determined as PT/T.
2.2.4. Genetic Biodiversity Determination
DNA extraction. During the experiments, water samples at a volume of 30 mL were collected from the sample receivers of a lgal microcosms, and were immediately filtered through a 0.45 m pore-size hydrophilic mixed cellulose ester filter (Pall Life Science). The filter was kept in a 1.7 mL microcentrifuge tube (VWR) and stored at −75 °C until nucleic acid extraction was conducted. The cetyl trimethyl ammonium bromide (CTAB) base protocol of nucleic acid extraction [24] was used in this research. The nucleic acid extracts were then stored at −20 °C until being further analyzed.
DGGE experiments. After extracting the nucleic acid, DNA fragment was performed in a PTC 100 Thermal Cycler (MJ Research). The 18S rDNA gene were amplified by the primers of F1427GC (5′-CGC CCG CCG CGC CCC GCG CCC GGC CCG CCG CCC CCG CCC CTC TGT GAT GCC CTT AGA TGT TCT-3′) and R1616 (5′-GCG GTG TGT ACA AAG GGC AGG G-3′). The primers are specific for eukaryotic aquatic microorganisms [25]. DGGE was performed using the procedure that was developed previously by Muyzer et al. [26]. TotalLab software was used for banding detection. Firstly, lanes were created automatically. Each lane represents one sample. Automatic band detection was then performed by setting the minimum slope 240 and noise reduction 5. The peaks less than 1% of maximum peak were excluded. Background noise was subtracted by using rolling disc with a radius of 200.
Determination of eukaryotic biodiversity. Image of the DGGE gel, as shown in Figure 2, was used to determine the lake biodiversity by the Shannon Index [27]. The banding data of the DGGE gel was digitized by using the TotalLab software (TotalLab Quant, Nonlinear, Newcastle upon Tyne , NE1 1PG , UK). The digital banding data consisted of the number of bands and the peak height intensity. Equation (9) was then used to calculate the biodiversity based on the importance probability of band (pij) at i pixel position on j lane. The pij = (ni/Nj) was determined by the intensity of the peak height (ni) of the ith band divided by the total peak height (Nj) of the intensity of the jth lane [28]. Digital banding data of the DGGE gel can be applied in the fingerprinting analysis [29,30]. The formula for calculating the lake biodiversity by the Shannon index is:
where H′ = Shannon index, (pij) = importance probability of band, (ni) = peak height of ith band, and Nj = sum of peak height of all the bands on jth lane.
3. Results and Discussion
3.1. Trophic States and Genetic Biodiversity of Field Samples
Based on previous investigations [3,22], a lake can be classified as eutrophic if its Chl a concentration is higher than 10 µg/L and its TP concentration is higher than 20 µg/L. Chl a and TP concentrations at the sampling station WSFP during the time of field survey were 17.4 µg/L and 32.1 µg/L, respectively; and, Chl a and TP concentrations at the sampling station DTSP were 23.9 µg/L and 58.3 µg/L, respectively (Table 1). Therefore, Lake Wilson during the time of the field survey was under eutrophic state and the the lake water at sampling station DTSP is more eutrophic than at sampling station WSFP.
Results of the DGGE profiles of DNA fragments amplified from water samples collected at sampling stations DSTP and WSFP on 13 April 2011, are shown in Figure 2. The DGGE data were then used to calculate the eukaryotic biodiversity for the two stations. The DGGE analysis of the eukaryote showed The eukaryotic biodiversity of the DSTP site was H′ = 1.725, while the eukaryotic biodiversity of WSFP site is H′ = 2.571 (Table 2). Therefore, the WSFP station had a higher biodiversity than the DSTP station
The results of the field experiments indicate that Lake Wilson during the time of field survey was under eutrophic state, and the lake was more eutrophic at DSTP station than at WSFP station. Results of the field experiments also indicate that during the time of the field survey the DSTP station had a smaller eukaryotic genetic biodiversity than the WSFP station.
3.2. Laboratory Investigation of Trophic States and Genetic Biodiversity
3.2.1. SRP and TP in Algal Microcosms with Different Trophic States
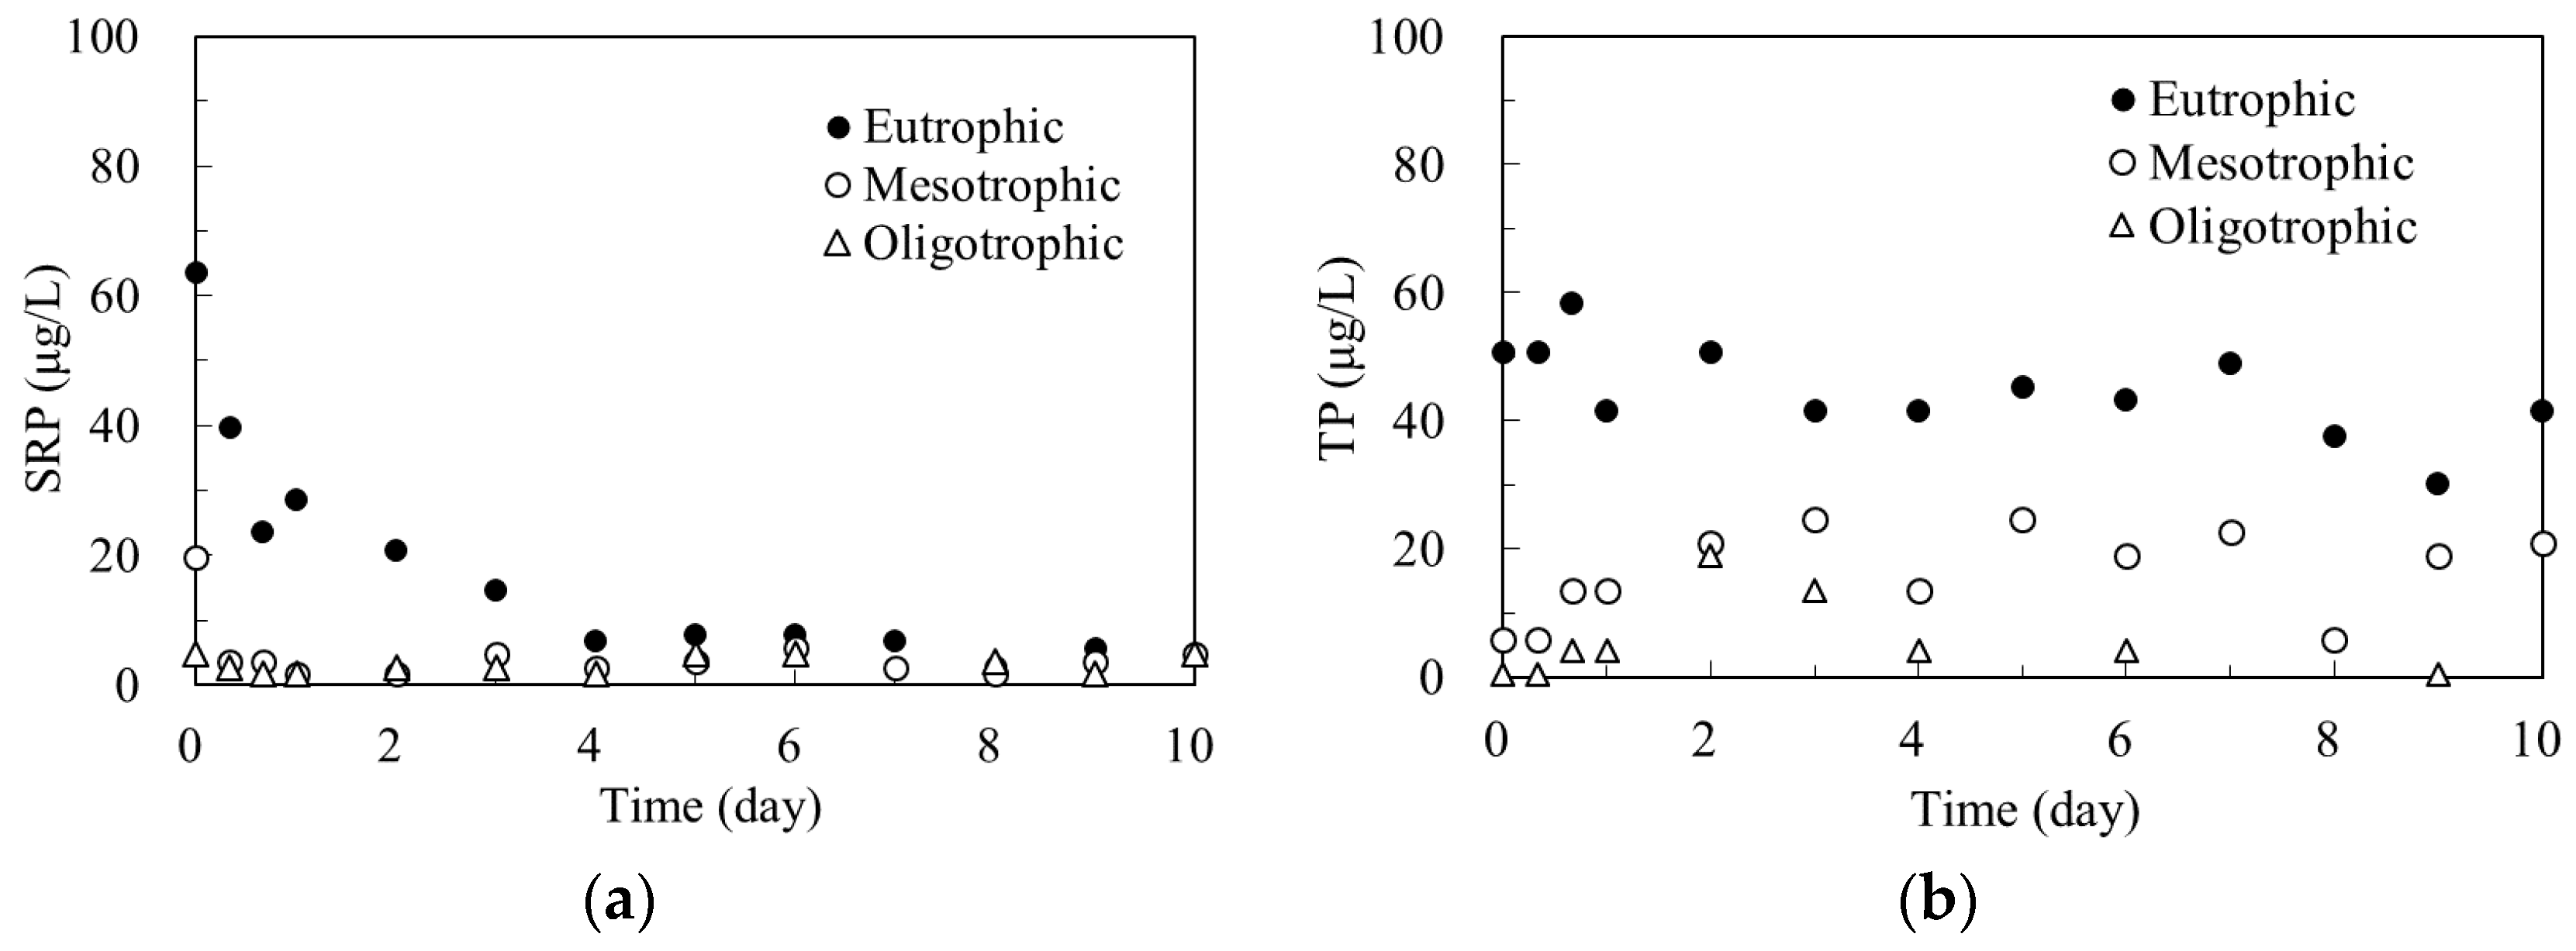
Figure 3 show the changes of SRP and TP concentrations in algal microcosms during the laboratory experiment.
As shown in Figure 3a, soluble reactive phosphorus (SRP) concentration in the oligotrophic microcosm remains relatively low throughout the entire experimental period, with a mean value of 2.75 μg/L. In the mesotrophic microcosm, SRP concentration declines rapidly from an initial value of 19.7 μg/L to 3.7 μg/L within the first day, and then remains approximately constant at value of 3.41 µg/L for the remaining 10 days. In the eutrophic microcosm, SRP concentration decreases gradually from an initial value of 19.7 μg/L to 3.7 μg/L at day 4, and then remains relatively low at a mean value of 6.02 µg/L for the remaining six days. Figure 3b shows that the TP concentration in all three microcosms did not fluctuate much with time during the entire experimental period. The mean TP concentrations in oligotrophic, mesotrophic, and eutrophic microcosms were 7.5 μg/L, 18.5 μg/L, and 42.2 μg/L, respectively. These are typical TP values that are found in oligotrophic, mesotrophic, and eutrophic freshwater lakes [3].
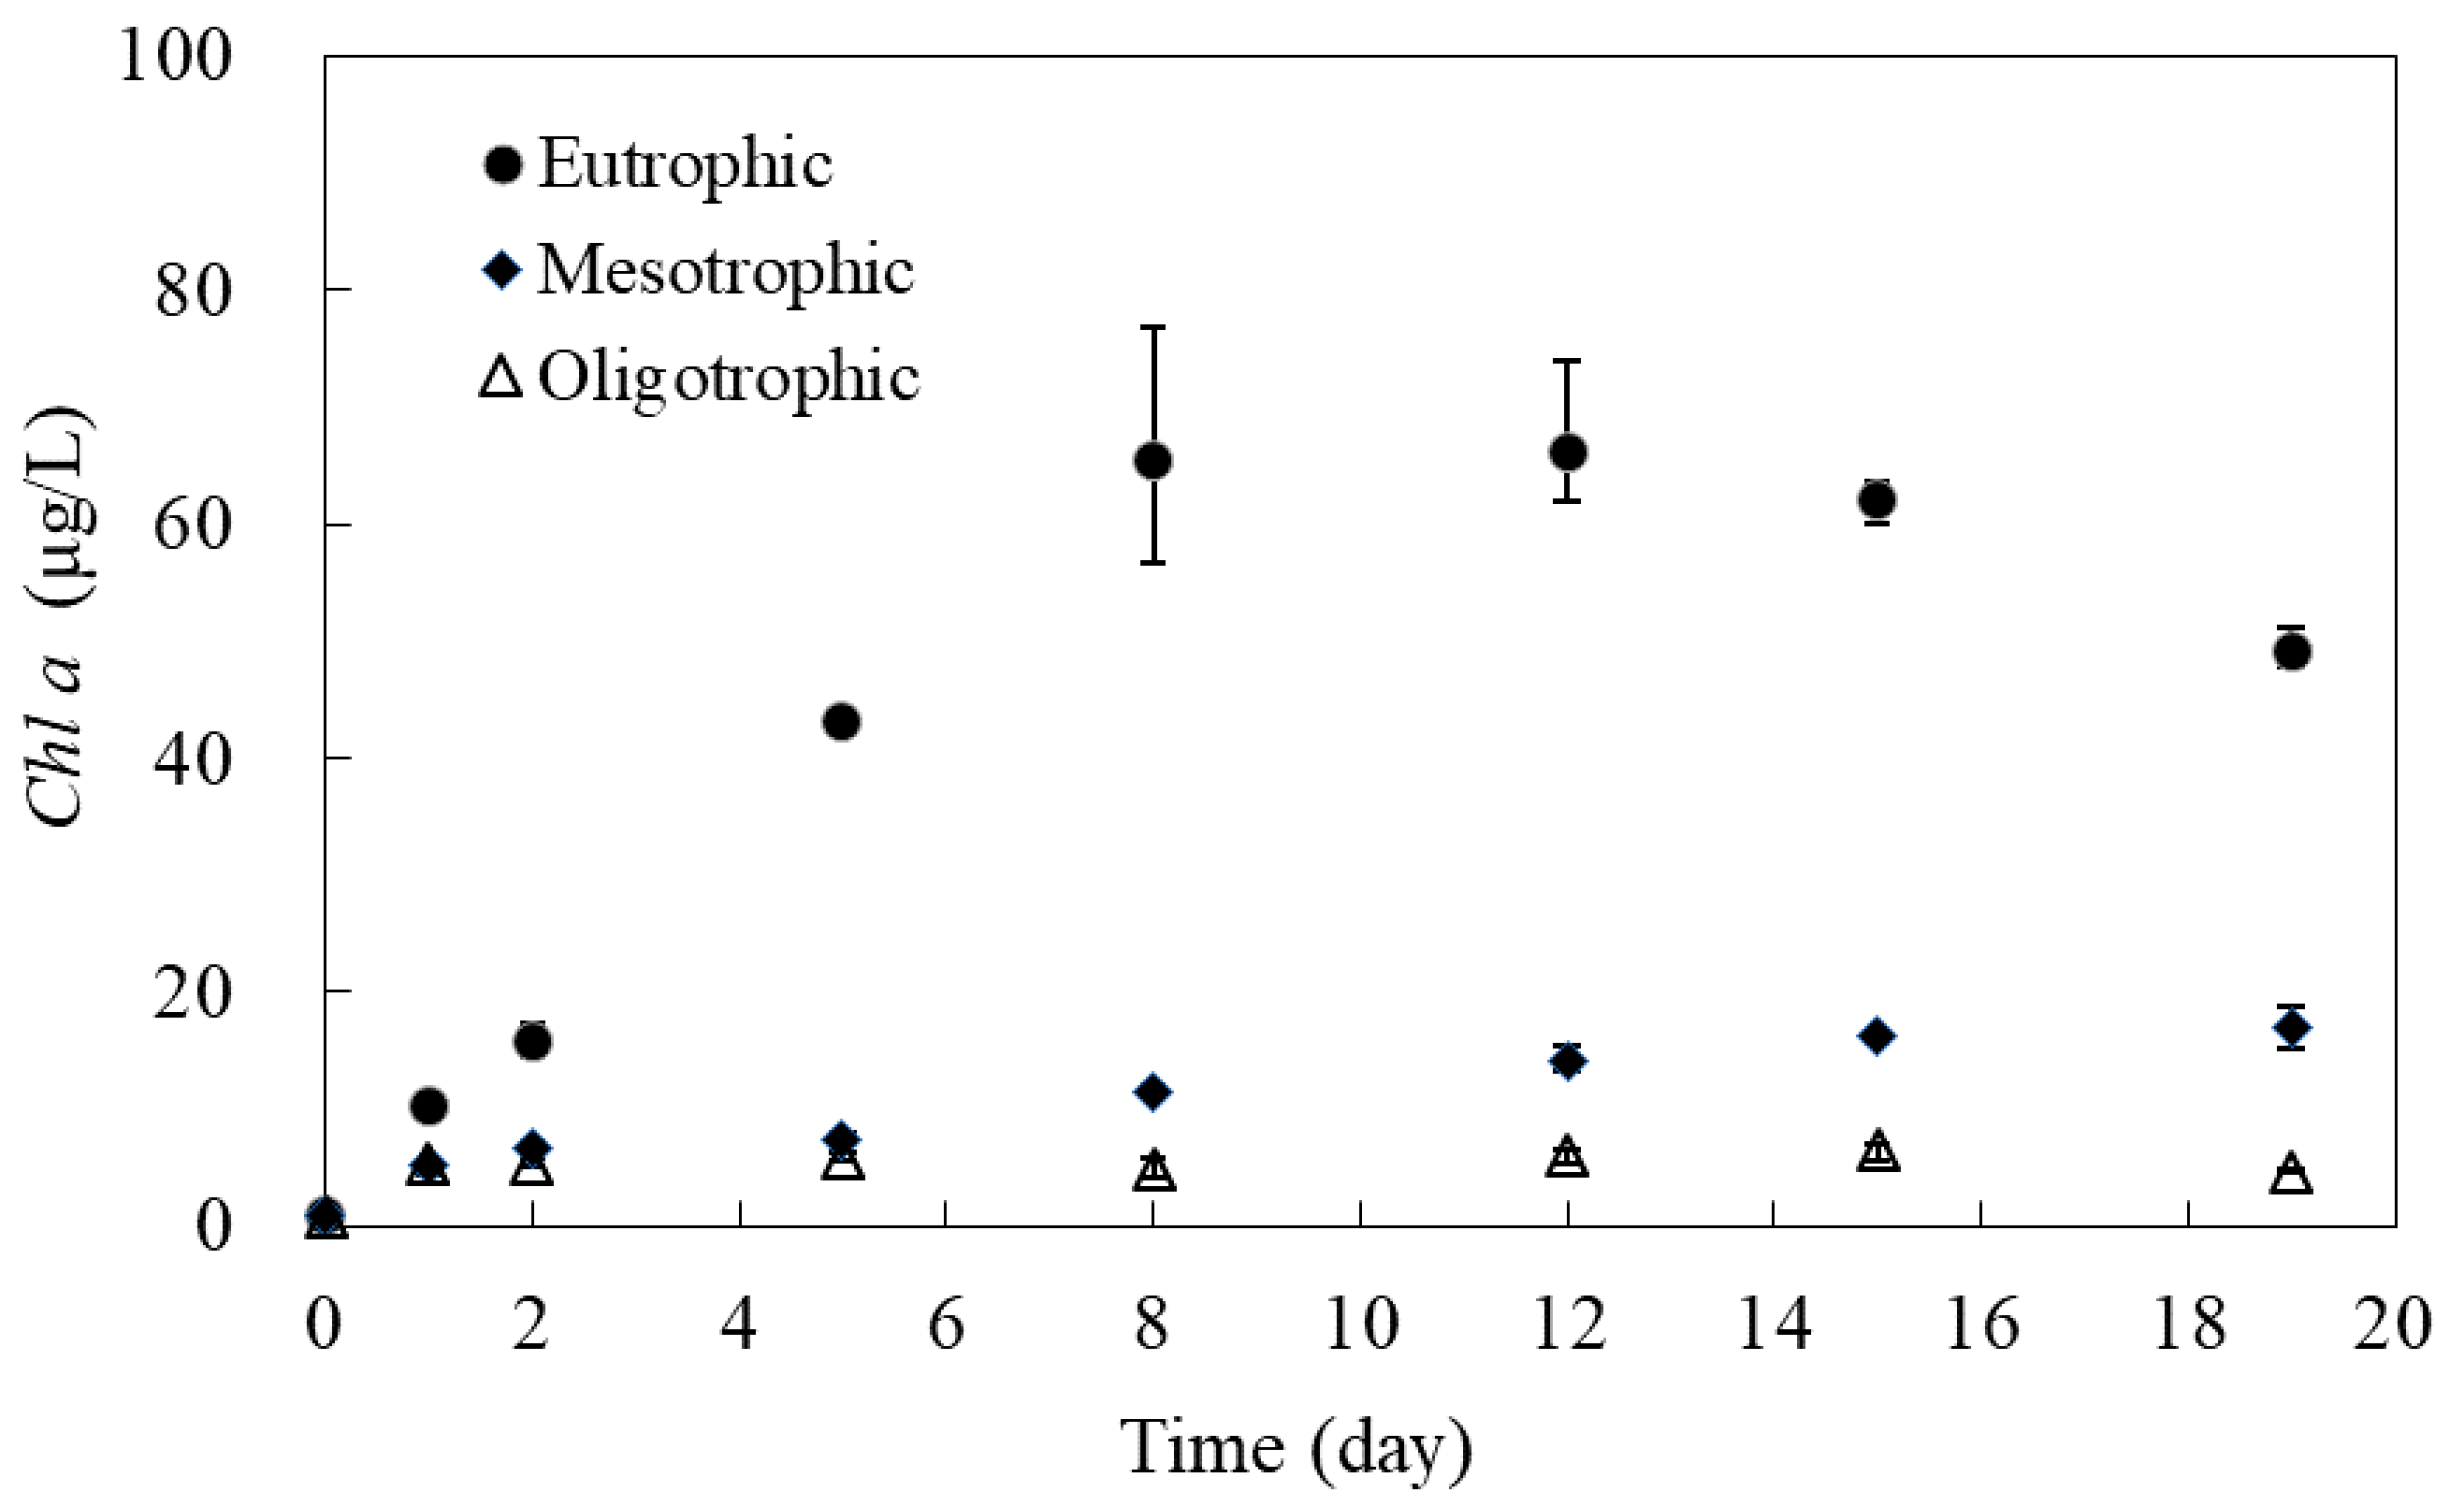
Figure 4 shows the changes of Chl a SRP anconcentrations in algal microcosms during the laboratory experiment. Chl a concentration in all three microcosms are rather low initially. The Chl a concentration in oligotrophic microcosm remains rather low at 5.0 μg/L or less. The Chl a concentration in mesotrophic microcosm increase slowly with time and eventually stabilized at a concentration of about 15.0 μg/L. The Chl a concentration in eutrophic microcosm increase rapidly at beginning and reach a peak concentration of about 65.0 μg/L at day 10, and then gradually reduces.
When comparing the change of SRP and Chl a concentrations with time, as shown on Figure 3a and Figure 4, indicates that SRP concentrations decline as the Chl a concentration increase in all three microcosms. With small amount of SRP in oligotrophic microcosm, the increase of Chl a is very limited. While sufficient SRP supply in eutrophic microcosm produces large increase of Chl a. Therefore, SRP is the biologically available nutrient for maintaining primary productivity, and its concentration increases along the ascent of the trophic states. Similar results were reported by Hudson and Taylor in 2000 based on their investigation on 56 lakes in North America [31].
The trophic state of a freshwater lake can be determined by its TP concentration [32]. Two dividing lines of 10 and 20 μg/L of TP concentrations can be considered as the lower and upper limits for a lake to be considered mesotrophic [3]. The measured mean TP concentrations in the oligotrophic microcosm was 7.5 μg/L, in the mesotrophic microcosm was 18.5 μg/L, and in the eutrophic microcosm was 42.2 μg/L (Figure 3). Therefore, this study successfully simulated Lake Wilson under three trophic states by setting-up initial conditions and by regulating the hydraulic overflow rate and nutrient loading.
3.2.2. Algal Bioproductivity in Microcosms under Varying Trophic States
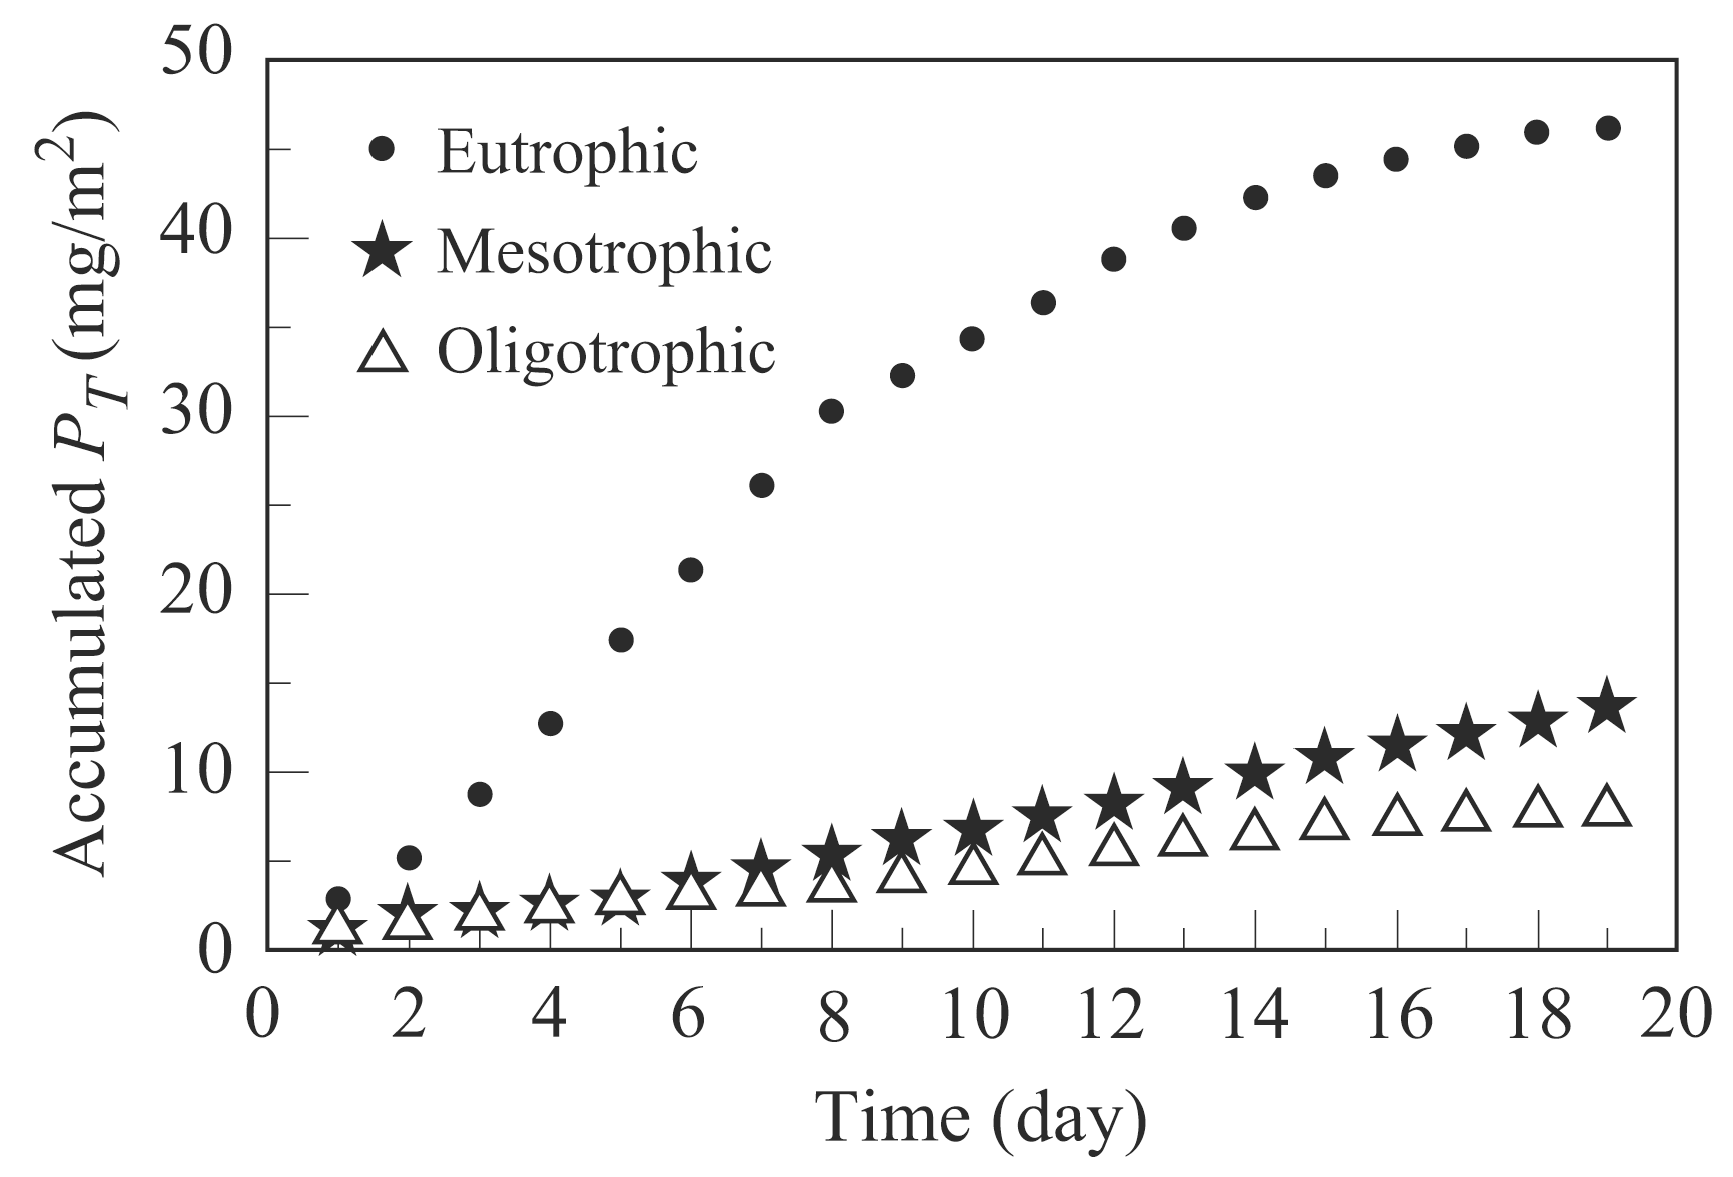
Following the procedures given in Section 2.2.3, the algal productivity of three microcosms were calculated and shown in Figure 5.
The calculated average algal bioproductivity of oligotrophic microcosm, mesotrophic microcosm, and eutrophic microcosm are 0.4, 0.7, and 2.4 (mg/m2/day), respectively. The daily Chl a content can be converted to an annual carbon productivity by using carbon/Chl a ratio ranging from 10 to 182 [30]. The annual algal bioproductivity of carbon for the three trophic levels were calculated to be 26 g C/m2 for oligotrophic, 47 g C/m2 for mesotrophic, and 159 g C/m2 for eutrophic by using the carbon/Chl a ratio of 182.
The change of Chl a concentrations can be represented by the term of net algal growth rate or algal productivity, rs in Equation (3). The predator-prey interaction of phytoplankton with other microorganisms is a possible cause of the change of Chl a concentrations in microcosms. Further research efforts are needed for the development of a theoretical basis of the relationship between algal productivity and genetic biodiversity in freshwater lakes. As a part of these research efforts, this research team is examining the change of eukaryotic assemblage assessment by applying molecular cloning and sequencing technologies
3.2.3. Genetic Biodiversity in Algal Microcosms with Different Trophic States
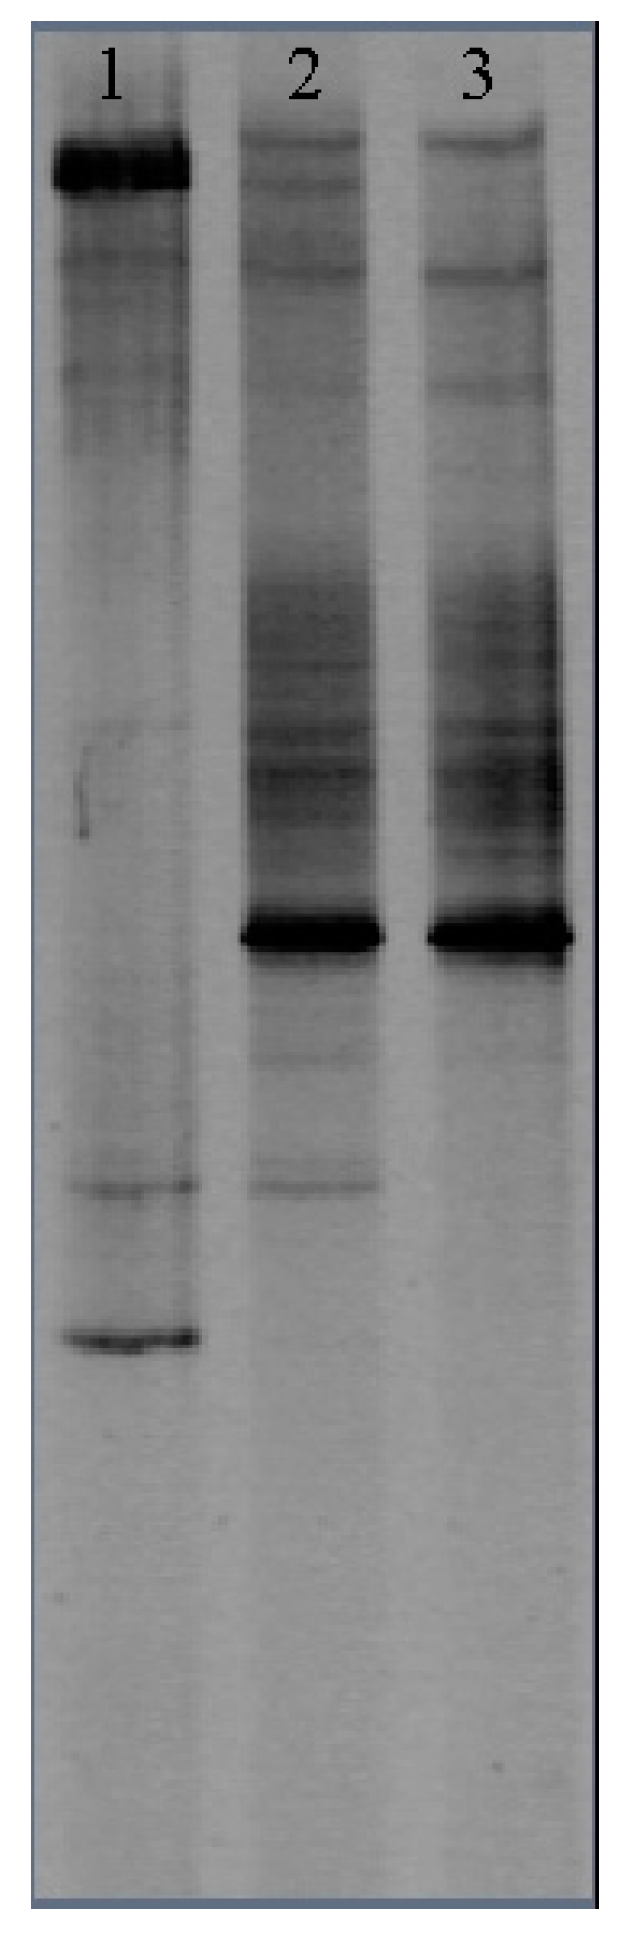
The net algal bioproduction at three bioreactors were stabilized 12 days after the experiment started. The DGGE profiles of the DNA fragments that were taken from these microcosms at 12th day were amplified and further analyzed. Genetic diversity analysis showed that there were seven bands of eukaryotes detected from the oligotrophic microcosm, thirteen bands from the mesotrophic microcosm, and ten bands from the eutrophic microcosm (Figure 6). The DGGE data was then used to calculate the eukaryotic biodiversity by Equations (9) and (10). As shown in Table 3, the calculated eukaryotic biodiversity (H′) of the mesotrophic microcosm is 2.390; while the calculated eukaryotic biodiversity (H′) of the oligotrophic and eutrophic microcosms levels are 1.762 and 2.113, respectively. Therefore, eukaryotes diversity is higher under mesotrophic state than that under oligotrophic and eutrophic states (Table 3).
A t-test [33,34] was performed to allow for further comparison of the biodiversities of three macrocosms. According to the t-test method, the biodiverssities of two macrocosms are considered to be significantly different under 5% level if absolute t-value is larger than the values given by the t-Table at 5% level of significance. Results of the t-test showed that biodiverssities between the oligotrophic and mesotrophic macrocosms and between the mesotrophic and eutrophic are significantly different under 5% level.
4. Conclusions
The trophic state of a freshwater lake receiving excessive nutrient loadings will change from a less productive oligotrophic state to a more productive mesotrophic state, and finally to a highly productive eutrophic state. In this study, field and laboratory experiments were conducted to evaluate the relationship of algal bioproductivity and genetic (or eukaryotic) biodiversity of a freshwater lake. Results of the field experiments indicated that eukaryotic biodiversity of a eutrophic freshwater lake decreases when its bioproductivity increases. More detailed laboratory experiments were conducted in three microcosms which simulate a freshwater lake under oligotrophic, mesotrophic, and eutrophic states. Results of the laboratory experiments showed that the eukaryotic biodiversity of a lake increases continuously as its trophic state change from an oligotrophic state to a mesotrophic state, and then the lake eukaryotic biodiversity decreased as it moved further from a mesotrophic state into an eutrophic state. Therefore, results of field and laboratory experiments are consistent. Both field and laboratory experiment supports the notion that the maximum eukaryotic biodiversity occurs at a point of critical bioproductivity within mesotrophic state. Additionally, the eukaryotic biodiversity of a freshwater lake decreases as its productivity is less or more than the critical point in mesotrophic state.
As part of this study, techniques and procedures were developed for a fast assessment of eukaryotic biodiversity based on the DGGE method. As a result, the reduction of eukaryotic biodiversity of a freshwater lake in a mesotrophic state can be detected quickly and used as early warning of an emerging eutrophication problem; and, to allow for the implementation of timely management actions.
Acknowledgments
This study was supported in part by the U.S. Geological Survey (grant No. 2008HI-228B). This is a contributed paper WRRC-CP-2018-08 of the Water Resources Research Center, University of Hawaii at Manoa, Honolulu, Hawaii. The authors are grateful to Professor Tao Yan of UHM for his help for the laboratory experiment design and set-up.
Author Contributions
Clark C. K. Liu conceived the research idea; Tsu-Chuan Lee and Clark C. K. Liu designed the field and laboratory experiments; Tsu-Chuan Lee performed the experiments and analyzed the data; and Tsu-Chuan Lee and Clark. C. K. Liu wrote the paper.
Conflicts of Interest
The authors declare no conflict of interest.
References
- Schindler, D.W.; Hecky, R.E.; Findlay, D.L.; Stainton, M.P.; Parker, B.R.; Paterson, M.J.; Beaty, K.G.; Lyng, M.; Kasian, S.E.M. Eutrophication of lakes cannot be controlled by reducing nitrogen input: Results of a 37-year whole-ecosystem experiment. Proc. Natl. Acad. Sci. USA 2008, 105, 11254–11258. [Google Scholar] [CrossRef] [PubMed]
- Lei, S.; Long, T.; Liu, C.C.K. Algal bioproductivity in turbulent water: An experimental study. Water 2017, 9, 304. [Google Scholar]
- Chapra, S.C. The eutrophication problem and nutrients. In Surface Water-Quality Modeling; McGraw-Hill: Boston, MA, USA, 2008; pp. 521–558. [Google Scholar]
- Kuo, J.; Wang, Y.; Lung, W.; Liu, C.C.K. Real-time Eutrophication Control of a Reservoir. In Proceedings of the 2013 IAHR Congress, Chengdu, China, 8–13 September 2013; Tsinghua University Press: Beijing, China, 2013. [Google Scholar]
- Magurran, A.E. Biological diversity. Curr. Biol. 2005, 15, R116–R118. [Google Scholar] [CrossRef] [PubMed]
- Mark, N. The Encyclopedia of the Arctic; Routledge: New York, NY, USA, 2005; p. 264. [Google Scholar]
- Vellend, M. Species diversity and genetic diversity: Parallel processes and correlated patterns. Am. Nat. 2005, 166, 199–215. [Google Scholar] [CrossRef] [PubMed]
- Caron, D.A.; Countway, P.D.; Savai, P.; Gast, R.J.; Schnetzer, A.; Moorthi, S.D.; Dennett, M.R.; Moran, D.M.; Jones, A.C. Defining DNA-based operational taxonomic units for microbial-eukaryote ecology. Appl. Environ. Microbiol. 2009, 75, 5797–5808. [Google Scholar] [CrossRef] [PubMed]
- Triadó-Margarit, X.; Casamayor, E.O. Genetic diversity of planktonic eukaryotes in high mountain lakes (Central Pyrenees, Spain). Environ. Microbiol. 2012, 14, 2445–2456. [Google Scholar] [CrossRef] [PubMed]
- Asai, R.; Ootani, K.; Nomura, Y.; Nakamura, C.; Ikebukuro, K.; Arikawa, Y.; Miyake, J.; Karube, I. PCR-based ribosomal DNA detection technique for microalga (Heterosigma carterae) causing red tide and its application to a biosensor using labeled probe. Mar. Biotechnol. 2003, 5, 417–423. [Google Scholar] [CrossRef] [PubMed]
- Van Hannen, E.J.; Van Agterveld, M.P.; Gons, H.J.; Laanbroek, H.J. Revealing genetic diversity of eukaryotic microorganisms in aquatic environments by denaturing gradient gel electrophoresis. J. Phycol. 1998, 34, 206–213. [Google Scholar] [CrossRef]
- Muyzer, G.; Kornelia, S. Application of denaturing gradient gel electrophoresis (DGGE) and temperature gradient gel electrophoresis (TGGE) in microbial ecology. Antonie Leeuwenhoek 1998, 73, 127–141. [Google Scholar] [CrossRef] [PubMed]
- Lefranc, M.; Thenot, A.; Lepere, C.; Debroas, D. Genetic diversity of small eukaryotes in lakes differing by their trophic status. Appl. Environ. Microbiol. 2005, 71, 5935–5942. [Google Scholar] [CrossRef] [PubMed]
- Zhao, B.; Chen, M.; Sun, Y.; Yang, J.; Chen, F. Genetic diversity of picoeukaryotes in eight lakes differing in trophic status. Can. J. Microbiol. 2011, 57, 115–126. [Google Scholar] [CrossRef] [PubMed]
- Connell, J.H.; Orias, E. The ecological regulation of species diversity. Am. Nat. 1964, 98, 399–414. [Google Scholar] [CrossRef]
- Fukami, T.; Morin, P.J. Productivity-biodiversity relationships depend on the history of community assembly. Nature 2003, 24, 423–426. [Google Scholar] [CrossRef] [PubMed]
- Waide, R.B.; Willig, M.R.; Steiner, C.F.; Mittelbach, G.; Gough, L.; Dodson, S.I.; Juday, G.P.; Parmenter, R. The Relationship between productivity and species richness. Annu. Rev. Ecol. Syst. 1999, 30, 257–300. [Google Scholar] [CrossRef]
- Smith, V.H. Microbial diversity-productivity relationships in aquatic ecosystems. FEMS Microbiol. Ecol. 2007, 62, 181–186. [Google Scholar] [CrossRef] [PubMed]
- Kassen, R.; Buckling, A.; Bell, G.; Rainey, P.B. Diversity peaks at intermediate productivity in a laboratory microcosm. Nature 2000, 406, 508–512. [Google Scholar] [CrossRef] [PubMed]
- Young, R.H.F.; Dugan, G.L.; Lau, L.S.; Yamauchi, H. Eutrophication and Fish Toxicity Potentials in a Multiple-use Subtropical Reservoir; Technical Report No. 89; Water Resources Research Center, University of Hawaii at Manoa: Honolulu, HI, USA, 1975. [Google Scholar]
- Tetra Tech. Total Maximum Daily Loads (TMDLs) for the North and South Forks of Kaukonahua Stream, Oahu, Hawaii; State of Hawaii Department of Health: Honolulu, HI, USA, 2009. [Google Scholar]
- Vollenweider, R.A. Scientific Fundamentals of the Eutrophication of Lakes and Flowing Waters with Particular Reference to Nitrogen and Phosphorus as Factors in Eutrophication; Organization for Economic Co-operation and Development (OECD): Paris, France, 1971. [Google Scholar]
- Bold, H.C. The morphology of Chlamydomonas chlamydogama sp. nov. Bull. Torrey Bot. Club 1949, 76, 101–108. [Google Scholar] [CrossRef]
- Phillips, N.; Celia, M.S.; Clifford, W.M. An effective DNA extraction protocol for brown algae. Phycol. Res. 2001, 49, 97–102. [Google Scholar] [CrossRef]
- Van Hannen, E.J.; Zwart, G.; Van Agterveld, M.P.; Gons, H.J.; Ebert, J.; Laanbroek, H.J. Changes in bacterial and eukaryotic community structure after mass lysis of filamentous cyanobacteria associated with viruses. Appl. Environ. Microbiol. 1999, 65, 795–801. [Google Scholar]
- Muyzer, G.; Ellen, C.D.W.; Andre, G.U. Profiling of complex microbial populations by denaturing gradient gel electrophoresis analysis of polymerase chain reaction-amplified genes coding for 16S rRNA. Appl. Environ. Microbiol. 1993, 59, 695–700. [Google Scholar] [PubMed]
- Shannon, C.E. A mathematical theory of communication. Bell Syst. Tech. J. 1948, 27, 397–423, 623–656. [Google Scholar] [CrossRef]
- Eichner, C.A.; Erb, R.W.; Timmis, K.N.; Wagner-Döbler, I. Thermal gradient gel electrophoresis analysis of bioprotection from pollutant shocks in the activated sludge microbial community. Appl. Environ. Microbiol. 1999, 65, 102–109. [Google Scholar] [PubMed]
- Fromin, N.; Hamelin, J.; Tarnawski, S.; Roesti, D.; Jourdain-Miserez, K.; Forestier, N.; Teyssier-Cuvelle, S.; Gillet, F.; Aragno, M.; Rossi, P. Statistical analysis of denaturing gel electrophoresis (DGE) fingerprinting patterns. Environ. Microbiol. 2002, 4, 634–643. [Google Scholar] [CrossRef] [PubMed]
- Murray, A.E.; Hollibaugh, J.T.; Orrego, C. Phylogenetic compositions of bacterioplankton from two California estuaries compared by denaturing gradient gel electrophoresis of 16S rDNA fragments. Appl. Environ. Microbiol. 1996, 62, 2676–2680. [Google Scholar] [PubMed]
- Hudson, J.J.; Taylor, W.D.; Schindler, D.W. Phosphate concentrations in lakes. Nature 2000, 406, 54–56. [Google Scholar] [CrossRef] [PubMed]
- Chapra, S.C.; Tarapchak, S. A Chlorophyll model and its relationship to phosphorus loading plots for lakes. Water Resour. Res. 1976, 12, 1260–1264. [Google Scholar] [CrossRef]
- Hutcheson, K. A test for comparing diversities based on the Shannon formula. J. Theor. Biol. 1970, 29, 151–154. [Google Scholar] [CrossRef]
- Magurran, A.E. Diversity indices and species abundance models. In Ecological Diversity and Its Measurement; Princeton University Press: Princeton, NJ, USA, 1988; pp. 35–36. [Google Scholar]
Figure 1.
Lake Wilson on Central Oahu, Hawaii, and the locations of two sampling station.

Figure 2.
DGGE gel profile of DNA fragments to determine eukaryotic biodiversity in algal microcosms. Lane 1 is for samples collected from station DSTP, and Lane 2 is for samples collected from station Wahiawa State Freshwater Park (WSFP).
Figure 2.
DGGE gel profile of DNA fragments to determine eukaryotic biodiversity in algal microcosms. Lane 1 is for samples collected from station DSTP, and Lane 2 is for samples collected from station Wahiawa State Freshwater Park (WSFP).

Figure 3.
Changes of soluble reactive phosphorus (SRP) and total phosphorus (TP) concentrations in the microcosms. (a) SRP; (b) TP.
Figure 3.
Changes of soluble reactive phosphorus (SRP) and total phosphorus (TP) concentrations in the microcosms. (a) SRP; (b) TP.

Figure 4.
Chl a concentration observed in algal microcosms.

Figure 5.
Cumulative areal algal (as mg of Chl a/m2) over time.

Figure 6.
DGGE gel profile of DNA fragments to determine eukaryotic biodiversity in algal microcosms. Lane 1 is for samples collected from the oligotrophic microcosm; Lane 2 is for samples collected from the mesotrophic microcosm; and Lane 2 is for samples that were collected from the eutrophic microcosm.


Table 1.
Difference of trophic level in field stations supported with field data.
| Locations | Chl a (µg/L) | TN (mg/L) | TOC (mg/L) | TP (µg/L) | SRP (µg/L) | TSS (mg/L) |
|---|---|---|---|---|---|---|
| DTSP | 23.9 | 0.35 | 4.14 | 58.3 | 17.7 | 5.0 |
| WSFP | 17.4 | 0.24 | 3.35 | 32.1 | 11.7 | 4.3 |
Notes: According to the USGS South Fork Kaukonahua Rain Gage, there was no effective rainfall to cause a runoff into the receiving water body prior to 72 h of the sampling date; Chl a = chlorophyll a, TN = Total Nitrogen, TOC = total organic carbon, TP = Total phosphorus, SRP = soluble reactive phosphorus, and TSS = total suspended solid.
Table 2.
Genetic biodiversity of Lake Wilson at two sampling stations downstream of the sewage treatment plant (DSTP) and Wahiawa State Freshwater Park (WSFP) calculated with denaturing gradient gel electrophoresis (DGGE) banding data and DNA fragment.
Table 2.
Genetic biodiversity of Lake Wilson at two sampling stations downstream of the sewage treatment plant (DSTP) and Wahiawa State Freshwater Park (WSFP) calculated with denaturing gradient gel electrophoresis (DGGE) banding data and DNA fragment.
| Sampling Station | Lane | H′ | S |
|---|---|---|---|
| DSTP | 1 | 1.725 | 9 |
| WSFP | 2 | 2.571 | 20 |
Note: S is the total band count on one lane.
Table 3.
Lake biodiversity of three trophic levels based on DGGE banding data analysis of DNA fragments sampled from algal microcosms.
Table 3.
Lake biodiversity of three trophic levels based on DGGE banding data analysis of DNA fragments sampled from algal microcosms.
| Trophic Levels | Lane | H′ | S |
|---|---|---|---|
| Oligotrophic | 1 | 1.762 | 7 |
| Mesotrophic | 2 | 2.390 | 13 |
| Eutrophic | 3 | 2.113 | 10 |
Note: S is the total band count on one lane.
© 2018 by the authors. Licensee MDPI, Basel, Switzerland. This article is an open access article distributed under the terms and conditions of the Creative Commons Attribution (CC BY) license (http://creativecommons.org/licenses/by/4.0/).
Share and Cite
MDPI and ACS Style
Lee, T.-C.; Liu, C.C.K. Assessing Eutrophication Potential of a Freshwater Lake by Relating Its Bioproductivity and Biodiversity: A Case Study of Lake Wilson on Central Oahu, Hawaii. Water 2018, 10, 296. https://doi.org/10.3390/w10030296
AMA Style
Lee T-C, Liu CCK. Assessing Eutrophication Potential of a Freshwater Lake by Relating Its Bioproductivity and Biodiversity: A Case Study of Lake Wilson on Central Oahu, Hawaii. Water. 2018; 10(3):296. https://doi.org/10.3390/w10030296
Chicago/Turabian StyleLee, Tsu-Chuan, and Clark C. K. Liu. 2018. "Assessing Eutrophication Potential of a Freshwater Lake by Relating Its Bioproductivity and Biodiversity: A Case Study of Lake Wilson on Central Oahu, Hawaii" Water 10, no. 3: 296. https://doi.org/10.3390/w10030296
Note that from the first issue of 2016, this journal uses article numbers instead of page numbers. See further details here.