1. Introduction
Along with the development of the economy and convenience of transportation, there is an increasing trend of people to migrate to shoreline areas, including coastal plains, deltas, and coastal areas [
1], which are generally protected by flood defense structures, such as manmade dikes or gate-dams, natural embankments, dunes, and cliffs. In addition, economic activities are increasingly concentrated in shoreline areas [
2]. As the industry develops and the economy booms in these areas, more land from river ways, lakes, or seas is occupied, which leaves less room for flood buffers. Although living with flooding has been proposed as an alternative to hazard control [
3], the trend toward increased human activities in shoreline areas has not changed [
4]. These activities are under pressure from streams constrained in riverbanks and sea water held back by sea dikes. Safety problems emerge at shorelines: flooding into these dynamic economic areas can lead to unbearable loss [
5], as for instance the flooding of New Orleans in 2005. Considering the possibility of global climate change and extreme nature events, the shoreline areas will face real risks to society and the economy [
3]. Fortunately, shoreline systems can also play a significant role in protection against water, flow diversion, irrigation, landscape, and traffic in these areas.
For these reasons, shoreline structures and their safety levels have become critically important and need more attention. This is urgent for both developed countries and developing countries. In developed countries, although dikes and urban flood protection walls with channel improvement work have already been finished and work well in deltas or estuary zones, for instance, the Dike Ring and Delta Project in the Netherlands, external risk and some potential weak points and geotechnical structures still need monitoring and maintenance. In developing countries, the rapidly increasing development of booming cities and industrial areas near shorelines create a need for the design and construction on fragile natural levees, delta embankments, or sea beaches, and existing safety standards are often low. Because developed countries in many cases are ahead of developing countries, testing a proposed methodology in developed countries gives more insight and provides more experiences for reference. Hence, in this case study, a shoreline survey is applied in the Netherlands’ coastal environment to explore the method of grasping the shoreline’s safety level objectively, correctly, and integrally in real time, ideally for the RS monitoring system platform.
The current shoreline RS measurement and monitoring work with respect to flood defense, as an applied cross-disciplinary subject, is still at the primary stage, and mature shoreline structure applications of RS are basically in situ with preset sensors for Web service monitoring. De Vries et al. installed pore pressure sensors in a sea dike in Boston, UK [
6]. Haarbrink and Shutko combined ground-measured data in Germany with data on airborne soil moisture to produce reliable brightness-temperature and soil-moisture maps [
7] and tried to apply this method to dike safety detection based on temperature differences between the sea water and the dike’s interior. Thiele et al. used a sensor-integrated geo-textile system to detect soil displacement in dikes [
8]. Wang et al. developed a critical means of monitoring the snow cover increase and decrease process by using multiple temporal-coherence InSAR images [
9]. Givehchi et al. applied remote data to seepage detection in dikes [
10]. Meng and Wang indicated that high-resolution meteorological data for soil temperature and soil moisture is available for use in East Asia by developing a dataset model, called “CMADS” [
11]. Hanssen et al. set metal plates on a dike and used radar interferometry information combined with LiDAR (Laser Imaging Detection and Ranging) data to calculate the displacement of the dike surface [
12].
Ecological monitoring of shoreline areas with satellite imagery is mainly conducted on a large scale; for instance, sea level rise, coastal flood inundation, and the influence of human activities are detected using SAR imagery. Therefore, normal optical satellite data are rarely used for flood defense engineering, especially for investigations of the safety of shoreline structures. Because narrow shoreline widths require high-resolution data for interpretation, a great deal of system work is necessary to utilize RS observation. There are two direct ways to monitor the shoreline structure using RS technology: choosing an image with high resolution for monitoring important points or deploying sensors in the field. Both require knowledge of the key points or sections of a shoreline in advance.
In this paper, we explore an indirect method of knowledge-oriented analysis for monitoring shorelines with different scales of RS data. We combine commonly used optical satellite images from satellites such as Landsat and Sentinel-2 with shoreline environmental expert knowledge to make general judgments of the shoreline and identify potentially important points for further interpretation with high-resolution images or on-the-spot investigation. Based on this idea, this paper proposes a model that locates the shoreline first and then provides potential information on the type of shoreline structure and the weak points of detection by analyzing the land cover located near the shoreline in the satellite images.
The objectives of this paper are (1) to extract the geographic coordinates of the shoreline or potential shoreline defense; (2) to identify the ideal structure type for any point or section in the shoreline from the flood defense point of view; and (3), using ecological knowledge and RS image processing for further analysis and design, to produce a shoreline estimation model for deducing the type of safety structures that a given section of shoreline should have.
This paper contains three parts in terms of innovative content. First, the characteristics of the components and elements in a shoreline system needed for design and maintenance of shoreline defense are described and their spectral characteristics of surface feature are assessed. Then, the edge enhancement method for extraction of line location for shoreline is presented. Finally, the reclassification model and procedure for shoreline identification and recognition of the type of shoreline defense structure are explained and illustrated.
2. Remote Sensing Data
2.1. Resolution Requirement for Linear Object
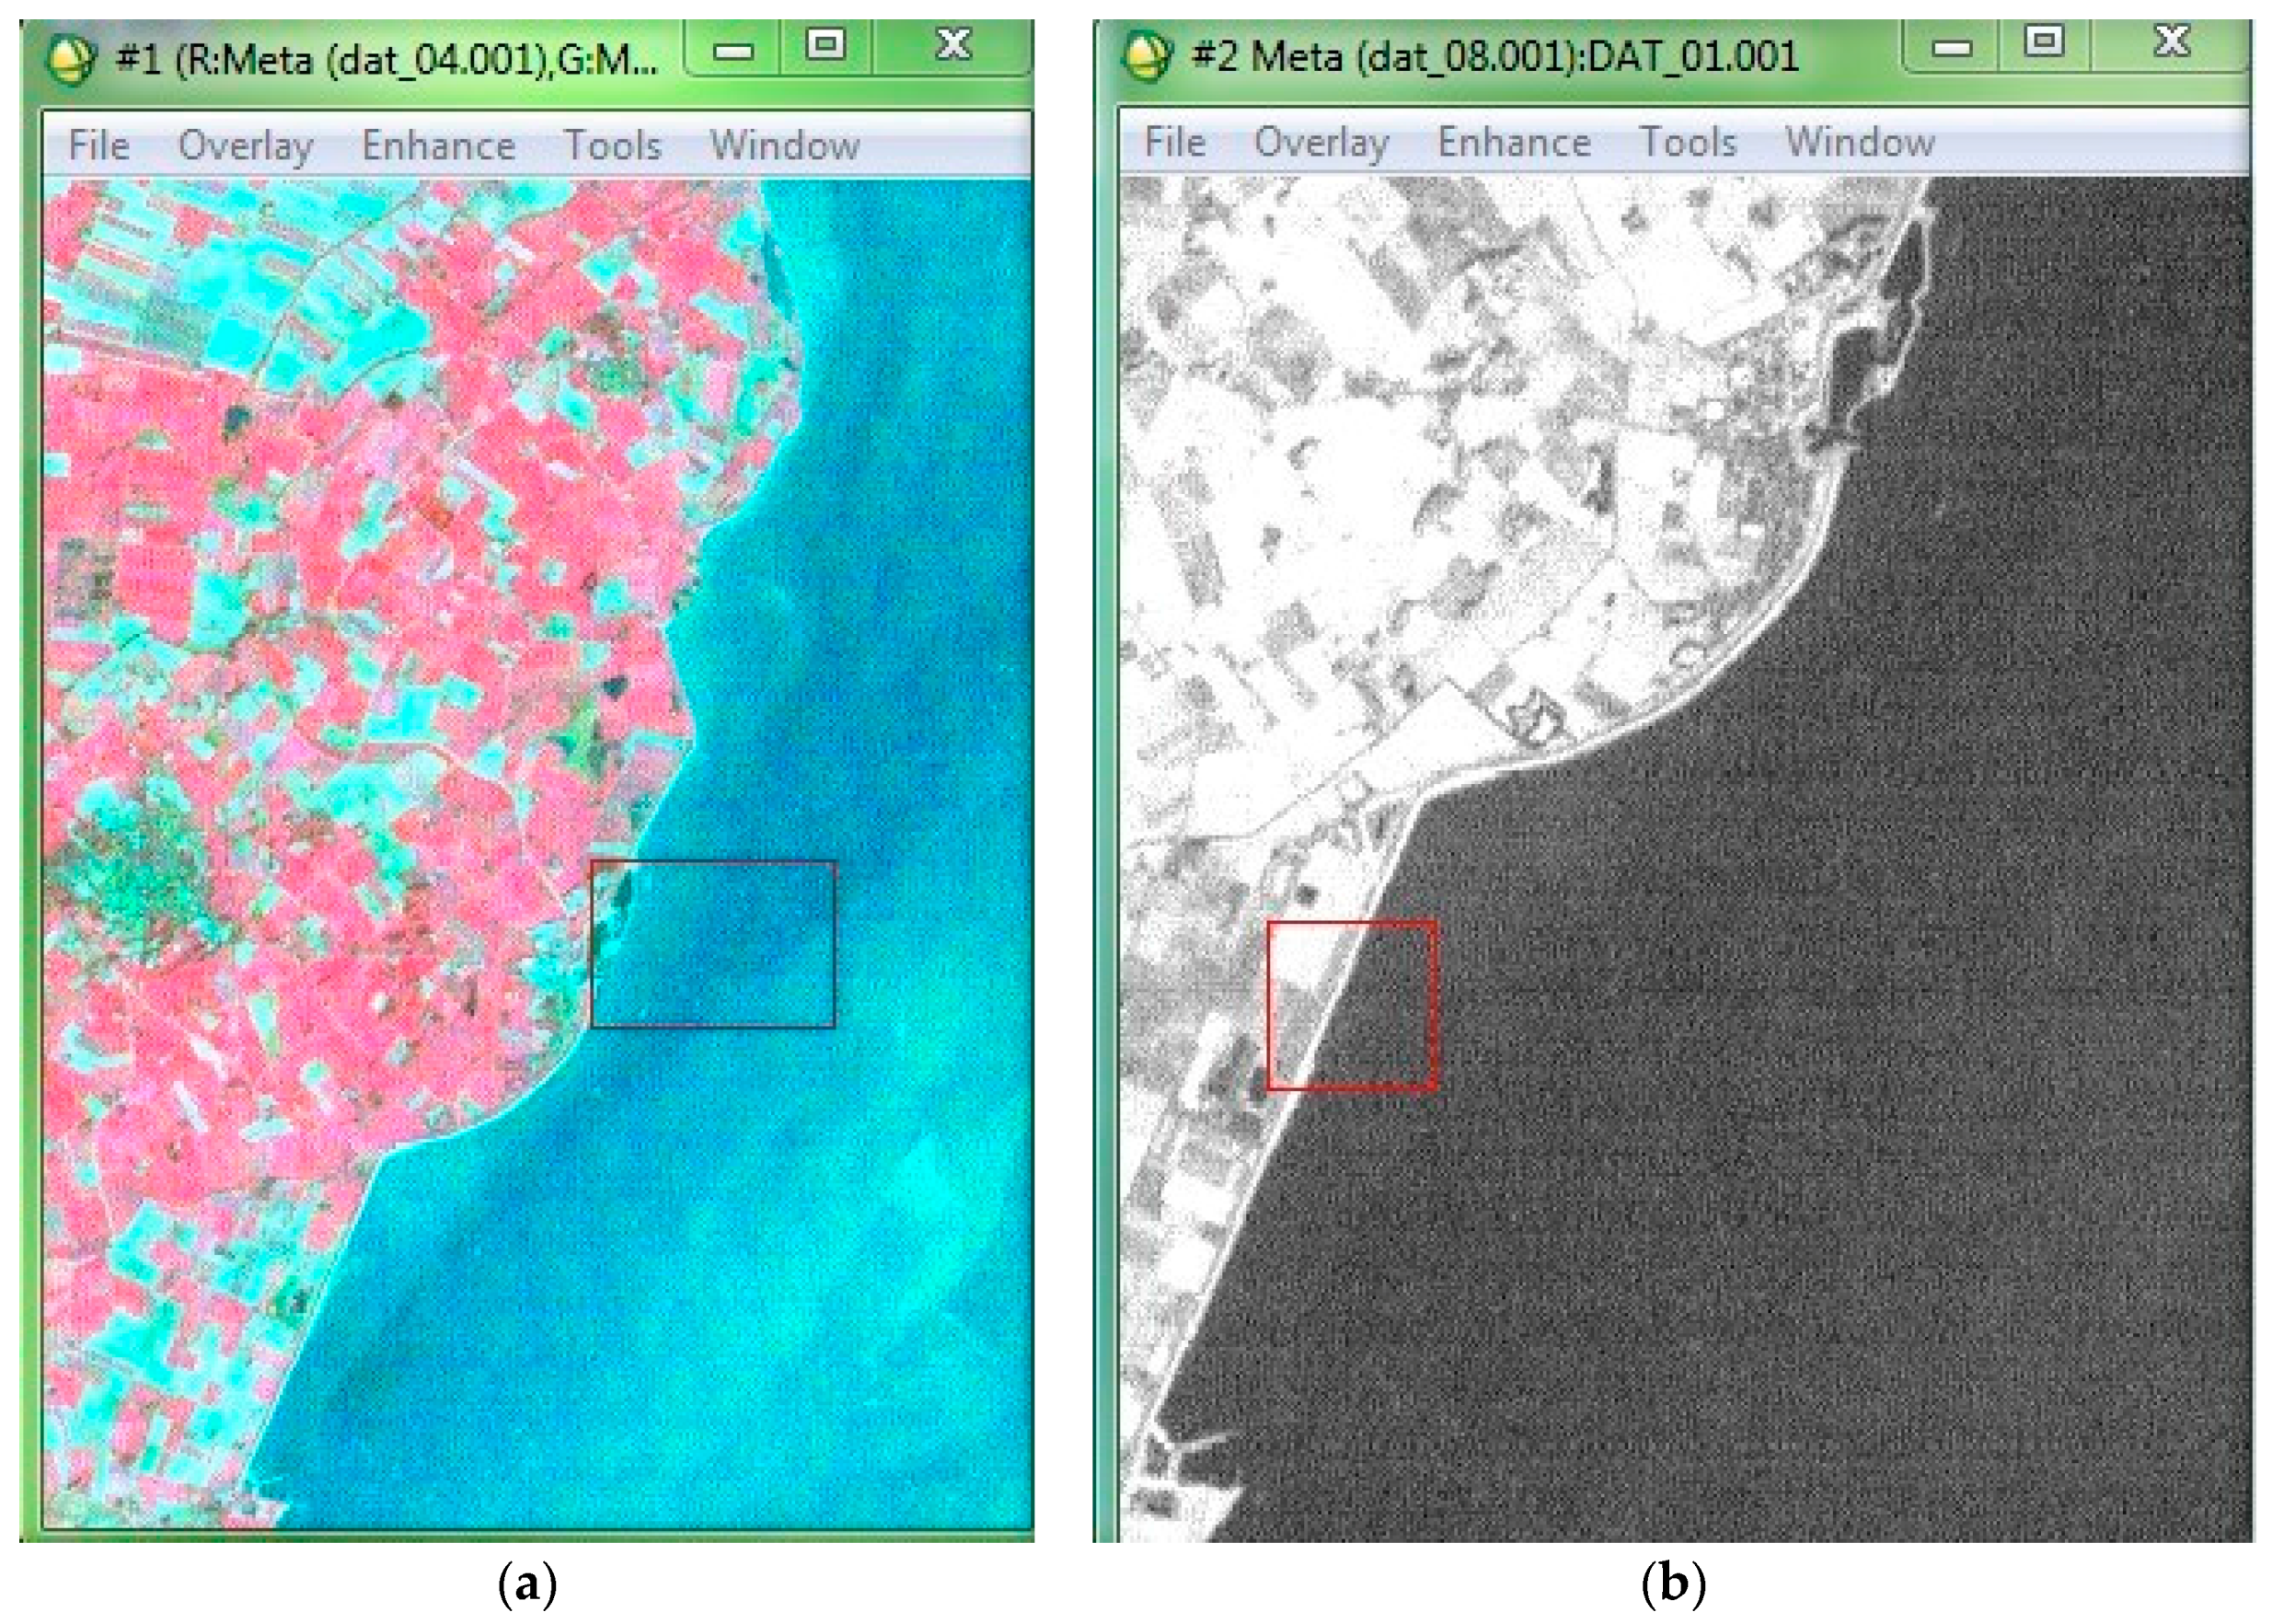
High-resolution RS imagery is widely used in various industries. When using them for land type classification, land cover is divided by its different reflection values or digital numbers in an RS grid image. A feature of the shoreline from the point of view of RS is its fine curve structure, and this is only for recognition and not sufficient for interpretation. Unlike normal large-scale applications of RS, such as agricultural and land use surveys, in a shoreline environment, knowing the relation between the spatial resolution of an RS image pixel and the spatial dimensions of the structure is necessary to recognize components and interpret shoreline information.
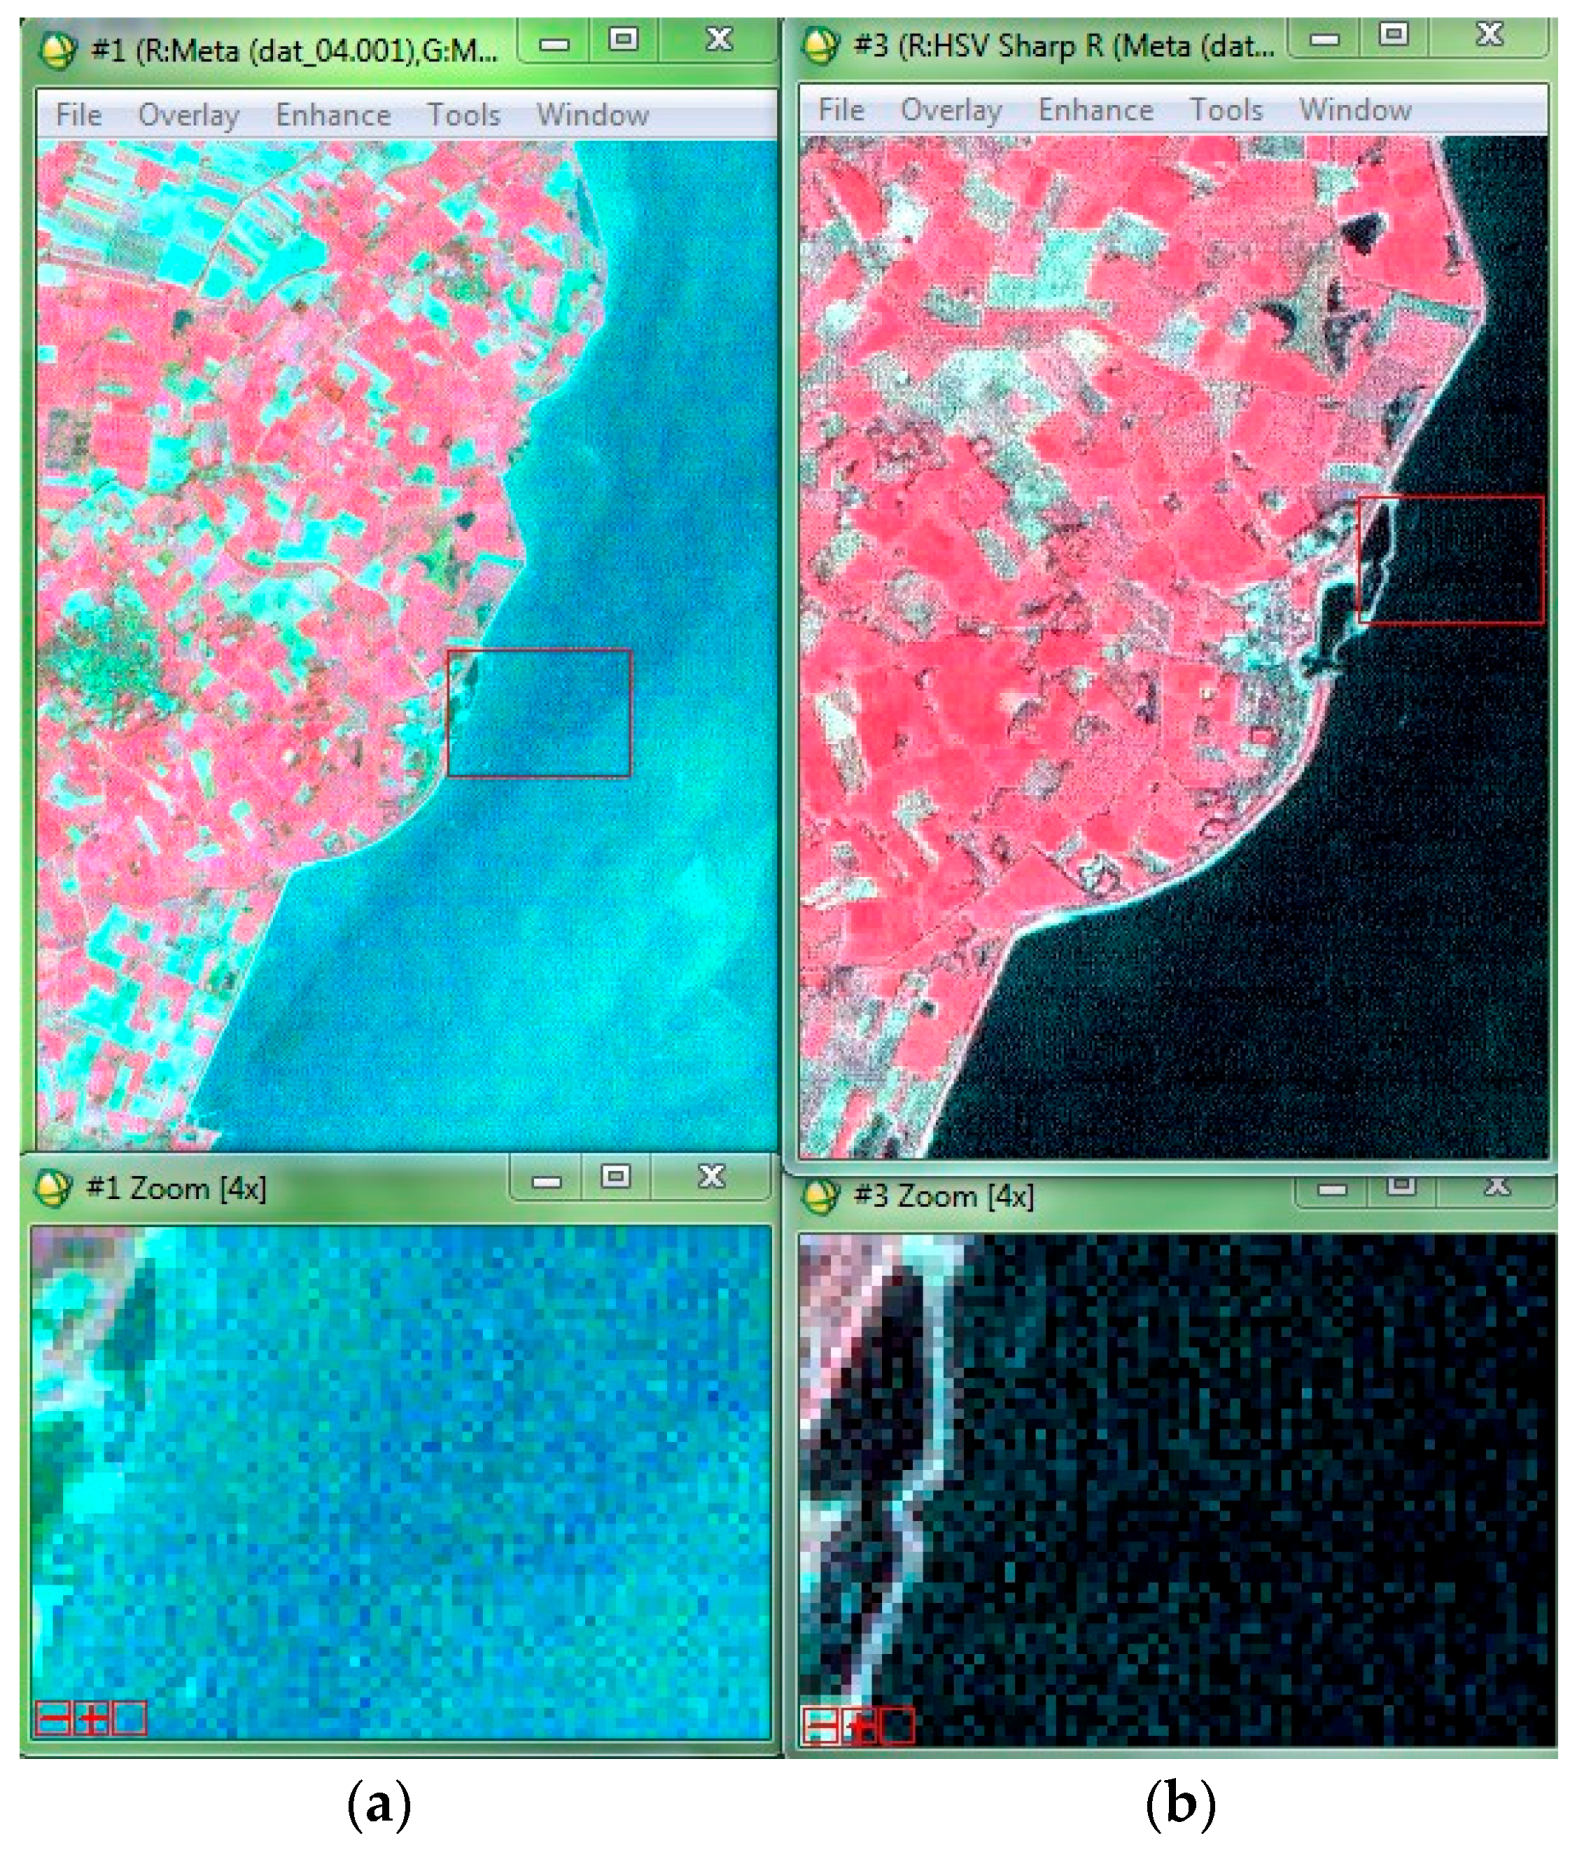
Figure 1a,b show a pair of graphical raster images in the same amplification multiple on original images , with resolutions of 30 and 15 m, respectively, for a shoreline section on the east coast of the Dutch island of Texel, and where there is a dike for protection. The different clarity degree of the two images shows the impact of different raster resolutions on object recognition, although neither is adequate for recognizing the type of shoreline structure in detail. This is because the length of dike crests or other interesting features of a shoreline structure are generally no more than 3–5 m long, smaller than the resolution or pixel size of the images. In practice, we have found that an at least five- to eight-fold resolution is needed for observation.
Therefore, when using RS imagery to detect and observe the shoreline with a long length but a narrow width, there is always a dilemma to face in terms of the scale size of the image resolution versus local the detailed information for the same study object. This paper tries to break this dilemma by combining the satellite imagery with knowledge of flood defense and ecology to carry out information extraction work for shoreline structures.
2.2. Data and Case Study Area
The current study interprets an image acquired on 31 May 2001 from Landsat Enhanced Thematic Mapper Plus (ETM+), a passive optical image covering the north of the Netherlands. The data on that day provides far greater clarity than a cloudy day. In this season, the land has no snow cover; instead, vegetation and crops are in lush growth, which is useful for land cover recognition and classification. The shoreline areas in the north of the Netherlands, after developing for decades, have a typical coastal structure that is well designed and maintained with a perfect layout of land use and components of flood defense such as sea dikes, dunes, and hydraulic structures, which can be set as a standard for comparing with other cases.
2.3. Data Spectrum and Bands Choice
ETM+ provides eight spectral bands: six multispectral bands with a spatial resolution of 30 m, one panchromatic band with a resolution of 15 m, and one thermal infrared band with a spatial resolution of 60 m, respectively, covering the visible, near-infrared, and shortwave of the electromagnetic spectrum. The following are the spectral parameters and potential use of these different bands (
Table 1).
Different combinations of these bands are chosen for making different RGB model images to enhance the display of some ground objects on the screen or to improve the contrast between the study objects. The 4, 5, 3 band combination helps in identifying the water boundary because of its sensitivity to water content; however, it was discarded after our test since it classifies some wetlands or moist sands as water bodies, locating shorelines inland from the actual shoreline. In this study, the coastline needs to be picked out, so Band 4 is required, and sand vegetation and green crops need to be distinguished by the chlorophyll identification of plants using Band 3 and Band 2, so the combination of near-IR (Band 4), red (Band 3) and green (Band 2) is optimal. This 4, 3, 2 band combination is a standard false color composite; in this combination, the resulting image is similar to a colorized infrared image with defined water/land interfaces. Sand is presented as light blue. Vegetation displays are in several shades of red: bright red indicates the broad-leaved forest and healthy green plants, and pale red indicates sparse vegetation cover, scrubby plants, or jungles in sandy areas.
3. Shoreline System
3.1. Components of Shoreline System
As a part of an integrated flood defense, the shoreline system is a design and disaster management concept, and on the ground it is a conjunction of flood defense structures as well as an ecosystem that is probably affected by other human activities. In this paper, which aims to analyze the flood defense structure types and risk levels of a section of shoreline, a “shoreline system” can be understood as a shoreline with its immediate and nearby land cover, or the position belt for a specific type of flood defense. That is, a shoreline system from the point of view of flood defense is comprised of three parts: firstly, the water body; secondly, the land cover and the areas of human activity near the shoreline; and thirdly, shoreline defense structures, including sea or river dikes, revetments, coastal beaches, flood walls, sand dunes, mounds, cliffs, buffer regions, secondary dry dikes, sluices, dams, and storm surge barriers. In this case study in the north of the Netherlands, three main components are considered in the shoreline: the dike, dunes, and the hydraulic structure.
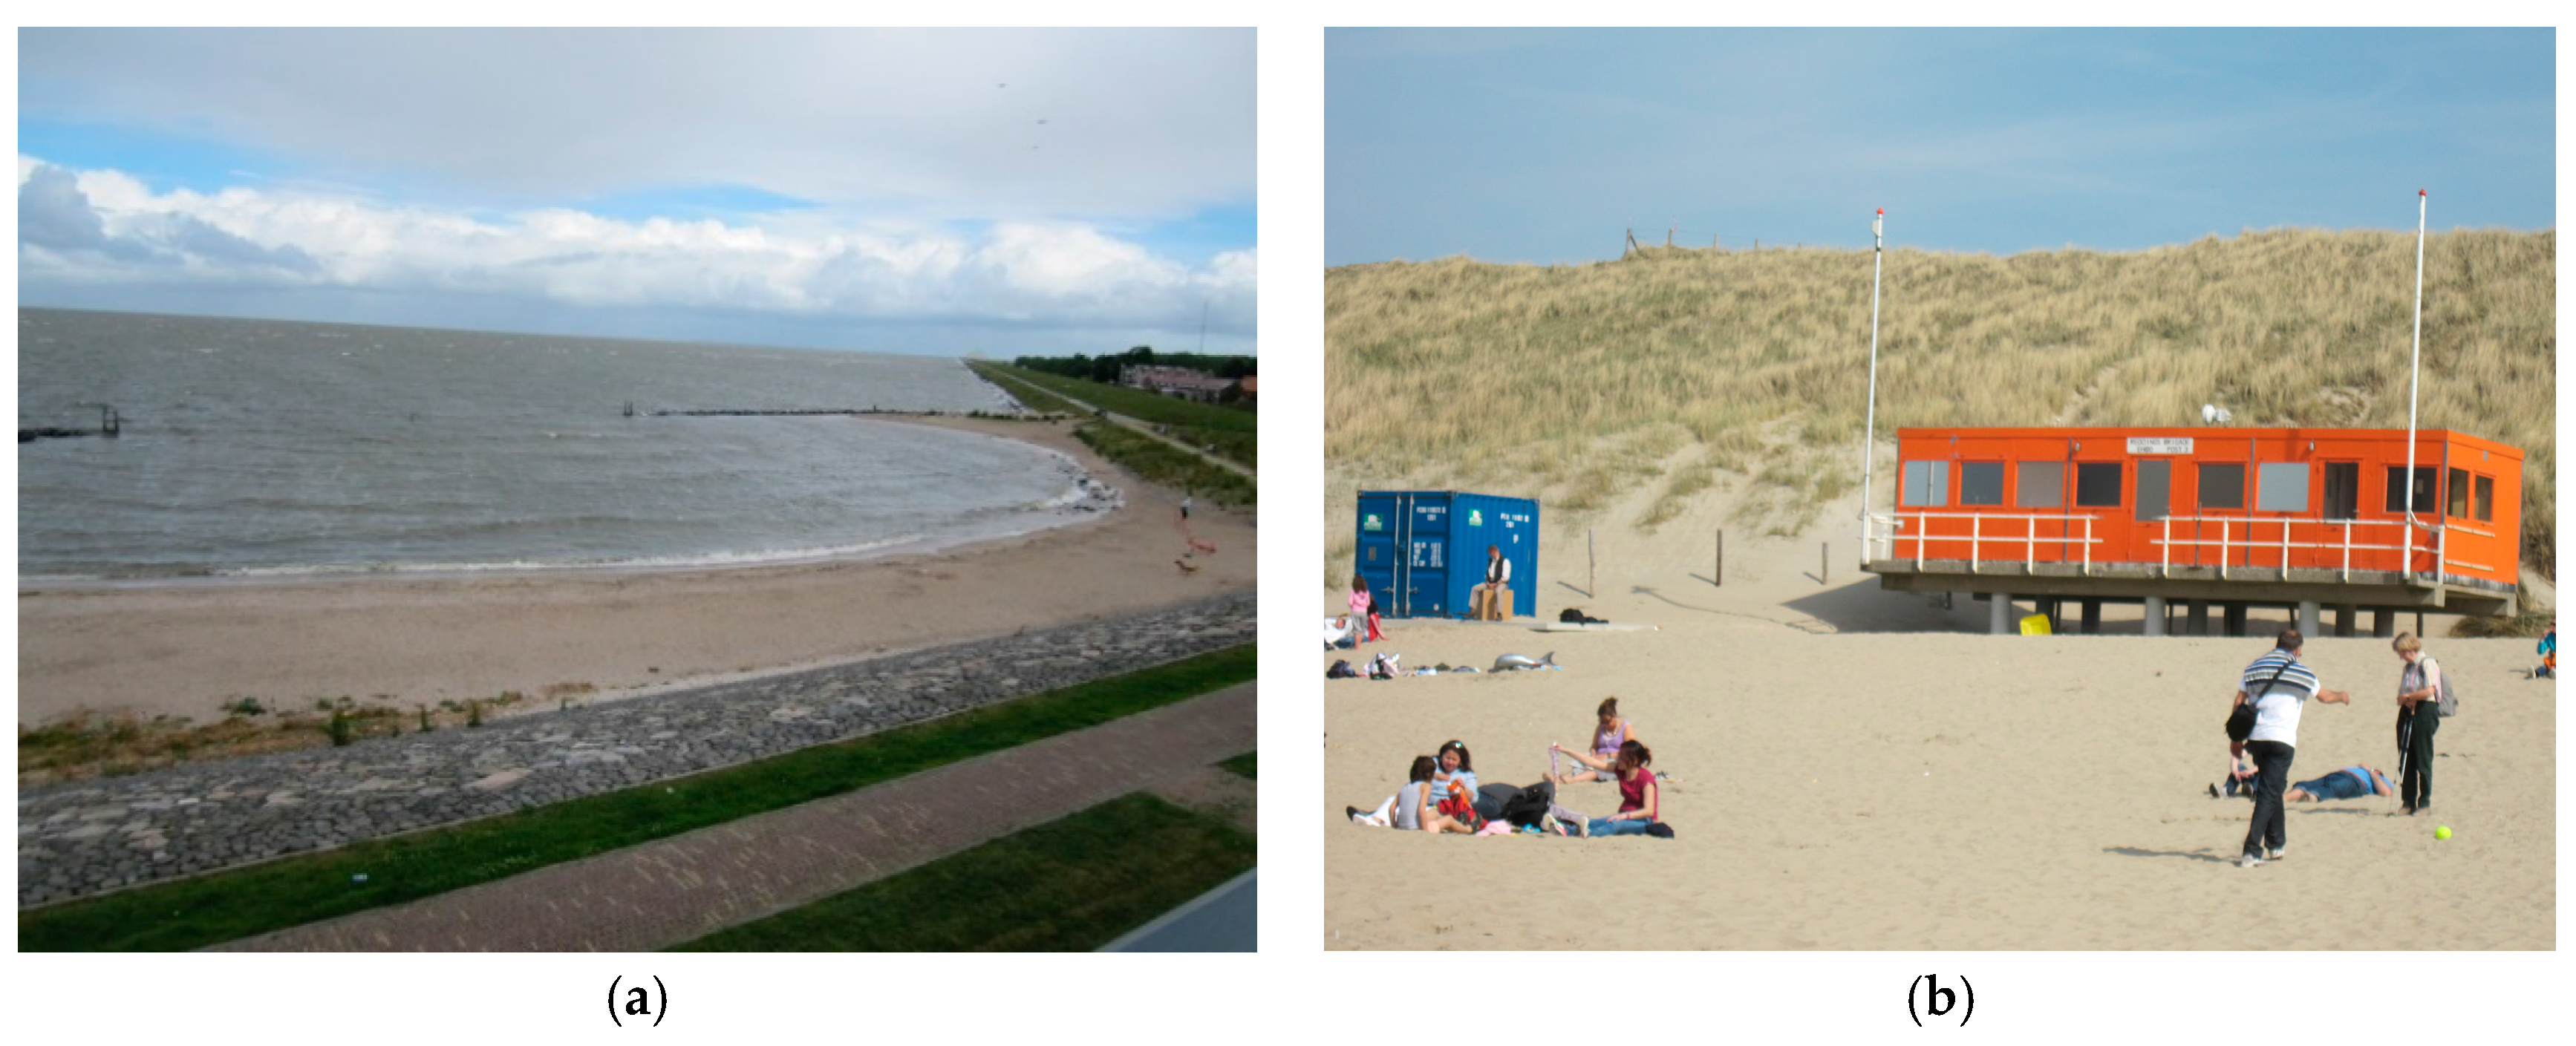
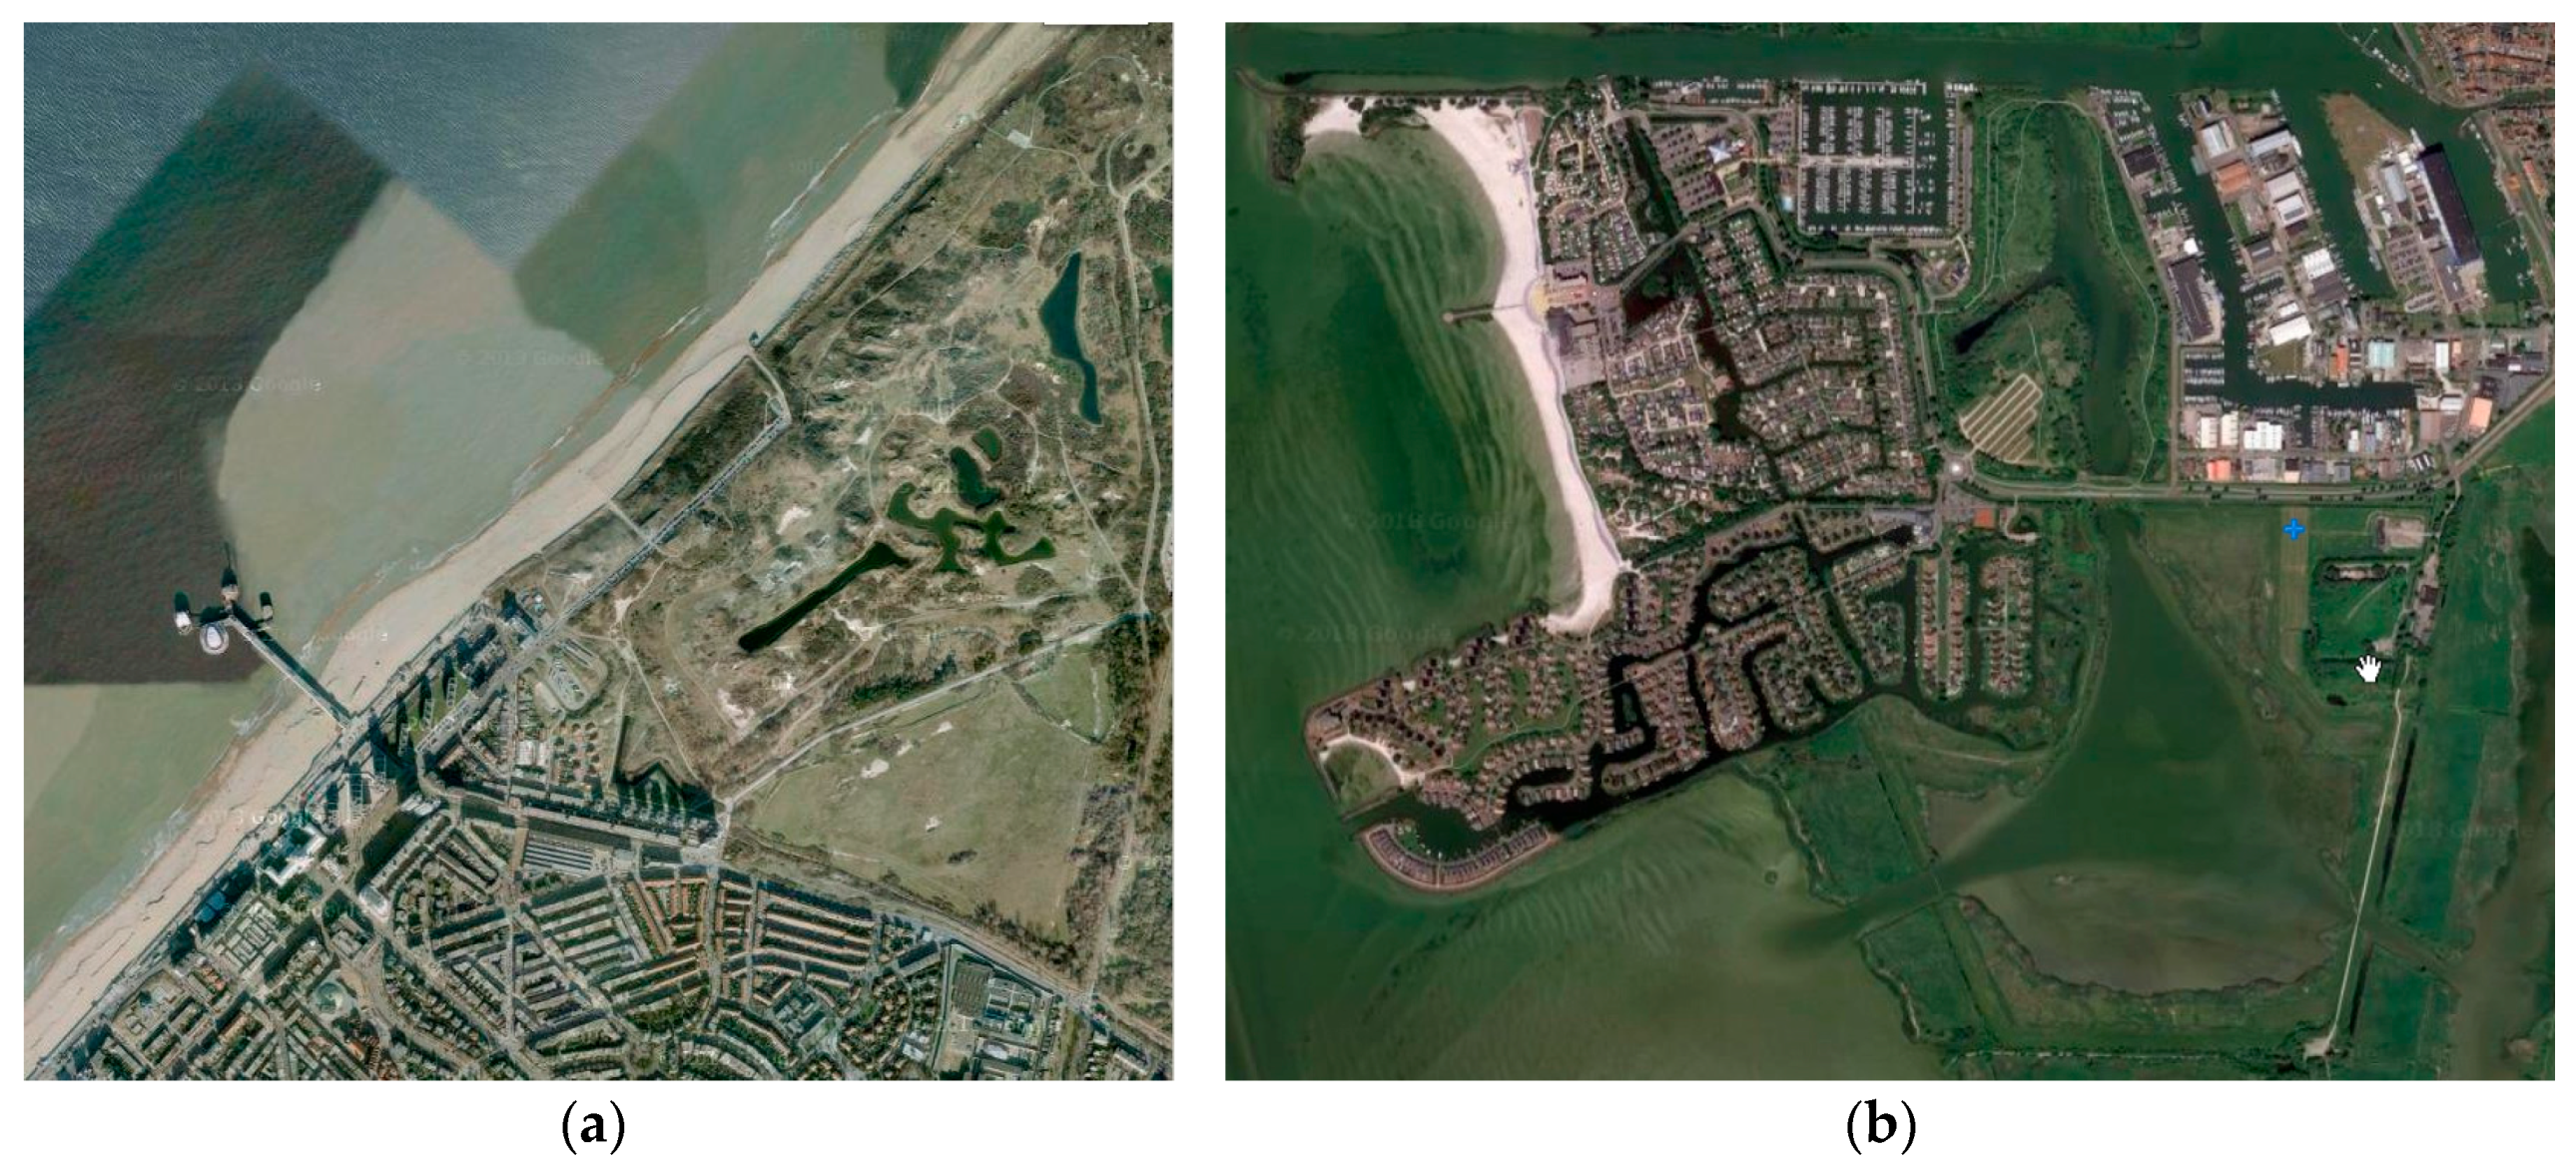
A dike is generally considered to be an embankment for controlling the water in rivers or holding back seawater. In hydraulic engineering, it is either manmade or a strengthened embankment based on natural levees. Generally, it consists of one crest and two slopes along the water body on one side, but is more complicated when combined with other functions or structures.
Figure 2a is a typical sea dike in Urk, the Netherlands.
A dune is a natural sea defense formed as wide sand hills but along the coastline. Dunes can have several peats and gulches, and can be desert, forest, or grass.
Figure 2b shows a dune face near Noordwijk in the Netherlands.
Hydraulic structures in a shoreline system are mostly located in key positions to control water flow and obtain safety and convenience. Sluices, dams generally with a bridge surface, and storm surge barriers are common hydraulic structures in a shoreline system.
It is worth mentioning that, in dune shore sections, there are always narrow alluvial shores between the dune and sea; this association is common and appears frequently elsewhere; indeed, the North Sea takes sand to the west shore of the Netherlands. Dunes in Holland are accompanied by alluvial shores due to flushing of sea water in the last hydrology and climate period, not long ago. This kind of alluvial shoreline is part of the dune protection in Holland (except in the delta area, where such shores are protected by flood walls or hydraulic structure).
3.2. Characters of the Shoreline System
The safety of a shoreline system depends not only on shoreline structure but also on the requirements of human activities and environmental changes near the shoreline. Hence, we need to take into account features of not only the shoreline structure but also the shoreline environment. Shoreline characteristics generally include the following surfaces: water, soil, sand, forest, grass, metal structure, asphalt, and concrete.
Table 2 lists the characteristics and hydraulic parameters of dikes, dunes, and hydraulic structures from the point of view of RS and flood defense, along with the related RS methods.
4. Shoreline Structure Estimation Model with Ecological Knowledge-Oriented Reclassification
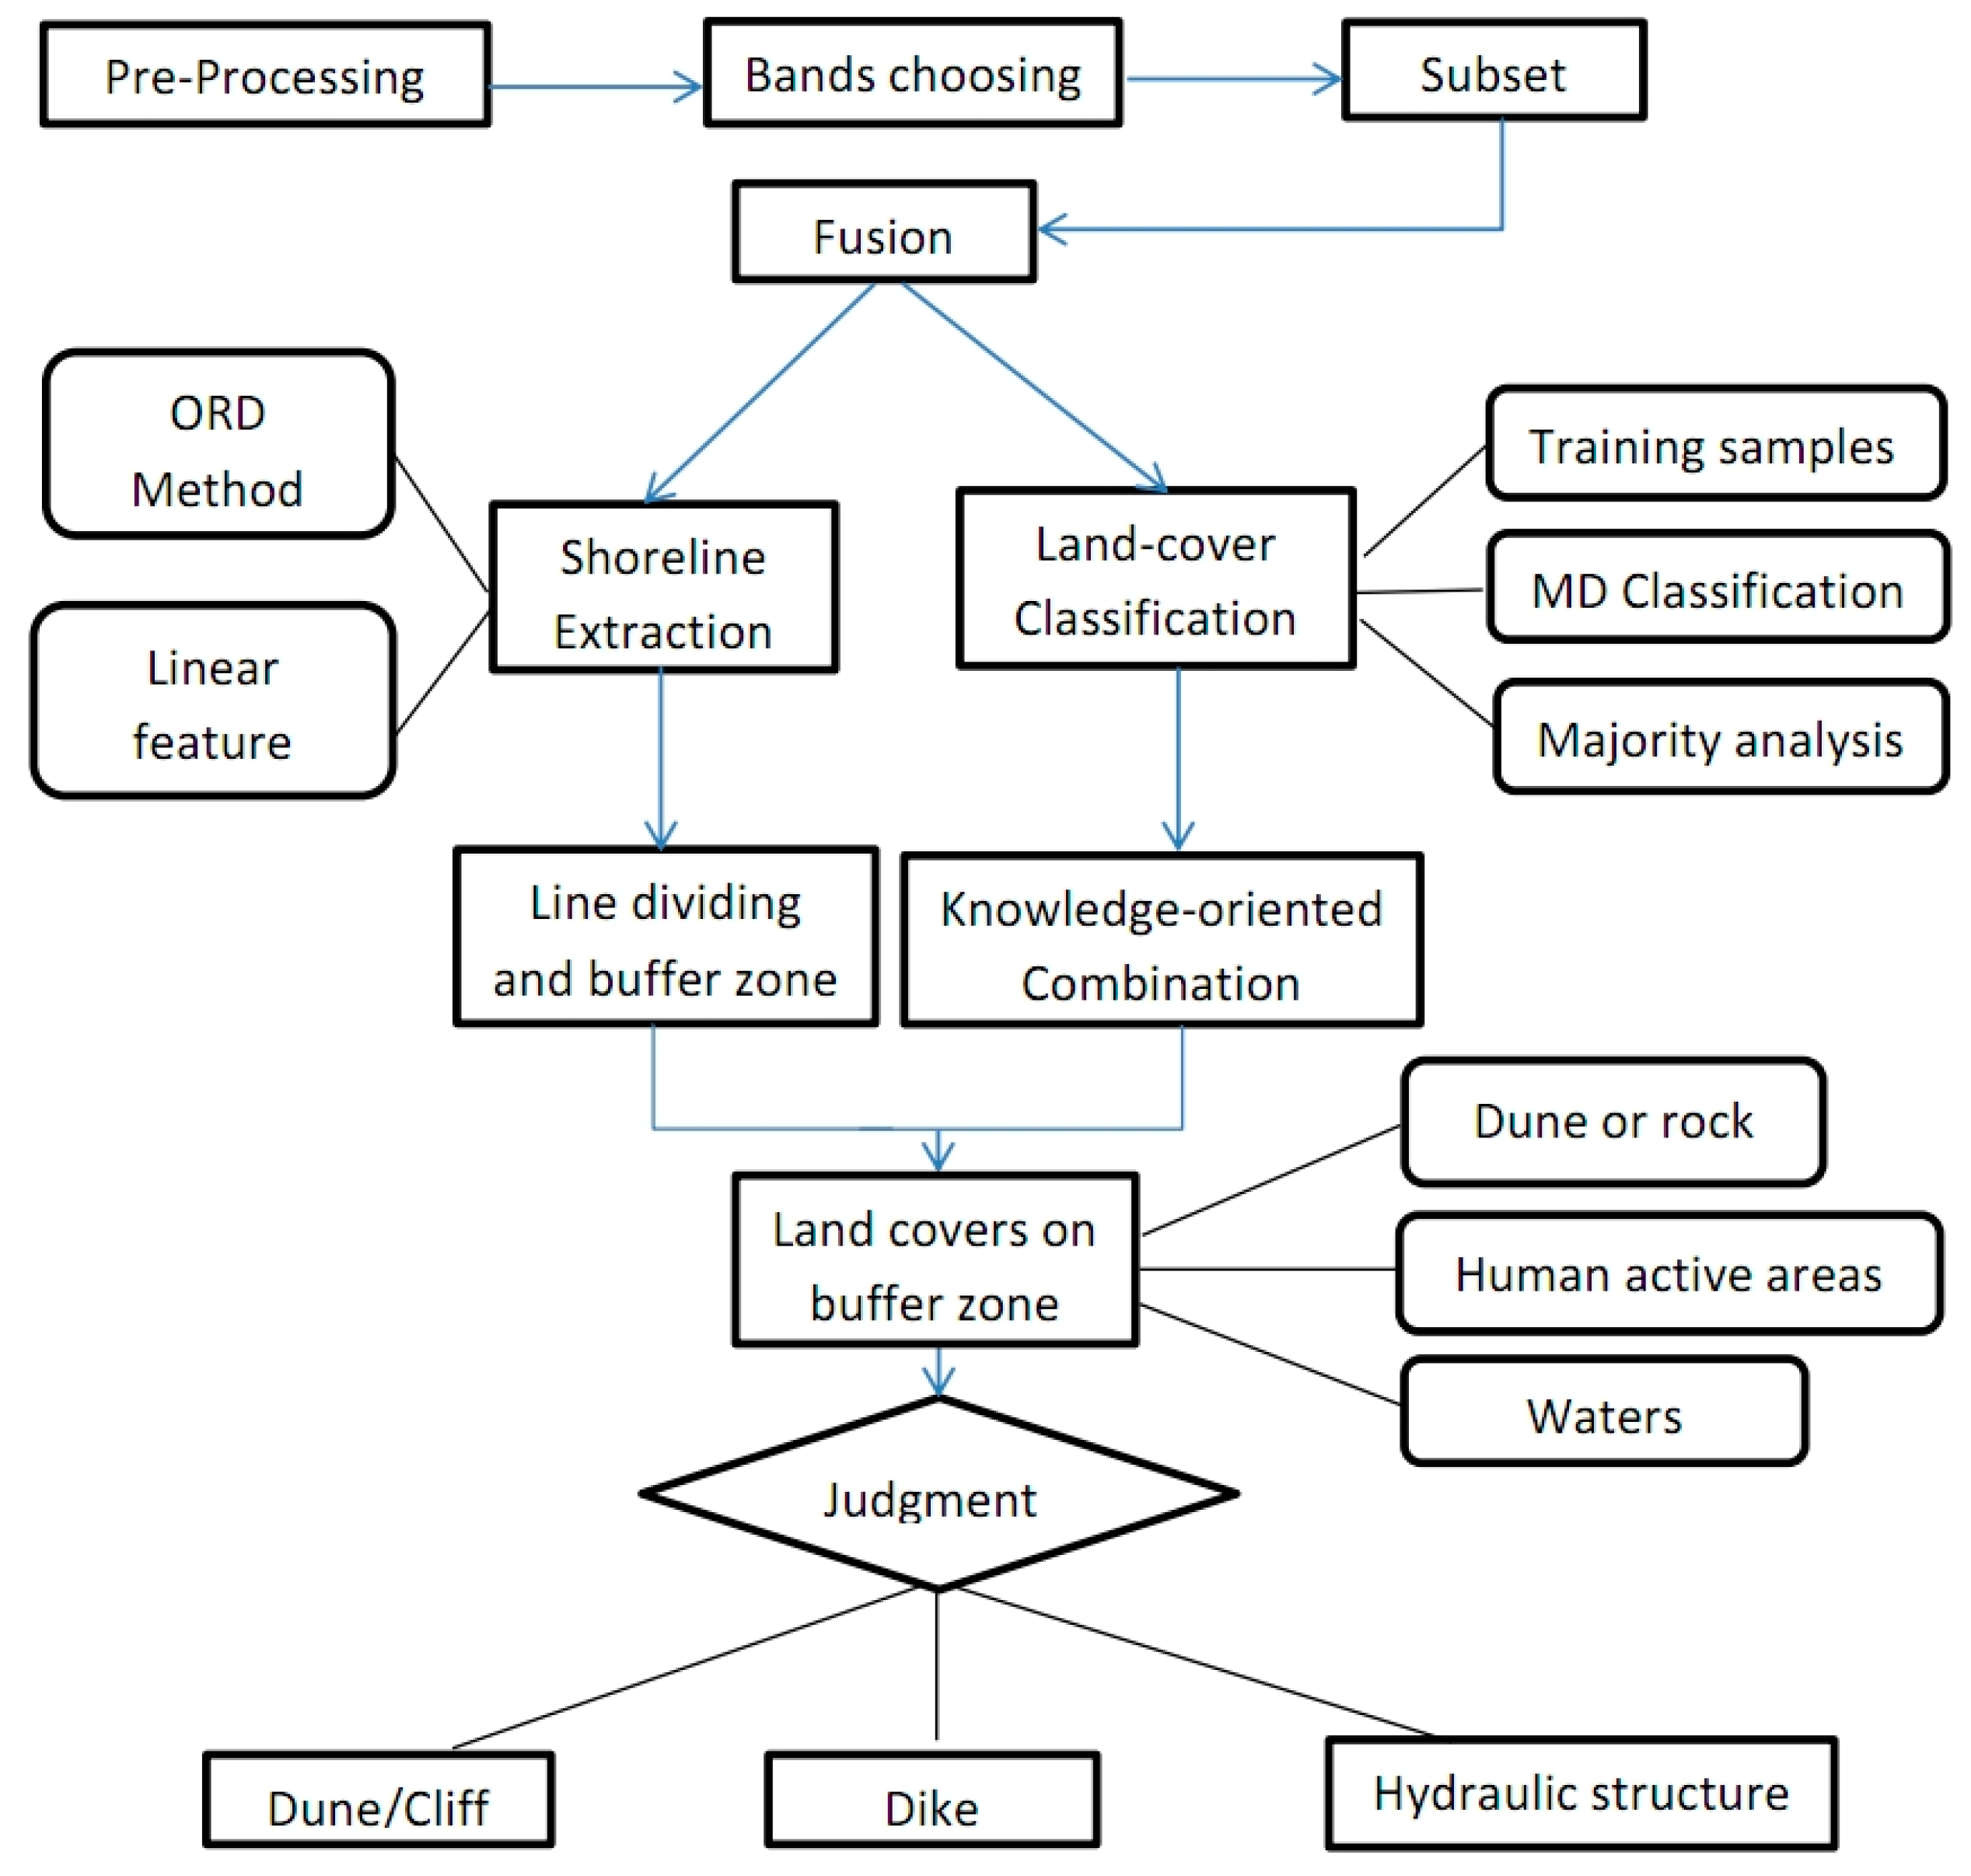
4.1. Workflow of the Method
There are two essential elements for estimating the shoreline structure in this method as introduced in the first section: a reasonable shoreline location line and a logical land cover classification map. The main procedures for shoreline system estimation from a perspective of hydraulic engineering are illustrated in the following items, which are in line with the RS image preprocessing procedures, i.e., geometric transforming, spectrum transforming, and spatial subsets. Based on the band choice as mentioned previously, image fusion is processed to improve image resolution, and workflow goes in two parallel preparatory directions—one for water/land boundary delineation and shoreline extraction and another for an integrated ecological land cover map—until the shoreline structure is estimated according to the percentage calculation of the land cover in the buffer zone behind the shoreline. The workflow for the method of shoreline extraction, land cover classification, and shoreline structure estimation is represented in
Figure 3.
The location of the shoreline can be extracted from the raster image, relying on its linear feature and position on the boundary of water and land. Accurately mapping of the shoreline is essential for laying out flood defenses and is needed later, in this case study, to calculate the percentage of the land cover around it.
RS classification identifies and recognizes different land cover pixels that are the same or similar to a group of the same category on the raster image by calculating radiation information from different land cover types. It does so according to the hypothesis that identical or similar earth covers dominate the pixels that are recording them, which is a valid assumption if the image resolution is quite high and can be matched to the density of the land cover. The classification method used in this study enabled us to recognize different farmlands, different dune areas, different sea water areas, and other landforms assembled on a large scale. We were therefore able to produce a corresponding preliminary classification map and extract locations, but we are unable to describe the shoreline structure in detail.
Based on the information of the shoreline location and land cover information near the shoreline, by using ecological knowledge or other information such as altitude data, we were able to deduce shoreline structure types that constitute a flood defense and conform to the safety levels of a flood defense. The key of the estimation is the relationship between land cover information and the requirements of the flood defense. In the case study here, the sea dikes or flood walls are always built on the edge of the areas of human activity but without the protection of dunes or cliffs; hydraulic structures are always deployed at key positions of water flow and with linear features; dunes are usually along the shoreline and are several hundred meters in width. Therefore, recognition of areas of human activity is necessary and can be achieved by reclassifying residential areas, farmlands, and industrial areas as a group on the classification map. To recognize existing shoreline flood defense structure types or those that should be deployed along a section of shoreline, we propose a reclassification model based on categorizing the classification map such that the flood defense information related to the shoreline structure can be determined. The reclassification in this methodology is an artificial categorization of land cover for recognizing different levels of flood safety alone the shoreline. Other indexes or information extracted from other RS data or obtained from other sources—such as water level, quantity of flow, economic value behind the shoreline, and especially elevation extracted from LiDAR datasets—can be added to the corresponding image pixels for reclassification.
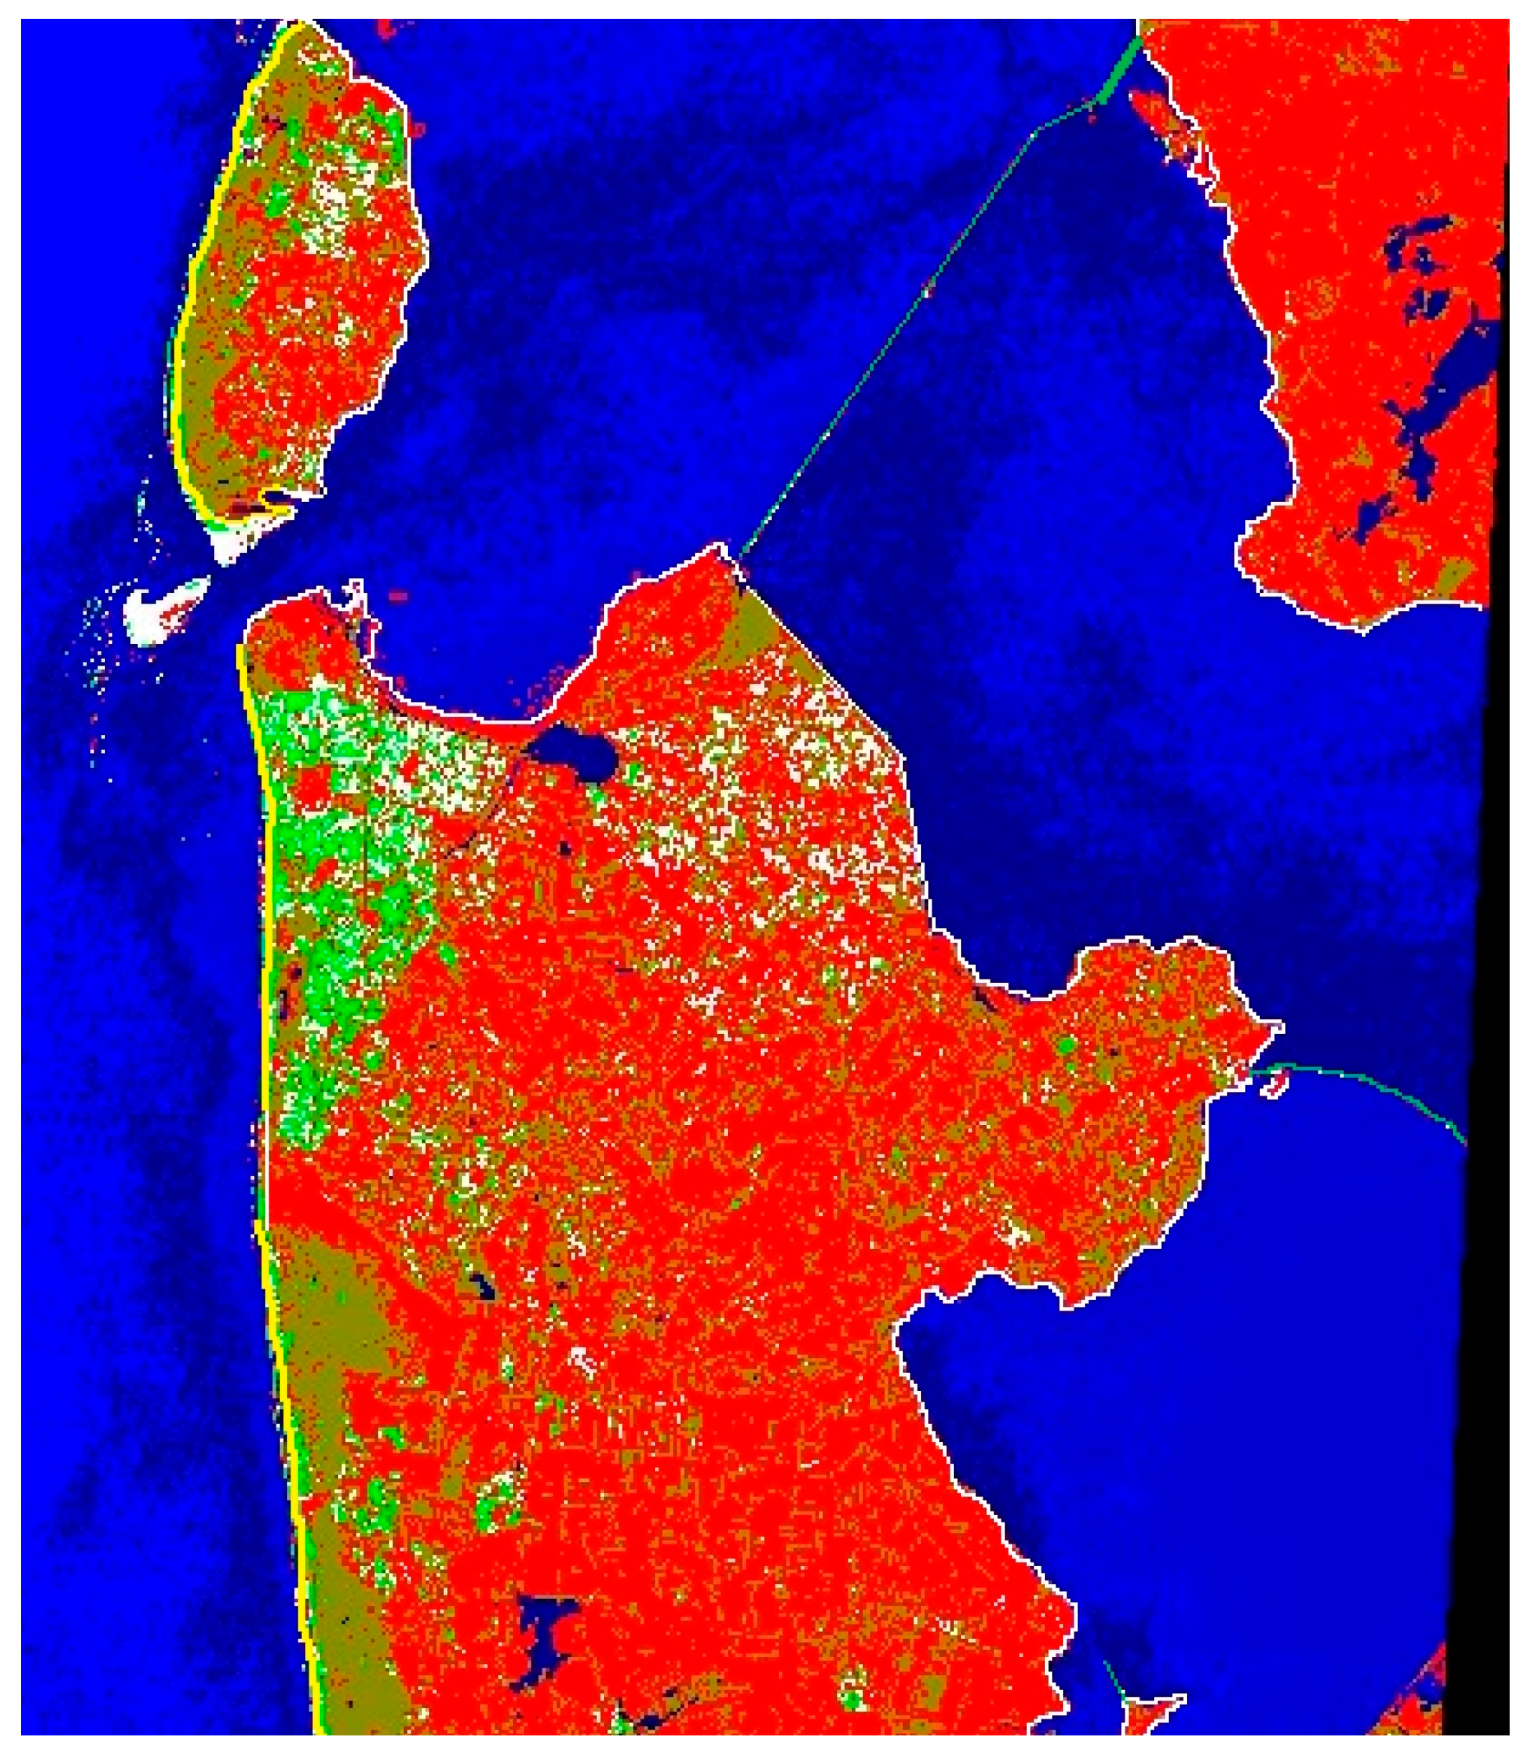
4.2. Shoreline Extraction
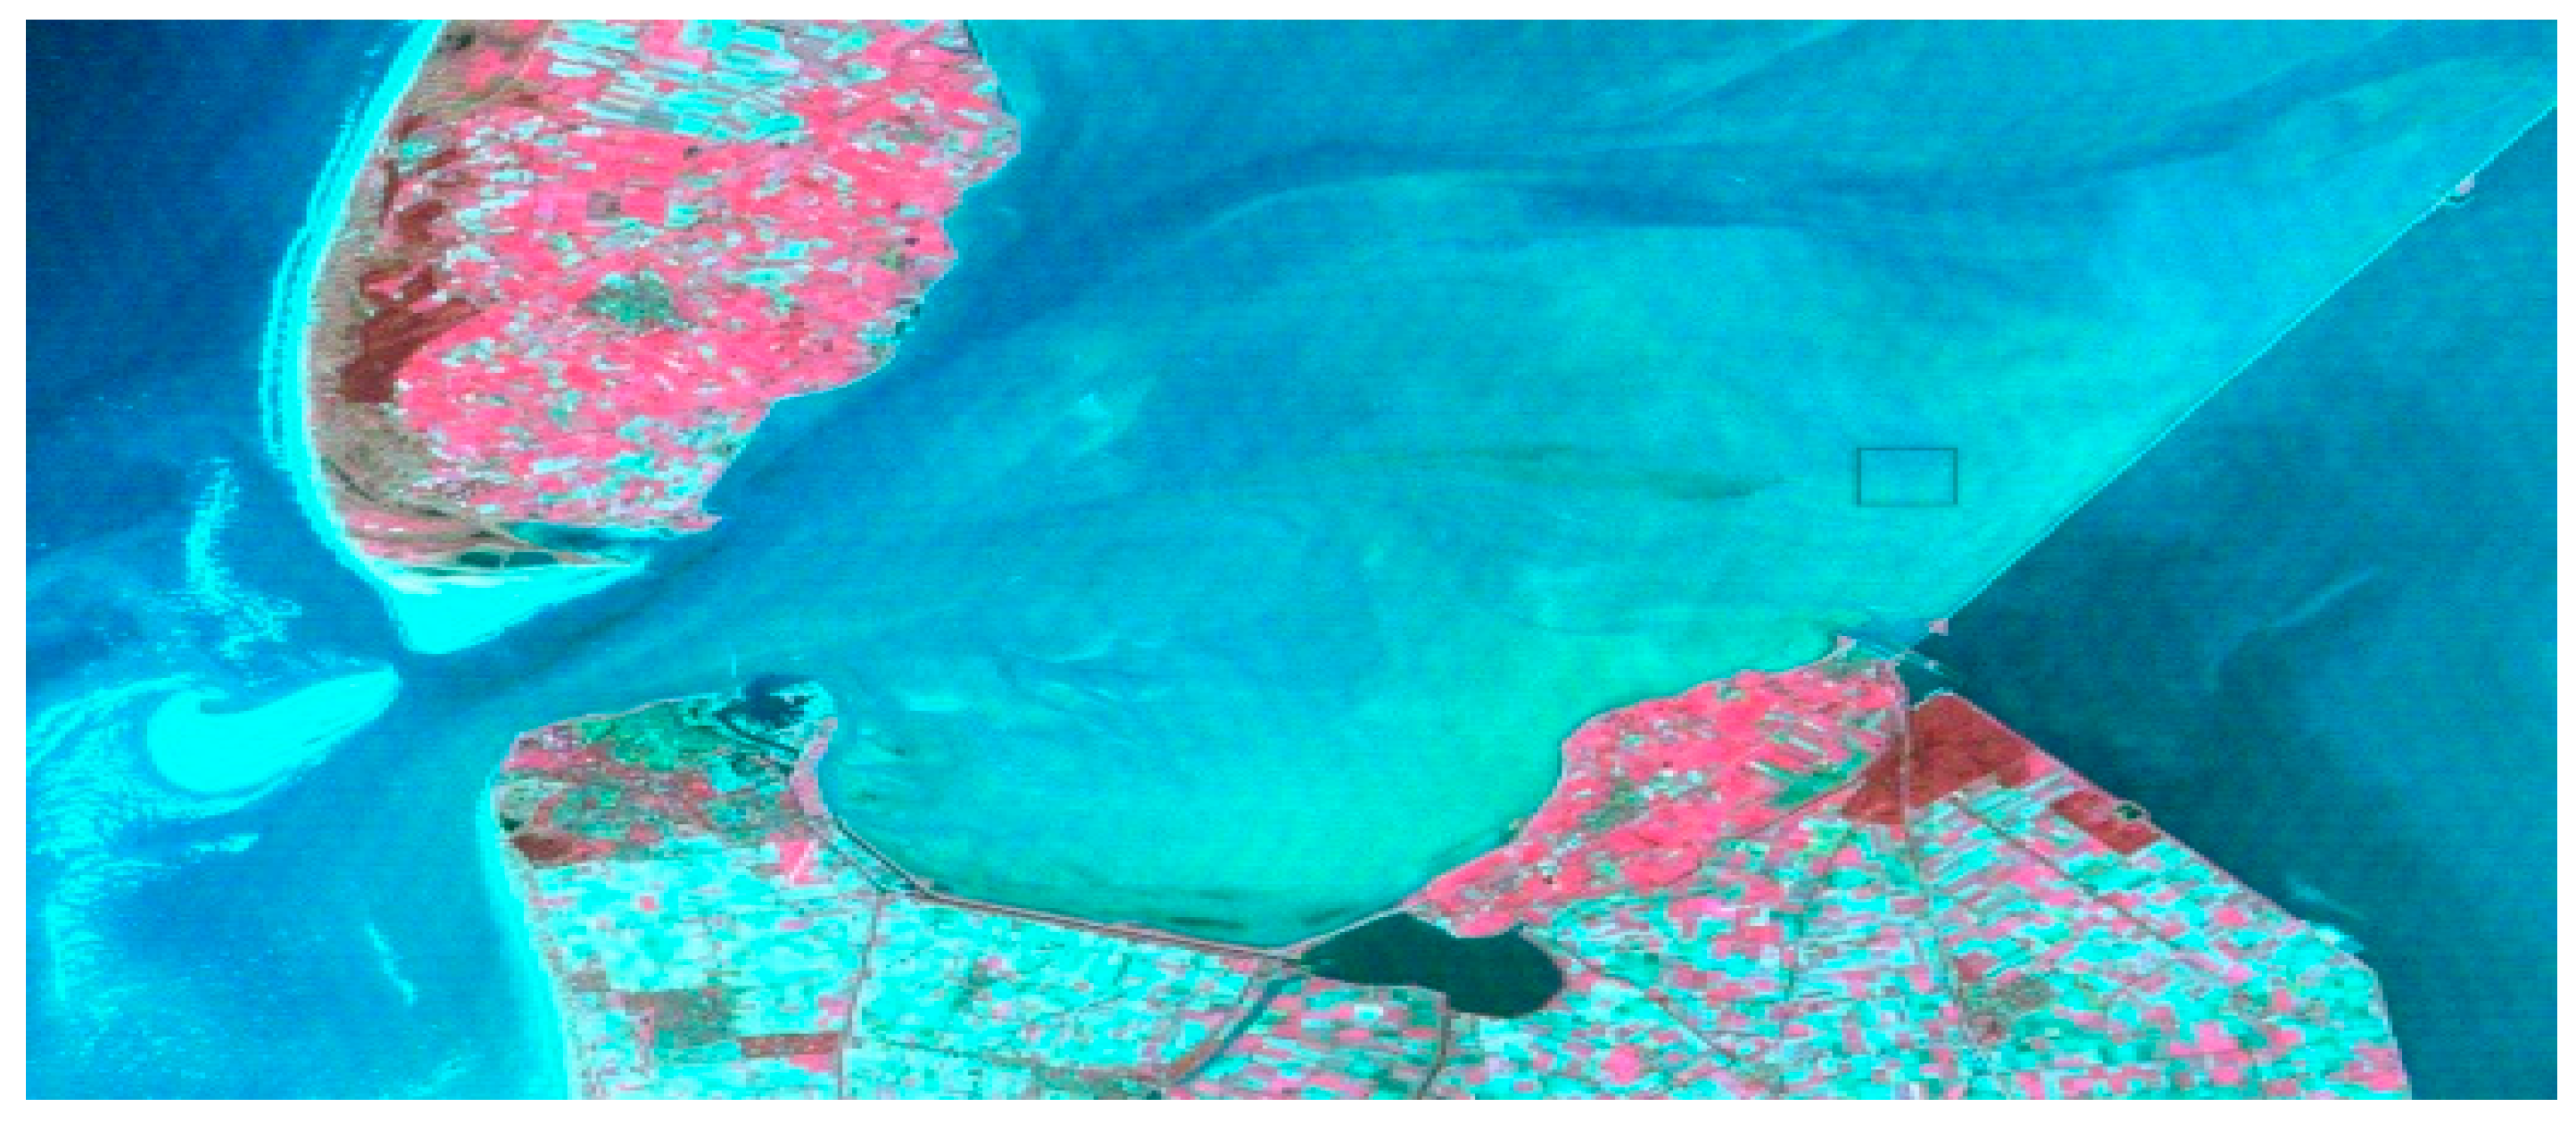
The shoreline in this study, used for sea defense, is located along the coastline and crosses the narrow part of the sea or estuary to form a flood defense safety system by controlling water levels while meeting Holland’s requirements for transport and ecology. Because it is on the edge of the water or land, there is a clear line of demarcation on the special RS image (RGB Bands 4, 3 & 2) in
Figure 4. Where the coastline largely consists of dunes, there can also be a light blue belt as a result of wet sands, and different waters such as sea water and lake water, have different colors that are recognizable both to the human eye and for computing values.
Extraction of the location of a shoreline is the precondition for accurate length and land cover calculation in estimation of shoreline structure later, and can benefit from image with a high resolution and a distinct boundary of water/land.
4.2.1. Image Fusion
Image fusion is a grid image process that is done by resampling on a panchromatic (Pan) band image (seen in
Figure 1b). Resampling is done at the maximum spatial resolution for bands from the same sensors and using a multispectral (MS) image with a low spatial resolution, to produce high-resolution multispectral data at the same spatial resolution as the panchromatic band [
13,
14]. Here, MS Bands 4, 3 & 2 and Pan from ETM+ data are chosen for image fusion using professional satellite image proceeding software ENVI by employing HSV (hue, saturation, and value color space) conversion [
15,
16].
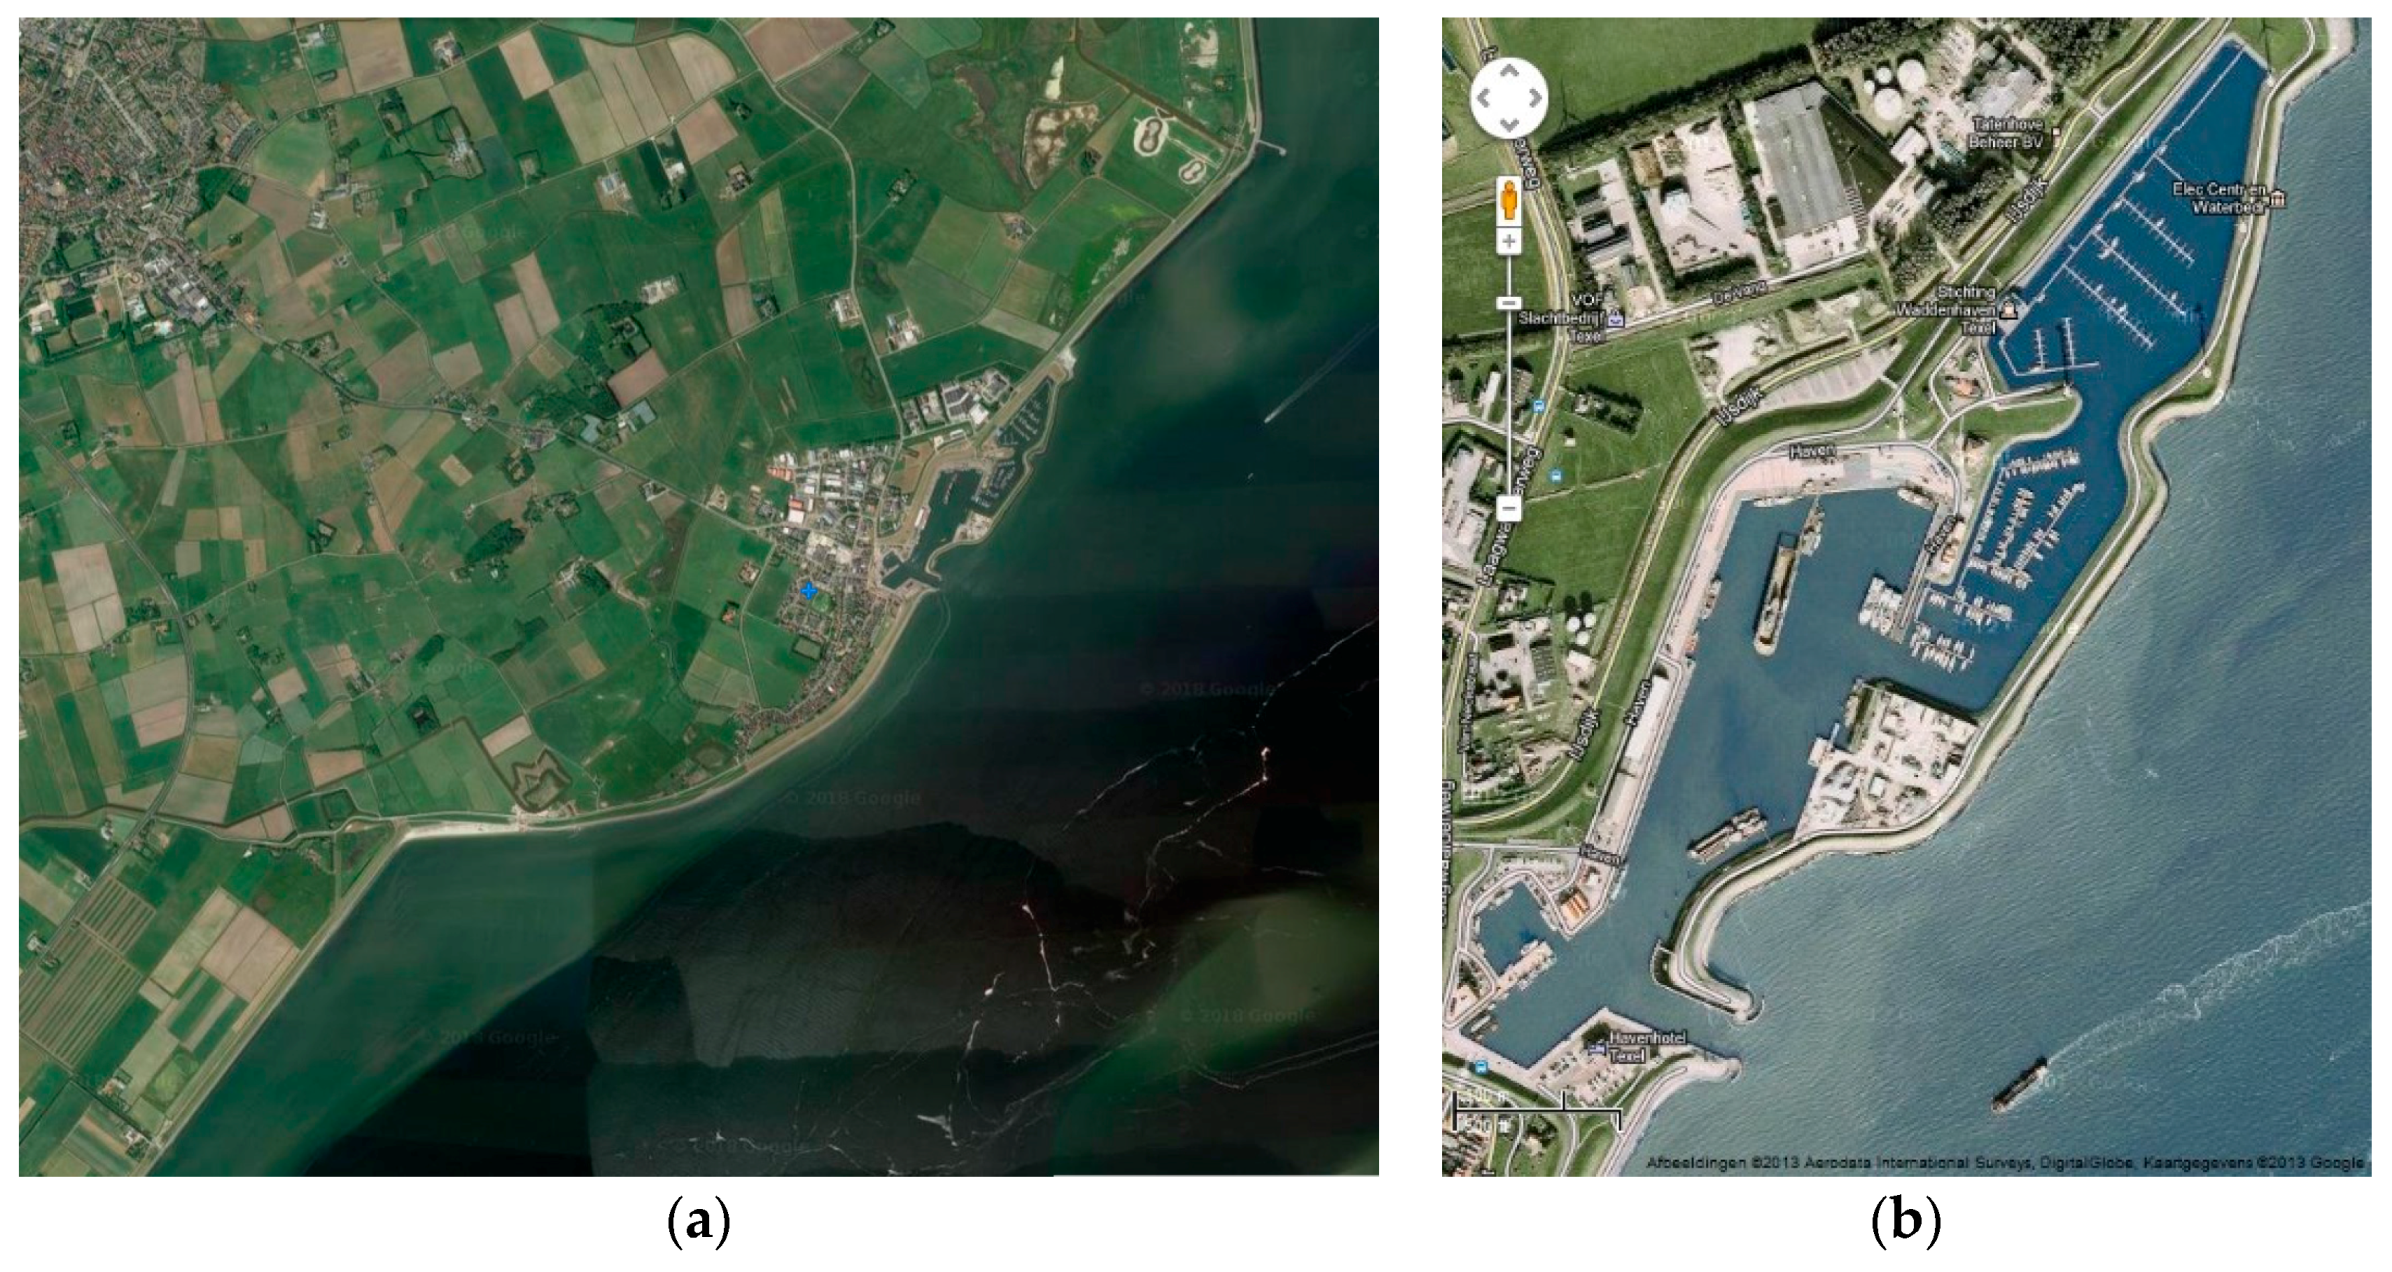
Figure 5a,b respectively show the original and the fusion results at the same magnification scale, while
Figure 6a,b show the high-resolution Google Satellite image of the same area and the detail of a port.
4.2.2. Edge Feature Enhancement and Coastline Extraction
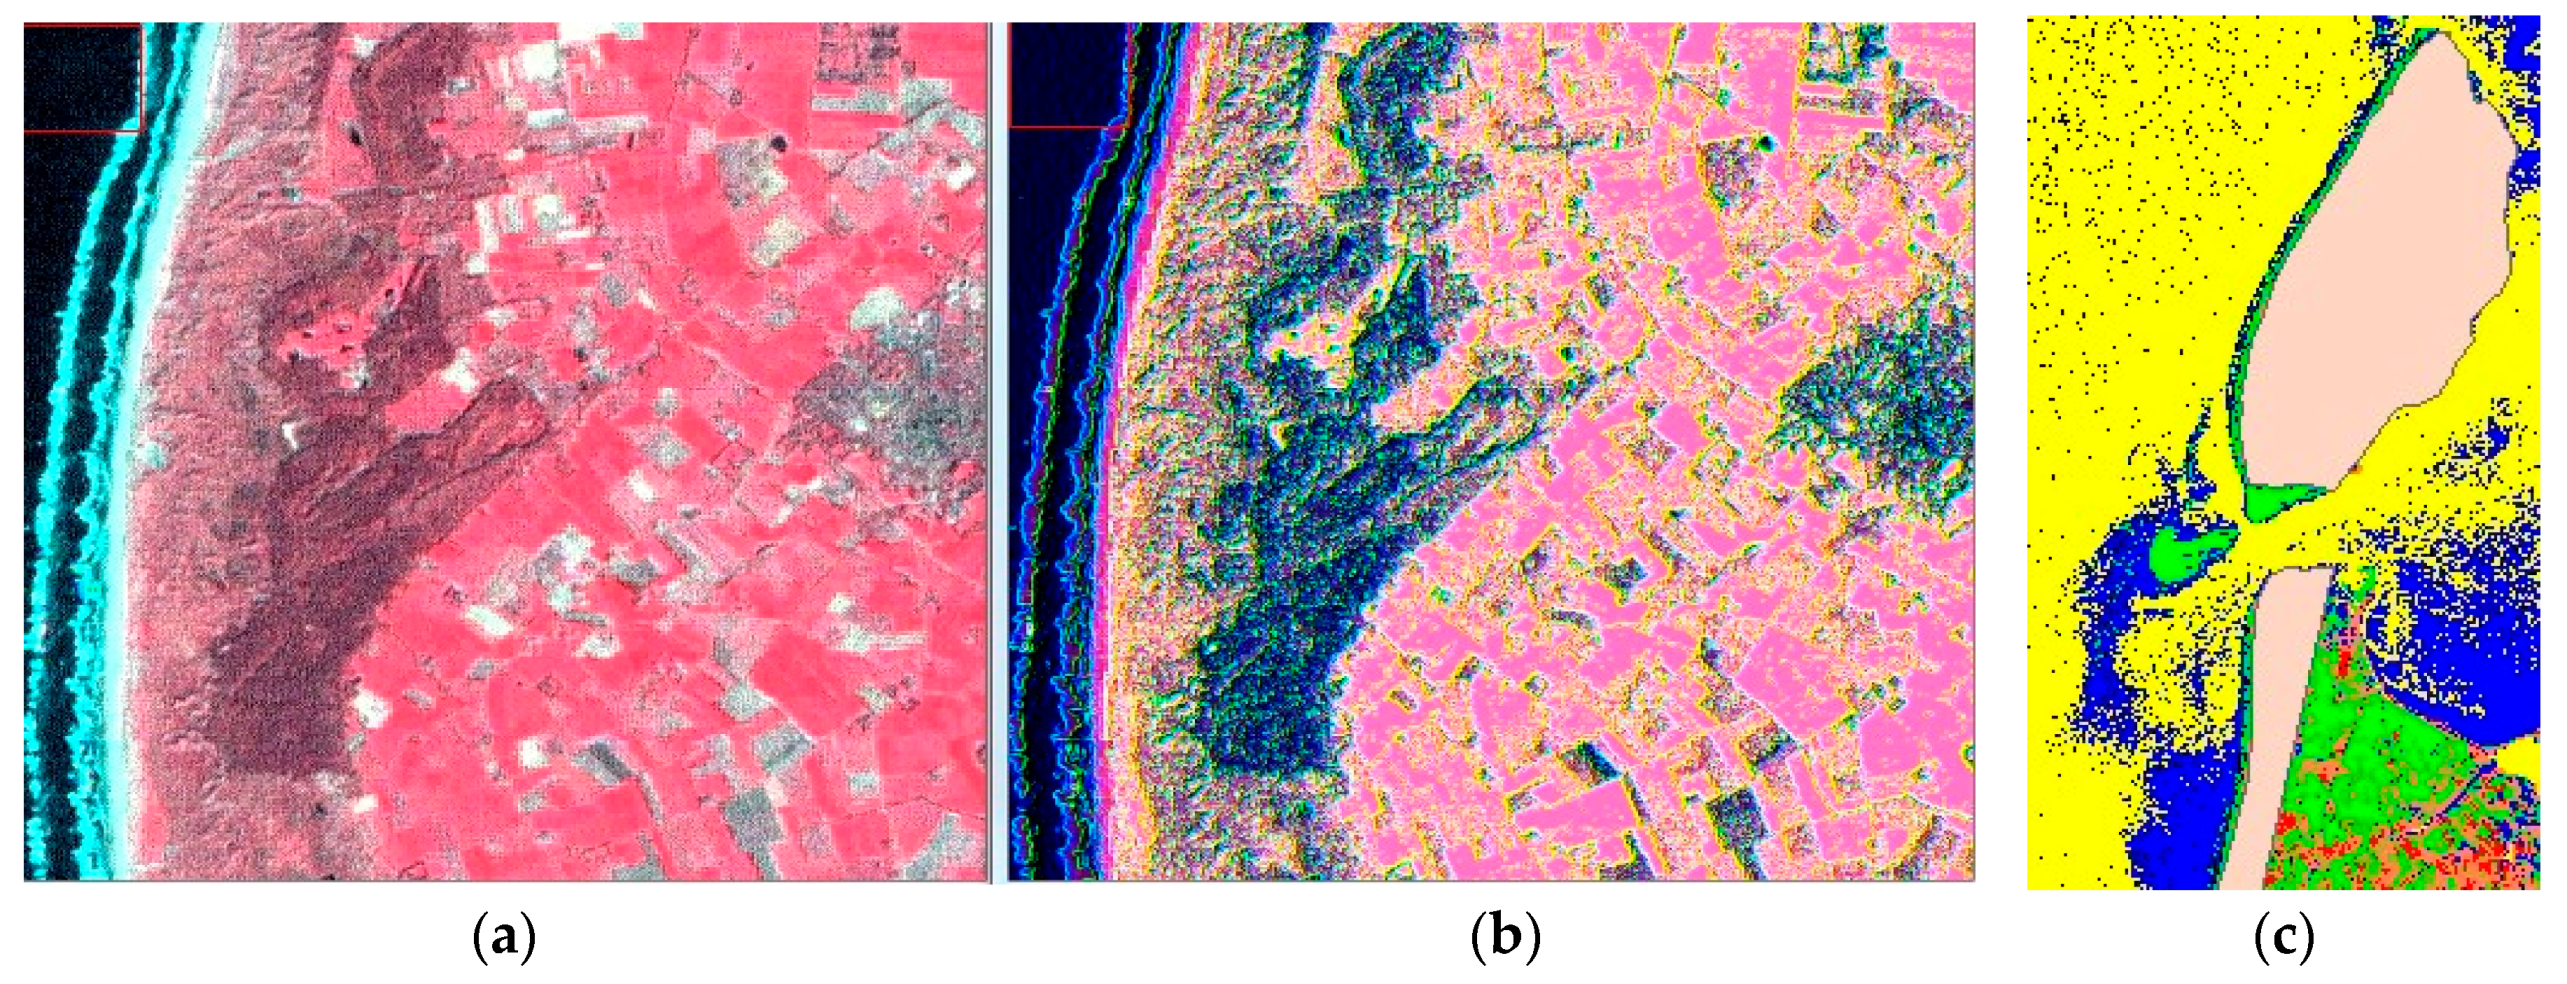
Based on the fused image, two filter operators of convolution, Roberts and Directional, are used to perform edge feature enhancement and obtain two separate images. Then, a false color RGB image is acquired by combining their first bands (the original sharpened image,
Figure 7a; the Roberts image and the Directional image, ORD (original sharpening, Roberts and Directional filter operator enhancing) method,
Figure 7b) to emphasize the coastline and remove the uncertainty of the boundary [
17,
18]. With clear boundaries and an obvious contrast between different objects, the location lines of the coastal shore can be calculated and extracted accurately by the tool Linear Feature Extraction with Intelligent Digitizer in ENVI and saved as a vector image file (seen in
Figure 7c) [
19].
4.3. Classification and Reclassification
The process described immediately above was used to generate a land cover classification map and then integrate the dune areas and the areas of human activity by reclassification, in order to judge the type of the shoreline system segments in the next step. In short, classification was used to generate the land cover map, and reclassification was used for judgment of the shoreline structure.
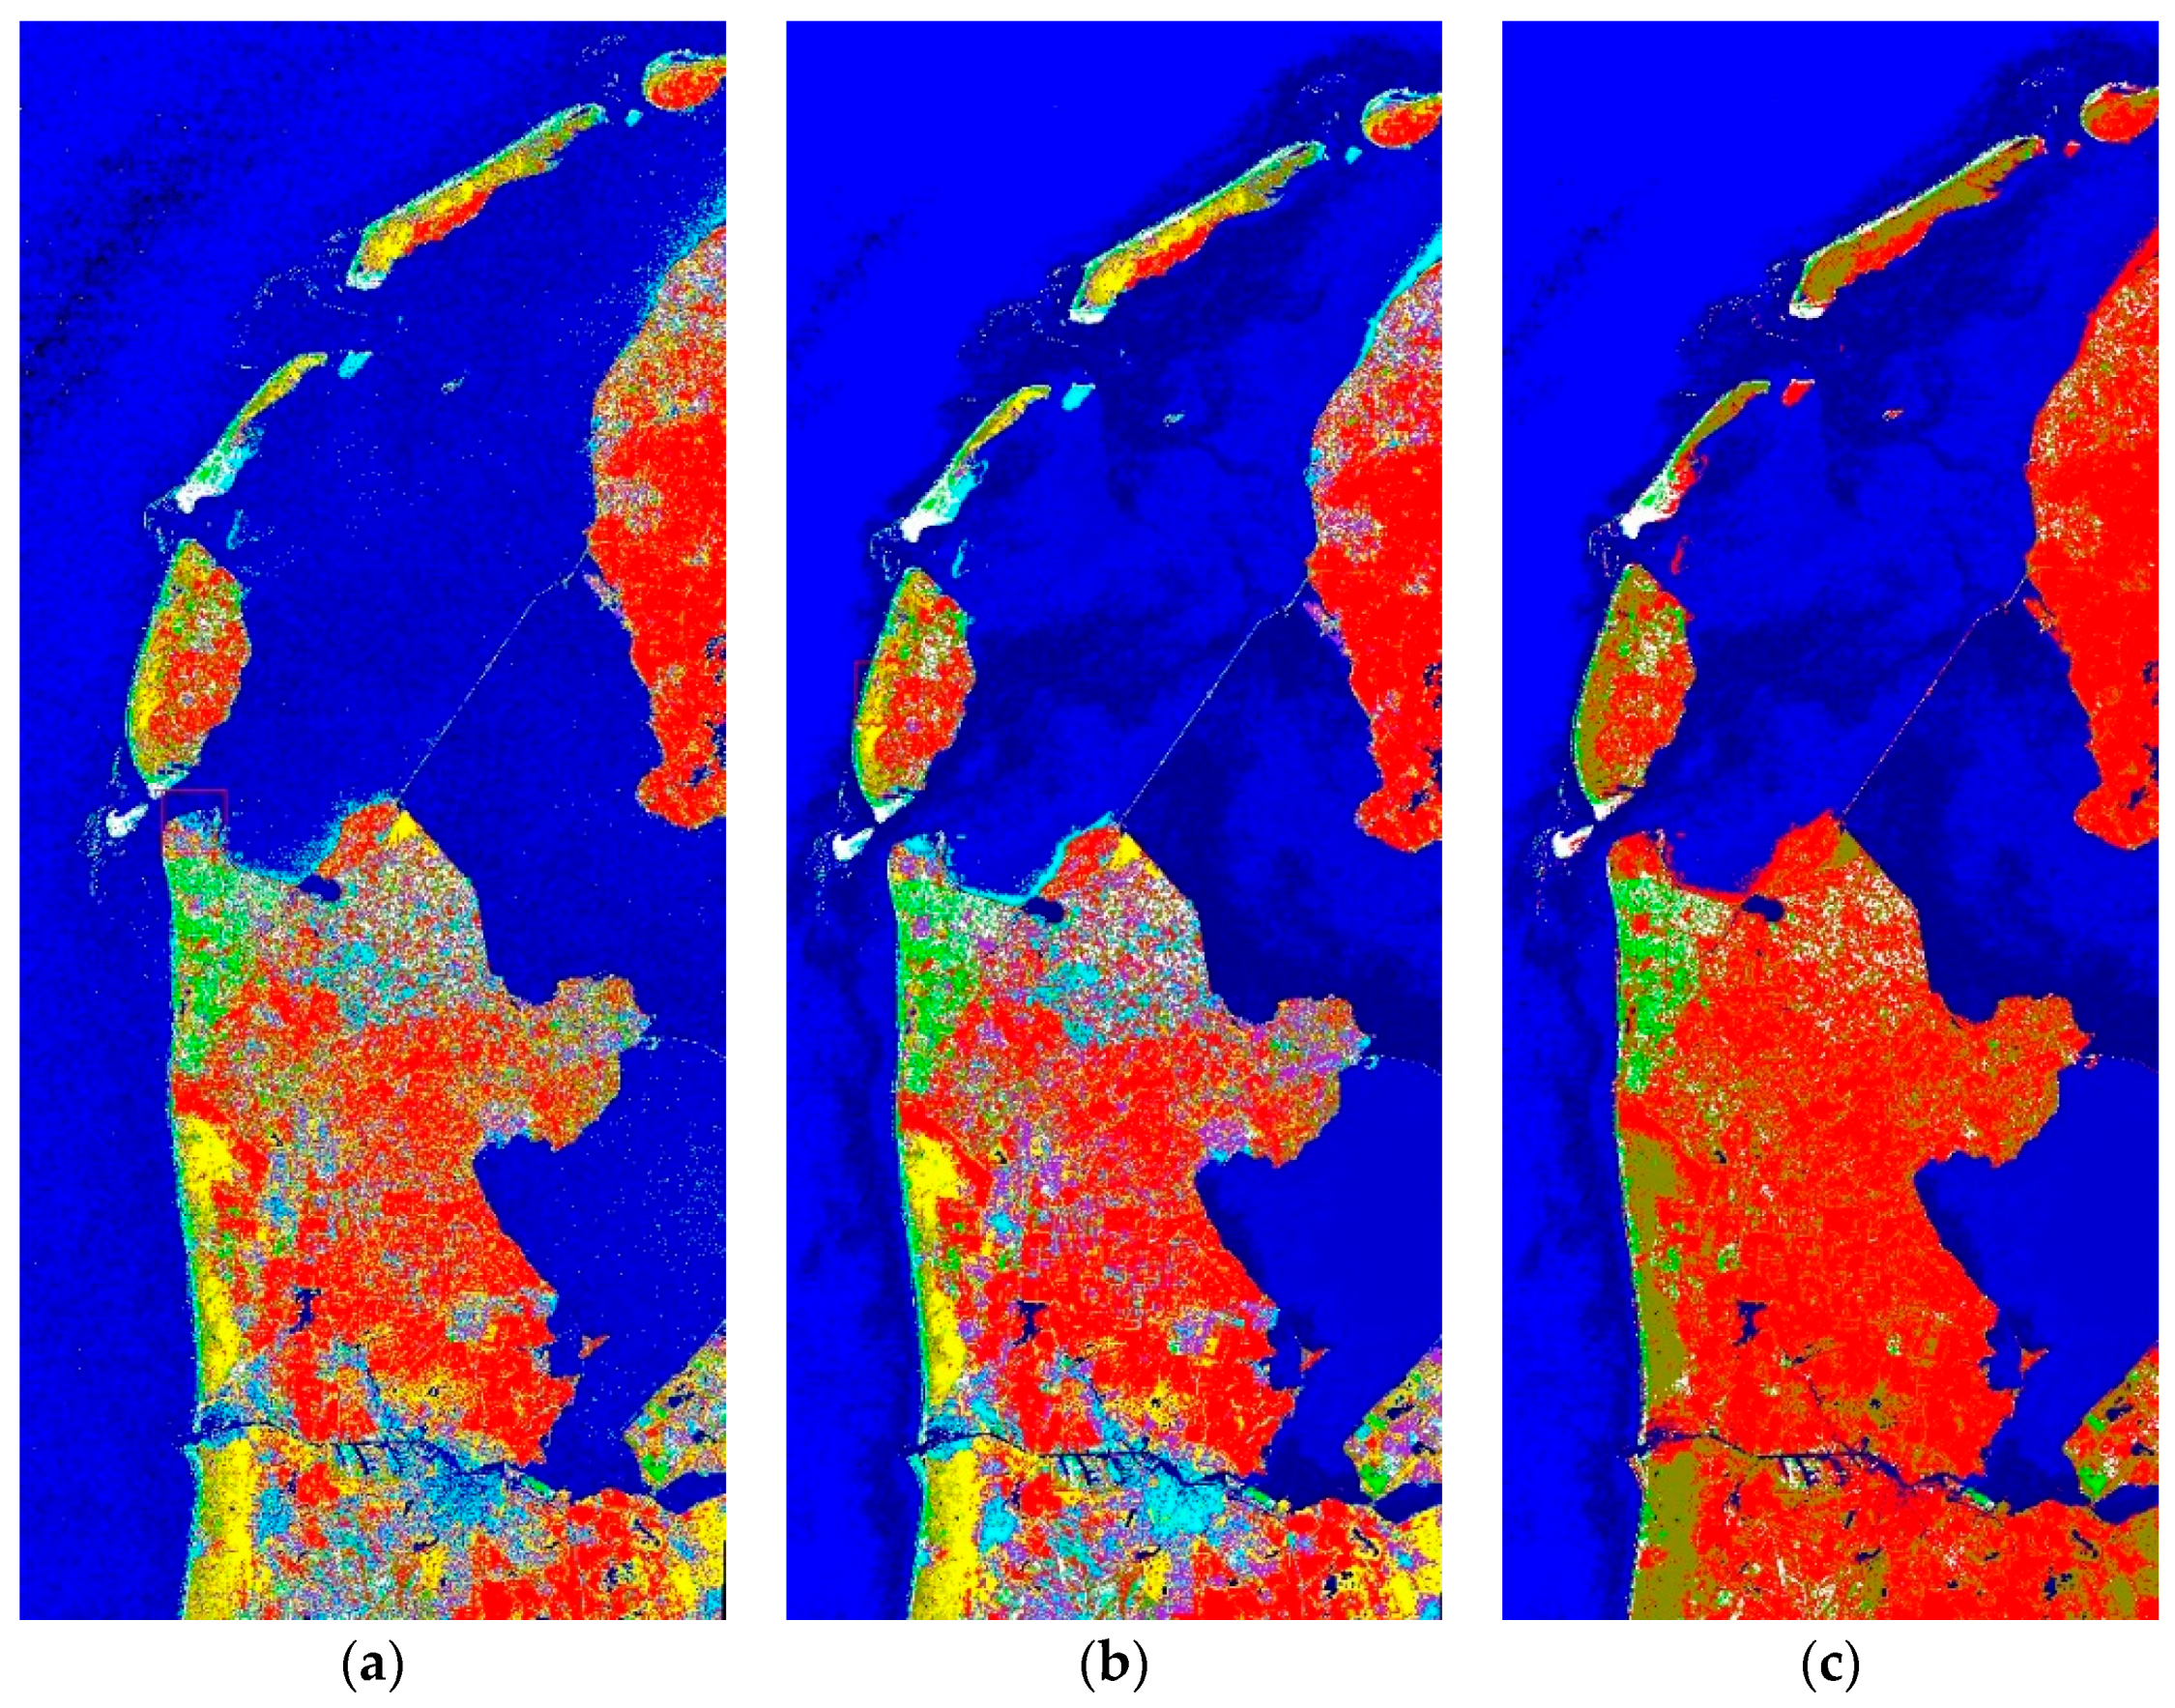
4.3.1. Land Covers Classification
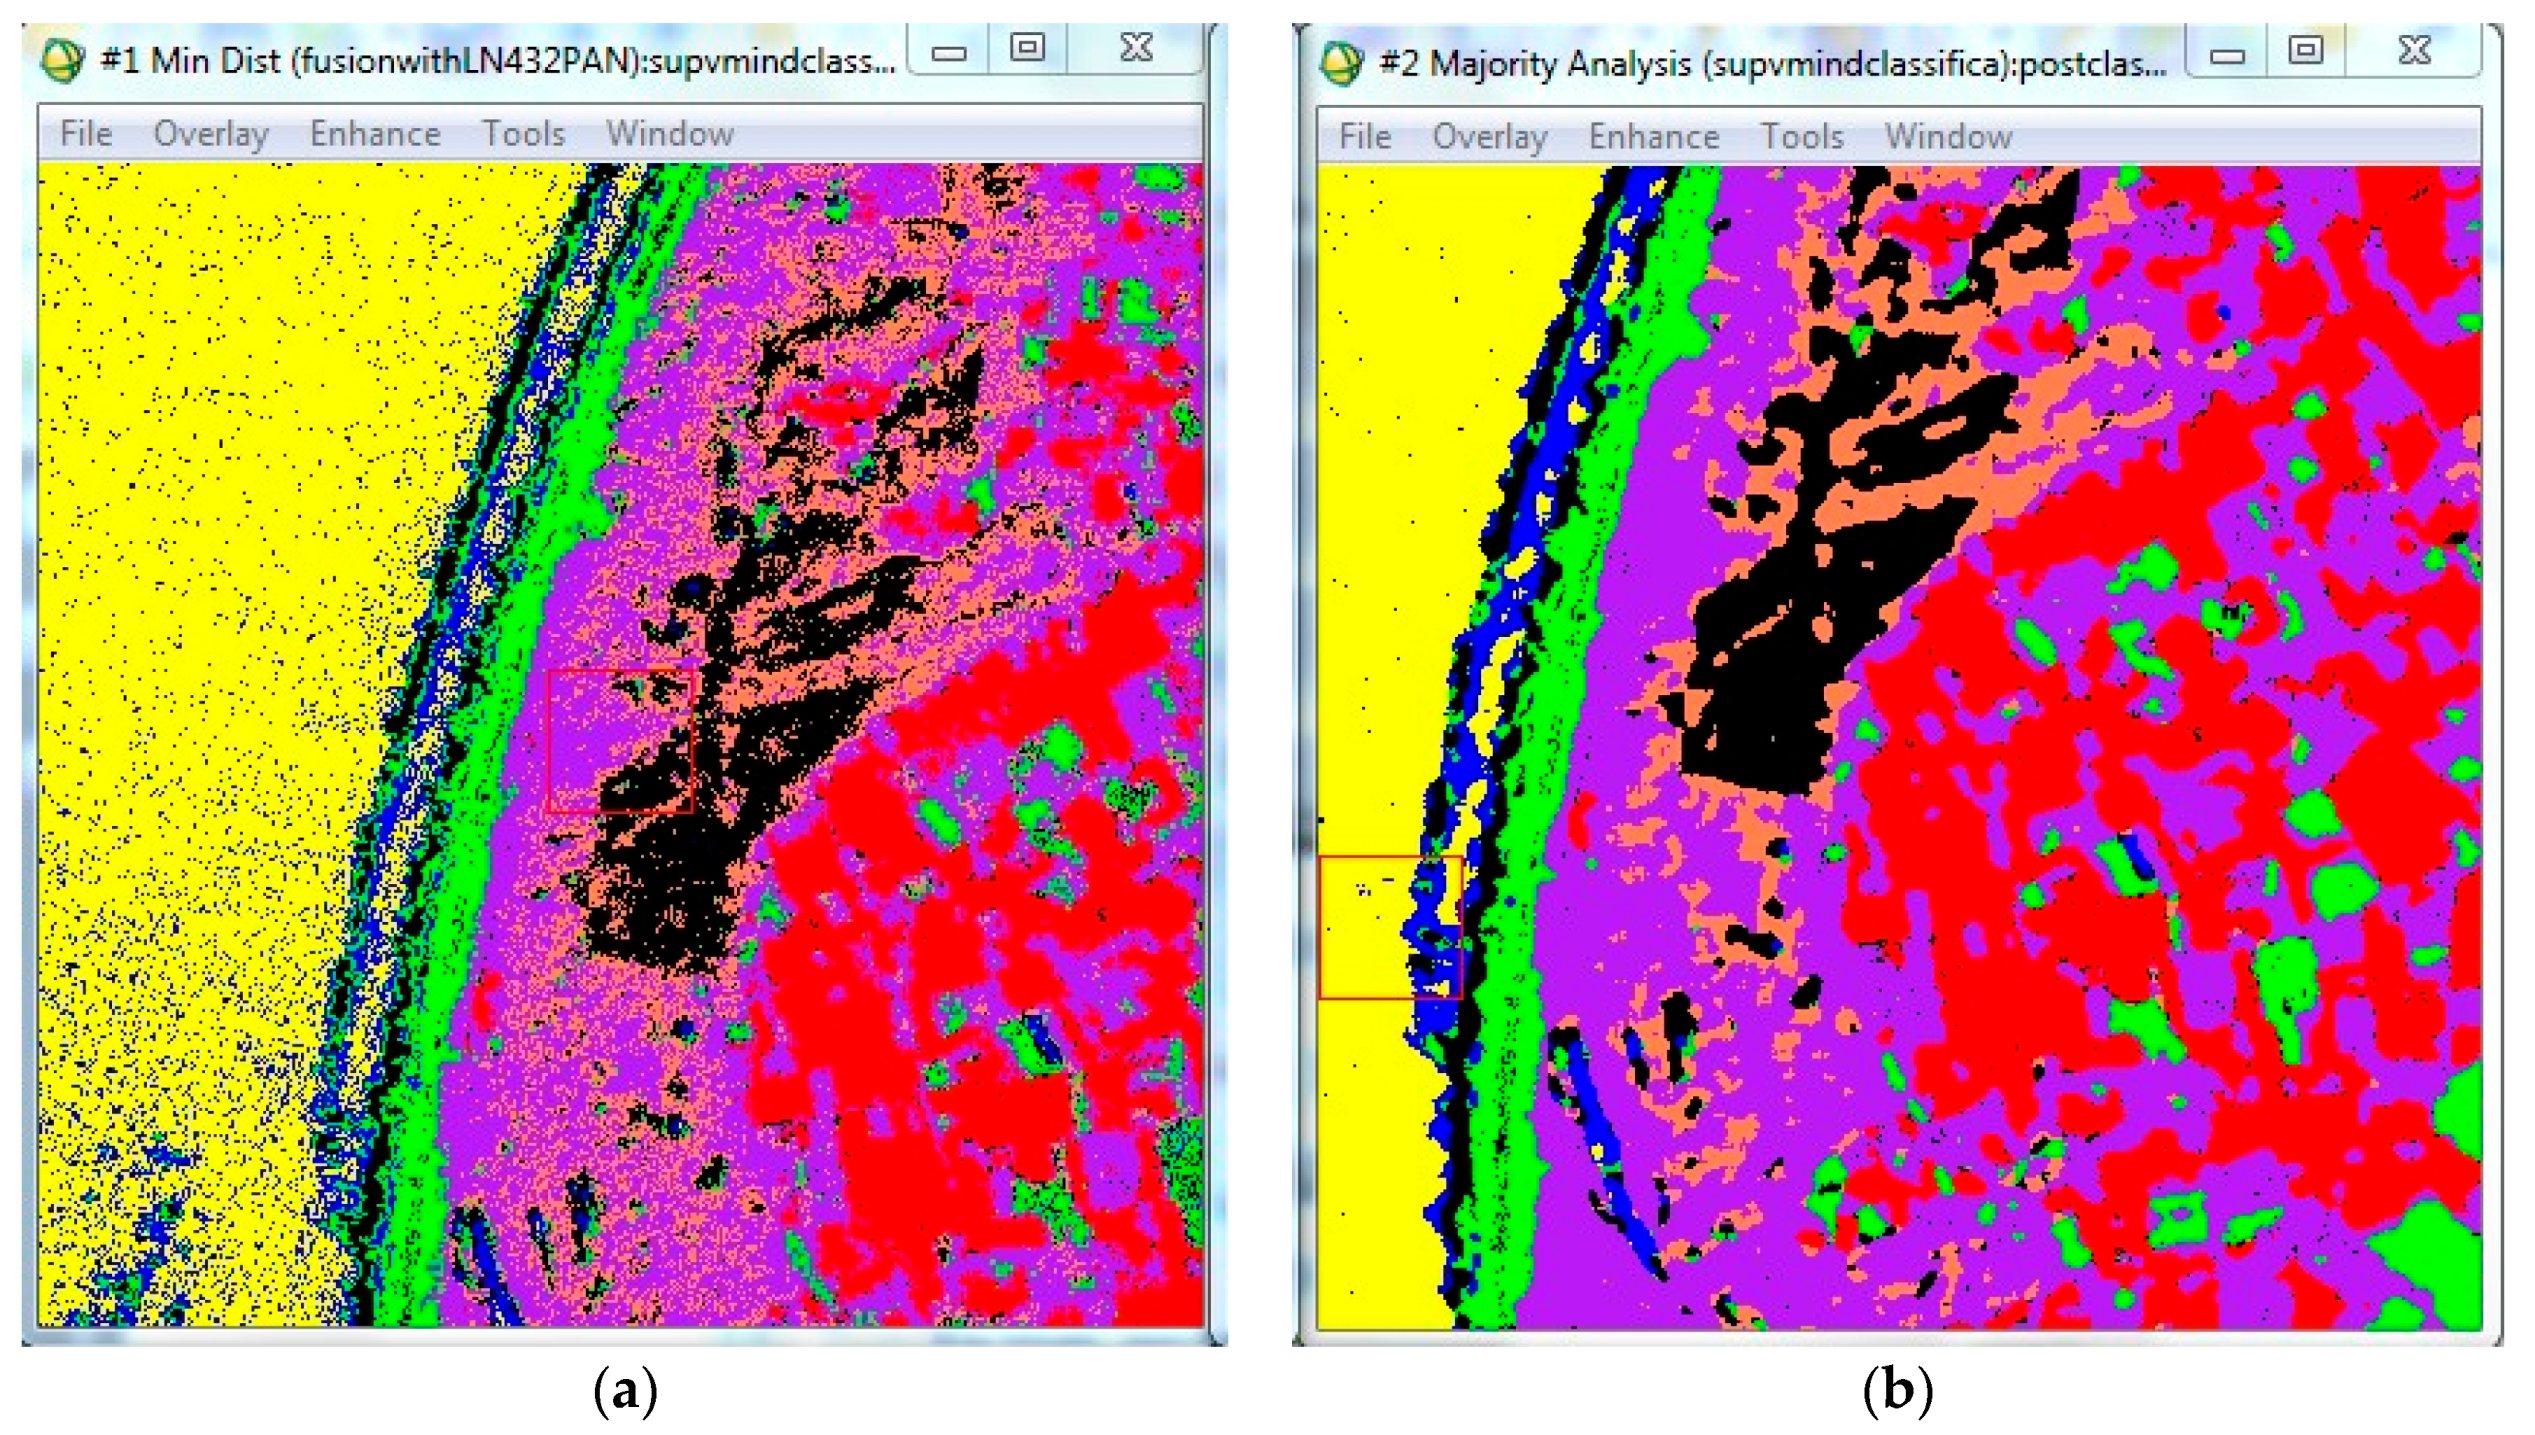
Training samples are finely set by ground objects with different spectral signatures even though they are the same thing in hydraulic engineering. In this case, four kinds of waters, four kinds of dune cover, crop land, bare land, and residential area were picked out and trained by setting a Region of Interest (ROI, seen in
Table 3). Then, the supervised minimum distance classification method (result seen in
Figure 8a) was applied to the fused image to create a basic land cover image shown in
Figure 9a. By the process of majority analysis (result shown in
Figure 8b), isolated pixels were transformed into the majority class surrounding them, and a smooth classification image was created. Results for comparison are shown in
Figure 9b. The definition of isolation can be controlled by a threshold value.
4.3.2. The Ecological Knowledge-Oriented Reclassification
In a map that classifies land cover, different classes may indicate that they have different spectral reflection; however, in another dimension, they may be in the same category: for instance, fields and towns can both be classified as areas of human activity. For logical analysis—for example, when the safety level of a section of shoreline based on to nearby land cover is to be determined—a reclassification in the land cover map is needed. In this study, all land cover related to dunes, including dune sands and dune plants, was turned into class D (in cyan) [
20,
21], and human-activity-related land cover [
22], such as fields, towns, manufacturing, and other infrastructure lands are incorporated into class H (in red). The reclassification result is shown in
Figure 9c. Colors are reset to contrast the differences in water bodies, dune areas, and areas of human activity in the images.
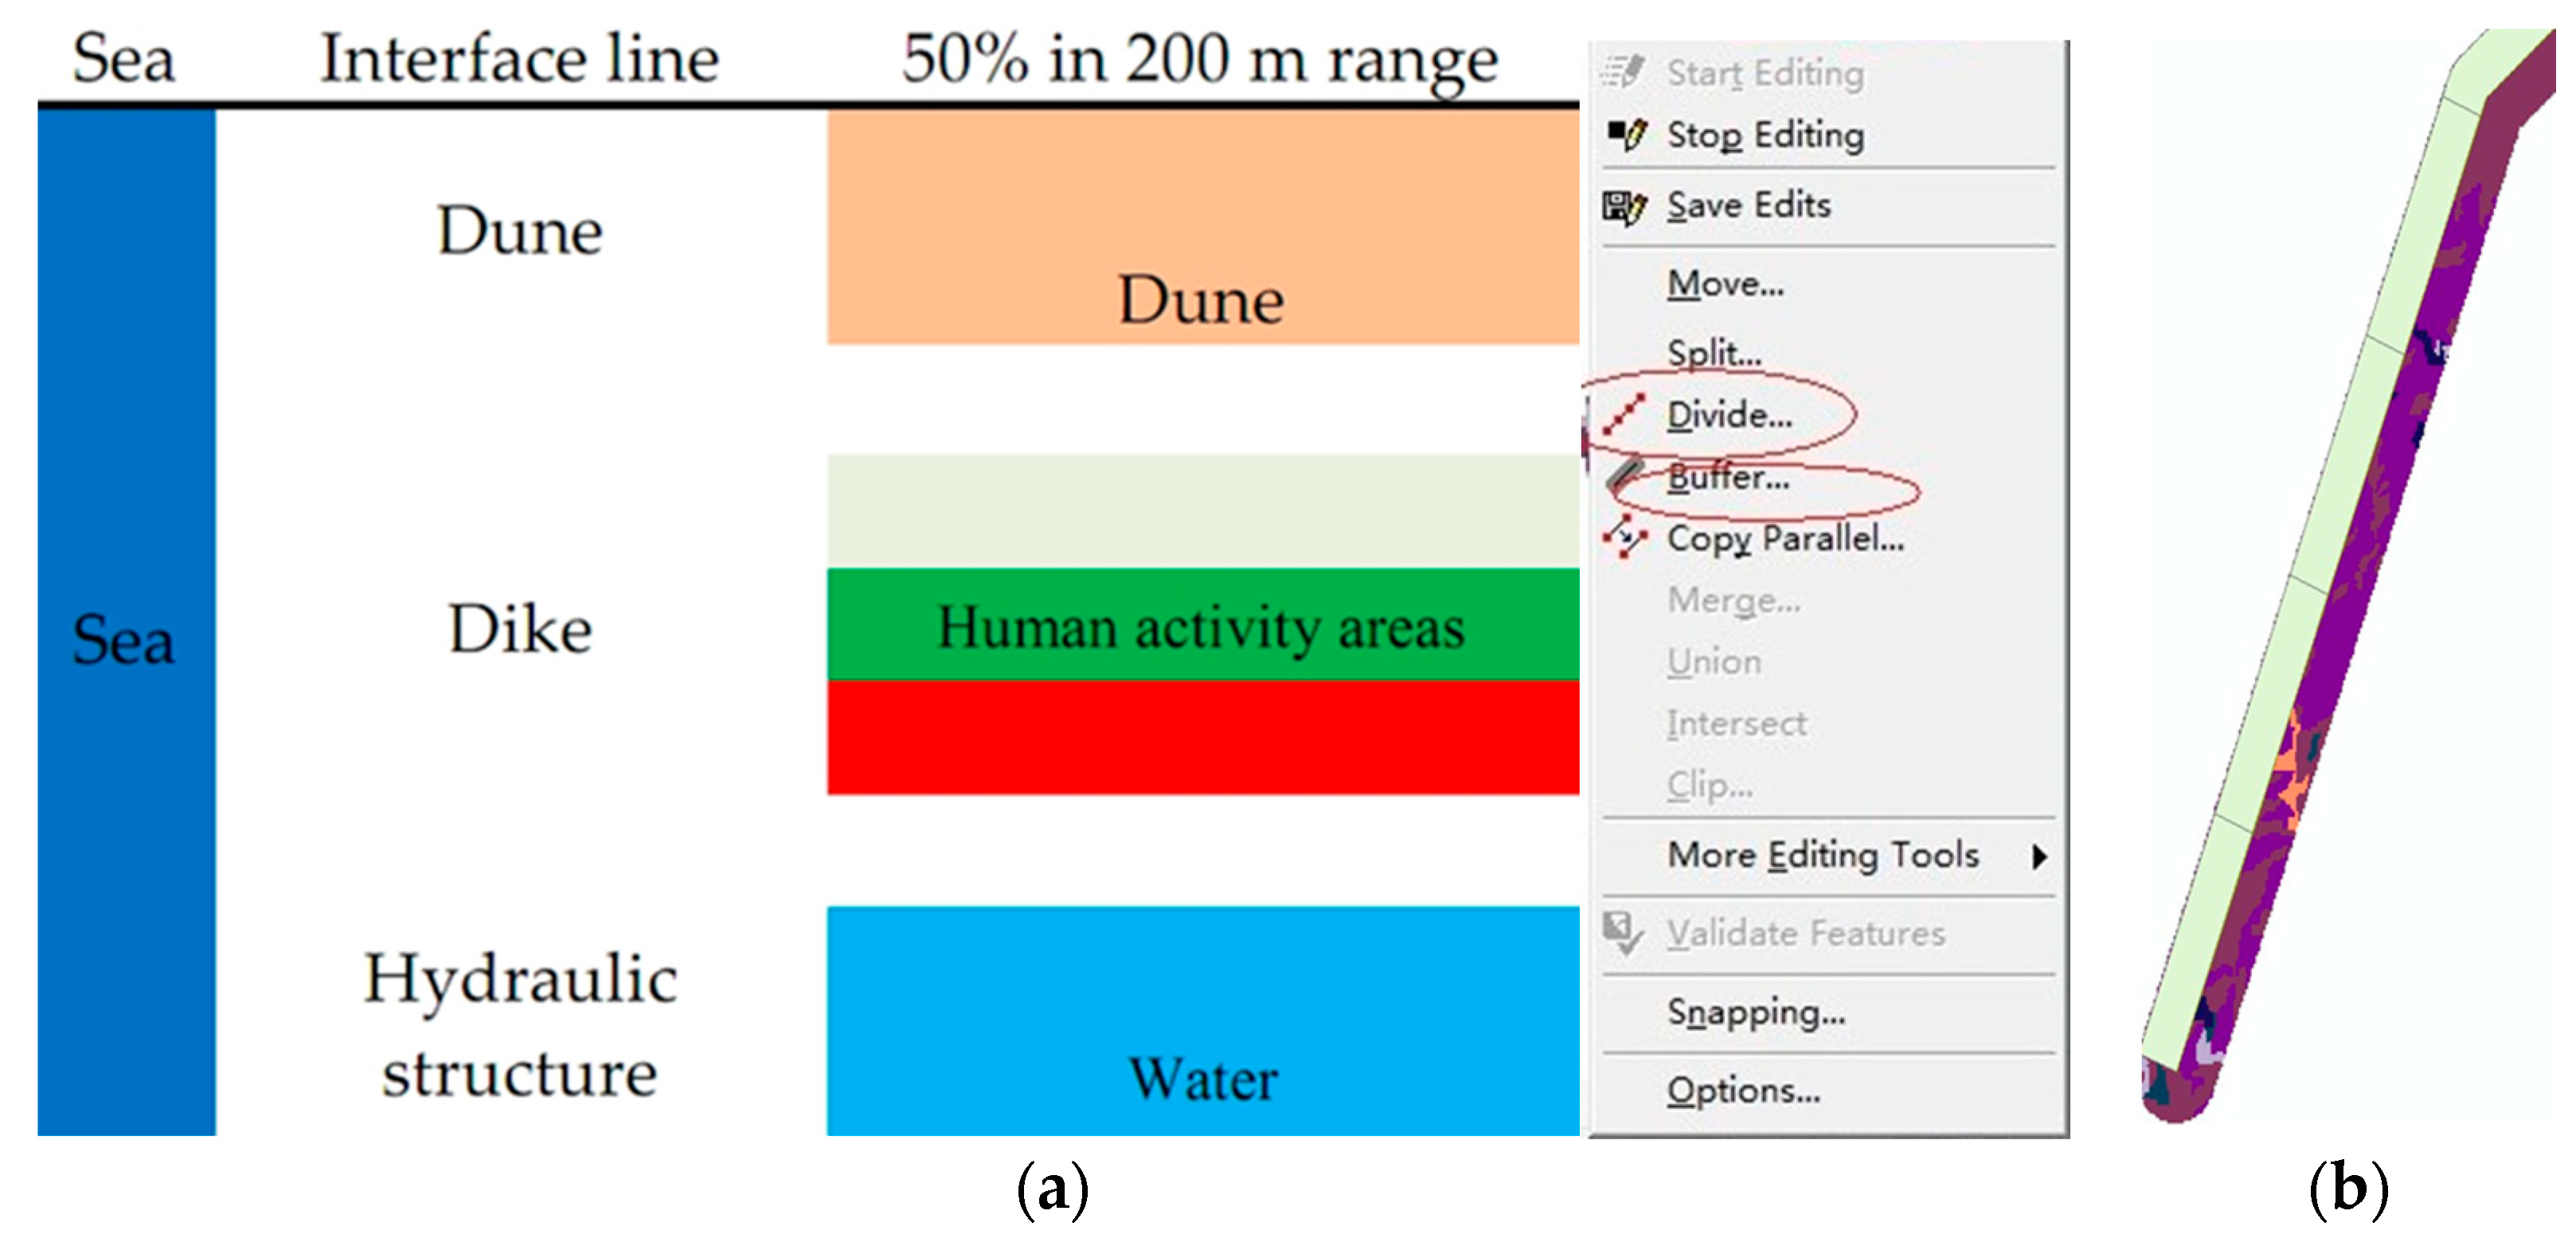
4.4. Estimation Principle for Shoreline Type
Dikes are (or should be) deployed on the edge of high-risk coast areas near human activity that lack the protection of dunes [
23,
24]; dunes are near the coastline and covered with sand or dune plants. The hydraulic structures either are located in a river mouth or delta area, or connect different lands. Therefore, based on a land-cover reclassification map and knowledge of the shoreline system structure in a certain area, an ecological knowledge-oriented method can be used to determine the safety level of a section of shoreline by calculating the percent of the D/H/water pixels behind the extracted shoreline in a certain range (here, 200 m). If the D pixels account for over 50%, then the corresponding coastline is dune coast; if the H pixels occupy more than 50%, then there is a need for dike defense; if water makes up the largest part, then a hydraulic structure is needed (seen in
Figure 10a).
With the coastline’s location information and the generated reclassification image, ArcGIS software was used to define a buffer zone, seen in
Figure 10b, and extract the attributes for our shoreline classification judgments. Finally, a shoreline structure map was created, as shown in
Figure 11.


