Assessment of Meteorological Drought Indices in Korea Using RCP 8.5 Scenario


Department of Civil & Environmental Engineering, Incheon National University, Incheon 22012, Korea
Water 2018, 10(3), 283; https://doi.org/10.3390/w10030283
Submission received: 28 December 2017
/
Revised: 27 February 2018
/
Accepted: 5 March 2018
/
Published: 7 March 2018
(This article belongs to the Special Issue Impact of Climate on Hydrological Extremes)
Abstract
:Diverse drought indices have been developed and used across the globe to assess and monitor droughts. Among them, the Standardized Precipitation Index (SPI) and Reconnaissance Drought Index (RDI) are drought indices that have been recently developed and are being used in the world’s leading countries. This study took place in Korea’s major observatories for drought prediction until 2100, using the Representative Concentration Pathway (RCP) 8.5 scenario. On the basis of the drought index measured by SPI, future climates were forecast to be humid, as the index would rise over time. In contrast, the RDI, which takes evapotranspiration into account, anticipated dry climates, with the drought index gradually falling over time. From the analysis of the drought index through the RCP 8.5 scenario, extreme drought intensity will be more likely to occur due to rising temperatures. To obtain the diversity of drought prediction, the evapotranspiration was deemed necessary for calculating meteorological droughts.
1. Introduction
Drought is a recurrent phenomenon that may affect several sectors of life and the environment, and can be directly linked to water shortage problems. Drought can be considered as a three-dimensional event characterized by its severity, duration and affect area. One of the most general methods to assess drought is the calculation of drought indices [1,2,3,4].
It has not been long since Korea established a national-level center to analyze drought information. There have been no criteria established regarding droughts, due to the lack of systematic drought monitoring and indices for managing droughts through quantitative analysis. In addition, Korea has had to rely on experiences without having established a drought index that fits its characteristics. As droughts have occurred every five years in Korea in recent years, a systematic study is required to mitigate the damages caused by droughts [5].
Many definitions of drought have been suggested in the academic field depending on the specific area of interest. Dracup et al. suggested a classification system that defined drought by four criteria: the nature of the water deficit, averaging period, truncation level and method of regionalization [6]. Wilhite and Glantz classified drought into six categories: meteorological, climatological, atmospheric, agricultural, hydrologic and water-management [7]. The U.S. Weather Bureau defines drought as “lack of rainfall so great and long continued as to affect injuriously the plant and animal life of a place and to deplete water supplies both for domestic purposes and for the operation of power plants, especially in those regions where rainfall is normally sufficient for such purposes”. Palmer defined a drought period as “an interval of time, generally of the order of months or years in duration, during which the actual moisture supply at a given place rather consistently falls short of the climatically expected or climatically appropriate moisture supply” [8].
Diverse drought indices have been developed and used across the globe to assess and monitor droughts. The Standardized Precipitation Index (SPI) is a drought index that was developed recently to improve the Palmer Drought Severity Index (PDSI) in the expression method of wetness and dryness, which is currently used in 40 countries for drought preparedness [9].
The Palmer Drought Severity Index (PDSI), Soil Moisture Index (SMI), Standardized Precipitation Index (SPI) and Surface Water Supply Index (SWSI) are the representative drought indices. Each of these indices has strengths and weaknesses, and thus an appropriate index or combination of indices should be selected by considering what index best fits the hydrology of target region, characteristics of weather and water resources supply facilities [10].
The SPI was designed by Mckee based on the idea that a reduction in precipitation with respect to the normal precipitation amount is the primary driver of drought, resulting in a successive shortage of water for different natural and human needs. The SPI, setting the time period on a monthly basis, typically 3, 6, 9 or 12 months, calculates the shortage of precipitation and defines drought intensity based on SPI value [11]. The SPI, as calculated for a different period of time, can be applied to various fields based on the length of the time units. The SPI for short accumulation periods is used for agricultural purposes, while the SPI for relatively long accumulation periods is used for the supply and management of water resources. The calculated SPI enables the determination of precipitation probability necessary for resolving the current drought [12].
Yoon et al. modified the PDSI for the Korean climatic environment by analyzing the characteristics of droughts in Korea [13], Ryu et al. applied typically used drought indices to Nakdong River area and conducted comparative analysis to uncover the drought conditions [14].
Dubrovsky et al. suggested, via analysis of the PDSI based on Global Climate Models (GCMs), that global warming will lead to increased drought, while pointing out that the SPI, which is based on precipitation data, does not reveal these climate-change impacts on drought conditions [15]. This implies that a drought index must contain temperature data to be applied to the future climatic change scenario.
Drought indices are generally used for drought estimation and can help forecast drought caused by global warming [16].
Two assumptions are needed to use SPI for drought forecasting. First, drought indicates that the variability of precipitation is more absolute than the variability of temperature and potential evapotranspiration (PET). Second, that temperature and PET are stationary and do not change with time [17].
However, many recent studies have suggested problems with assumptions that do not consider variables related to temperature [17,18,19,20,21]. Previous studies have already revealed that rising temperature is affecting drought. Various climate change models’ results also predict a greater temperature rise in the 21st century than in the past [22].
There is a climate change scenario that acts as a way of predicting future temperatures and precipitation. The Representative Concentration Pathways (RCPs) form a set of greenhouse gas concentration and emissions pathways designed to support research on impacts and potential policy responses to climate change [23,24]. As a set, the RCPs cover the range of forcing levels associated with emission scenarios published in the literature. The Representative Concentration Pathway (RCP) 8.5 corresponds to a high greenhouse gas emission pathway compared to the scenario literature [25,26], and hence also to the upper bound of the RCPs. RCP 8.5 is a so-called ‘baseline’ scenario that does not include any specific climate mitigation target [27].
This study used the temperature and precipitation data from the RCP 8.5 scenario provided by the Korea Meteorological Administration (KMA) to build data for analysis of future droughts. KMA provides point data for the major observatories in Korea based on the results of HadGEM3-RA (Met Office Hadley Centre, Exter, UK).
As a drought index, the reconnaissance drought index (RDI) was proposed by Tsakiris and Vangelis, utilizing the ratios of precipitation over reference crop evapotranspiration () for different time scales in order to be representative of the region of interest. The RDI was further investigated by Tsakiris et al. [28,29]. One of the advantages of the RDI index is its sensitivity to drought events [30].
To form an assessment of drought by climatic change scenario, this study used the SPI and RDI by dividing the periods into 3, 6 and 12 months, and analyzing these drought indices at 73 observatories located around the country.
2. Theoretical Background of SPI & RDI
2.1. Equation of SPI
The SPI is calculated through the following steps: preparation of times series of precipitation accumulations; estimation of parameters using Pearson Type-III (PT-III) distribution, as suggested by Guttman [14]; calculation of cumulative probability; and calculation of drought index applied to standard normal distribution. The drought severity obtained from the calculation of SPI and RDI can be categorized as shown in the Table 1 [11].
The definition of drought thus far has included a beginning date, ending date, and current drought intensity. Duration of drought can be either a current duration measured from the beginning, or the duration of a historic drought event from beginning to end. Peak intensity can easily be determined from the SPI. A measure of the accumulated magnitude of the drought can be included. Drought Magnitude (DM) is defined by Equation (1) [11].
where j starts with the first month of a drought and continues to increase until the end of the drought (x) for any of the i times scales.
The DM has units of months and would be numerically equivalent to drought if each month of the drought has SPI = 1.0. In fact, many droughts will have a DM very similar to the duration in months, since most of the SPI values are between 0 and −2.0 [11].
2.2. Equation of RDI
The Reconnaissance Drought Index (RDI) can be characterized as a general meteorological index for drought assessment. The RDI can be expressed in three forms: the initial value , the normalized RDI ( and the standardized RDI () [28,29].
The initial value () is presented in an aggregated form using a monthly time step and may be calculated on monthly, seasonal (3-months, 6-months, etc.) or annual basis. The , for the year and a time basis (months) is calculated as Equation (2).
where and are the precipitation and the potential evapotranspiration of month of year and is the total number of years of the available data.
2.3. Calculation of PET
To assess the RDI, PET (potential evapotranspiration) needs to be calculated based on climate parameters. Reference evapotranspiration () is defined as the potential evapotranspiration of a hypothetical surface of green grass of uniform height, actively growing and adequately watered [31,32].
The Penman Monteith (PM) method is recommended by the FAO (Food and Agriculture Organization) as the sole method for calculating the reference evapotranspiration, wherever the required input data are available [33]. The FAO56-PM model (Allen et al., Rome, Italy), which is a physically-based approach and incorporates thermodynamic and aerodynamic aspects, has proved to be a relatively accurate method in both humid and arid climates and can be used globally without any need for additional adjustment of parameters [34]. As per this method, the reference evapotranspiration can be estimated as Equation (4).
where is the reference evapotranspiration (mm/day), is the slope of vapor pressure curve, is the net radiation at the surface (W/m2), G is the soil heat flux density (W/m2), is the psychometric constant, is the mean daily air temperature at the height of 2 m, is wind speed at 2 m height, is the saturated vapor pressure, and is the actual vapor pressure (kPa). The reference surface is assumed to be a flat surface that is completely covered by grass with an assumed uniform height of 0.12 m, a fixed surface resistance, and an albedo of 0.23 [35].
3. Data Collection and Analysis of Precipitation and Temperature using RCP Scenario
3.1. Time Series Data of Precipitation and Temperation in Major Observatories
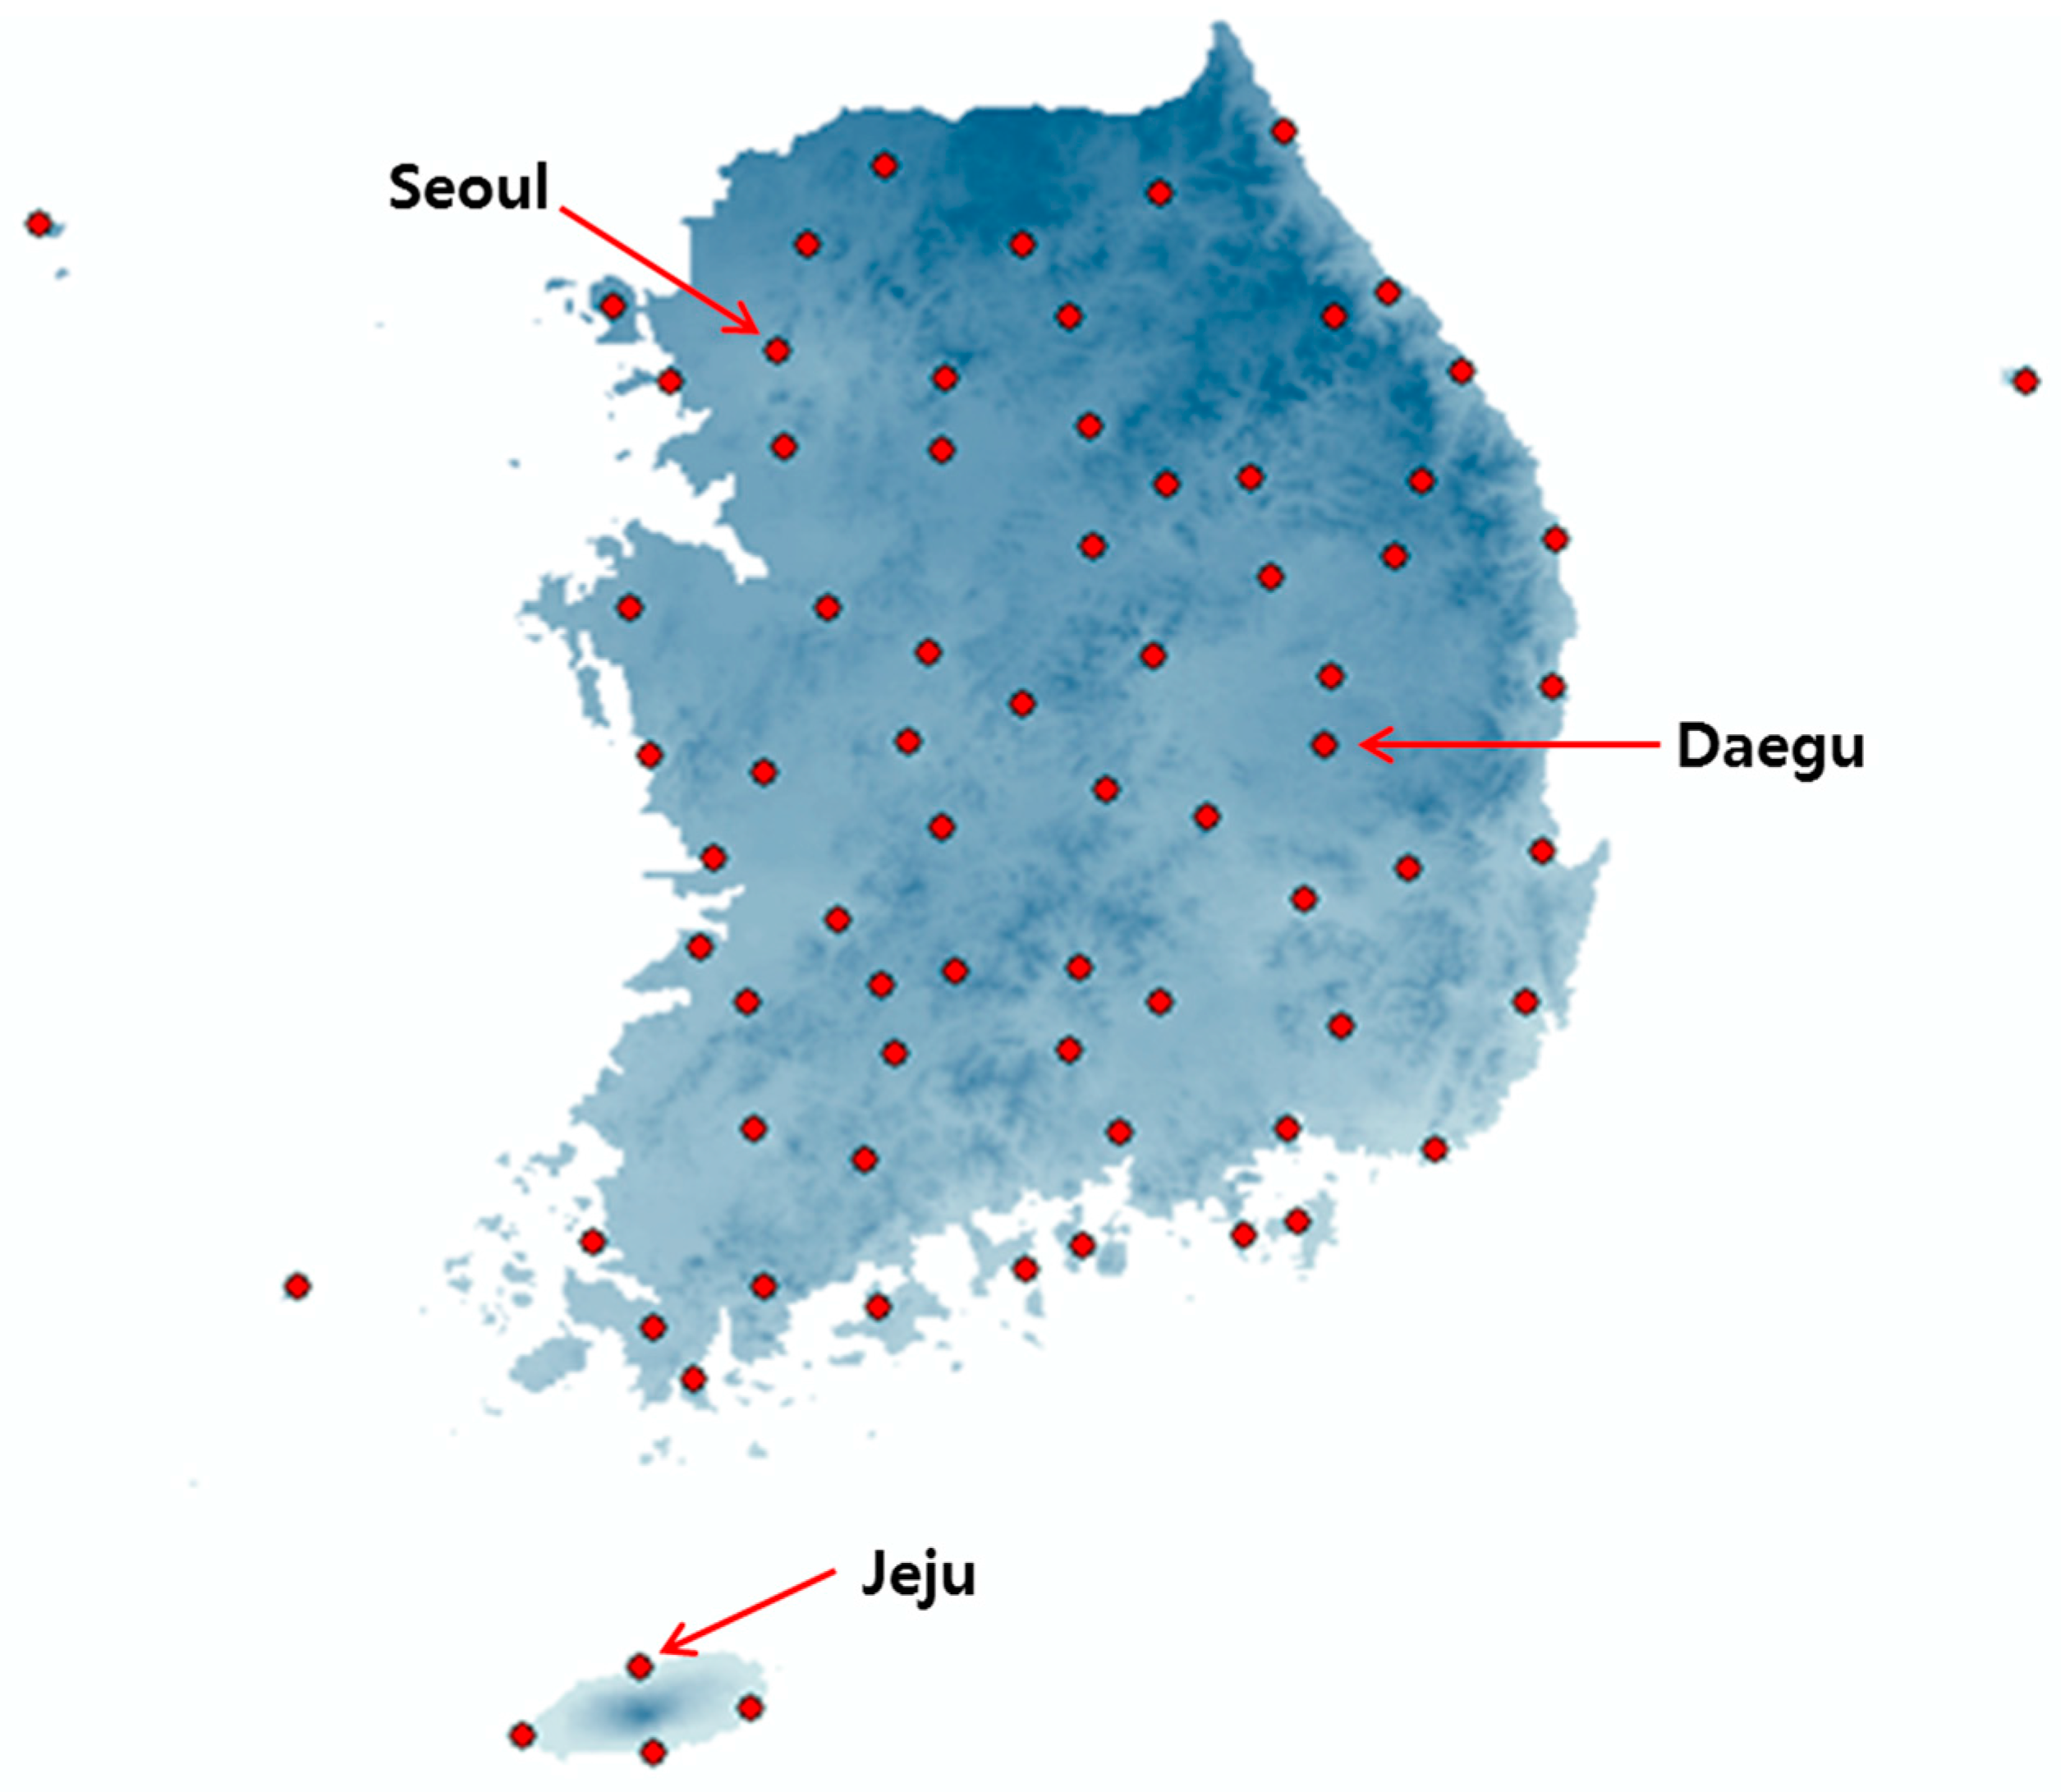
To calculate the drought index, the RCP 8.5 scenario’s monthly precipitation and temperature data from 2011 to 2100 was provided by the Korea Meteorological Administration. A total of 73 precipitation observatories were selected to conduct nationwide analysis of drought indices. Figure 1, below, shows that the selected observatories are evenly distributed throughout South Korea.
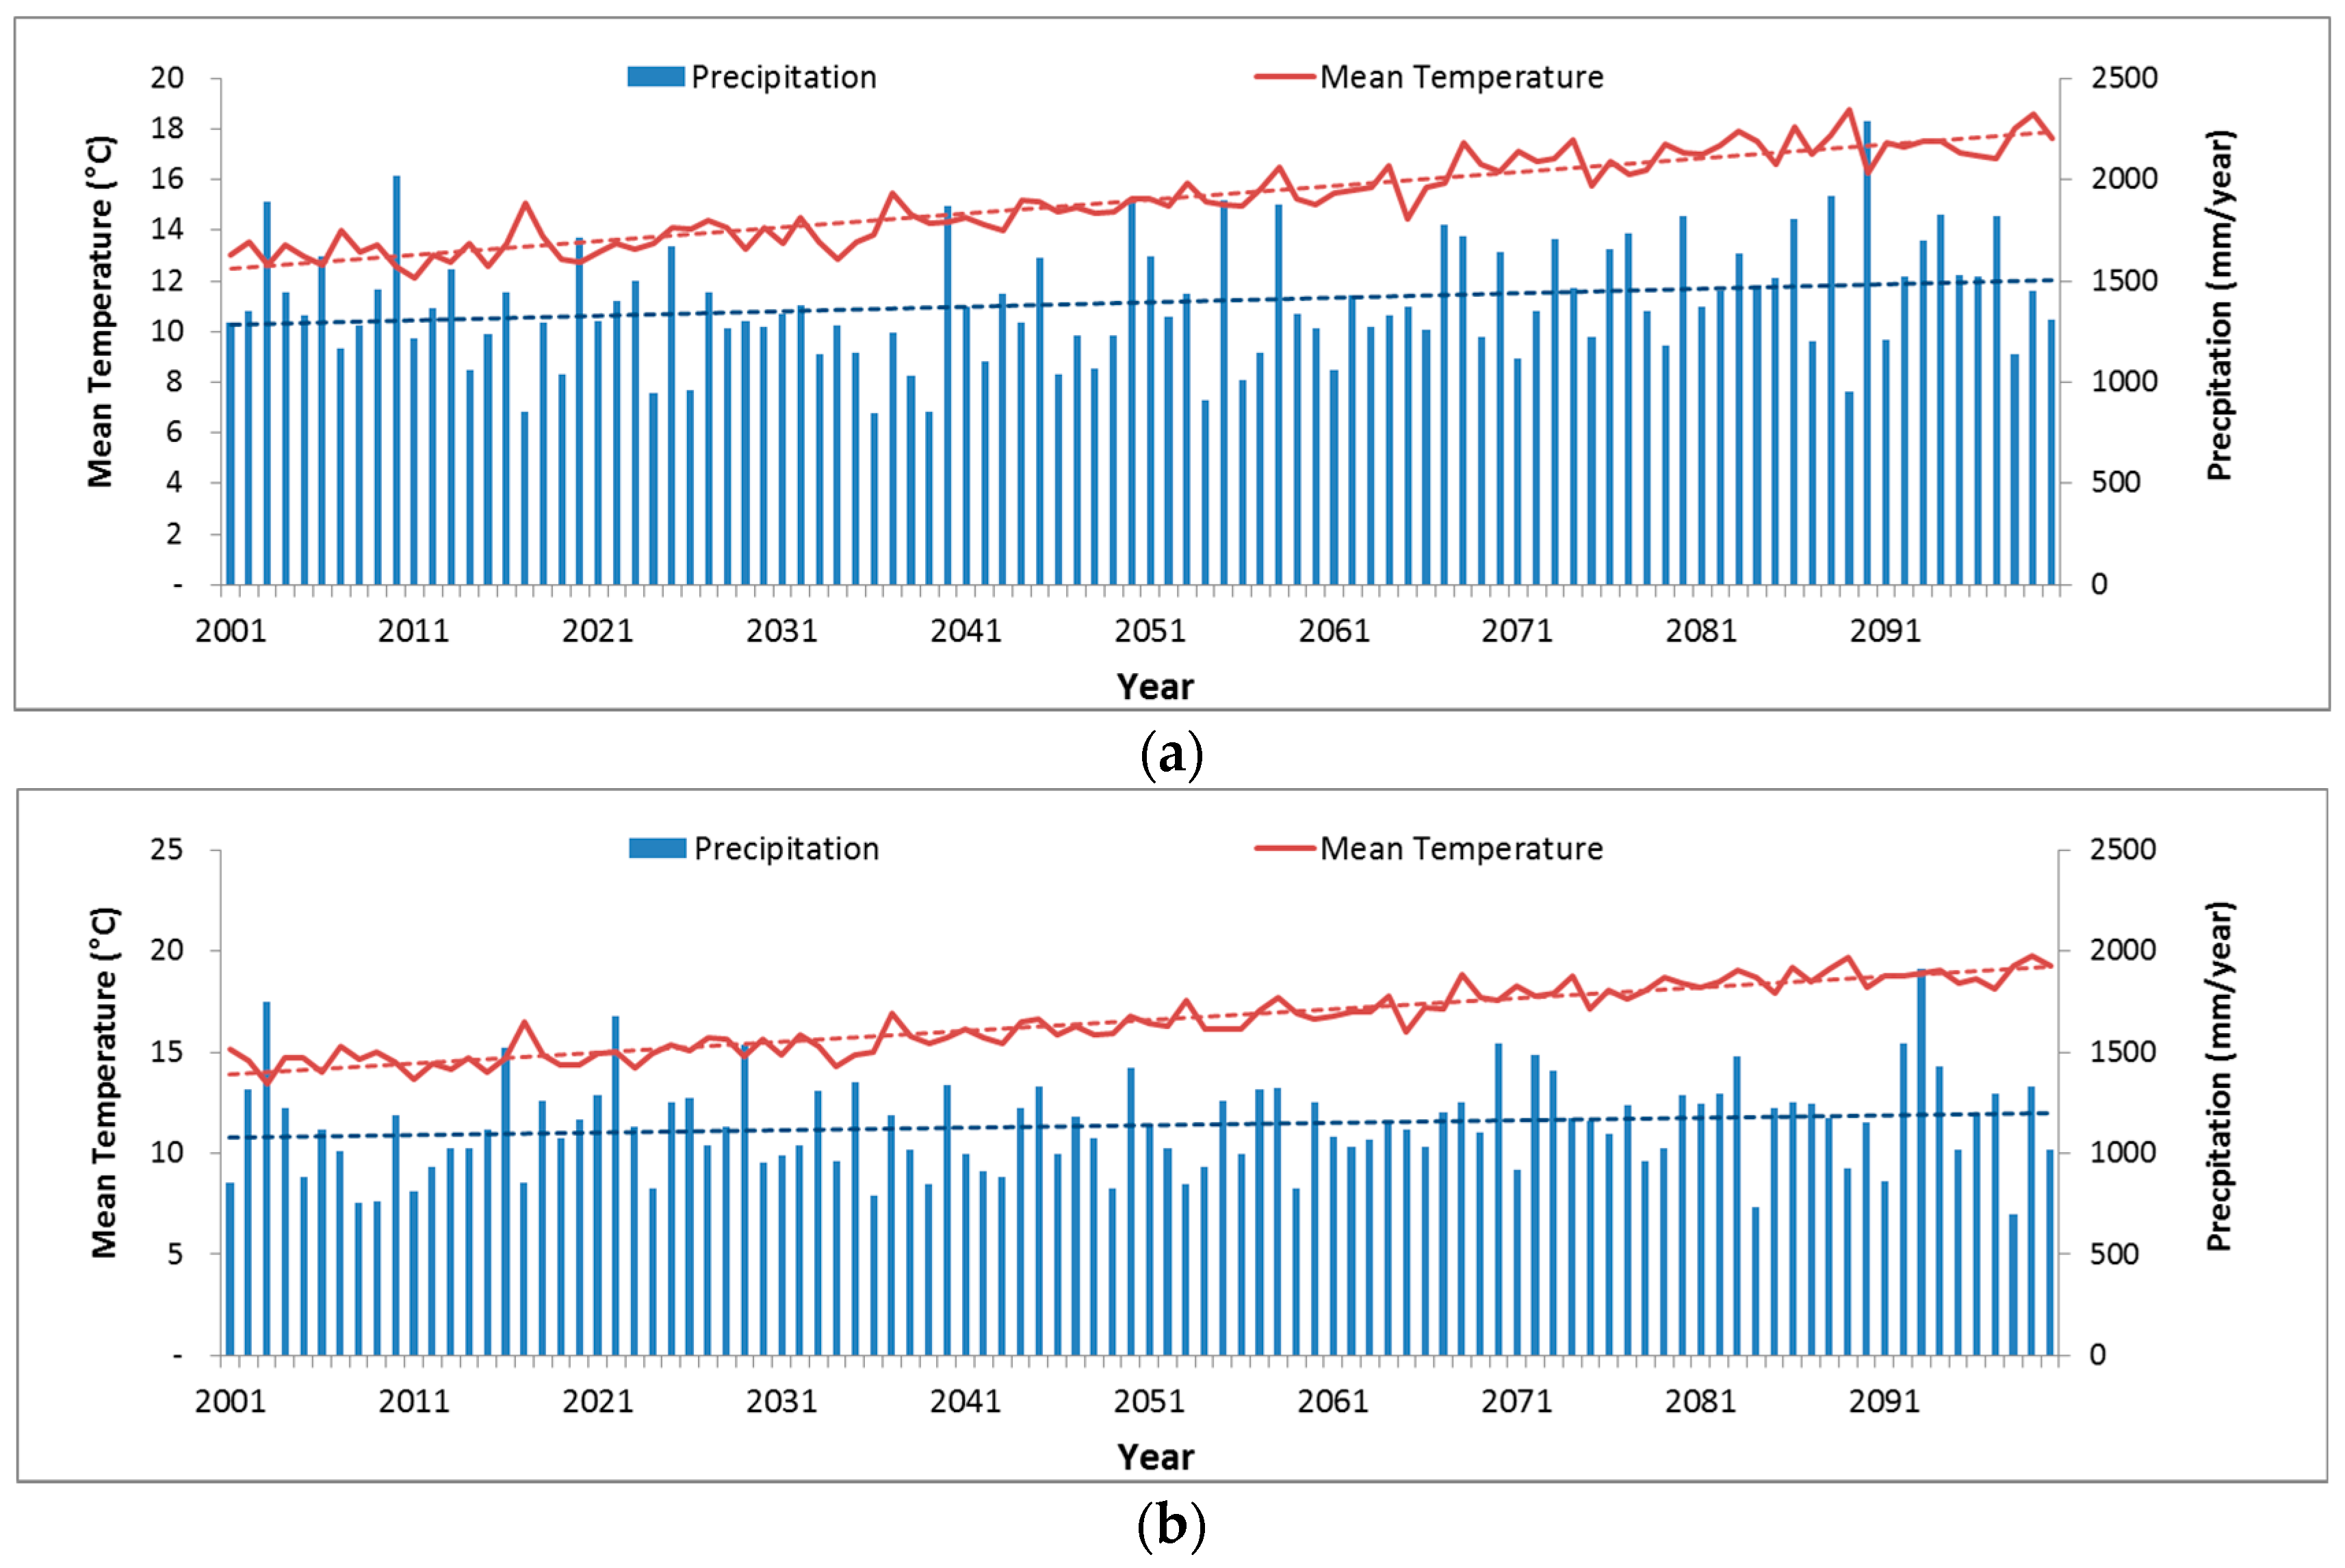
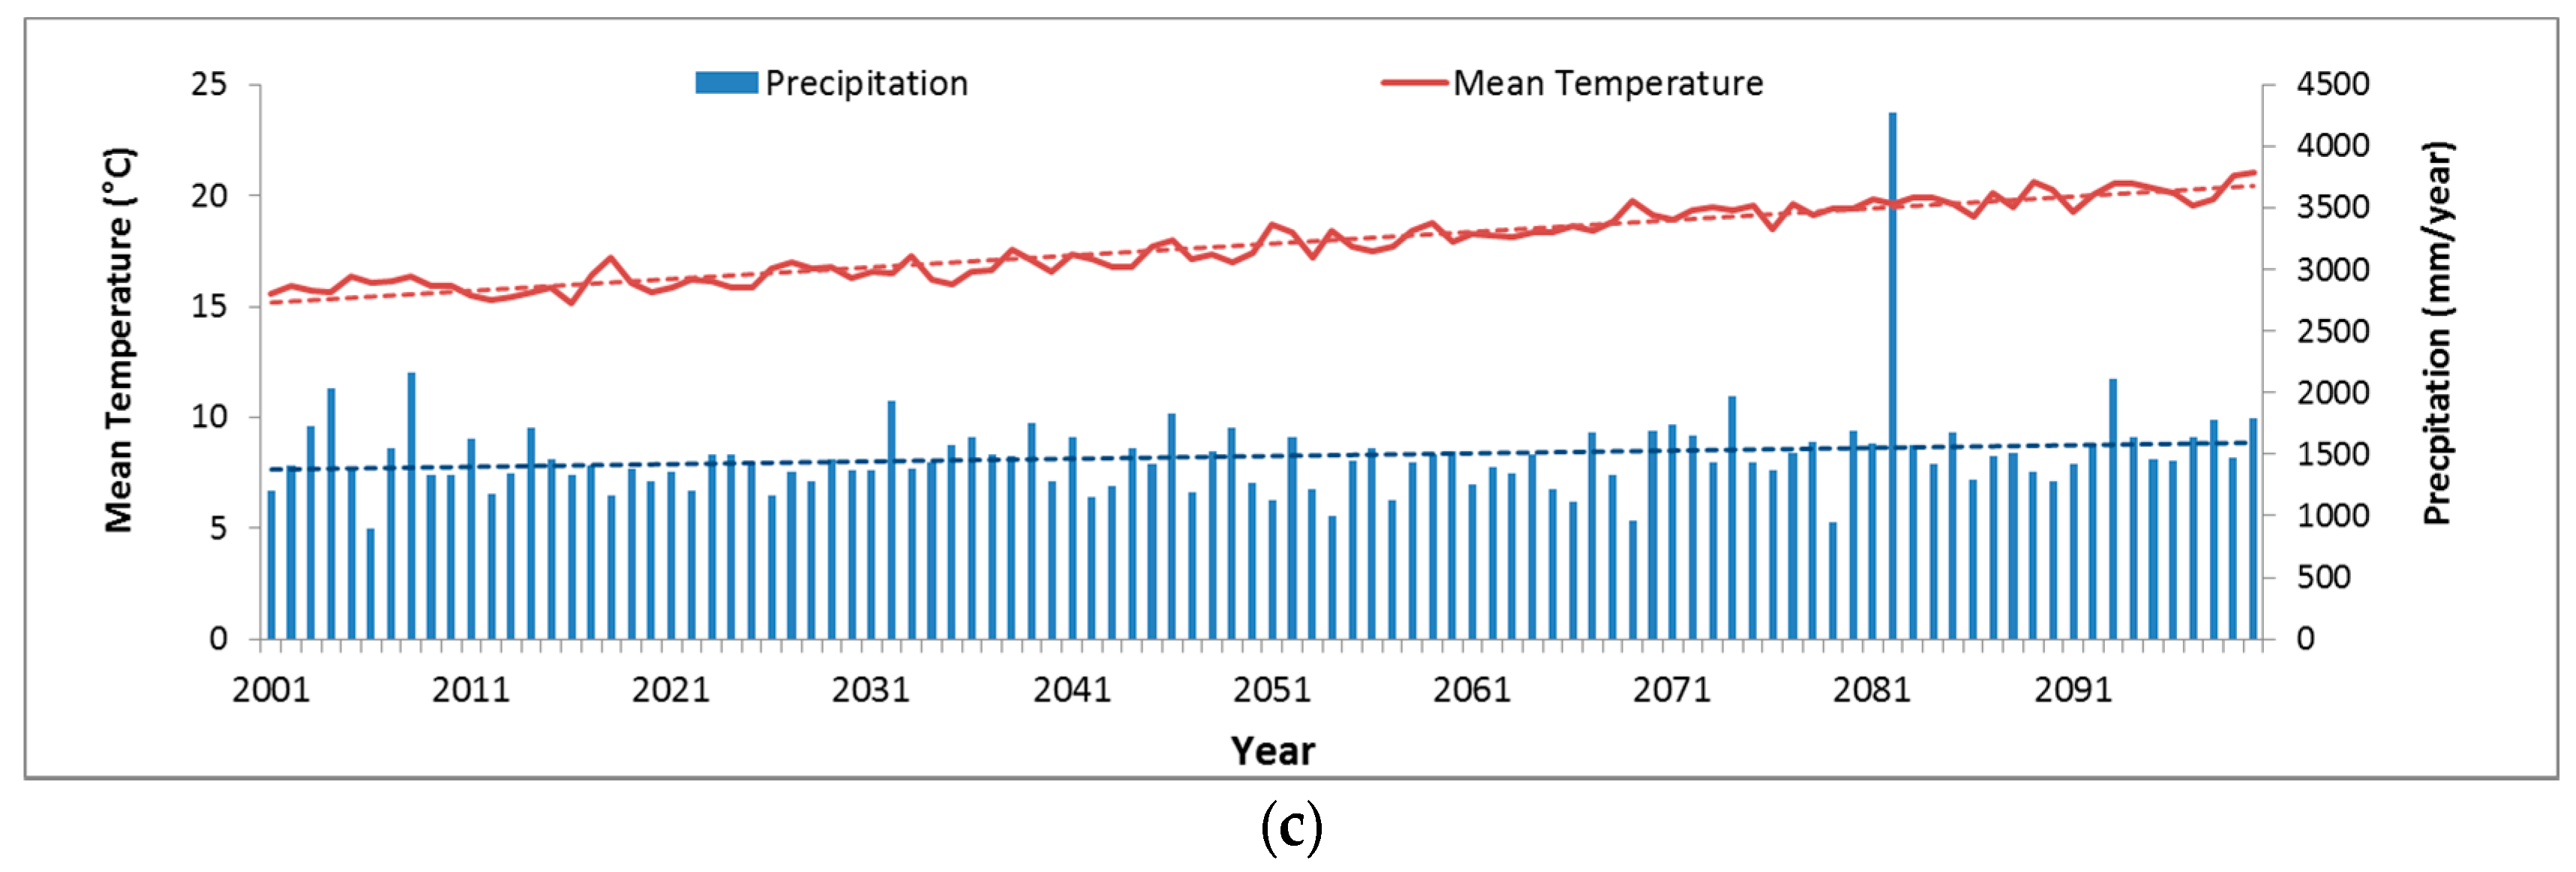
Figure 2 indicates the changes of annual precipitation and temperature estimated by RCP 8.5 scenario at observatories in Seoul, Daegu and Jeju provinces. Looking at the linear regression curves, the precipitation will be maintained until 2100, while the temperature will increase at all three observatory sites. The temperature of the three selected observatories is forecast to rise by nearly four degrees Celsius over the next 100 years, according to RCP 8.5 scenarios. In Figure 2a, the Jeju observatory expected that 4270 mm of rain will fall in 2082, which amounts to a nearly three-fold increase in the average annual precipitation in Korea.
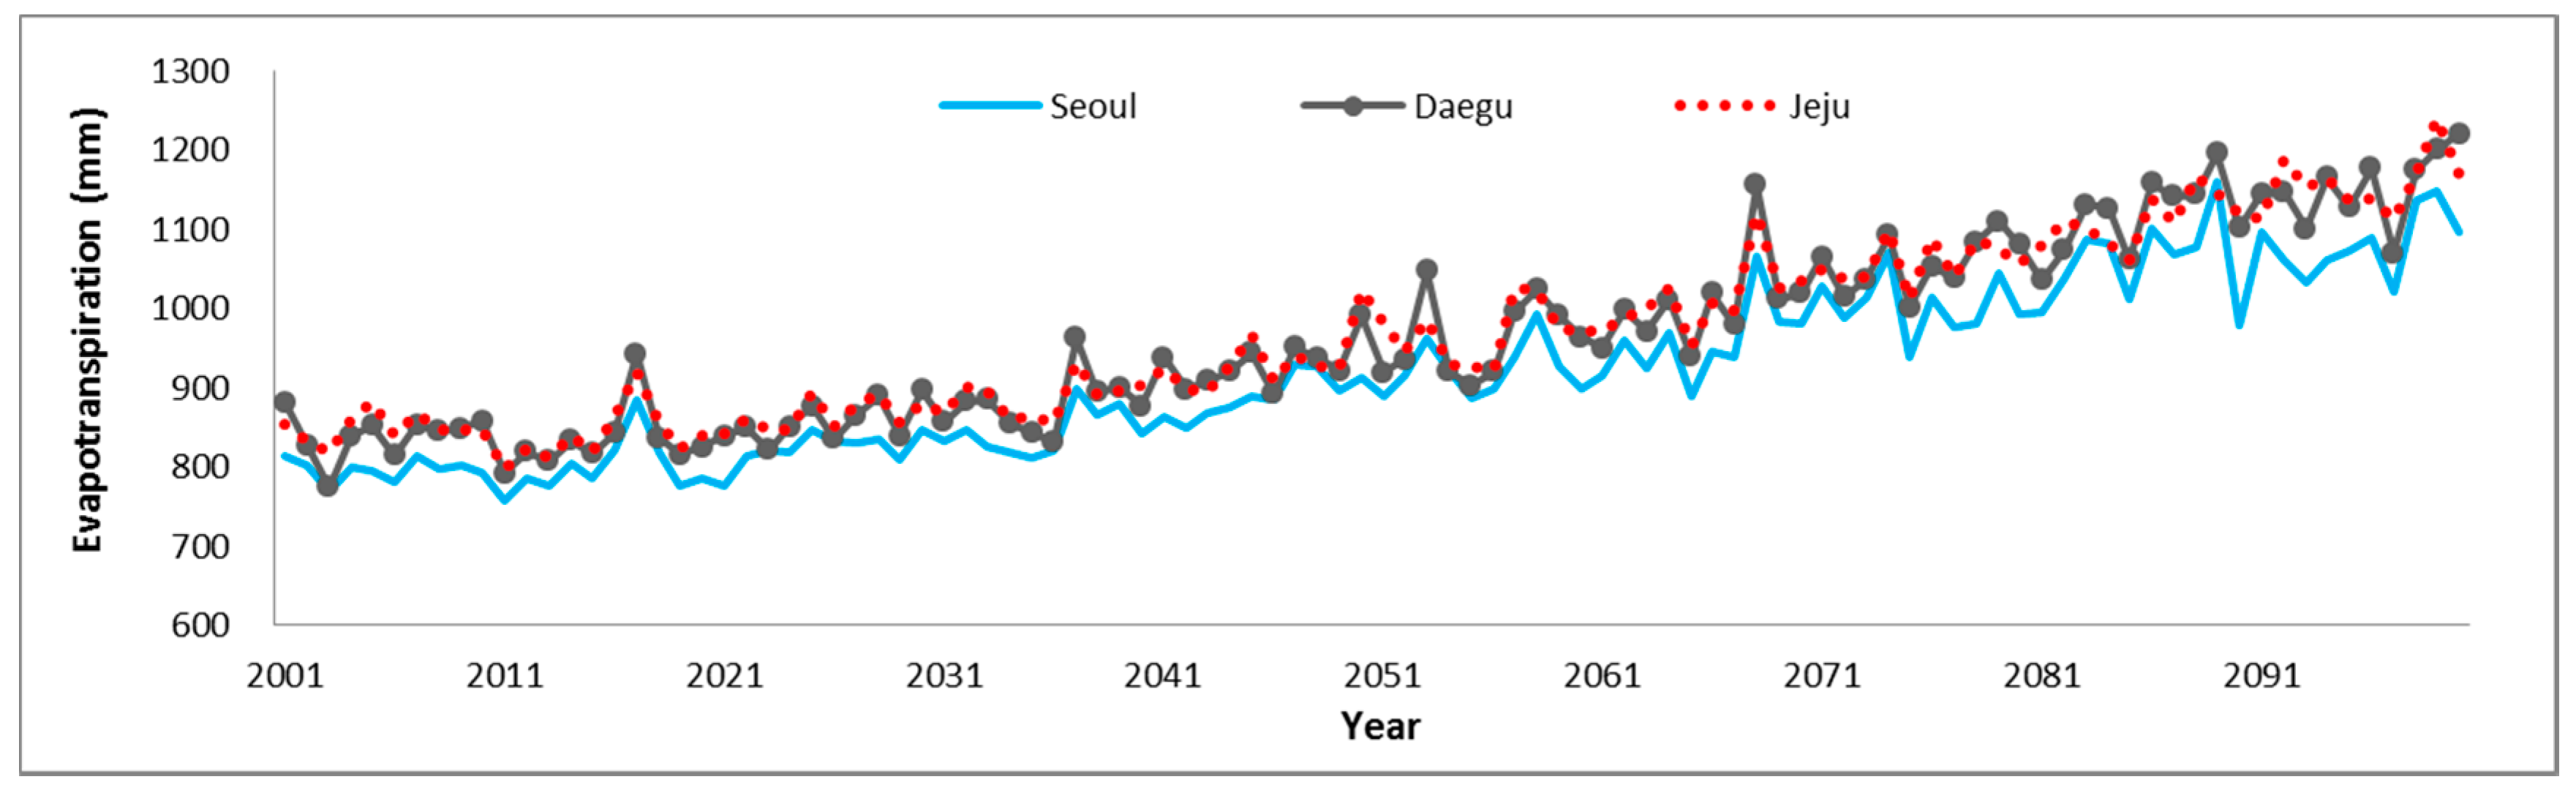
Figure 3 shows the result of evapotranspiration in Seoul, Daegu and Jeju observatories estimated by the DrinC model (National Technical University of Athens Centre, Athens, Greece) using the data of the RCP 8.5 scenario. In all three observatories, the evapotranspiration rises over time, showing a tendency similar to the temperature graph, which is interpreted as the effect of rising temperatures. The closer the year gets to 2100, the closer the evapotranspiration approaches the average annual precipitation, with a higher risk of drought.
3.2. Previous Research of Precipitation and Temperature Using GCM during 1976–2010
GHG (Greenhouse Gas) emission scenarios should be selected to forecast changes in hydrological conditions caused by climate change. Climate data such as temperature and precipitation will be used to forecast climate models based on selected scenarios. However, there are various uncertainties in this forecasting process [36].
Verification of hydrological data produced through GCM is therefore required. In order to verify the reliability of precipitation data, Park et al. compared the observation data with the GCM simulated monthly data during the baseline period (1976–2010) in some major observatories in Korea [37].
Comparisons of precipitation between observations and GCM simulations over the baseline period demonstrated significant differences from June to August. It is thought that such differences occur because factors that cause anomalies, such as summer, have not been adequately factored into climate change scenarios. However, observations and simulated values are relatively well matched in winter and spring, when droughts principally occur, compared to summer. Therefore, the meteorological data produced by GCM is more advantageous for use in drought than flood analysis [37].
4. Calculation and Analysis of SPI and RDI
The study conducted a future drought analysis based on the RCP 8.5 scenario by using SPI and RDI for periods of three, six, and twelve months. In order to figure out the SPI and RDI, the DrinC model was used, with the place values of the 73 observatories consisting of precipitation, temperature and latitude inputted.
4.1. Change in Time Series of SPI and RDI
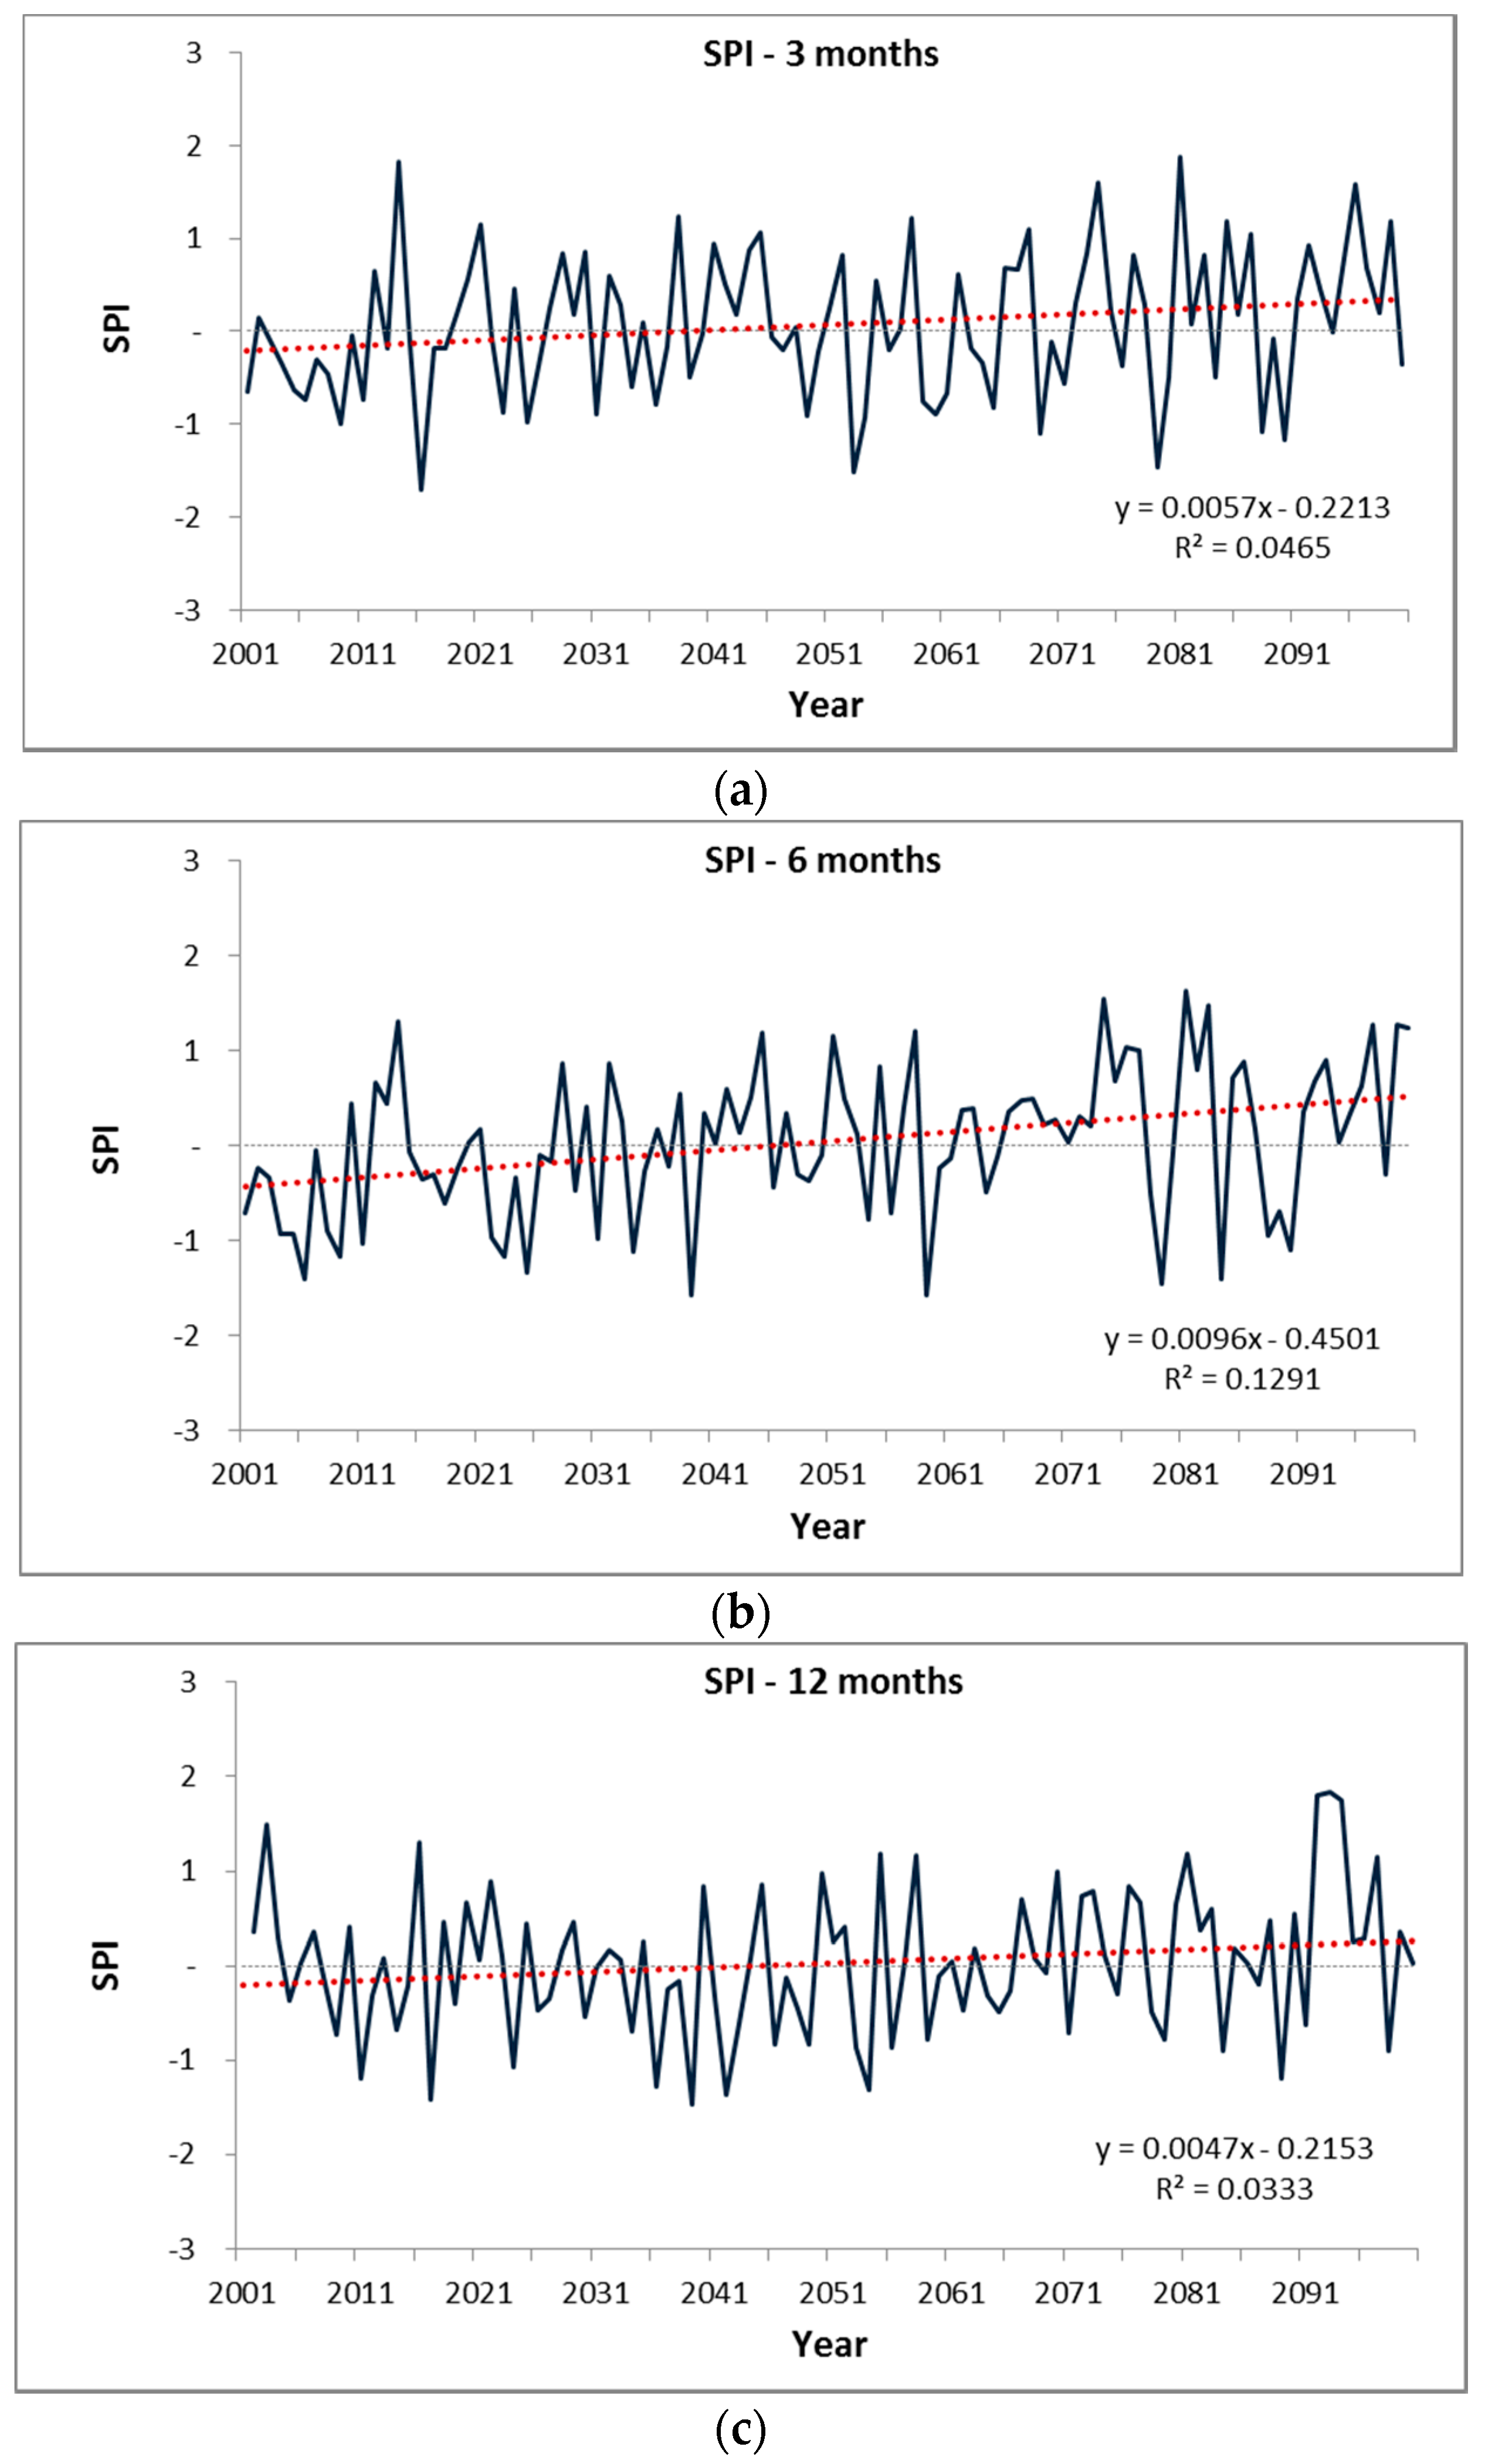
Figure 4 indicates the result of average SPI from the 73 observatories that used average monthly precipitation value and latitude coordinates. Analyzing the linear regression curves showed that SPI value increases gradually at all simulated durations. This means that the climate of the future is more likely to be wet than are the current conditions. Droughts can occur regionally; regional analysis is required, as discussed in Section 4.2.
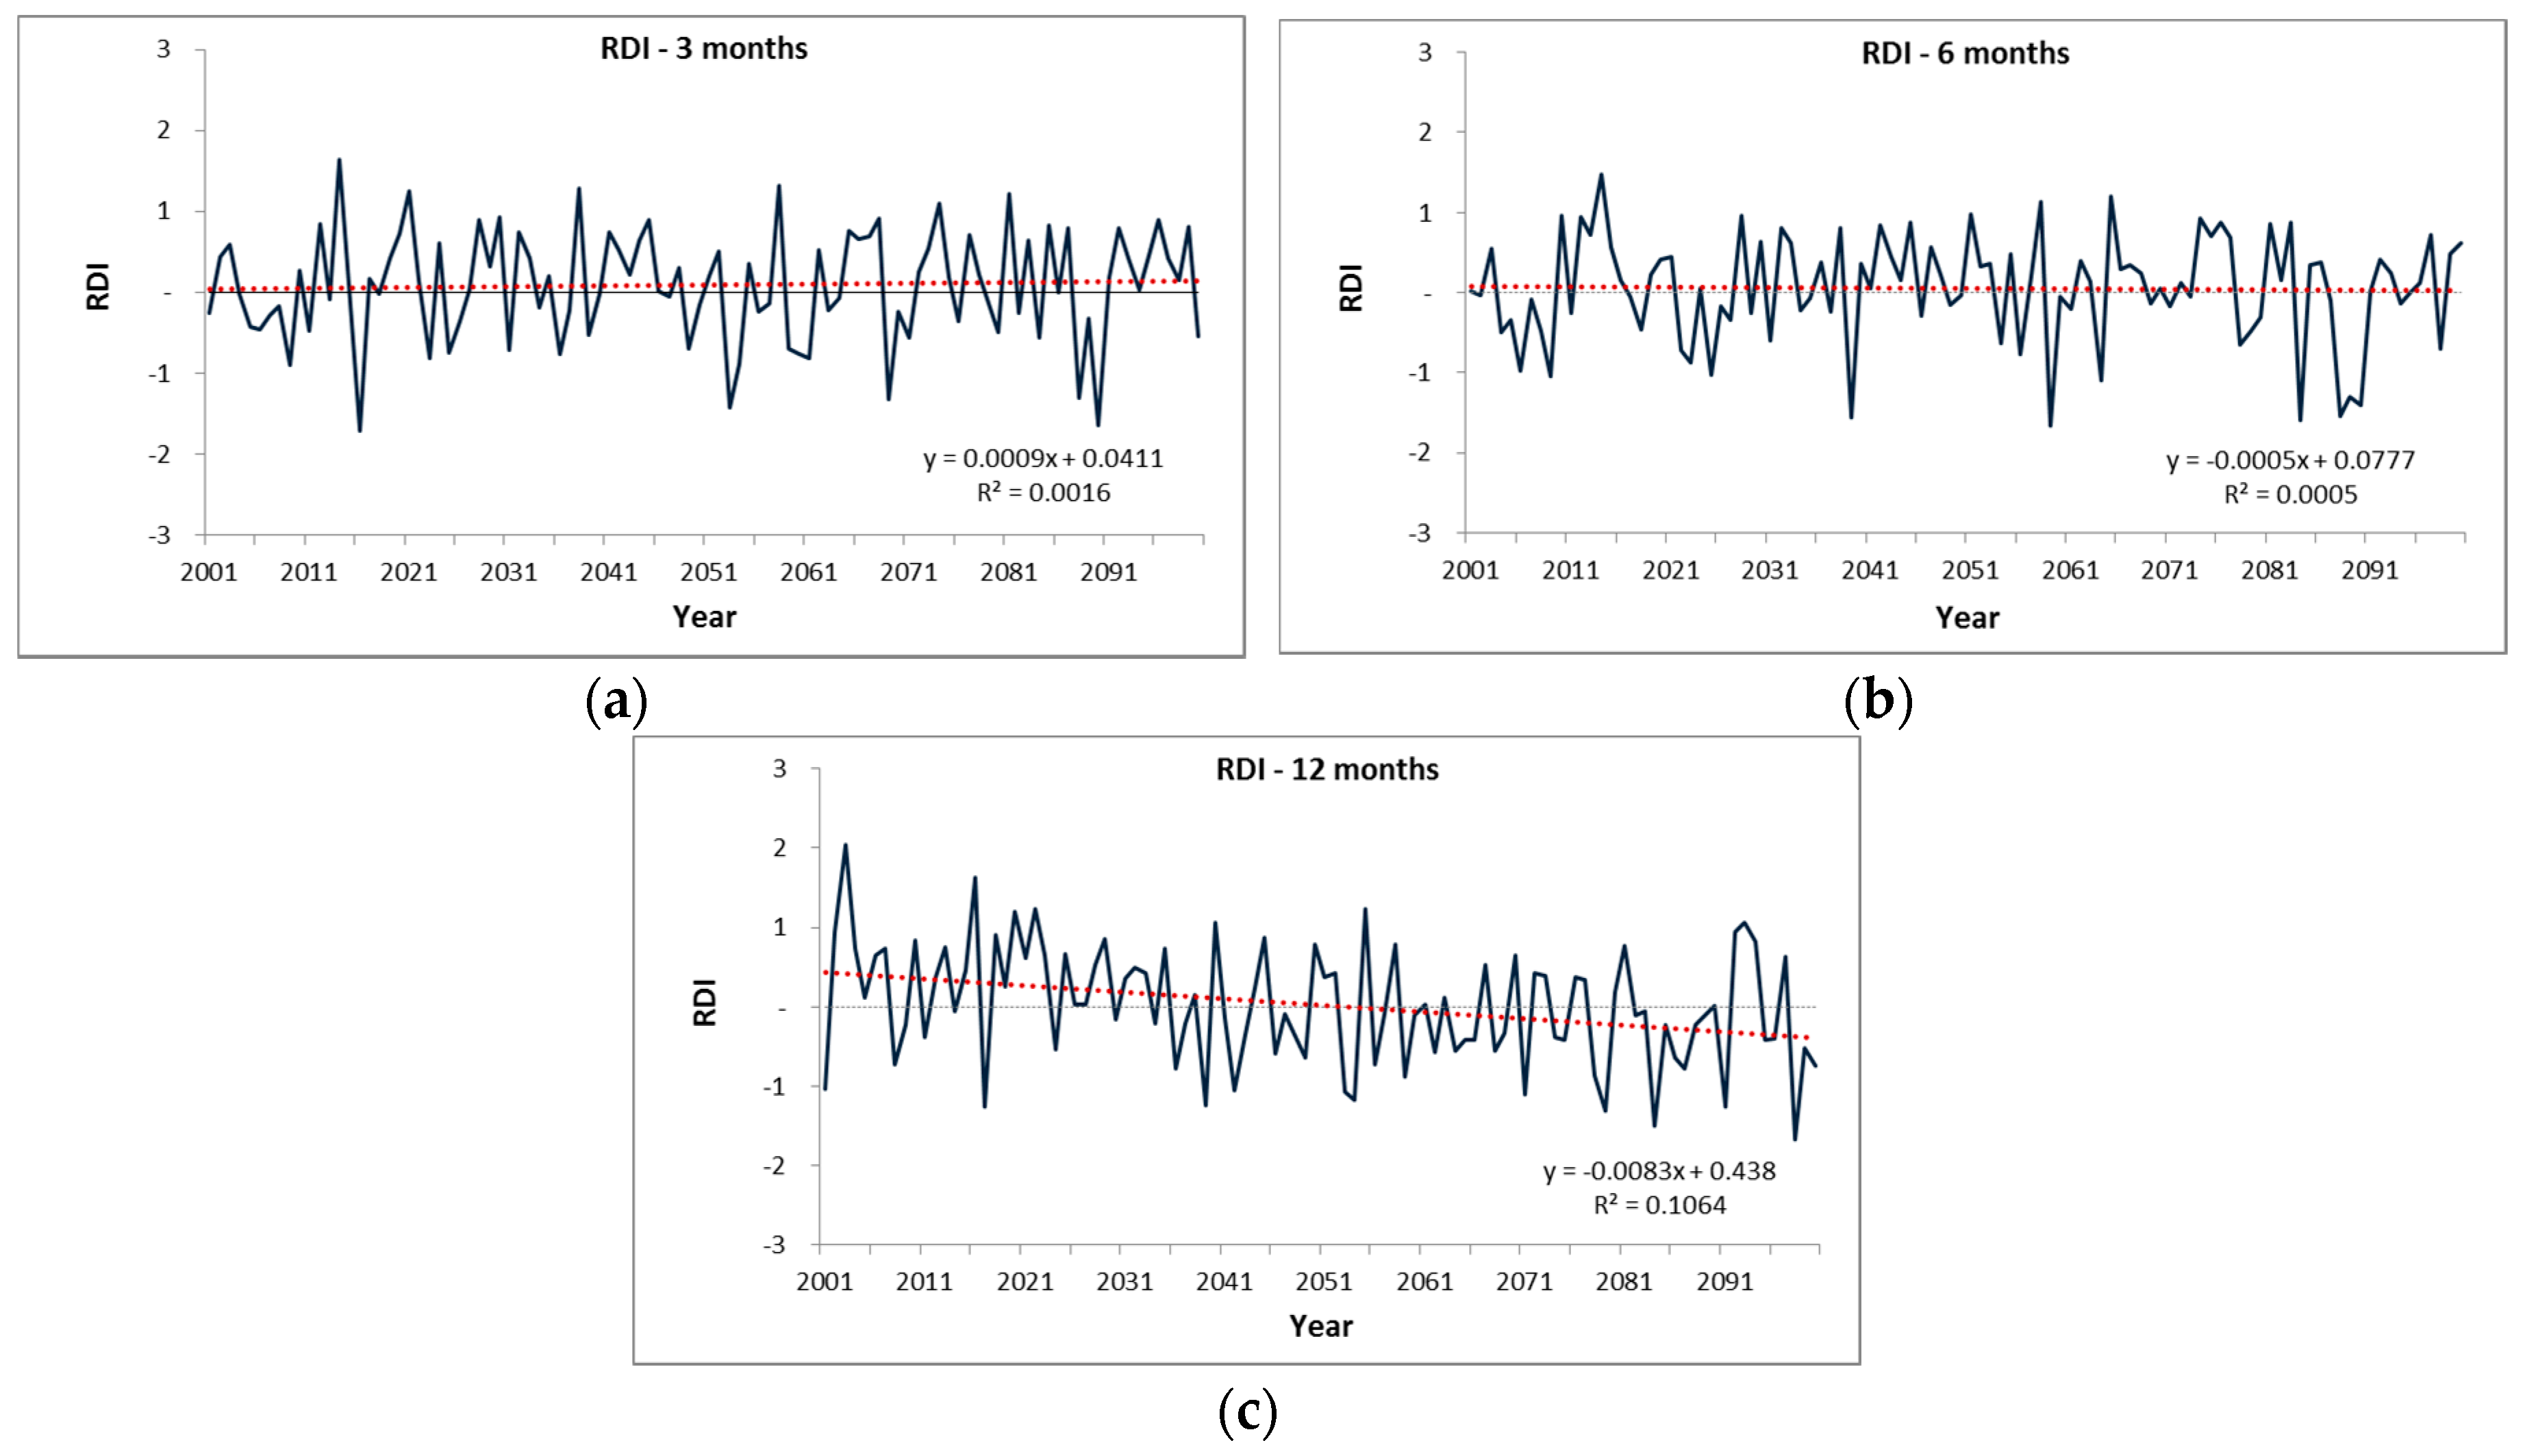
The analysis of drought through the SPI does not take evapotranspiration into account, while the analysis via the RDI does. The result of analyzing the drought index by the RDI can be seen in Figure 5.
According to analysis of the average drought index from the 73 observatories during the periods of three, six and twelve months by the RDI, it was forecast that the drought index of the twelve-month unit would gradually decrease over time. The drought index dropped when the period of analysis increased and the year became closer to 2100, which showed a contradictory result compared to the SPI, which considers only the precipitation and regional location. This also implies that the evapotranspiration caused by the rise of temperature has a great influence on the drought possibility. The results from Figure 4 and Figure 5 were the average result of the whole country, showing the inconsistent tendency of Korea’s droughts. In Section 4.2, the study conducted a drought analysis at each observatory, looking into the details of vulnerable regions.
4.2. Analysis of Drought by SPI and RDI at Each Observatory
In this section, the study shows the result of drought analysis based on the SPI and RDI in 73 observatories in Korea. By calculating the number of extreme dry occurrences between 2011 and 2100, each observatory’s drought impact was evaluated. The period from 2011 to 2100 was divided by 30-year units and changes of index value were used to predict the number of droughts possible. The distribution map of the drought index by period and region is also presented for regional drought analysis.
4.2.1. Occurrence of Extreme Drought at Each Observatory
The number of years from 2011 to 2100 in which extreme droughts would occur, showing drought indices below −2.0, was counted and put into a graph. The effects of drought were assessed through the SPI and RDI by comparing the numbers of extreme droughts measured at all observatories to select the region with the severest damage incurred by drought.
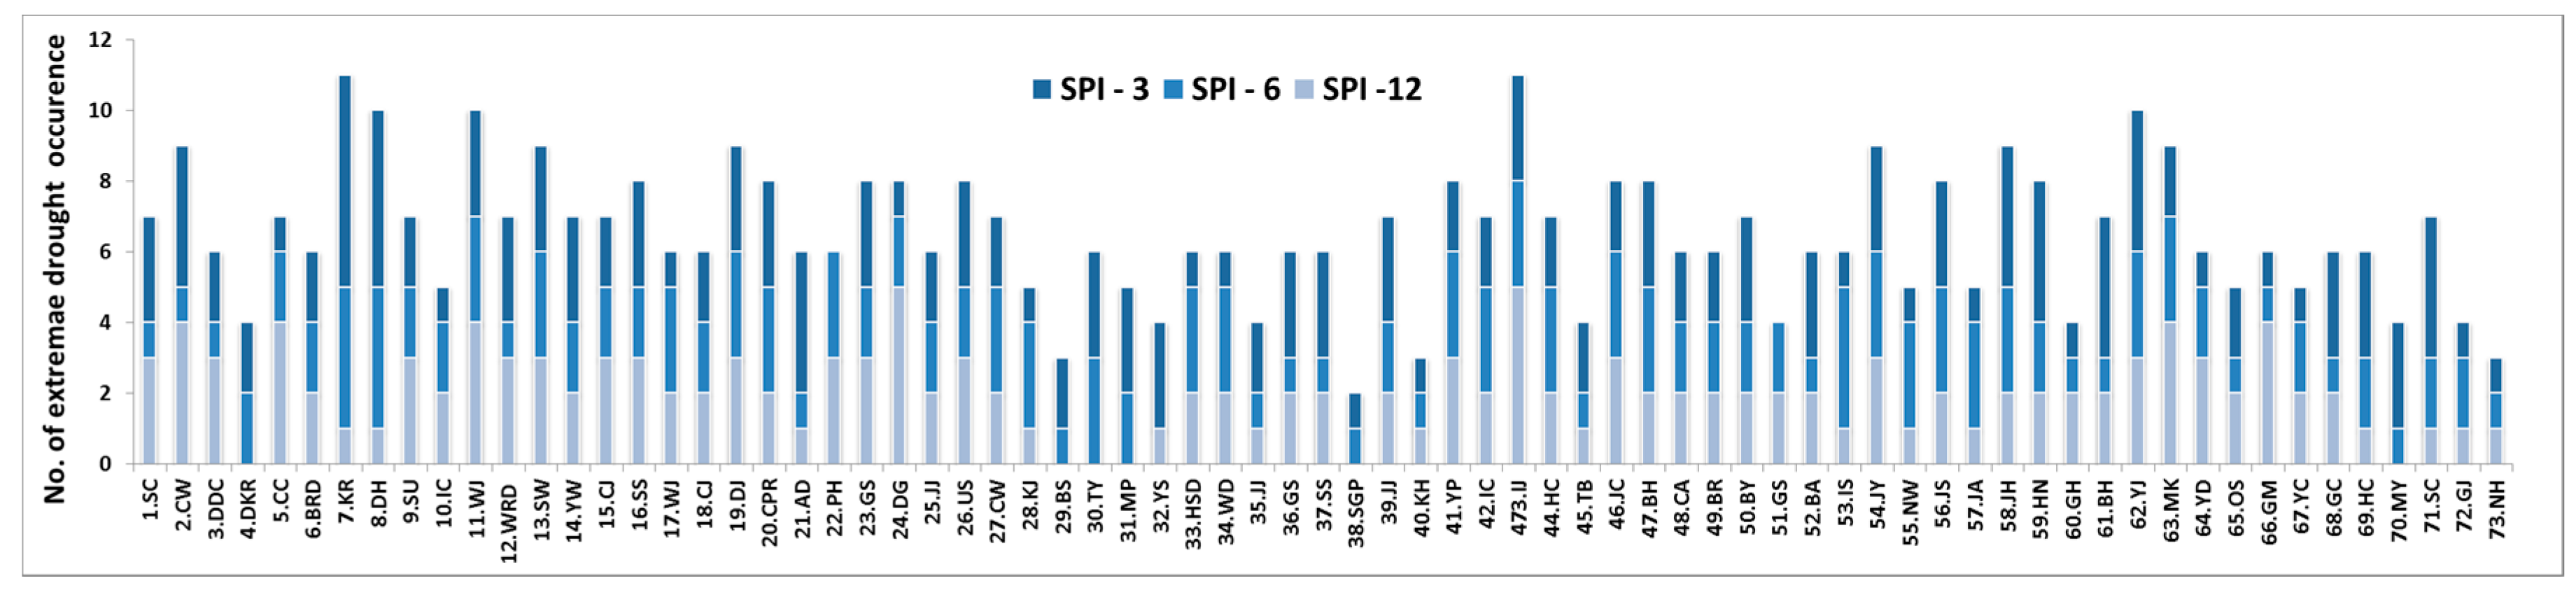
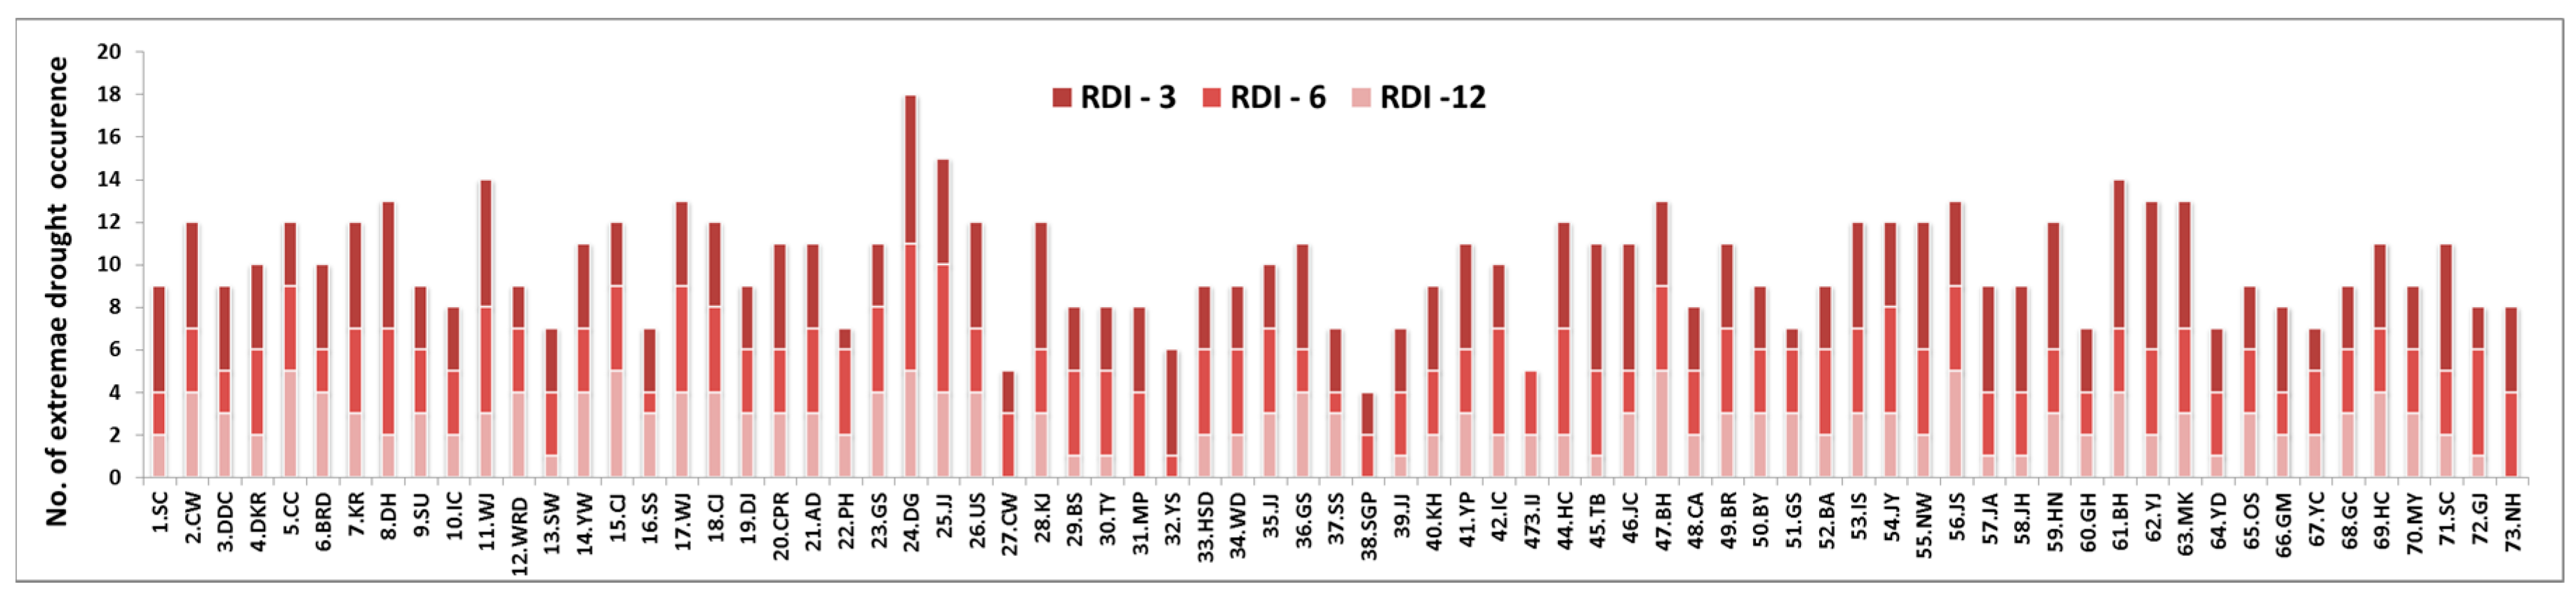
According to the drought analysis result based on the indices from 2011 to 2100, the SPI projected that extreme drought would occur 2.1 times on average during the longest period of twelve months, while the RDI predicted 2.6 times. Furthermore, the SPI projected that extreme drought will occur 4.0 times during the periods of three, six and twelve months, while the RDI predicted 6.5 times. Taking the temperature into account, the RDI showed a higher number, in terms of the occurrence of extreme droughts, relative to that of the SPI.
Figure 6 shows the number of extreme droughts predicted by the SPI on a basis of three-, six-, twelve-month periods. In Gangwon Province, the SPI predicted that extreme drought would occur more than 10 times in Inje (No. 43), Gangneung (No. 7), Donghae (No. 8) and Wonju (No. 11), causing severe drought damage to the regions. The long-term forecast (12-month period unit) showed that extreme drought would occur seven times, particularly in Inje (No. 43).
Figure 7 shows the number of extreme droughts predicted by the RDI on a basis of three-, six-, twelve-month periods. During the entire periods of three-, six-, twelve-months, extreme drought would occur 18 times, causing the severest drought damage in Daegu (No. 24) among all regions. The long-term forecast (12-month period unit) showed that the extreme drought would occur five times in Chuncheon (No. 5), Chungju (No. 15), Daegu (No. 24), Boeun (No. 47) and Jangsu (No. 56) regions.
4.2.2. Analysis of Extreme Drought for Each Season
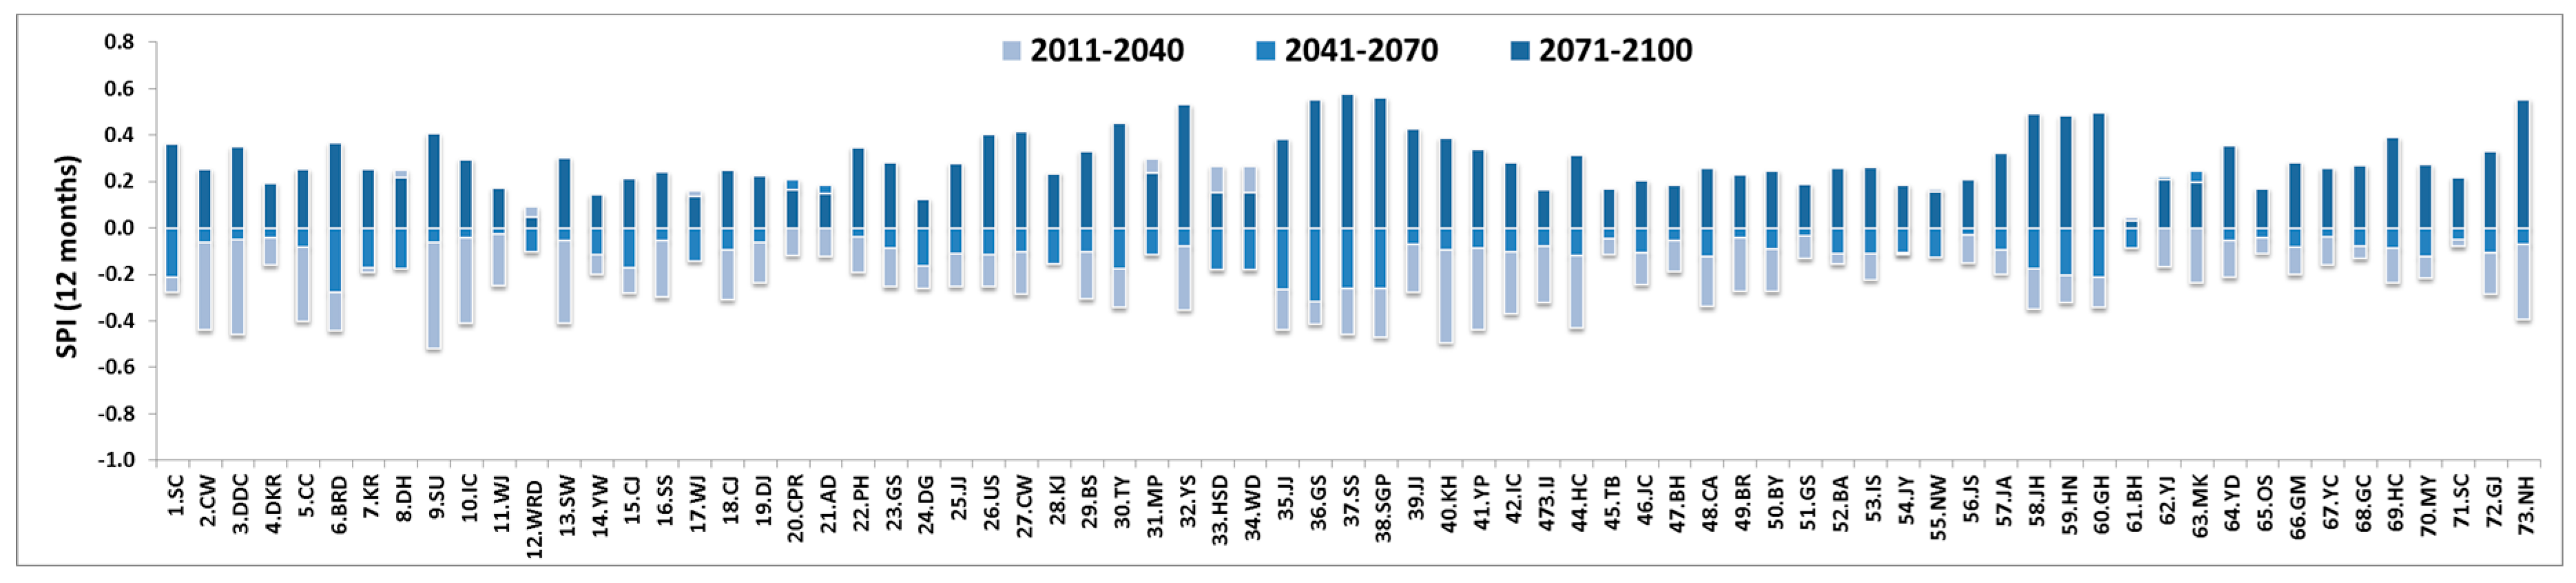
The study used the SPI and RDI to analyze the drought indices at individual observatories by categorizing the time period by 30 years between 2011 and 2100. The accumulation period was set at 12 months to analyze long-term drought. The SPI showed minus values, predicting dry climate between 2011 and 2070, while it showed plus values, predicting wet climate between 2071 and 2100. According to the analysis of the 2011–2040 period, the regions with the largest drought effect would be Seoul (No. 9), Dongducheon (No. 3), Ganghwa (No. 40) and Suwon (No. 13), in order of the size of effect, predicting that the capital area would have the highest probability of drought occurrence.
All observatories predicted wet climate between 2071 and 2100. In Ulleungdo (No. 12) and Bonghwa in Gyeongbuk Province (No. 61), the climate would not change much from 2011 to 2100, as the drought indices were shown to be almost zero for that period. Results of the drought index at each observatory using SPI are shown in Figure 8.
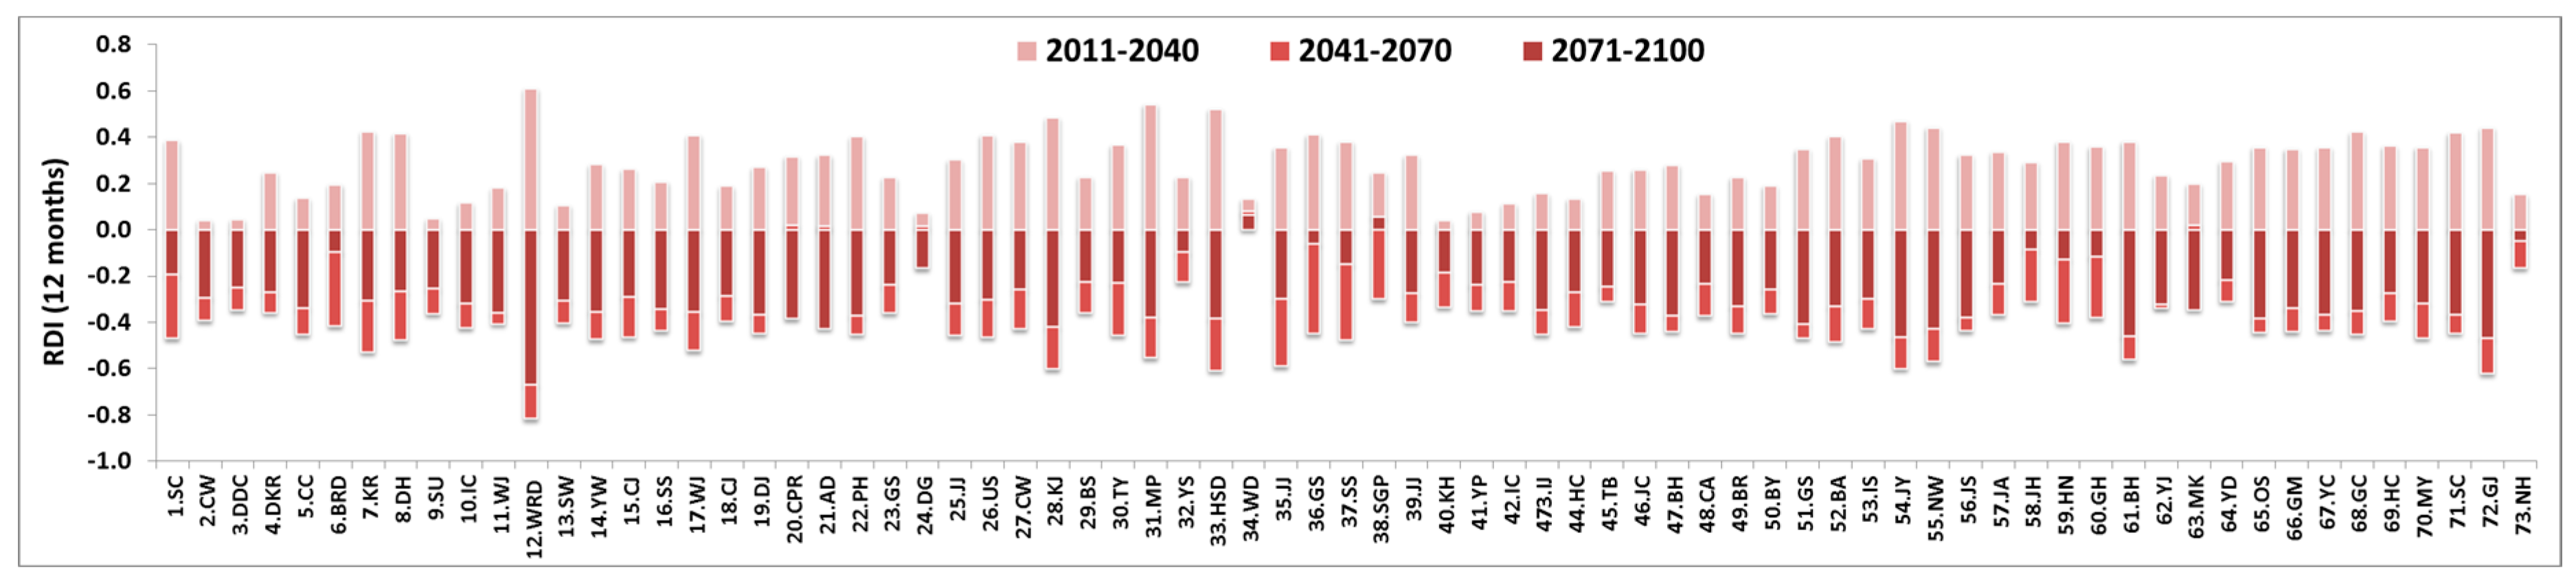
The RDI showed positive values, predicting a wet climate, between 2011 and 2040, while it showed negative values, predicting a dry climate, between 2041 and 2100. The result was different from that of SPI. This was because the RDI considered that the rising temperatures would cause dry climate and increase the number of droughts that occur. According to the analysis of the 2011–2040 period, the majority of observatories predicted a wet climate, while the drought would intensify between 2041 and 2100.
According to the RDI, the regions with the largest drought effect during the 2071–2100 period would be Ulleungdo Island (No. 12), Namhae (No. 72), Jeongeup (No. 54) and Bonghwa (No. 61), in order of the size of effect, which predicts that the coastal area would have the highest probability of drought occurrence, rather than the capital or inland areas. Results of drought index at each observatory using SPI shown in Figure 9.
4.2.3. Distribution Map of Results by SPI & RDI
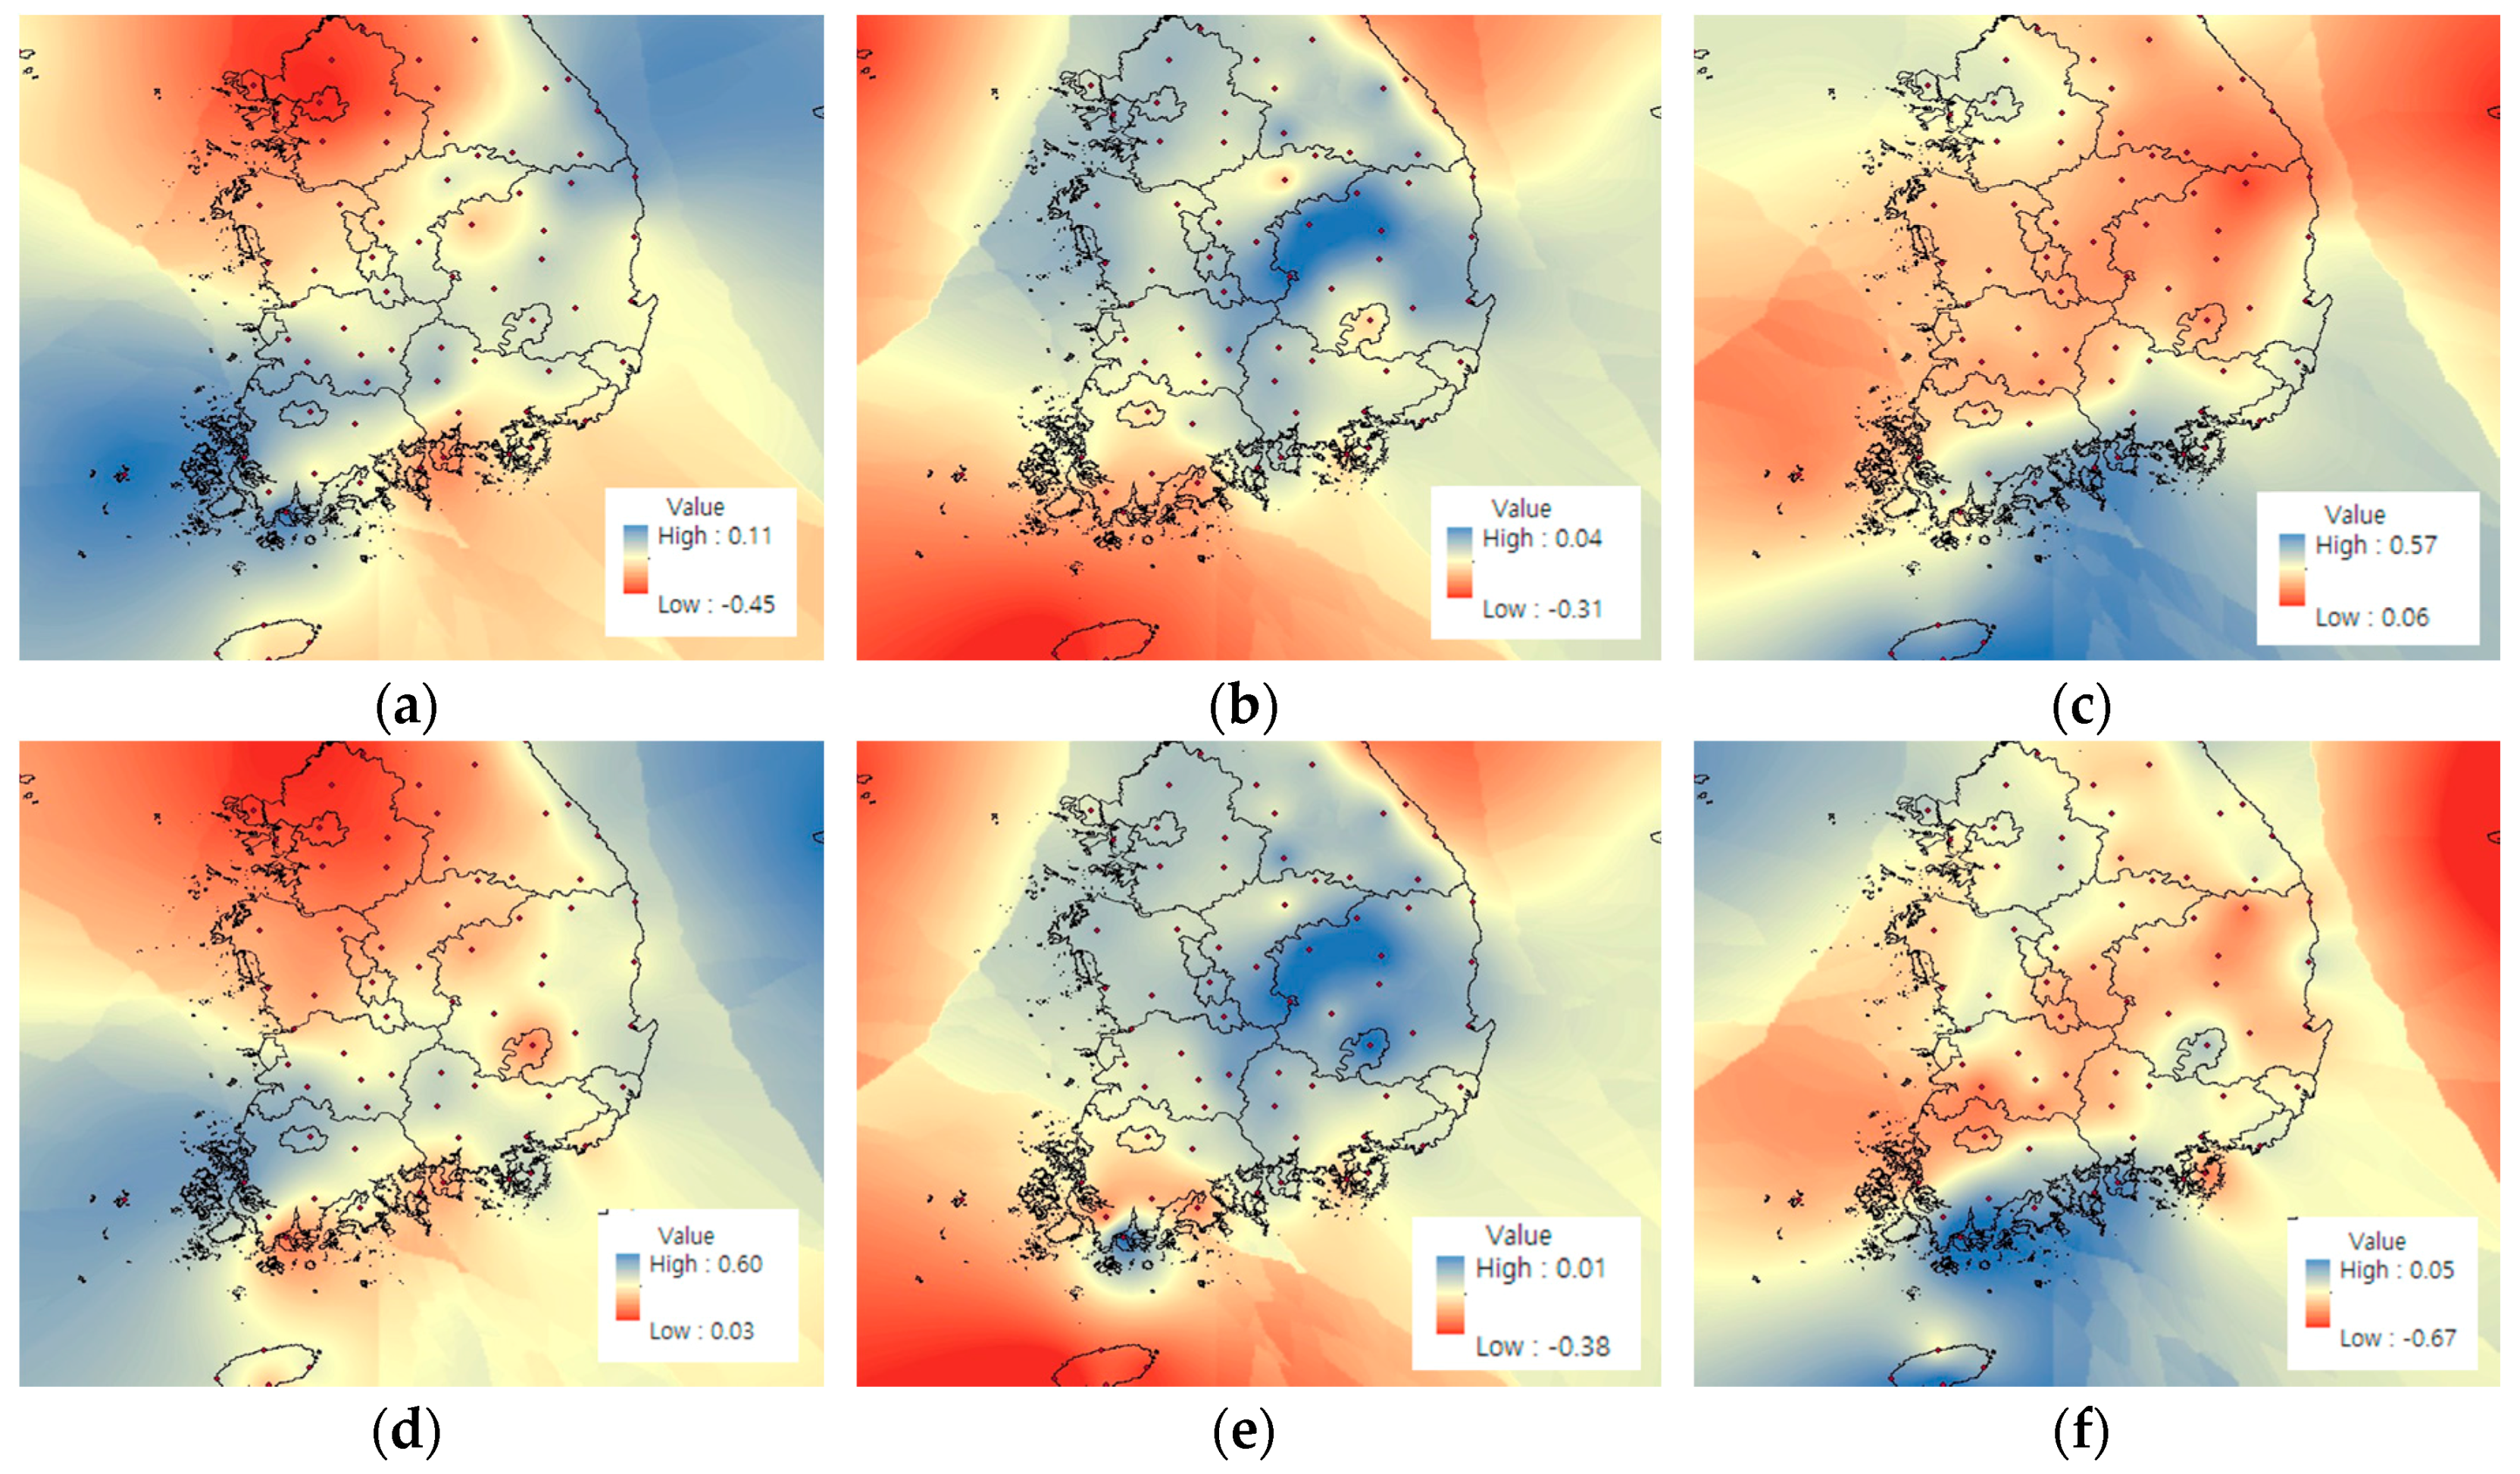
Based on the results of the SPI and RDI at each observatory in Section 4.2.2, a distribution of domestic drought index was made. Figure 10 shows the 30-year drought index distribution, which has the advantage of being able to identify the drought index according to geographical location.
Figure 10a–c shows the SPI index divided into 2011–2040, 2041–2070 and 2071–2100, and Figure 10d–f shows the distributions of the RDI indices divided by the same period.
Between Figure 10a,d, Figure 10b,e, Figure 10c,f, the same tendency of distribution is shown, although the indices are different. In the case of 2011–2040, the SPI was found to be dry in Seoul, Gyeonggi-do and Gangwon province, which are all located in the northern part of South Korea, whereas the RDI is mostly wet in most areas.
Except for certain observations, the trends of SPI and RDI for 2041–2070 were similar, and the range of the drought index was also similar. A dry tendency was observed in northeast and southwest coastal areas. In the case of 2071–2100, the SPI showed a tendency to being wet in all regions with an index value of 0 or more. On the other hand, the RDI tended to be dry in all areas except the south coastal.
In a previous study of drought index estimation taking into account precipitation and evapotranspiration that used previous observation data collated during the past 35 years in Korea, Kim and Lee suggested a drought distribution map for Korea [38].
According to their research, drought frequency in the southern region was high in 1970, while the frequency of drought in Gangwon province in the north-east increased in 2000. They suggested that the frequency of droughts indicates a shift from southwest to northeast. Figure 10a,d shows the similarity of the drought distribution maps of Kim and Lee [38]. However, it is difficult to compare the actual number of drought events in their study, such that further studies are needed to make comparisons between past observation data and future climate change scenario.
5. Conclusions
This study drew the following conclusion from the analysis of meteorological drought based on the RCP 8.5 scenario conducted at nationwide observatories by applying the SPI and RDI.
According to the drought indices estimated at the observatories of Korea from 2011 to 2100, the SPI predicted the trend graph of drought index would be maintained over time. However, the RDI, with evapotranspiration taken into account, predicted the trend graph drought index would gradually decrease over time, meaning it was closer to dry conditions than the wet of the drought index.
The RDI showed the biggest drop at the twelve-month period. The result of comparing the drought indices from 73 observatories revealed that Daegu would be exposed to the risk of drought, as the region would have the highest drought intensity with the most number of extreme dry occurrences.
As a result of comparing the drought index distribution maps, SPI and RDI showed a similar tendency according to area location, but the difference in drought index values due to evapotranspiration increased with the time to 2100. In particular, the average RDI showed less than 0 in 2071–2100, and the probability of extreme drought after 2070 increased. It is predicted that the probability of drought will increase after 2070.
It is considered that the drought intensity will be extreme due to the rise of temperature and the probability that extreme intensity will occur is high according to the analysis of RDI based on the RCP 8.5 scenario. Furthermore, the amount of evapotranspiration is deemed essential for studying the meteorological drought to obtain the diversity of drought prediction.
The RCP 8.5 scenario is an extreme condition in which greenhouse gas mitigation policies are not implemented and greenhouse gases are emitted according to current trends. There is a limitation in that the evapotranspiration can be overestimated under conditions of high temperature increase effect compared to other RCP scenarios. Therefore, a drought index using RDI needs to be analyzed in consideration of this uncertainty.
Conflicts of Interest
The author declares no conflict of interest.
References
- Tigkas, D. Drought Characterisation and Monitoring in Regions of Greece. Eur. Water 2008, 23, 29–39. [Google Scholar]
- Rossi, G.; Benedini, M.; Tsakiris, G.; Giakoumakis, S. On Regional Drought Estimation and Analysis. Water Resour. Manag. 1992, 6, 249–277. [Google Scholar] [CrossRef]
- Hubbard, K. Monitoring Regional Drought Condition. In Drought Assessment, Management and Planning: Theory and Case Studies; Wilhite, D., Ed.; Kluwer Academic Publishers: Dordrecht, The Netherlands, 1993; pp. 17–30. [Google Scholar]
- Bonaccorso, B.; Bordi, I.; Cancelliere, A.; Rossi, G.; Sutera, A. Spatial Variability of Drought: An Analysis of the SPI in Sicily. Water Resour. Manag. 2003, 17, 273–396. [Google Scholar] [CrossRef]
- Cho, C.H. A Comparative Analysis of Drought Index on Major Station in Korea Using RDI. Master’s Thesis, Yonsei University, Seoul, Korea, 2008. [Google Scholar]
- Dracup, J.A.; Lee, K.S.; Paulson, E.G. On the Definition of Droughts. Water Resour. Res. 1980, 16, 297–302. [Google Scholar] [CrossRef]
- Wilhite, D.A.; Glantz, M.H. Understanding the Drought Phenomenon: The Role of Definition. Water Int. 1985, 10, 111–120. [Google Scholar] [CrossRef]
- Kim, S.M.; Park, S.W. Calculation and Comparison of Drought Indices on Major Weather Stations in Korea. J. Korean Soc. Agric. Eng. 1999, 41, 43–52. (In Korean) [Google Scholar]
- Nam, J.E.; Lee, Y.H.; Jung, K.Y. Analysis of Evapotranspiration Effect on Drought by Comparison of SPI and SPEI Drought Indices. In Proceedings of the Autumn Meeting of KMS, Daegu, Korea, 1–2 November 2012; pp. 390–391. (In Korean). [Google Scholar]
- A Kim, B.S.; Sung, J.H.; Kang, H.S.; Cho, C.H. Assessment of Drought Severity over South Korea using Standardized Precipitation Evapotranspiration Index (SPEI). J. Korea Water Resour. Assoc. 2012, 45, 887–900. (In Korean) [Google Scholar] [CrossRef]
- Mckee, T.B.; Doesken, N.J.; Kleist, J. The Relationship of Drought Frequency and Duration to Time Scales, Preprints. In Proceedings of the 8th Conference on Applied Climatology, Anaheim, CA, USA, 17–22 January 1993; pp. 179–184. [Google Scholar]
- Jang, Y.K.; Kim, S.D.; Choi, G.W. A Study of Drought Spatio-temporal Characteristics Using SPI-EOF Analysis. J. Korea Water Resour. Assoc. 2006, 39, 691–702. (In Korean) [Google Scholar]
- Yoon, Y.N.; Ahn, J.H.; Lee, D.R. An Analysis of Drought Using the Palmer’s Method. J. Korea Water Resour. Assoc. 1997, 30, 317–326. (In Korean) [Google Scholar]
- Ryu, J.H.; Lee, D.R.; Yoon, Y.N.; Ahn, J.H. A Comparative Study on the Drought Indices for Drought Evaluation. J. Korea Water Resour. Assoc. 2002, 35, 397–410. (In Korean) [Google Scholar] [CrossRef]
- Dubrovsky, M.; Svoboda, M.D.; Trnka, M.; Hayes, M.J.; Wilhite, D.A.; Zalud, Z.; Hlavinka, P. Application of Relative Drought Indices in Assessing Climate Change Impacts on Drought Conditions in Czechia. Theor. Appl. Climatol. 2008, 96, 155–171. [Google Scholar] [CrossRef]
- Vincente, S.M.; Begueria, S.; Lopez-Moreno, J.I. A Multiscalar Drought Index Sensitive to Global Warming: The Standardized Precipitation Evapotranspiration Index. J. Clim. 2010, 23, 1696–1718. [Google Scholar] [Green Version]
- Kim, B.S.; Sung, J.H.; Lee, B.H.; Kim, D.J. Evaluation on the Impact of Extreme Droughts in South Korea using the SPEI and RCP8.5 Climate Change Scenario. J. Korean Soc. Hazard Mitig. 2013, 13, 97–109. (In Korean) [Google Scholar] [CrossRef]
- Abramopoulos, F.; Rosenzweig, C.; Choudhury, B. Improved Ground Hydrology Calculations for Global Climate Models (GCMs): Soil Water Movement and Evapotranspiration. J. Clim. 1988, 1, 921–941. [Google Scholar] [CrossRef]
- Hu, Q.; Willson, G.D. Effect of Temperature Anomalies on the Palmer Drought Severity Index in the Central United States. Int. J. Climatol. 2000, 20, 1899–1911. [Google Scholar] [CrossRef]
- Mavromatis, T. Drought Index Evaluation for Assessing Future Wheat Production in Greece. Int. J. Climatol. 2007, 27, 911–924. [Google Scholar] [CrossRef]
- Kempes, C.P.; Myers, O.B.; Breshears, D.D.; Ebersole, J.J. Comparing Response of Pinus Edulis Treering Growth to Five Alternate Moisture Indices Using Historic Meteorological Data. J. Arid Environ. 2008, 72, 350–357. [Google Scholar] [CrossRef]
- IPCC. Climate Change 2007: The Physical Science Basis, Contribution of Working Group I to the Fourth Assessment. In Report of the Inter-governmental Panel on Climate Change; Solomon, S., Qin, D., Manning, M., Chen, Z., Marquis, M., Averyt, K.B., Tignor, M., Miller, H.L., Eds.; Cambridge University Press: Cambridge, UK; New York, NY, USA, 2007. [Google Scholar]
- Moss, R.H.; Edmonds, J.A.; Hibbard, K.A.; Manning, M.R.; Rose, S.K.; Van Vuuren, D.P.; Carter, T.R.; Emori, S.; Kainuma, M.; Kram, T.; et al. The next generation of scenarios for climate change research and assessment. Nature 2010, 463, 747–756. [Google Scholar] [CrossRef] [PubMed]
- Van Vuuren, D.P.; Edmonds, J.; Kainuma, M.; Riahi, K.; Thomson, A.; Hibbard, K.; Hurtt, G.C.; Kram, T.; Krey, V.; Lamarque, J.F.; et al. Representative concentration pathways: An overview. Clim. Chang. 2011, 109, 5–31. [Google Scholar] [CrossRef]
- Fischer, G.; Tubiello, F.N.; Velthuizen, H.; Wiberg, D.A. Climate Change Impacts on Irrigation Water Requirements: Effects of Mitigation. Technol. Forecast. Soc. Chang. 2007, 74, 1083–1107. [Google Scholar] [CrossRef]
- IPCC. Towards New Scenarios for Analysis of Emissions, Climate Change, Impacts, and Response Strategies. In Proceedings of the IPCC Expert Meeting Report on New Scenarios, Intergovernmental Panel on Climate Change, Noordwijkerhout, The Netherlands, 19–21 September 2007. [Google Scholar]
- Riahi, K.; Rao, S.; Krey, V.; Cho, C.; Chirkov, V.; Fisher, G.; Kindermann, G.; Nakicenovic, N.; Rafaj, P. RCP 8.5—A Scenario of Comparatively High Greenhouse Gas Emissions. Clim. Chang. 2011, 109, 33–57. [Google Scholar] [CrossRef]
- Tsakiris, G.; Vangelis, H. Establishing a Drought Index Incorporating Evapotranspiration. Eur. Water 2005, 9, 3–11. [Google Scholar]
- Tsakiris, G.; Pangalou, D.; Vangelis, H. Regional Drought Assessment Based on the Reconnaissance Drought Index (RDI). Water Resour. Manag. 2007, 21, 821–833. [Google Scholar] [CrossRef]
- Khalili, D.; Farnoud, T.; Jamshidi, H.; Kamgar-Haghighi, A.A.; Zand-Parsa, S. Comparability Analyses of the SPI and RDI Meteorological Drought Indices in Different Climatic Zones. Water Resour. Manag. 2011, 25, 1737–1757. [Google Scholar] [CrossRef]
- Zarch, M.A.A.; Sivakumar, B.; Sharma, A. Droughts in a Warming Climate: A Global Assessment of Standardized Precipitation Index (SPI) and Reconnaissance Drought Index (RDI). J. Hydrol. 2015, 526, 183–195. [Google Scholar] [CrossRef]
- Xu, C.Y.; Singh, V.P. Evaluation of Three Complementary Relationship Evapotranspiration Models by Water Balance Approach to Estimate Actual Regional Evapotranspiration in Different Climatic Regions. J. Hydrol. 2005, 308, 105–121. [Google Scholar] [CrossRef]
- Droogers, P.; Allen, R.G. Estimating Reference Evapotranspiration under Inaccurate Data Conditions. Irrig. Drain. Syst. 2002, 16, 33–45. [Google Scholar] [CrossRef]
- Yin, Y.; Wu, S.; Zheng, D.; Yang, Q. Radiation Calibration of FAO56 Penman Monteith Model to Estimate Reference Crop Evapotranspiration in China. Agric. Water Manag. 2008, 95, 77–84. [Google Scholar] [CrossRef]
- Allen, R.G.; Pereira, L.S.; Raes, D.; Smith, M. Crop Evapotranspiration; FAO Irrigation and Drainage Paper, 56; Food and Agriculture Organization: Rome, Italiy, 1998. [Google Scholar]
- Maurer, E.P. Uncertainty in Hydrologic Impacts of Climate Change in the Sierra Nevada, California, Under Two Emissions Scenarios. Clim. Chang. 2007, 82, 309–325. [Google Scholar] [CrossRef]
- Park, B.S.; Lee, J.H.; Kim, C.J.; Jang, H.W. Projection of Future Drought of Korea Based on Probabilistic Approach Using Multi-model and Multi Climate Change Scenarios. J. Korean Soc. Civ. Eng. 2013, 33, 1871–1885. (In Korean) [Google Scholar] [CrossRef]
- Kim, G.S.; Lee, J.W. Evaluation of Drought Indices Using the Drought Records. J. Korea Water Resour. Assoc. 2011, 44, 639–652. (In Korean) [Google Scholar] [CrossRef]
Figure 1.
Main observatories in the Republic of Korea (73 sites).

Figure 2.
Annual precipitation & temperature by RCP 8.5 scenario: (a) Seoul; (b) Daegu; (c) Jeju.


Figure 3.
Result of evapotranspiration calculated with the RCP 8.5 scenario.

Figure 4.
SPI estimation results for three selected periods in Korea: (a) Period of 3 months; (b) Period of 6 months; (c) Period of 12 months.
Figure 4.
SPI estimation results for three selected periods in Korea: (a) Period of 3 months; (b) Period of 6 months; (c) Period of 12 months.

Figure 5.
RDI estimation results for three selected periods in Korea: (a) Period of 3 months; (b) Period of 6 months; (c) Period of 12 months.
Figure 5.
RDI estimation results for three selected periods in Korea: (a) Period of 3 months; (b) Period of 6 months; (c) Period of 12 months.

Figure 6.
Number of occurrence of extreme drought in each observatory (SPI).

Figure 7.
Number of occurrences of extreme drought in each observatory (RDI).

Figure 8.
Results of drought index at each observatory using SPI.

Figure 9.
Results of drought index at each observatory using RDI.

Figure 10.
Distribution map of SPI and RDI from 2011 to 2100: (a) SPI from 2011 to 2040; (b) SPI from 2041 to 2070; (c) SPI from 2071 to 2100; (d) RDI from 2011 to 2040; (e) RDI from 2041 to 2070; (f) RDI from 2071 to 2100.
Figure 10.
Distribution map of SPI and RDI from 2011 to 2100: (a) SPI from 2011 to 2040; (b) SPI from 2041 to 2070; (c) SPI from 2071 to 2100; (d) RDI from 2011 to 2040; (e) RDI from 2041 to 2070; (f) RDI from 2071 to 2100.


Table 1.
Classification of drought index from SPI and RDI.
| SPI and RDI Values | Classification |
|---|---|
| 2.0+ | Extremely Wet |
| 1.5 to 1.99 | Very Wet |
| 1.0 to 1.49 | Moderately Wet |
| −0.99 to 0.99 | Near Normal |
| −1.0 to −1.49 | Moderately Dry |
| −1.5 to −1.99 | Severely Dry |
| −2 and less | Extremely Dry |
© 2018 by the author. Licensee MDPI, Basel, Switzerland. This article is an open access article distributed under the terms and conditions of the Creative Commons Attribution (CC BY) license (http://creativecommons.org/licenses/by/4.0/).
Share and Cite
MDPI and ACS Style
Jang, D. Assessment of Meteorological Drought Indices in Korea Using RCP 8.5 Scenario. Water 2018, 10, 283. https://doi.org/10.3390/w10030283
AMA Style
Jang D. Assessment of Meteorological Drought Indices in Korea Using RCP 8.5 Scenario. Water. 2018; 10(3):283. https://doi.org/10.3390/w10030283
Chicago/Turabian StyleJang, Dongwoo. 2018. "Assessment of Meteorological Drought Indices in Korea Using RCP 8.5 Scenario" Water 10, no. 3: 283. https://doi.org/10.3390/w10030283
Note that from the first issue of 2016, this journal uses article numbers instead of page numbers. See further details here.